Embed Size (px)
Citation preview

Eiropas Savienības fondu darbības programmas „Izaugsme un nodarbinātība” 9.2.3.specifiskā
atbalsta mērķa „Atbalstīt prioritāro (sirds un asinsvadu, onkoloģijas, perinatālā un neonatālā
perioda un garīgās veselības) veselības jomu veselības tīklu attīstības vadlīniju un kvalitātes
nodrošināšanas sistēmas izstrādi un ieviešanu, jo īpaši sociālās atstumtības un nabadzības
riskam pakļauto iedzīvotāju veselības uzlabošanai” ietvaros īstenotā projekta
Nr.9.2.3.0/15/I/001 „Veselības tīklu attīstības vadlīniju un kvalitātes nodrošināšanas sistēmas
izstrāde un ieviešana prioritāro jomu ietvaros” 8.nodevums – An operational manual that
provides guidance for monitoring system bottlenecks

World Bank Reimbursable Advisory Services:
Support to Develop a Health System Strategy for Priority Disease Areas in Latvia
Bottleneck Analysis
OPERATIONAL MANUAL
This document describes the data and methods used in the Bottleneck Analysis study of the World Bank
and explains how all submitted materials can be used to replicate the results in the future or recalculate
indicators with different assumptions. The study used tracer conditions within each priority disease area
to illuminate performance issues in the health system that may impede patients’ timely access to services
and depress quality of care. The analysis required identifying all patients with these tracer conditions and
determining the receipt and timing of certain services corresponding to screening, diagnosis, treatment,
and disease management or follow-up care.
Source data
The study used administrative data provided by the National Health Service (NHS), the Center for Disease
Prevention and Control (CDPC), and the State Emergency Medical Services (SEMS) to assess performance
related to the steps of a patient pathway - screening, diagnosis, treatment, and management and follow-
up care - for select tracer conditions. Appendix 1 lists all data sets shared with the World Bank that were
used in the Bottleneck Analysis. These data sets were shared in Excel format. All personal IDs had been
anonymized following a protocol outlined in a legal agreement among NHS, CDPC, and SEMS. The World
Bank stored and analyzed the anonymized data on two secure servers. For the analysis, all data were
imported, cleaned, merged when necessary, and analyzed using Stata/MP 14.2 software.
Replication files
All Stata commands used in the Bottleneck Analysis appear in an accompanying set of annotated do-files,
which can be opened in any text editor (Bottleneck_DoFiles.zip). The Stata code for importing, cleaning,
merging, and analysis has been written so that all analyses can be fully replicated on any computer that
has Stata software and all of the raw data furnished by the NHS, CDPC, and SEMS. Not only does this set
up for replication offer a high degree of transparency, but it will also allow others to easily modify
assumptions made in the analysis and recalculate any figure fairly quickly.
Two files in particular (00-master_path.do and 01-master_run.do) can be used to replicate every indicator,
starting from the raw data, as they execute all data cleaning tasks, all database and variable construction,
and every calculation in the correct sequence. Each indicator typically has its own corresponding do-file,
and each of these do-files can also be re-run individually to recalculate individual results.1 For example, if
an analyst wishes to use an augmented set of procedure (or “manipulation”) codes for an indicator, these
codes can be changed in the individual do-file, the file can be re-run, and Stata will automatically
generated an updated excel file that stores the results. Similarly, if an analyst wants to use data from a
different year and the raw data in Excel maintains the same structure as the data sets shared with the
World Bank, (s)he would have to change some code in the do-files that import and construct analytical
data sets and then re-run all of the individual do-files on the new data (that is, files in the 1-import-data,
2-clean-source-data, and 3-construct-databases folders in Bottleneck_DoFiles.zip.
1 Sometimes indicators were grouped into a single do-file if the steps required for their calculation were similar.
The do-files are annotated, describing each step of an indicator’s calculation. Thus, an analyst familiar
with working with datasets and databases with another statistical software package should be able follow
the steps and replicate them in the appropriate sequence using his/her software of choice.
In the event that an analyst wishes to start the analysis from scratch, Appendix 2 describes the calculation
of each indicator in words.
Identifying patients with tracer conditions
To construct lists of patients exhibiting a certain tracer condition – for example, all hypertension patients
for a given year – the World Bank searched all possible databases – namely, the inpatient and outpatient
records, the SEMS data sets, the disease-specific registries, and the death registry since it is possible for
patients to be diagnosed outside of inpatient or outpatient settings. Patients who had made little contact
with health services or remained undiagnosed despite seeking medical attention could be diagnosed with
a certain condition for the first time only at death or during an encounter for emergency services. A patient
was considered to have a disease in a given year if (s)he appeared in any database that year with the ICD-
10 code (or equivalent SEMS code) corresponding to that disease.
The NHS cautioned that this strategy for identifying diagnosed patients could yield a number of false
positives as physicians could record ICD-10 codes associated with a confirmed diagnosis for suspected
cases rather using the separate code that exists for suspected cases.2 Indeed this is the rationale behind
the NHS strategy for identifying hypertension patients, for example, of searching for at least two
outpatient instances or one inpatient record corresponding to the hypertension diagnosis code. As the
number of cases where a patient appears only once with a diagnosis in a single year is small and as
physicians in Latvia do appear to use ICD-10 codes corresponding to suspected cases, the subsequent
analysis does not impose the NHS restriction of having at least two outpatient instances or one inpatient
record for each tracer.3 For cancer cases, however, some indicators only include patients that appear in
the Cancer Registry. Appendix 4 lists the ICD-10 codes used for each tracer.4
In any case, these assumptions on identifying patients can be changed in the files in the 3-construct-
databases folder of Bottleneck_DoFiles.zip.
Determining receipt and dates of services
These lists of patients diagnosed with the tracer conditions were then merged with the inpatient and
outpatient patient records, including “manipulations” (the term for billable expenses, which can include
examinations, diagnostics, treatments, and procedures), and with a data set of physicians with their
corresponding specialties. This permitted an assessment of the extent to which patients with certain
2 For example, they could use the code C50 meant for confirmed malignancies of the breast even though prior to confirmation, they could use D49.3, N63, D48.6, or Z12.3. 3 For example, only 4 percent of patients diagnosed with diabetes had only one outpatient record in 2014, only 7 percent of those diagnosed with hypertension, and less than 4 percent for cancers. For depression and substance abuse and depression, these fractions rise to 13 and 22 percent, respectively. 4 It is important to note that errors of commission (in which ICD-10 codes currently not in use in Latvia were used in the analysis) will not change any of the results. The algorithm would search for patients with these codes in the databases supplied by the NHS, CDPC, and SEMS and simply not find any.
diagnoses received certain manipulations, the timing of these services, and the identity of the physician
providing them. These calculations appear in the 4-construct-variables variables folder of
Bottleneck_DoFiles.zip.5 Appendix 3 presents the codes used to identify specialists in a particular domain
(for example, mental health specialist). Appendix 4 also lists the manipulation codes corresponding to
each examination, diagnostic, treatment, and procedure used in the analysis.6 Appendix 5 describes
overall dataset construction.
The NHS has cautioned that services may be recorded with some delay, but the dates in the payment data
may be the most accurate representation of the timing of visits and services, as the CDPC has cautioned
that the dates in the registries may be recorded with even greater delay. To deal with this uncertainty,
many indicators use multiple time spans (for example, 30, 60, and 90 days) to characterize the timing of
services.
Results
All indicators calculated for the study appear in two accompanying documents:
(i) Bottleneck Analysis – a report that presents and discusses select indicators for each step of
the patient pathway and suggests policy remedies for each identified bottleneck, or place
where patients appear to get stuck as they move through the health system.
(ii) Patient Bottleneck Study – a deck of PowerPoint slides that presents all indicators calculated
by the World Bank. It is also possible to automatically update the charts in this presentation
by linking the corresponding cells to Stata output files. Then when the Stata output files get
updated when do-files are re-run, the charts will automatically get updated.
5 The World Bank team ended up not using the 5-analyze-variables folder for the main analysis. 6 It is important to note here as well that errors of commission (using too many manipulation codes to identify a procedure, examination, or laboratory test) will either have no effect (when no patients have received the erroneous manipulations) or will inflate the corresponding indicator, making the situation appear better than it really is (when the erroneous manipulations are frequently received).
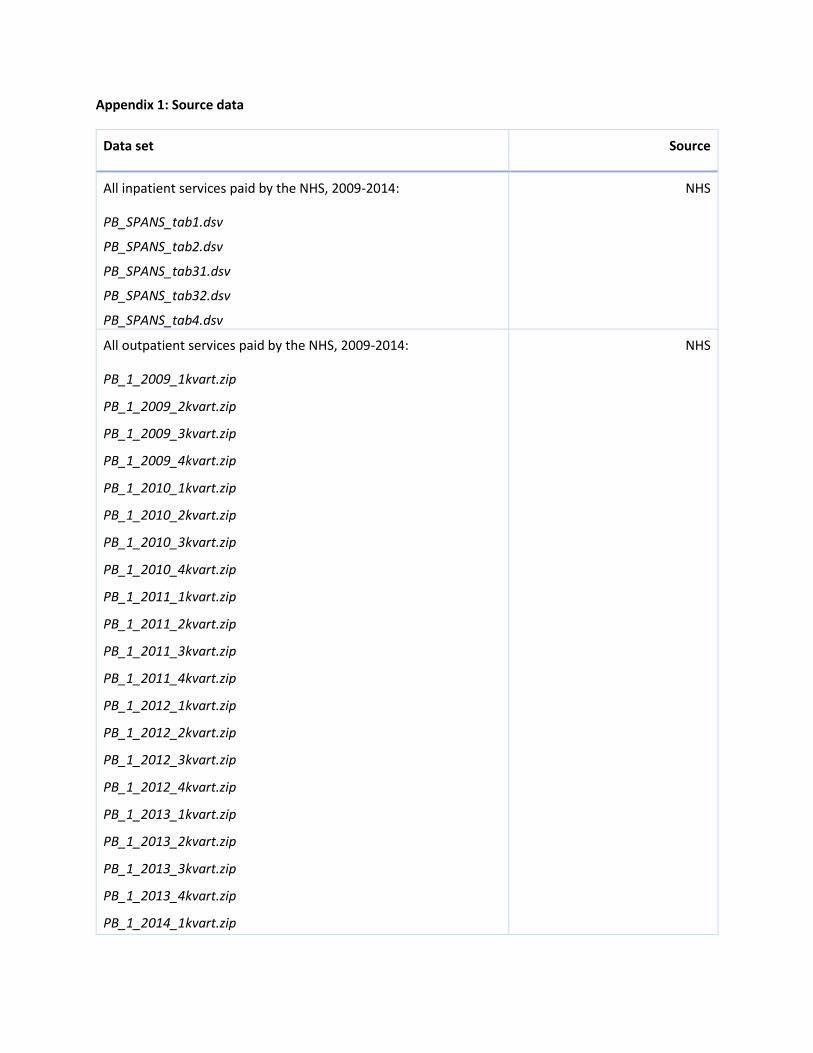
Appendix 1: Source data
Data set Source
All inpatient services paid by the NHS, 2009-2014:
PB_SPANS_tab1.dsv
PB_SPANS_tab2.dsv
PB_SPANS_tab31.dsv
PB_SPANS_tab32.dsv
PB_SPANS_tab4.dsv
NHS
All outpatient services paid by the NHS, 2009-2014:
PB_1_2009_1kvart.zip
PB_1_2009_2kvart.zip
PB_1_2009_3kvart.zip
PB_1_2009_4kvart.zip
PB_1_2010_1kvart.zip
PB_1_2010_2kvart.zip
PB_1_2010_3kvart.zip
PB_1_2010_4kvart.zip
PB_1_2011_1kvart.zip
PB_1_2011_2kvart.zip
PB_1_2011_3kvart.zip
PB_1_2011_4kvart.zip
PB_1_2012_1kvart.zip
PB_1_2012_2kvart.zip
PB_1_2012_3kvart.zip
PB_1_2012_4kvart.zip
PB_1_2013_1kvart.zip
PB_1_2013_2kvart.zip
PB_1_2013_3kvart.zip
PB_1_2013_4kvart.zip
PB_1_2014_1kvart.zip
NHS
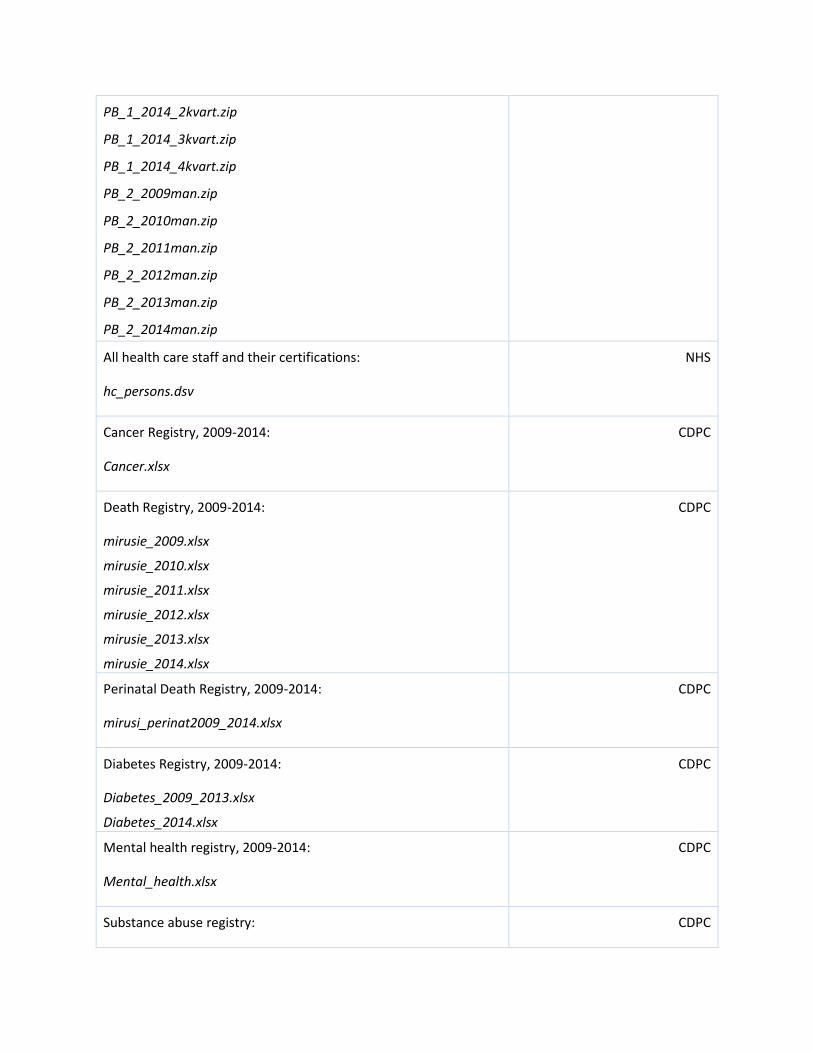
PB_1_2014_2kvart.zip
PB_1_2014_3kvart.zip
PB_1_2014_4kvart.zip
PB_2_2009man.zip
PB_2_2010man.zip
PB_2_2011man.zip
PB_2_2012man.zip
PB_2_2013man.zip
PB_2_2014man.zip
All health care staff and their certifications:
hc_persons.dsv
NHS
Cancer Registry, 2009-2014:
Cancer.xlsx
CDPC
Death Registry, 2009-2014:
mirusie_2009.xlsx
mirusie_2010.xlsx
mirusie_2011.xlsx
mirusie_2012.xlsx
mirusie_2013.xlsx
mirusie_2014.xlsx
CDPC
Perinatal Death Registry, 2009-2014:
mirusi_perinat2009_2014.xlsx
CDPC
Diabetes Registry, 2009-2014:
Diabetes_2009_2013.xlsx
Diabetes_2014.xlsx
CDPC
Mental health registry, 2009-2014:
Mental_health.xlsx
CDPC
Substance abuse registry: CDPC
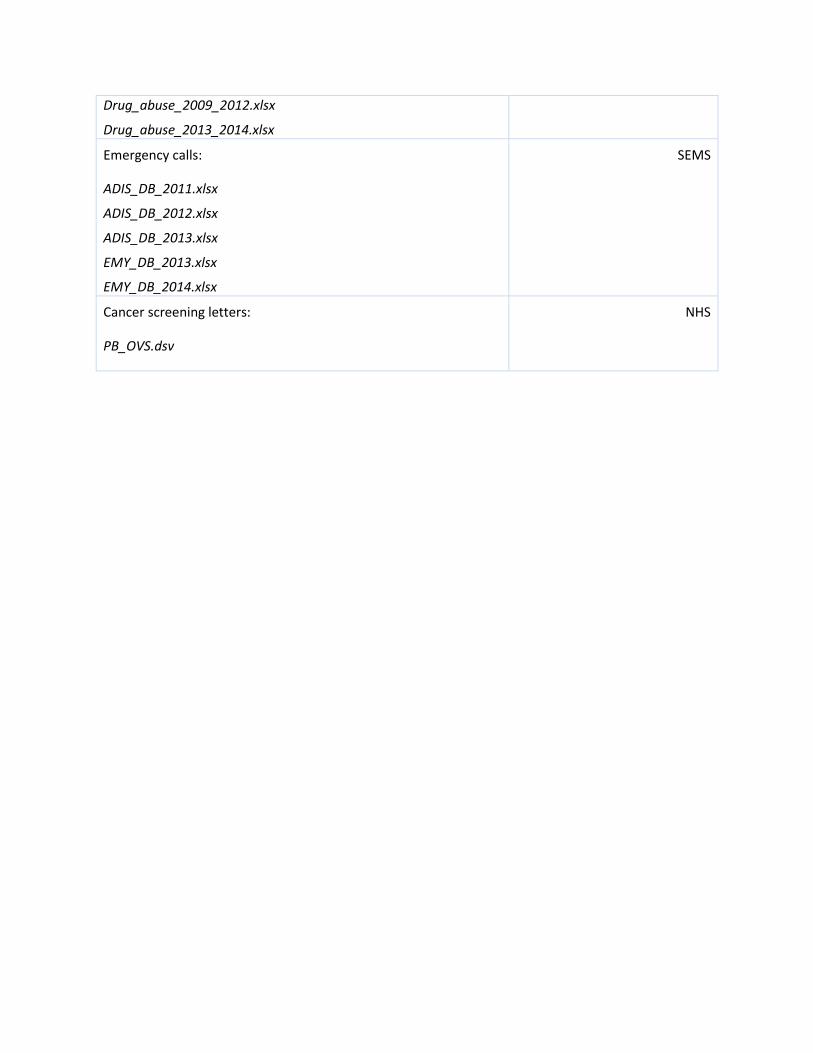
Drug_abuse_2009_2012.xlsx
Drug_abuse_2013_2014.xlsx
Emergency calls:
ADIS_DB_2011.xlsx
ADIS_DB_2012.xlsx
ADIS_DB_2013.xlsx
EMY_DB_2013.xlsx
EMY_DB_2014.xlsx
SEMS
Cancer screening letters:
PB_OVS.dsv
NHS
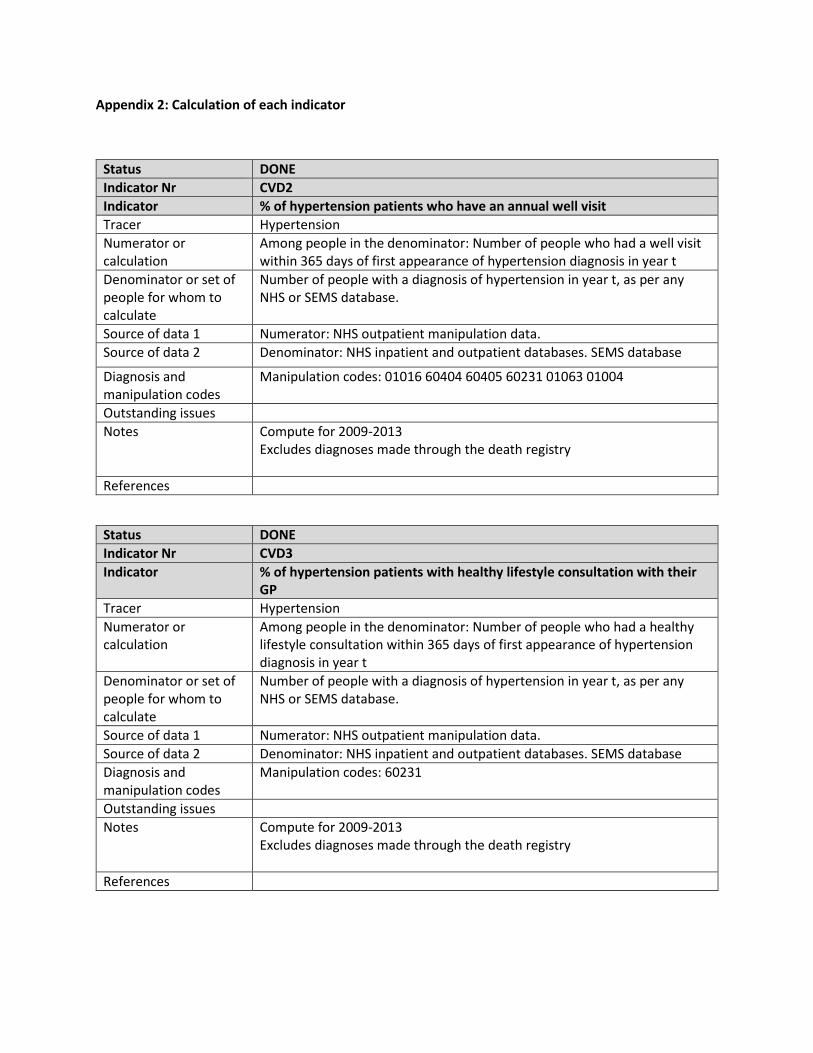
Appendix 2: Calculation of each indicator
Status DONE
Indicator Nr CVD2
Indicator % of hypertension patients who have an annual well visit
Tracer Hypertension
Numerator or calculation
Among people in the denominator: Number of people who had a well visit within 365 days of first appearance of hypertension diagnosis in year t
Denominator or set of people for whom to calculate
Number of people with a diagnosis of hypertension in year t, as per any NHS or SEMS database.
Source of data 1 Numerator: NHS outpatient manipulation data.
Source of data 2 Denominator: NHS inpatient and outpatient databases. SEMS database
Diagnosis and manipulation codes
Manipulation codes: 01016 60404 60405 60231 01063 01004
Outstanding issues
Notes Compute for 2009-2013 Excludes diagnoses made through the death registry
References
Status DONE
Indicator Nr CVD3
Indicator % of hypertension patients with healthy lifestyle consultation with their GP
Tracer Hypertension
Numerator or calculation
Among people in the denominator: Number of people who had a healthy lifestyle consultation within 365 days of first appearance of hypertension diagnosis in year t
Denominator or set of people for whom to calculate
Number of people with a diagnosis of hypertension in year t, as per any NHS or SEMS database.
Source of data 1 Numerator: NHS outpatient manipulation data.
Source of data 2 Denominator: NHS inpatient and outpatient databases. SEMS database
Diagnosis and manipulation codes
Manipulation codes: 60231
Outstanding issues
Notes Compute for 2009-2013 Excludes diagnoses made through the death registry
References
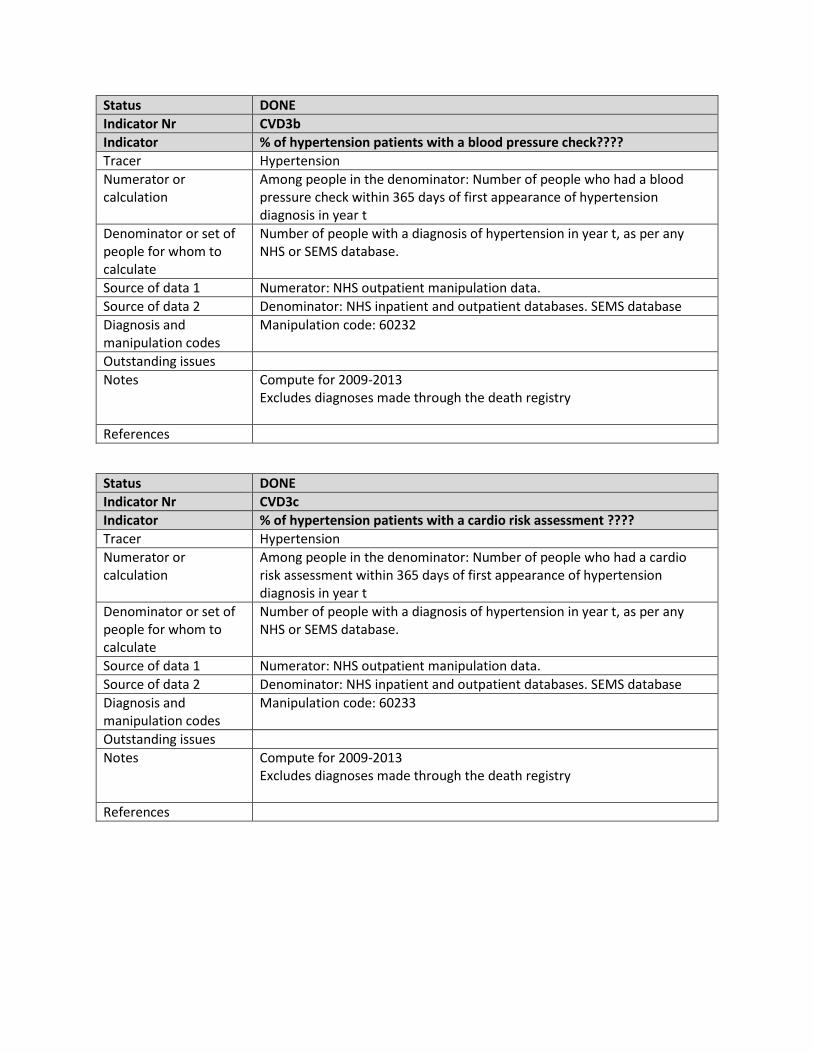
Status DONE
Indicator Nr CVD3b
Indicator % of hypertension patients with a blood pressure check????
Tracer Hypertension
Numerator or calculation
Among people in the denominator: Number of people who had a blood pressure check within 365 days of first appearance of hypertension diagnosis in year t
Denominator or set of people for whom to calculate
Number of people with a diagnosis of hypertension in year t, as per any NHS or SEMS database.
Source of data 1 Numerator: NHS outpatient manipulation data.
Source of data 2 Denominator: NHS inpatient and outpatient databases. SEMS database
Diagnosis and manipulation codes
Manipulation code: 60232
Outstanding issues
Notes Compute for 2009-2013 Excludes diagnoses made through the death registry
References
Status DONE
Indicator Nr CVD3c
Indicator % of hypertension patients with a cardio risk assessment ????
Tracer Hypertension
Numerator or calculation
Among people in the denominator: Number of people who had a cardio risk assessment within 365 days of first appearance of hypertension diagnosis in year t
Denominator or set of people for whom to calculate
Number of people with a diagnosis of hypertension in year t, as per any NHS or SEMS database.
Source of data 1 Numerator: NHS outpatient manipulation data.
Source of data 2 Denominator: NHS inpatient and outpatient databases. SEMS database
Diagnosis and manipulation codes
Manipulation code: 60233
Outstanding issues
Notes Compute for 2009-2013 Excludes diagnoses made through the death registry
References
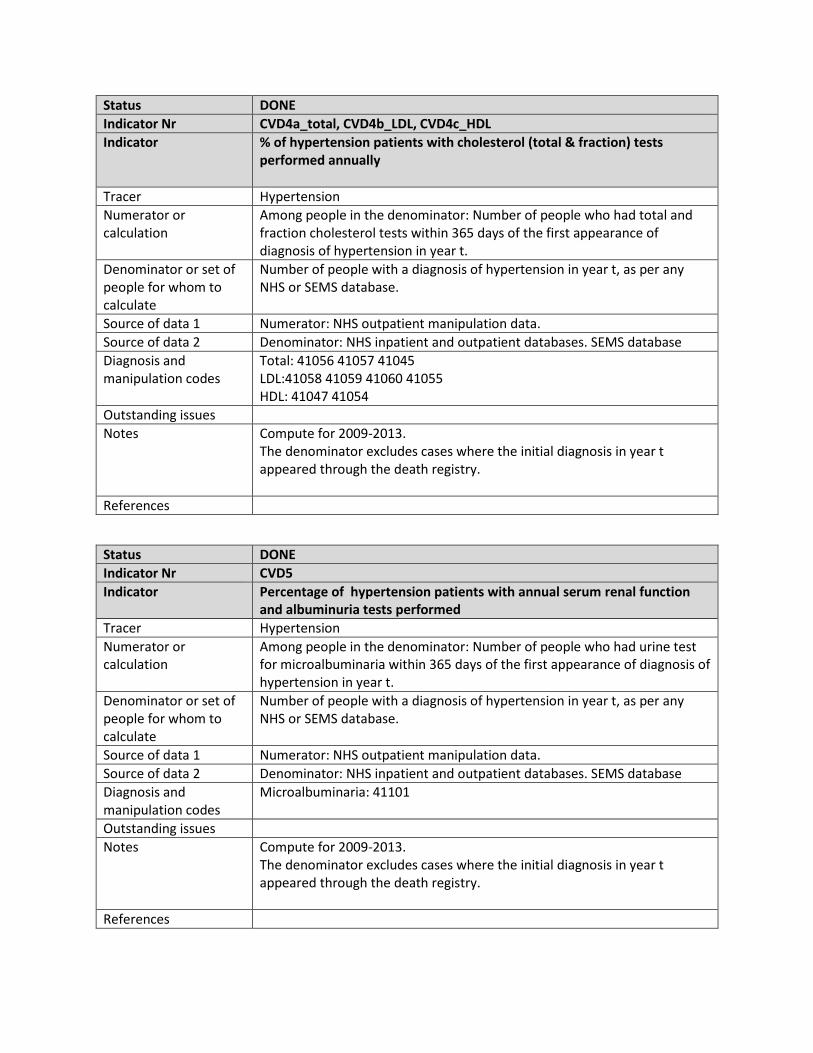
Status DONE
Indicator Nr CVD4a_total, CVD4b_LDL, CVD4c_HDL
Indicator % of hypertension patients with cholesterol (total & fraction) tests performed annually
Tracer Hypertension
Numerator or calculation
Among people in the denominator: Number of people who had total and fraction cholesterol tests within 365 days of the first appearance of diagnosis of hypertension in year t.
Denominator or set of people for whom to calculate
Number of people with a diagnosis of hypertension in year t, as per any NHS or SEMS database.
Source of data 1 Numerator: NHS outpatient manipulation data.
Source of data 2 Denominator: NHS inpatient and outpatient databases. SEMS database
Diagnosis and manipulation codes
Total: 41056 41057 41045 LDL:41058 41059 41060 41055 HDL: 41047 41054
Outstanding issues
Notes Compute for 2009-2013. The denominator excludes cases where the initial diagnosis in year t appeared through the death registry.
References
Status DONE
Indicator Nr CVD5
Indicator Percentage of hypertension patients with annual serum renal function and albuminuria tests performed
Tracer Hypertension
Numerator or calculation
Among people in the denominator: Number of people who had urine test for microalbuminaria within 365 days of the first appearance of diagnosis of hypertension in year t.
Denominator or set of people for whom to calculate
Number of people with a diagnosis of hypertension in year t, as per any NHS or SEMS database.
Source of data 1 Numerator: NHS outpatient manipulation data.
Source of data 2 Denominator: NHS inpatient and outpatient databases. SEMS database
Diagnosis and manipulation codes
Microalbuminaria: 41101
Outstanding issues
Notes Compute for 2009-2013. The denominator excludes cases where the initial diagnosis in year t appeared through the death registry.
References
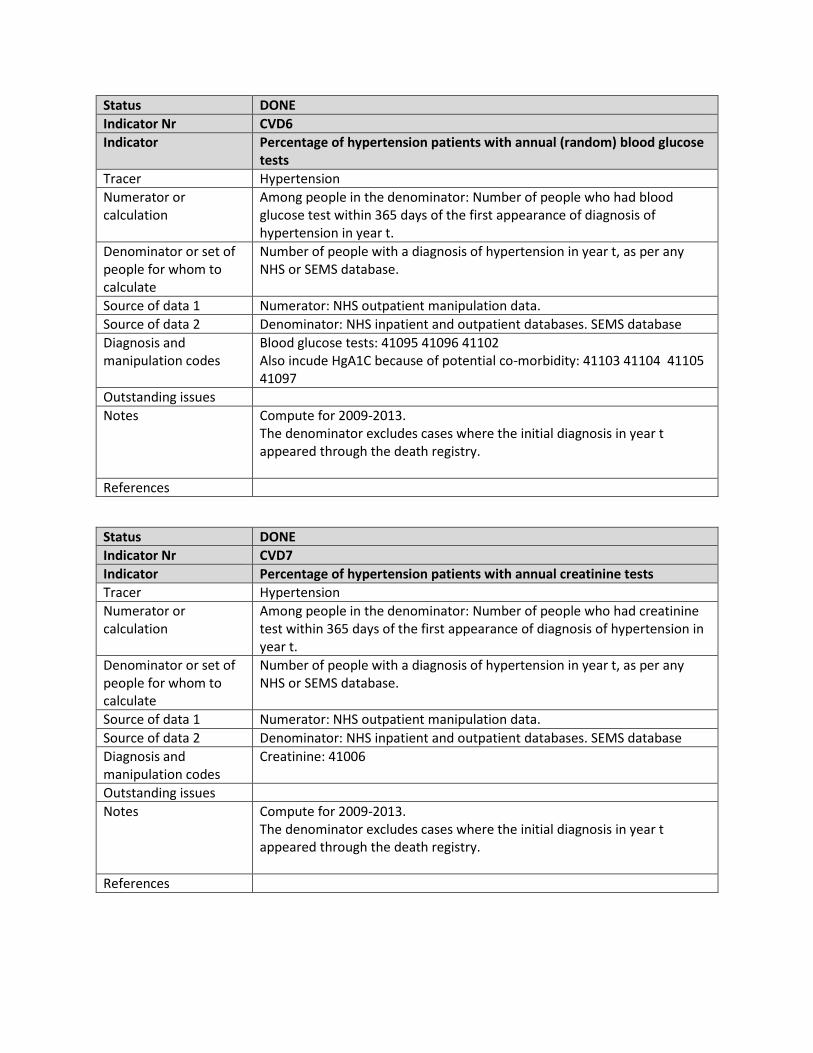
Status DONE
Indicator Nr CVD6
Indicator Percentage of hypertension patients with annual (random) blood glucose tests
Tracer Hypertension
Numerator or calculation
Among people in the denominator: Number of people who had blood glucose test within 365 days of the first appearance of diagnosis of hypertension in year t.
Denominator or set of people for whom to calculate
Number of people with a diagnosis of hypertension in year t, as per any NHS or SEMS database.
Source of data 1 Numerator: NHS outpatient manipulation data.
Source of data 2 Denominator: NHS inpatient and outpatient databases. SEMS database
Diagnosis and manipulation codes
Blood glucose tests: 41095 41096 41102 Also incude HgA1C because of potential co-morbidity: 41103 41104 41105 41097
Outstanding issues
Notes Compute for 2009-2013. The denominator excludes cases where the initial diagnosis in year t appeared through the death registry.
References
Status DONE
Indicator Nr CVD7
Indicator Percentage of hypertension patients with annual creatinine tests
Tracer Hypertension
Numerator or calculation
Among people in the denominator: Number of people who had creatinine test within 365 days of the first appearance of diagnosis of hypertension in year t.
Denominator or set of people for whom to calculate
Number of people with a diagnosis of hypertension in year t, as per any NHS or SEMS database.
Source of data 1 Numerator: NHS outpatient manipulation data.
Source of data 2 Denominator: NHS inpatient and outpatient databases. SEMS database
Diagnosis and manipulation codes
Creatinine: 41006
Outstanding issues
Notes Compute for 2009-2013. The denominator excludes cases where the initial diagnosis in year t appeared through the death registry.
References
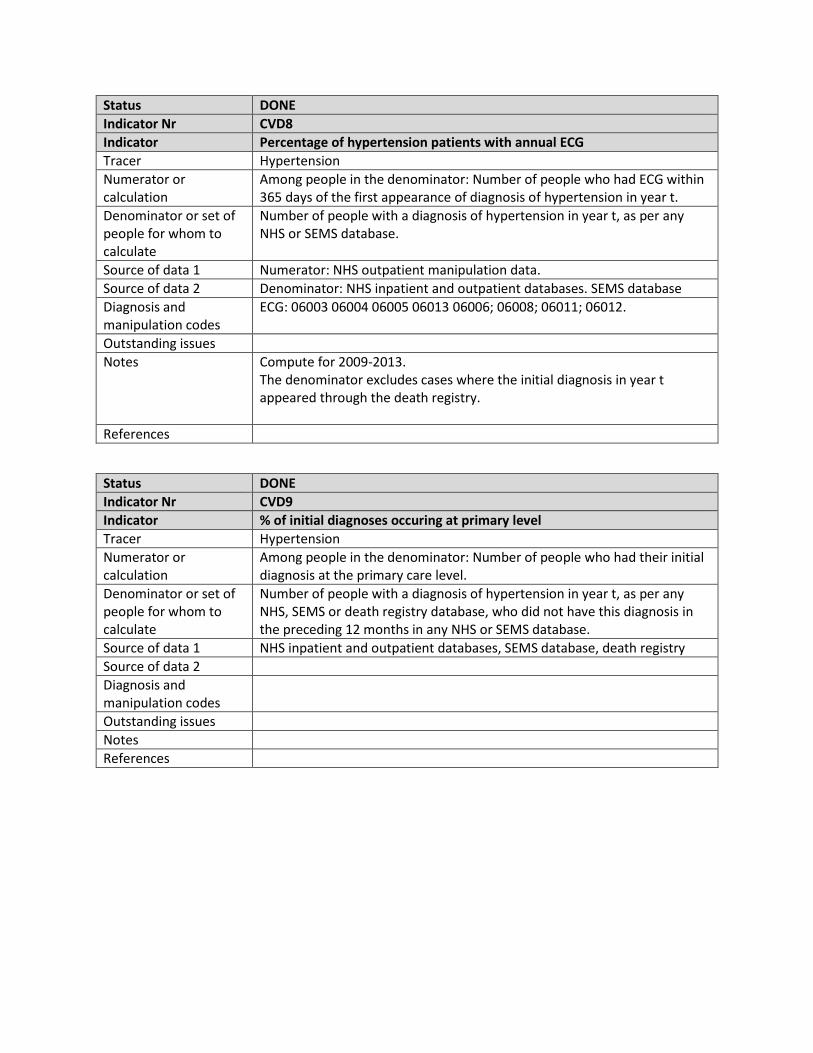
Status DONE
Indicator Nr CVD8
Indicator Percentage of hypertension patients with annual ECG
Tracer Hypertension
Numerator or calculation
Among people in the denominator: Number of people who had ECG within 365 days of the first appearance of diagnosis of hypertension in year t.
Denominator or set of people for whom to calculate
Number of people with a diagnosis of hypertension in year t, as per any NHS or SEMS database.
Source of data 1 Numerator: NHS outpatient manipulation data.
Source of data 2 Denominator: NHS inpatient and outpatient databases. SEMS database
Diagnosis and manipulation codes
ECG: 06003 06004 06005 06013 06006; 06008; 06011; 06012.
Outstanding issues
Notes Compute for 2009-2013. The denominator excludes cases where the initial diagnosis in year t appeared through the death registry.
References
Status DONE
Indicator Nr CVD9
Indicator % of initial diagnoses occuring at primary level
Tracer Hypertension
Numerator or calculation
Among people in the denominator: Number of people who had their initial diagnosis at the primary care level.
Denominator or set of people for whom to calculate
Number of people with a diagnosis of hypertension in year t, as per any NHS, SEMS or death registry database, who did not have this diagnosis in the preceding 12 months in any NHS or SEMS database.
Source of data 1 NHS inpatient and outpatient databases, SEMS database, death registry
Source of data 2
Diagnosis and manipulation codes
Outstanding issues
Notes
References
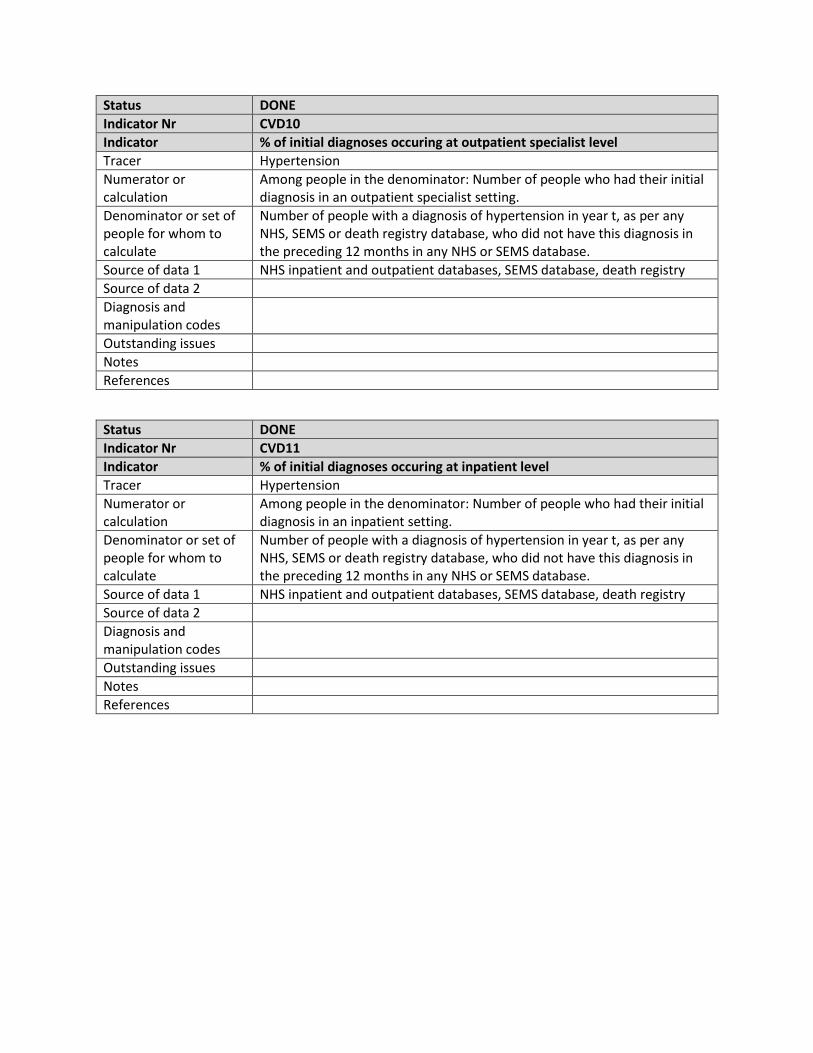
Status DONE
Indicator Nr CVD10
Indicator % of initial diagnoses occuring at outpatient specialist level
Tracer Hypertension
Numerator or calculation
Among people in the denominator: Number of people who had their initial diagnosis in an outpatient specialist setting.
Denominator or set of people for whom to calculate
Number of people with a diagnosis of hypertension in year t, as per any NHS, SEMS or death registry database, who did not have this diagnosis in the preceding 12 months in any NHS or SEMS database.
Source of data 1 NHS inpatient and outpatient databases, SEMS database, death registry
Source of data 2
Diagnosis and manipulation codes
Outstanding issues
Notes
References
Status DONE
Indicator Nr CVD11
Indicator % of initial diagnoses occuring at inpatient level
Tracer Hypertension
Numerator or calculation
Among people in the denominator: Number of people who had their initial diagnosis in an inpatient setting.
Denominator or set of people for whom to calculate
Number of people with a diagnosis of hypertension in year t, as per any NHS, SEMS or death registry database, who did not have this diagnosis in the preceding 12 months in any NHS or SEMS database.
Source of data 1 NHS inpatient and outpatient databases, SEMS database, death registry
Source of data 2
Diagnosis and manipulation codes
Outstanding issues
Notes
References

Status DONE
Indicator Nr CVD12
Indicator % of initial diagnoses occuring via SEMS
Tracer Hypertension
Numerator or calculation
Among people in the denominator: Number of people who had their initial diagnosis in a SEMS setting.
Denominator or set of people for whom to calculate
Number of people with a diagnosis of hypertension in year t, as per any NHS, SEMS or death registry database, who did not have this diagnosis in the preceding 12 months in any NHS or SEMS database.
Source of data 1 NHS inpatient and outpatient databases, SEMS database, death registry
Source of data 2
Diagnosis and manipulation codes
Outstanding issues
Notes
References
Status DONE
Indicator Nr CVD13
Indicator % of initial diagnoses occuring at death
Tracer Hypertension
Numerator or calculation
Among people in the denominator: Number of people who had their initial diagnosis in the death registry.
Denominator or set of people for whom to calculate
Number of people with a diagnosis of hypertension in year t, as per any NHS, SEMS or death registry database, who did not have this diagnosis in the preceding 12 months in any NHS or SEMS database.
Source of data 1 NHS inpatient and outpatient databases, SEMS database, death registry
Source of data 2
Diagnosis and manipulation codes
Outstanding issues
Notes
References
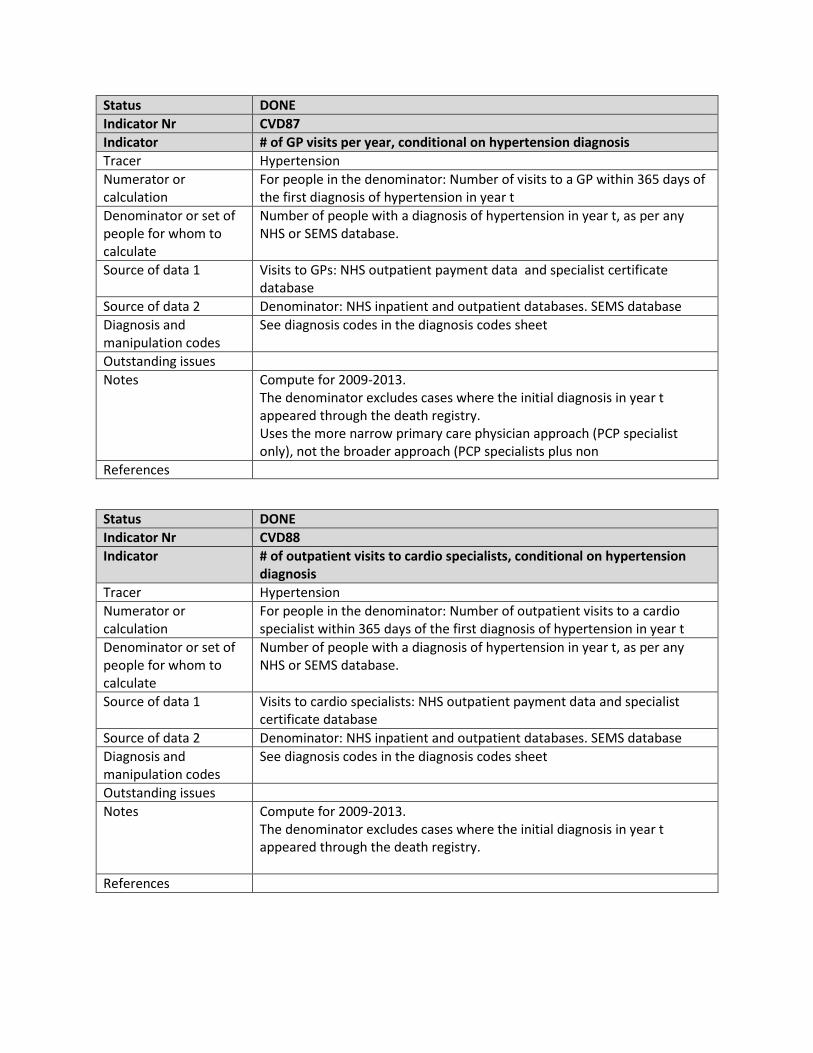
Status DONE
Indicator Nr CVD87
Indicator # of GP visits per year, conditional on hypertension diagnosis
Tracer Hypertension
Numerator or calculation
For people in the denominator: Number of visits to a GP within 365 days of the first diagnosis of hypertension in year t
Denominator or set of people for whom to calculate
Number of people with a diagnosis of hypertension in year t, as per any NHS or SEMS database.
Source of data 1 Visits to GPs: NHS outpatient payment data and specialist certificate database
Source of data 2 Denominator: NHS inpatient and outpatient databases. SEMS database
Diagnosis and manipulation codes
See diagnosis codes in the diagnosis codes sheet
Outstanding issues
Notes Compute for 2009-2013. The denominator excludes cases where the initial diagnosis in year t appeared through the death registry. Uses the more narrow primary care physician approach (PCP specialist only), not the broader approach (PCP specialists plus non
References
Status DONE
Indicator Nr CVD88
Indicator # of outpatient visits to cardio specialists, conditional on hypertension diagnosis
Tracer Hypertension
Numerator or calculation
For people in the denominator: Number of outpatient visits to a cardio specialist within 365 days of the first diagnosis of hypertension in year t
Denominator or set of people for whom to calculate
Number of people with a diagnosis of hypertension in year t, as per any NHS or SEMS database.
Source of data 1 Visits to cardio specialists: NHS outpatient payment data and specialist certificate database
Source of data 2 Denominator: NHS inpatient and outpatient databases. SEMS database
Diagnosis and manipulation codes
See diagnosis codes in the diagnosis codes sheet
Outstanding issues
Notes Compute for 2009-2013. The denominator excludes cases where the initial diagnosis in year t appeared through the death registry.
References
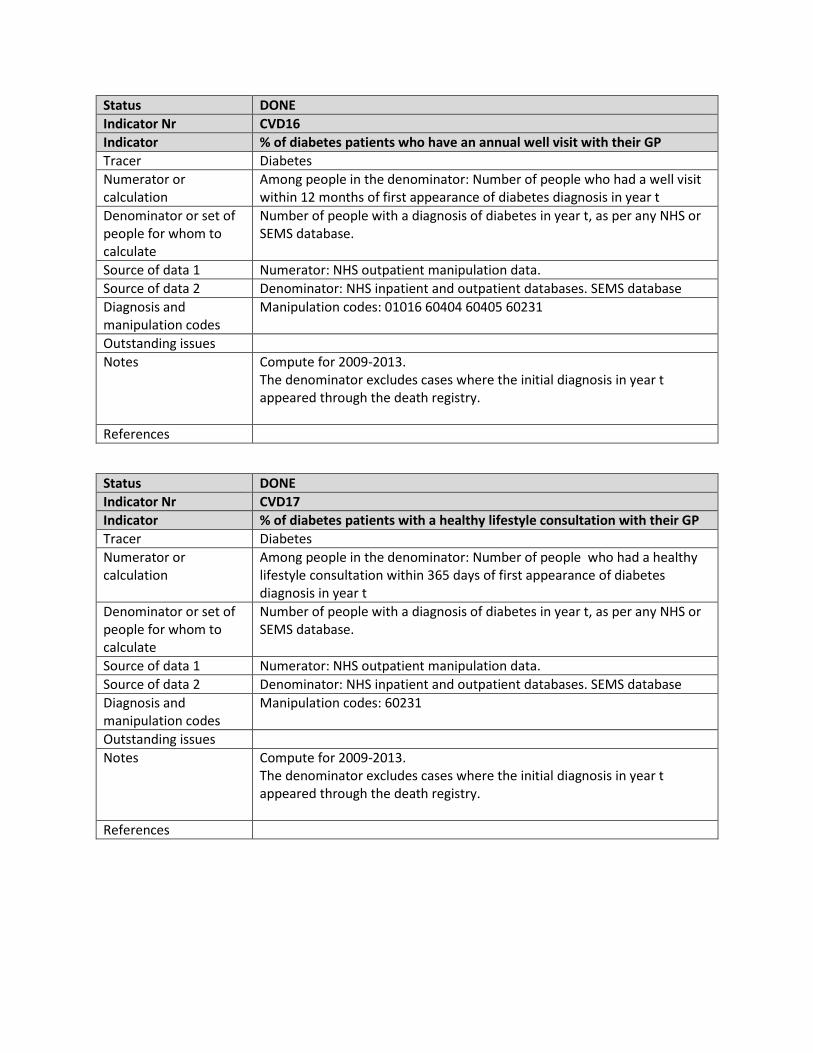
Status DONE
Indicator Nr CVD16
Indicator % of diabetes patients who have an annual well visit with their GP
Tracer Diabetes
Numerator or calculation
Among people in the denominator: Number of people who had a well visit within 12 months of first appearance of diabetes diagnosis in year t
Denominator or set of people for whom to calculate
Number of people with a diagnosis of diabetes in year t, as per any NHS or SEMS database.
Source of data 1 Numerator: NHS outpatient manipulation data.
Source of data 2 Denominator: NHS inpatient and outpatient databases. SEMS database
Diagnosis and manipulation codes
Manipulation codes: 01016 60404 60405 60231
Outstanding issues
Notes Compute for 2009-2013. The denominator excludes cases where the initial diagnosis in year t appeared through the death registry.
References
Status DONE
Indicator Nr CVD17
Indicator % of diabetes patients with a healthy lifestyle consultation with their GP
Tracer Diabetes
Numerator or calculation
Among people in the denominator: Number of people who had a healthy lifestyle consultation within 365 days of first appearance of diabetes diagnosis in year t
Denominator or set of people for whom to calculate
Number of people with a diagnosis of diabetes in year t, as per any NHS or SEMS database.
Source of data 1 Numerator: NHS outpatient manipulation data.
Source of data 2 Denominator: NHS inpatient and outpatient databases. SEMS database
Diagnosis and manipulation codes
Manipulation codes: 60231
Outstanding issues
Notes Compute for 2009-2013. The denominator excludes cases where the initial diagnosis in year t appeared through the death registry.
References
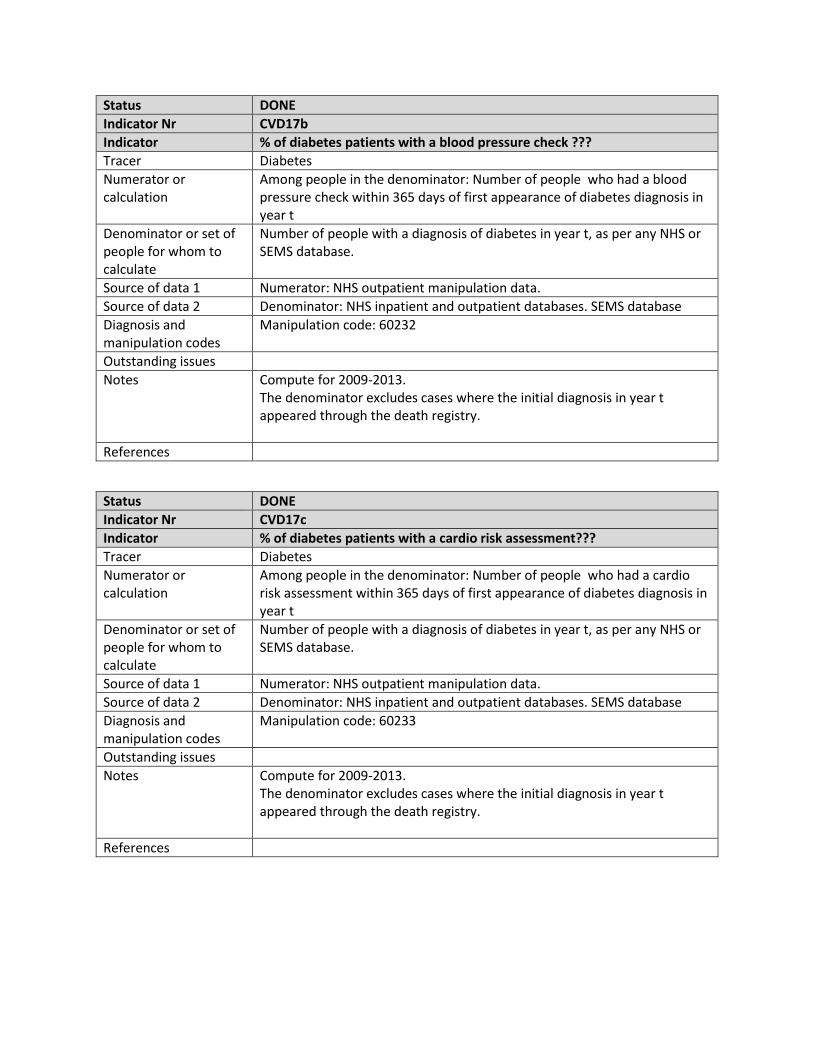
Status DONE
Indicator Nr CVD17b
Indicator % of diabetes patients with a blood pressure check ???
Tracer Diabetes
Numerator or calculation
Among people in the denominator: Number of people who had a blood pressure check within 365 days of first appearance of diabetes diagnosis in year t
Denominator or set of people for whom to calculate
Number of people with a diagnosis of diabetes in year t, as per any NHS or SEMS database.
Source of data 1 Numerator: NHS outpatient manipulation data.
Source of data 2 Denominator: NHS inpatient and outpatient databases. SEMS database
Diagnosis and manipulation codes
Manipulation code: 60232
Outstanding issues
Notes Compute for 2009-2013. The denominator excludes cases where the initial diagnosis in year t appeared through the death registry.
References
Status DONE
Indicator Nr CVD17c
Indicator % of diabetes patients with a cardio risk assessment???
Tracer Diabetes
Numerator or calculation
Among people in the denominator: Number of people who had a cardio risk assessment within 365 days of first appearance of diabetes diagnosis in year t
Denominator or set of people for whom to calculate
Number of people with a diagnosis of diabetes in year t, as per any NHS or SEMS database.
Source of data 1 Numerator: NHS outpatient manipulation data.
Source of data 2 Denominator: NHS inpatient and outpatient databases. SEMS database
Diagnosis and manipulation codes
Manipulation code: 60233
Outstanding issues
Notes Compute for 2009-2013. The denominator excludes cases where the initial diagnosis in year t appeared through the death registry.
References
Status DONE
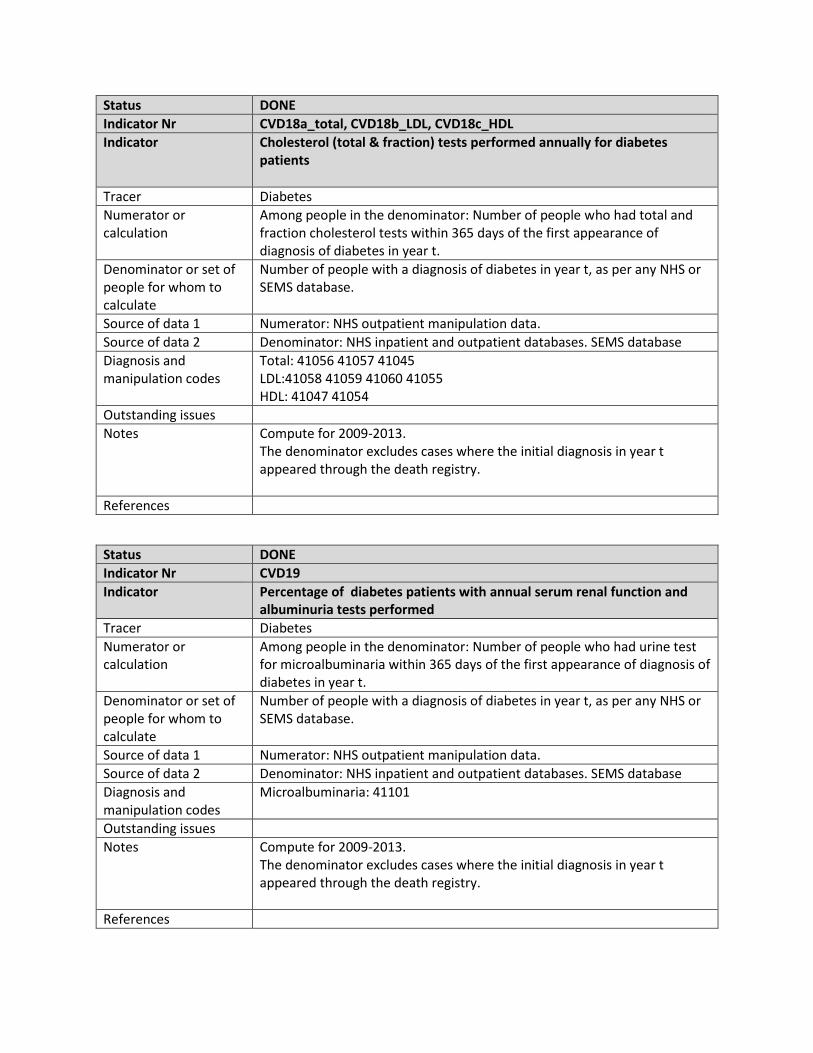
Indicator Nr CVD18a_total, CVD18b_LDL, CVD18c_HDL
Indicator Cholesterol (total & fraction) tests performed annually for diabetes patients
Tracer Diabetes
Numerator or calculation
Among people in the denominator: Number of people who had total and fraction cholesterol tests within 365 days of the first appearance of diagnosis of diabetes in year t.
Denominator or set of people for whom to calculate
Number of people with a diagnosis of diabetes in year t, as per any NHS or SEMS database.
Source of data 1 Numerator: NHS outpatient manipulation data.
Source of data 2 Denominator: NHS inpatient and outpatient databases. SEMS database
Diagnosis and manipulation codes
Total: 41056 41057 41045 LDL:41058 41059 41060 41055 HDL: 41047 41054
Outstanding issues
Notes Compute for 2009-2013. The denominator excludes cases where the initial diagnosis in year t appeared through the death registry.
References
Status DONE
Indicator Nr CVD19
Indicator Percentage of diabetes patients with annual serum renal function and albuminuria tests performed
Tracer Diabetes
Numerator or calculation
Among people in the denominator: Number of people who had urine test for microalbuminaria within 365 days of the first appearance of diagnosis of diabetes in year t.
Denominator or set of people for whom to calculate
Number of people with a diagnosis of diabetes in year t, as per any NHS or SEMS database.
Source of data 1 Numerator: NHS outpatient manipulation data.
Source of data 2 Denominator: NHS inpatient and outpatient databases. SEMS database
Diagnosis and manipulation codes
Microalbuminaria: 41101
Outstanding issues
Notes Compute for 2009-2013. The denominator excludes cases where the initial diagnosis in year t appeared through the death registry.
References
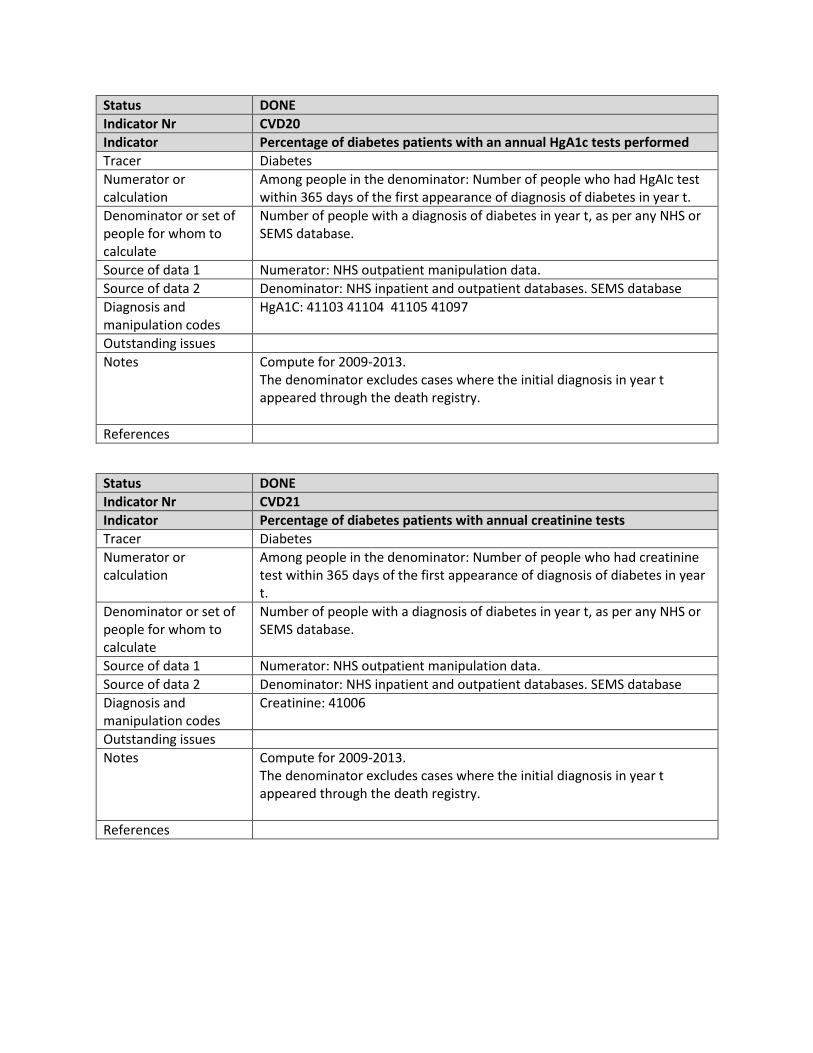
Status DONE
Indicator Nr CVD20
Indicator Percentage of diabetes patients with an annual HgA1c tests performed
Tracer Diabetes
Numerator or calculation
Among people in the denominator: Number of people who had HgAIc test within 365 days of the first appearance of diagnosis of diabetes in year t.
Denominator or set of people for whom to calculate
Number of people with a diagnosis of diabetes in year t, as per any NHS or SEMS database.
Source of data 1 Numerator: NHS outpatient manipulation data.
Source of data 2 Denominator: NHS inpatient and outpatient databases. SEMS database
Diagnosis and manipulation codes
HgA1C: 41103 41104 41105 41097
Outstanding issues
Notes Compute for 2009-2013. The denominator excludes cases where the initial diagnosis in year t appeared through the death registry.
References
Status DONE
Indicator Nr CVD21
Indicator Percentage of diabetes patients with annual creatinine tests
Tracer Diabetes
Numerator or calculation
Among people in the denominator: Number of people who had creatinine test within 365 days of the first appearance of diagnosis of diabetes in year t.
Denominator or set of people for whom to calculate
Number of people with a diagnosis of diabetes in year t, as per any NHS or SEMS database.
Source of data 1 Numerator: NHS outpatient manipulation data.
Source of data 2 Denominator: NHS inpatient and outpatient databases. SEMS database
Diagnosis and manipulation codes
Creatinine: 41006
Outstanding issues
Notes Compute for 2009-2013. The denominator excludes cases where the initial diagnosis in year t appeared through the death registry.
References
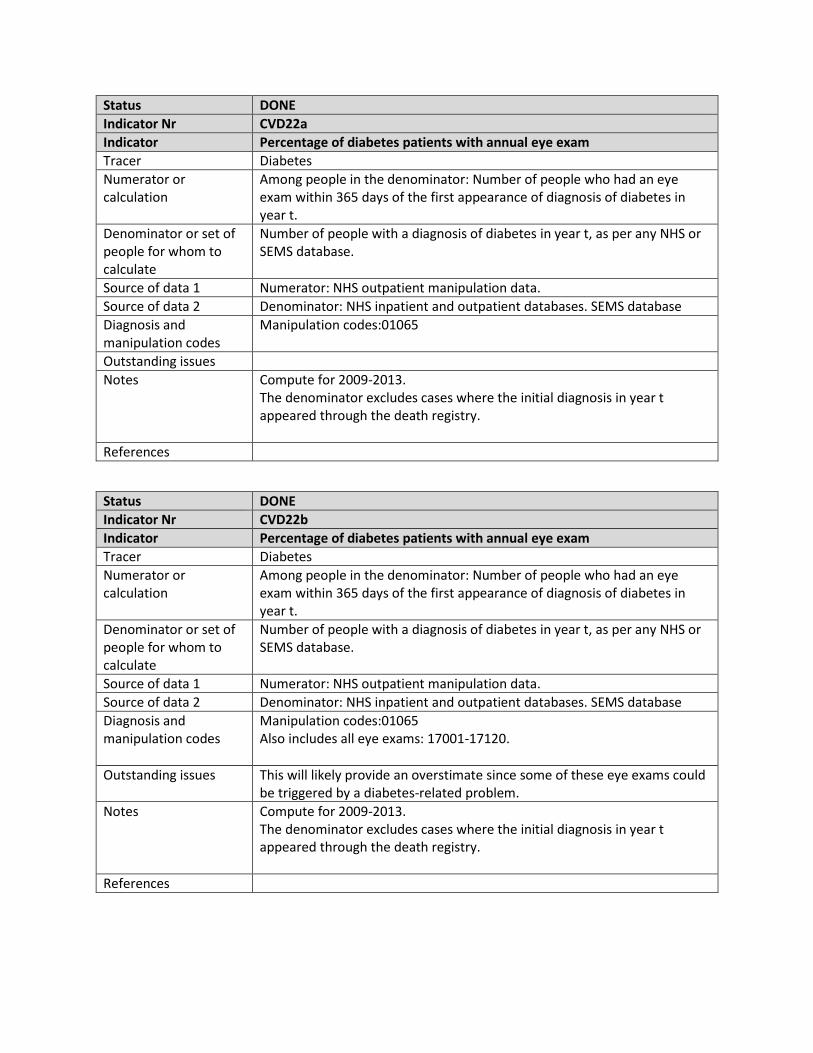
Status DONE
Indicator Nr CVD22a
Indicator Percentage of diabetes patients with annual eye exam
Tracer Diabetes
Numerator or calculation
Among people in the denominator: Number of people who had an eye exam within 365 days of the first appearance of diagnosis of diabetes in year t.
Denominator or set of people for whom to calculate
Number of people with a diagnosis of diabetes in year t, as per any NHS or SEMS database.
Source of data 1 Numerator: NHS outpatient manipulation data.
Source of data 2 Denominator: NHS inpatient and outpatient databases. SEMS database
Diagnosis and manipulation codes
Manipulation codes:01065
Outstanding issues
Notes Compute for 2009-2013. The denominator excludes cases where the initial diagnosis in year t appeared through the death registry.
References
Status DONE
Indicator Nr CVD22b
Indicator Percentage of diabetes patients with annual eye exam
Tracer Diabetes
Numerator or calculation
Among people in the denominator: Number of people who had an eye exam within 365 days of the first appearance of diagnosis of diabetes in year t.
Denominator or set of people for whom to calculate
Number of people with a diagnosis of diabetes in year t, as per any NHS or SEMS database.
Source of data 1 Numerator: NHS outpatient manipulation data.
Source of data 2 Denominator: NHS inpatient and outpatient databases. SEMS database
Diagnosis and manipulation codes
Manipulation codes:01065 Also includes all eye exams: 17001-17120.
Outstanding issues This will likely provide an overstimate since some of these eye exams could be triggered by a diabetes-related problem.
Notes Compute for 2009-2013. The denominator excludes cases where the initial diagnosis in year t appeared through the death registry.
References
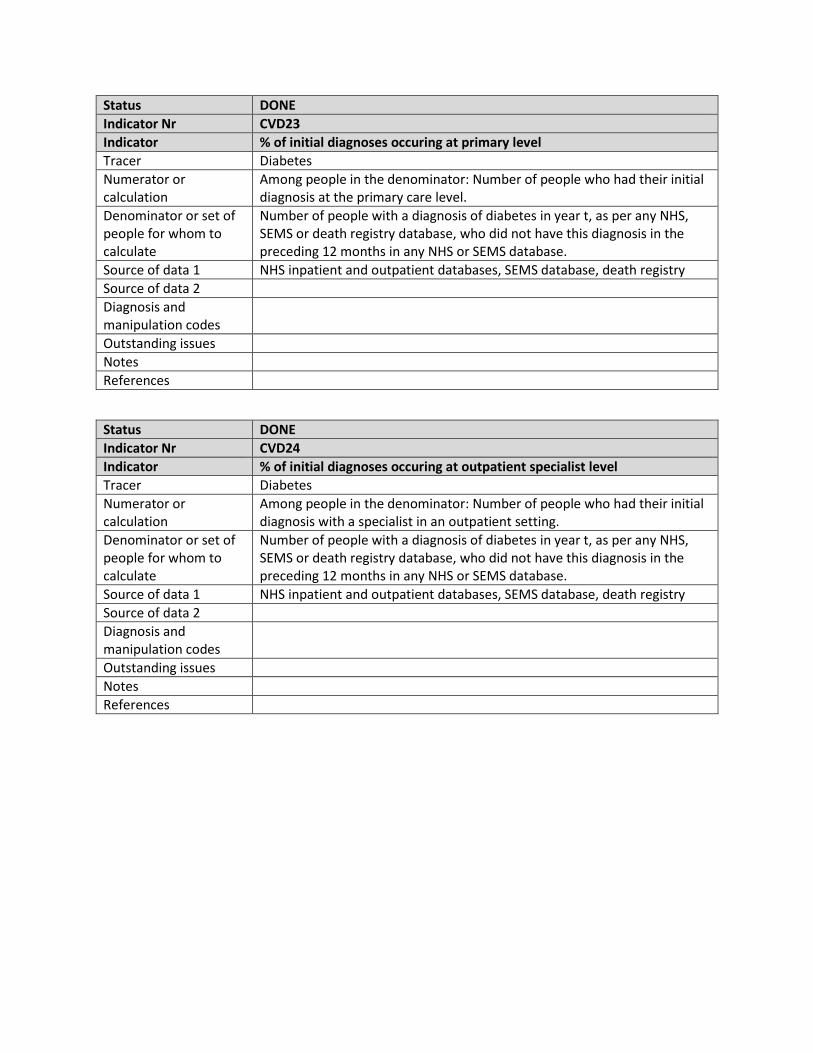
Status DONE
Indicator Nr CVD23
Indicator % of initial diagnoses occuring at primary level
Tracer Diabetes
Numerator or calculation
Among people in the denominator: Number of people who had their initial diagnosis at the primary care level.
Denominator or set of people for whom to calculate
Number of people with a diagnosis of diabetes in year t, as per any NHS, SEMS or death registry database, who did not have this diagnosis in the preceding 12 months in any NHS or SEMS database.
Source of data 1 NHS inpatient and outpatient databases, SEMS database, death registry
Source of data 2
Diagnosis and manipulation codes
Outstanding issues
Notes
References
Status DONE
Indicator Nr CVD24
Indicator % of initial diagnoses occuring at outpatient specialist level
Tracer Diabetes
Numerator or calculation
Among people in the denominator: Number of people who had their initial diagnosis with a specialist in an outpatient setting.
Denominator or set of people for whom to calculate
Number of people with a diagnosis of diabetes in year t, as per any NHS, SEMS or death registry database, who did not have this diagnosis in the preceding 12 months in any NHS or SEMS database.
Source of data 1 NHS inpatient and outpatient databases, SEMS database, death registry
Source of data 2
Diagnosis and manipulation codes
Outstanding issues
Notes
References
Status DONE
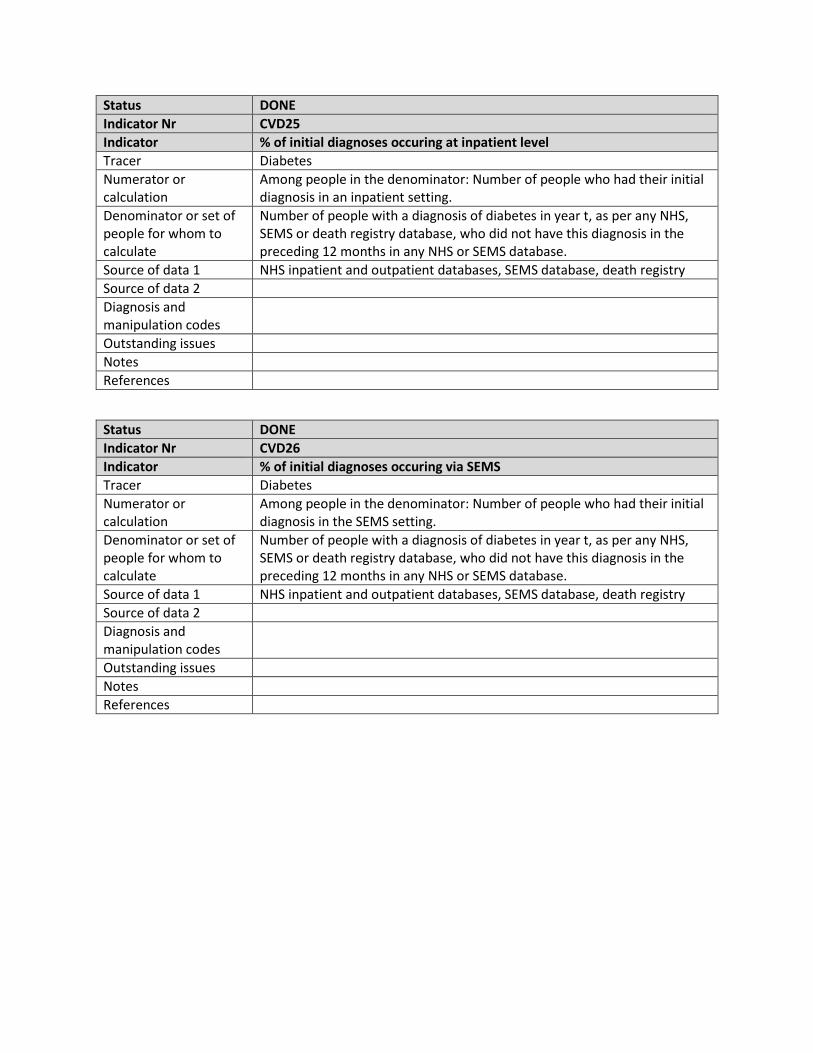
Indicator Nr CVD25
Indicator % of initial diagnoses occuring at inpatient level
Tracer Diabetes
Numerator or calculation
Among people in the denominator: Number of people who had their initial diagnosis in an inpatient setting.
Denominator or set of people for whom to calculate
Number of people with a diagnosis of diabetes in year t, as per any NHS, SEMS or death registry database, who did not have this diagnosis in the preceding 12 months in any NHS or SEMS database.
Source of data 1 NHS inpatient and outpatient databases, SEMS database, death registry
Source of data 2
Diagnosis and manipulation codes
Outstanding issues
Notes
References
Status DONE
Indicator Nr CVD26
Indicator % of initial diagnoses occuring via SEMS
Tracer Diabetes
Numerator or calculation
Among people in the denominator: Number of people who had their initial diagnosis in the SEMS setting.
Denominator or set of people for whom to calculate
Number of people with a diagnosis of diabetes in year t, as per any NHS, SEMS or death registry database, who did not have this diagnosis in the preceding 12 months in any NHS or SEMS database.
Source of data 1 NHS inpatient and outpatient databases, SEMS database, death registry
Source of data 2
Diagnosis and manipulation codes
Outstanding issues
Notes
References
Status DONE
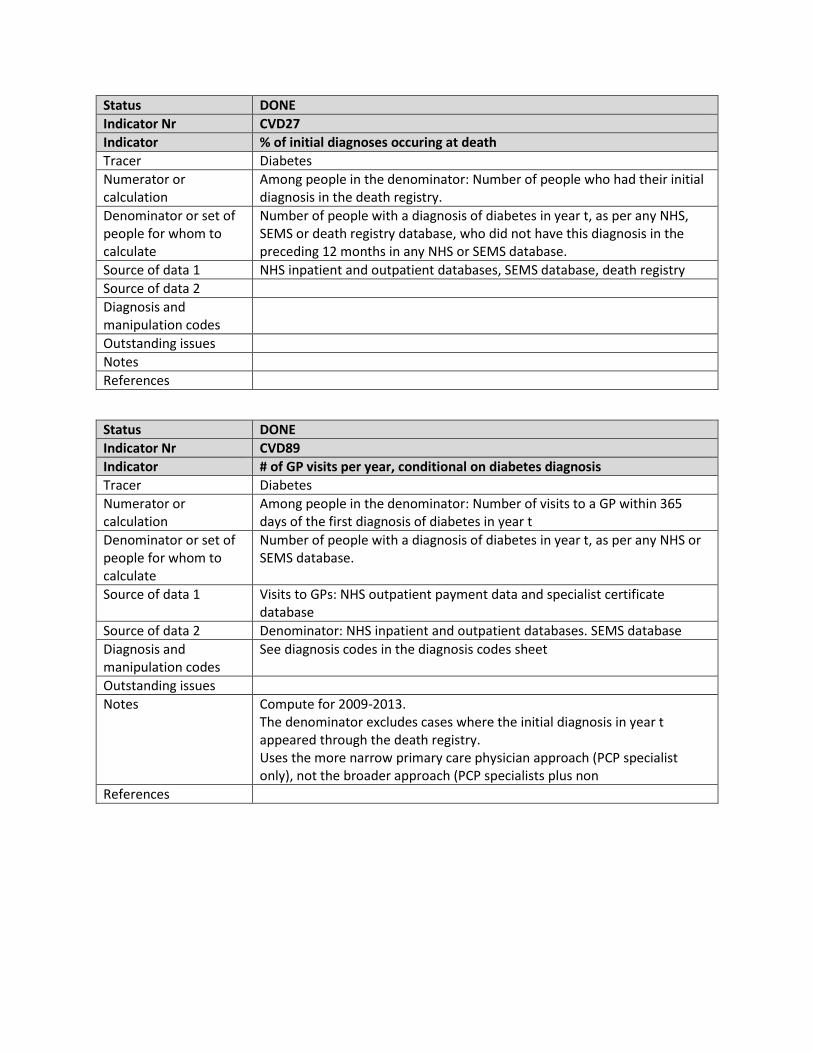
Indicator Nr CVD27
Indicator % of initial diagnoses occuring at death
Tracer Diabetes
Numerator or calculation
Among people in the denominator: Number of people who had their initial diagnosis in the death registry.
Denominator or set of people for whom to calculate
Number of people with a diagnosis of diabetes in year t, as per any NHS, SEMS or death registry database, who did not have this diagnosis in the preceding 12 months in any NHS or SEMS database.
Source of data 1 NHS inpatient and outpatient databases, SEMS database, death registry
Source of data 2
Diagnosis and manipulation codes
Outstanding issues
Notes
References
Status DONE
Indicator Nr CVD89
Indicator # of GP visits per year, conditional on diabetes diagnosis
Tracer Diabetes
Numerator or calculation
Among people in the denominator: Number of visits to a GP within 365 days of the first diagnosis of diabetes in year t
Denominator or set of people for whom to calculate
Number of people with a diagnosis of diabetes in year t, as per any NHS or SEMS database.
Source of data 1 Visits to GPs: NHS outpatient payment data and specialist certificate database
Source of data 2 Denominator: NHS inpatient and outpatient databases. SEMS database
Diagnosis and manipulation codes
See diagnosis codes in the diagnosis codes sheet
Outstanding issues
Notes Compute for 2009-2013. The denominator excludes cases where the initial diagnosis in year t appeared through the death registry. Uses the more narrow primary care physician approach (PCP specialist only), not the broader approach (PCP specialists plus non
References
Status DONE
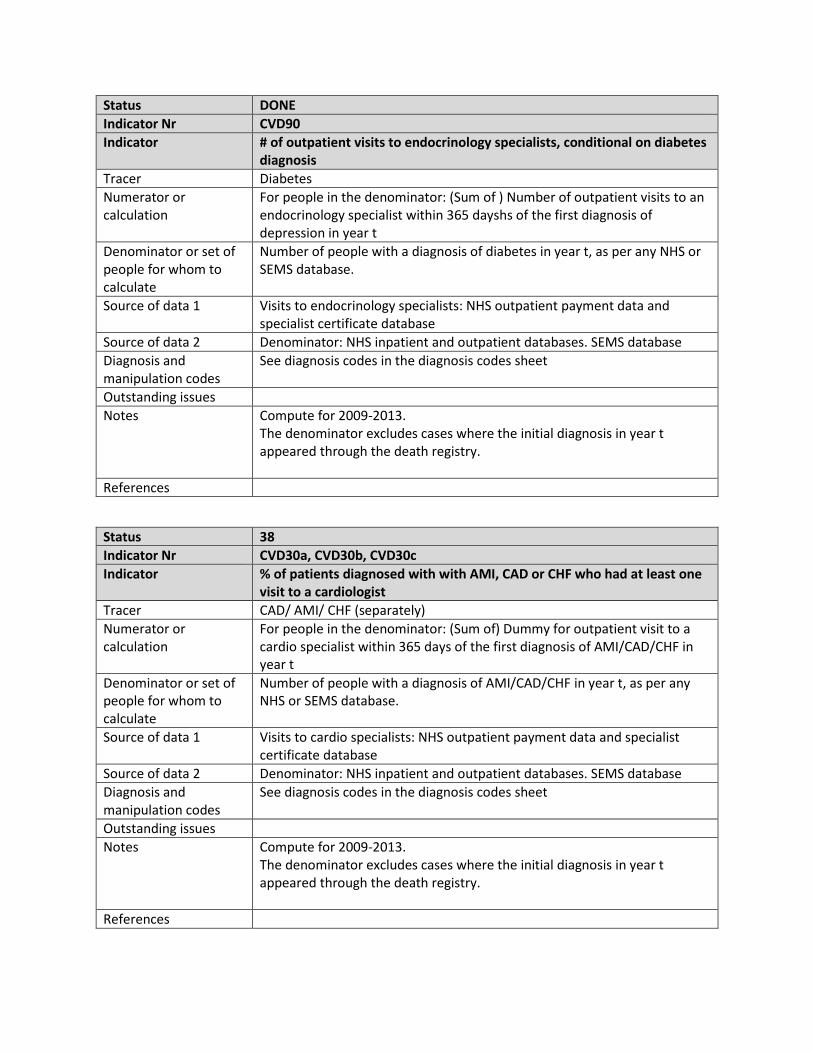
Indicator Nr CVD90
Indicator # of outpatient visits to endocrinology specialists, conditional on diabetes diagnosis
Tracer Diabetes
Numerator or calculation
For people in the denominator: (Sum of ) Number of outpatient visits to an endocrinology specialist within 365 dayshs of the first diagnosis of depression in year t
Denominator or set of people for whom to calculate
Number of people with a diagnosis of diabetes in year t, as per any NHS or SEMS database.
Source of data 1 Visits to endocrinology specialists: NHS outpatient payment data and specialist certificate database
Source of data 2 Denominator: NHS inpatient and outpatient databases. SEMS database
Diagnosis and manipulation codes
See diagnosis codes in the diagnosis codes sheet
Outstanding issues
Notes Compute for 2009-2013. The denominator excludes cases where the initial diagnosis in year t appeared through the death registry.
References
Status 38
Indicator Nr CVD30a, CVD30b, CVD30c
Indicator % of patients diagnosed with with AMI, CAD or CHF who had at least one visit to a cardiologist
Tracer CAD/ AMI/ CHF (separately)
Numerator or calculation
For people in the denominator: (Sum of) Dummy for outpatient visit to a cardio specialist within 365 days of the first diagnosis of AMI/CAD/CHF in year t
Denominator or set of people for whom to calculate
Number of people with a diagnosis of AMI/CAD/CHF in year t, as per any NHS or SEMS database.
Source of data 1 Visits to cardio specialists: NHS outpatient payment data and specialist certificate database
Source of data 2 Denominator: NHS inpatient and outpatient databases. SEMS database
Diagnosis and manipulation codes
See diagnosis codes in the diagnosis codes sheet
Outstanding issues
Notes Compute for 2009-2013. The denominator excludes cases where the initial diagnosis in year t appeared through the death registry.
References
Status DONE
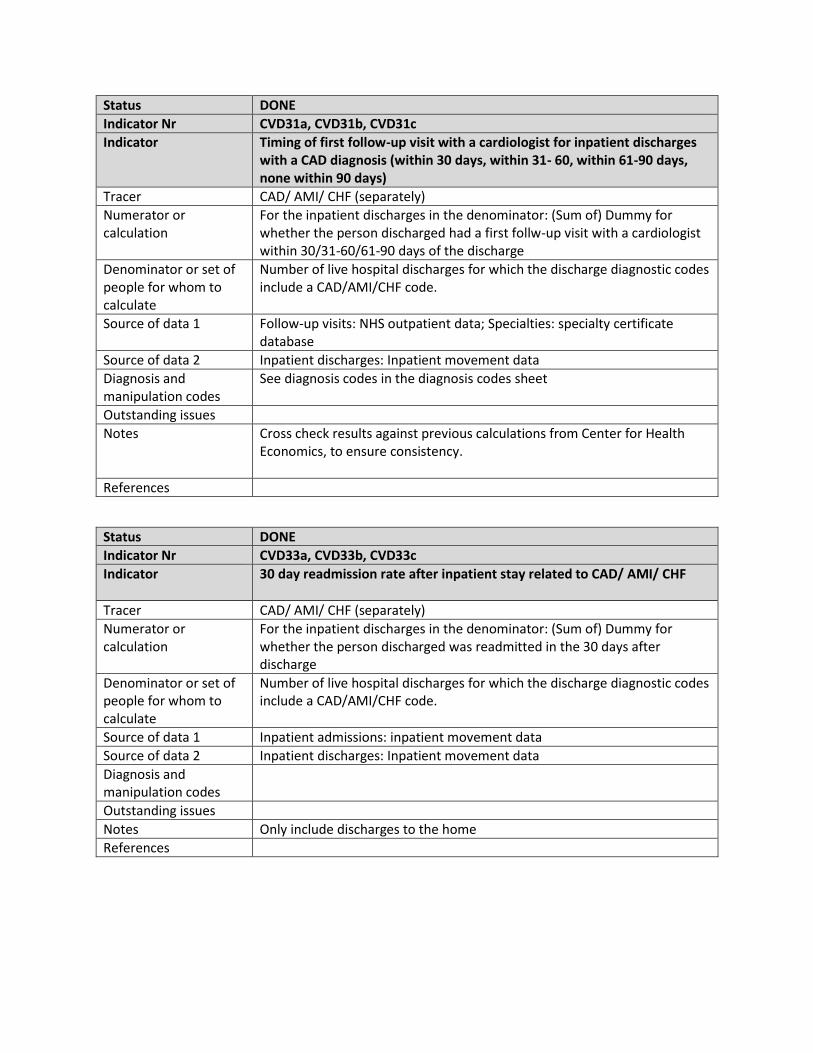
Indicator Nr CVD31a, CVD31b, CVD31c
Indicator Timing of first follow-up visit with a cardiologist for inpatient discharges with a CAD diagnosis (within 30 days, within 31- 60, within 61-90 days, none within 90 days)
Tracer CAD/ AMI/ CHF (separately)
Numerator or calculation
For the inpatient discharges in the denominator: (Sum of) Dummy for whether the person discharged had a first follw-up visit with a cardiologist within 30/31-60/61-90 days of the discharge
Denominator or set of people for whom to calculate
Number of live hospital discharges for which the discharge diagnostic codes include a CAD/AMI/CHF code.
Source of data 1 Follow-up visits: NHS outpatient data; Specialties: specialty certificate database
Source of data 2 Inpatient discharges: Inpatient movement data
Diagnosis and manipulation codes
See diagnosis codes in the diagnosis codes sheet
Outstanding issues
Notes Cross check results against previous calculations from Center for Health Economics, to ensure consistency.
References
Status DONE
Indicator Nr CVD33a, CVD33b, CVD33c
Indicator 30 day readmission rate after inpatient stay related to CAD/ AMI/ CHF
Tracer CAD/ AMI/ CHF (separately)
Numerator or calculation
For the inpatient discharges in the denominator: (Sum of) Dummy for whether the person discharged was readmitted in the 30 days after discharge
Denominator or set of people for whom to calculate
Number of live hospital discharges for which the discharge diagnostic codes include a CAD/AMI/CHF code.
Source of data 1 Inpatient admissions: inpatient movement data
Source of data 2 Inpatient discharges: Inpatient movement data
Diagnosis and manipulation codes
Outstanding issues
Notes Only include discharges to the home
References
Status DONE
Indicator Nr CVD35
Indicator Patient-based AMI 30 day (in hospital and out-of-hospital) mortality
Tracer AMI
Numerator or calculation
For the inpatient admissions in the denominator: (Sum of) Dummy for whether the patient died between the date of the admission and the date of the admission+30
Denominator or set of people for whom to calculate
Number of patients admitted in year t for which the admission diagnostic codes includes an AMI.
Source of data 1 Mortality: person list with date of death
Source of data 2 Inpatient discharges: Inpatient movement data
Diagnosis and manipulation codes
See diagnosis codes in the diagnosis codes sheet
Outstanding issues This indicator uses admission diagnostic. There is some lack of overlap between codes at admission and discharge.
Notes For 2014: do not include admissions that happened after November 30, 2014 The year (t) corresponds to the year of admission This is based on the OECD indicator for the same - OECD average 9.5% (OECD Health at a Glance 2015 for 2013).
References
Status DONE
Indicator Nr CVD36
Indicator Patient-based hemorrhagic stroke 30 day (in hospital and out-of-hospital) mortality
Tracer Hemorrhagic stroke
Numerator or calculation
For the inpatient admissions in the denominator: (Sum of) Dummy for whether the patient died between the date of the admission and the date of the admission+30
Denominator or set of people for whom to calculate
Number of patients admitted in year t for which the admission diagnostic codes includes a hemorrhagic stroke.
Source of data 1 Mortality: person list with date of death
Source of data 2 Inpatient discharges: Inpatient movement data
Diagnosis and manipulation codes
See diagnosis codes in the diagnosis codes sheet
Outstanding issues This indicator uses admission diagnostic. There is some lack of overlap between codes at admission and discharge.
Notes For 2014: do not include admissions that happened after November 30, 2014 The year (t) corresponds to the year of admission.
This indicator was computed using a version of the inpatient episodes database that has major cleanup.
References
Status DONE
Indicator Nr CVD39
Indicator Patient-based ischemic stroke 30 day (in hospital and out-of-hospital) mortality
Tracer Ischemic stroke
Numerator or calculation
For the inpatient admissions in the denominator: (Sum of) Dummy for whether the patient died between the date of the admission and the date of the admission+30
Denominator or set of people for whom to calculate
Number of patients admitted in year t for which the admission diagnostic codes includes an Ischemic stroke.
Source of data 1 Mortality: person list with date of death
Source of data 2 Inpatient discharges: Inpatient movement data
Diagnosis and manipulation codes
See diagnosis codes in the diagnosis codes sheet
Outstanding issues This indicator uses admission diagnostic. There is some lack of overlap between codes at admission and discharge.
Notes For 2014: do not include admissions that happened after November 30, 2014 The year (t) corresponds to the year of admission This is based on the OECD indicator for the same - OECD average 10.1 % (Health at a glance 2015 for 2013)
References
Status DONE
Indicator Nr CVD37
Indicator Timing of first follow-up visit with a neurologist for inpatient discharges with a stroke diagnosis (within 30 days, within 31- 60, within 61-90 days, none within 90 days)
Tracer Stroke (Hemorrhagic and ischemic)
Numerator or calculation
For the inpatient discharges in the denominator: (Sum of) Dummy for whether the person discharged had a first visit with a neurologist within 30/31-60/61-90 days of the discharge
Denominator or set of people for whom to calculate
Number of live hospital discharges for which the discharge diagnostic codes include a stroke code.
Source of data 1 Follow-up visits: NHS outpatient data; Specialties: specialty certificate database
Source of data 2 Inpatient discharges: Inpatient movement data
Diagnosis and manipulation codes
See diagnosis codes in the diagnosis codes sheet
Outstanding issues
Notes Model on M27
References
Status DONE
Indicator Nr CVD40
Indicator Percentage of inpatient admissions with stroke diagnosis for which patient received a CT can on day of admission or next day
Tracer Stroke
Numerator or calculation
For the inpatient admissions in the denominator: (Sum of) dummy for whether the patient received a CT scan on the day of admission or on the next day
Denominator or set of people for whom to calculate
Number of hospital admissions for which the admission diagnostic code includes a stroke code
Source of data 1 Numerator: CT scans: NHS inpatient manipulation data
Source of data 2 Denominator: Inpatient admissions: inpatient movement data
Diagnosis and manipulation codes
See diagnosis codes in the diagnosis codes sheet; see manipulation codes in the manipulations code sheet
Outstanding issues
Notes Assumes Date entered for CT scan manipulation is accurate - so it reflects the date of the procedure, and not the time of recording of the procedure.
References
Status DONE
Indicator Nr CVD41
Indicator Discharge to usual place of residence within 56 days of hospital admission (age 50+)
Tracer Stroke
Numerator or calculation
For the inpatient admissions in the denominator: (Sum of) Dummy for whether the patient was discharged by day of admission +56
Denominator or set of people for whom to calculate
Number of hospital admissions for which the admission diagnostic code includes a stroke code and for which the patient year of birth <= year of admission-50
Source of data 1 Inpatient admissions: inpatient movement data
Source of data 2 Inpatient discharges: Inpatient movement data
Diagnosis and manipulation codes
See diagnosis codes in the diagnosis codes sheet
Outstanding issues Of the patients that were discharged with a stroke code, only 56 percent had a stroke code at admission
Notes This indicator uses a cleaned up version of the inpatient episode ifnromation. About 3% of stroke related episodes were dropped due to inconsistent discharge date and/or code information.
References
Status DONE
Indicator Nr C01
Indicator % of women aged 20 and older receiving annual well check, separately by year.
Tracer Breast cancer
Numerator or calculation
Women who turned 20+ in year t-1 receiving general health check or ob/gyn cancer screening in year t
Denominator or set of people for whom to calculate
Women aged 20+ in t-1
Source of data 1 NHS outpatient databases: - outpatient record database for diagnosis codes, and manipulation database for manipulation codes.
Source of data 2 Women database
Diagnosis and manipulation codes
Manipulation codes: general health checks and ob/gyn screenings in screening exams. The following manipulation codes were excluded: Consultation on healthy lifestyle in patients with DM II, CAD, HTN, COPD, Smoking) 60231 OB/GYN care of pregnant woman 01070, Midwives care of pregnant woman 01029, Family Doctor's care of pregnant woman 01062. Diagnosis codes: All wellness codes except for cervical smear and eye exam. A new wellness condition was defined and coded as wellnessbc_precise "Z00 Z00.0 Z00.00 Z00.01 Z00.8 Z01" global wellnessbc_bucket "Z01.3 Z01.4 Z01.41" within the do file
Outstanding issues
Notes Compute for 2009 -2014. We excluded women aged 99+ (around 0.01% of total women aged 20+) Denominator includes only alive women at the time of the indicator is computed. If the women died the previous year, it does not count in the denominator. If the women died during the year of the manipulation/diagnosis, it does count for the denominator. We merged the women list separately into the records database (to look for diagnosis codes) and the manipulations database (to look for manipulation codes). The data available excludes well checks that were privately financed.
References
Status DONE
Indicator Nr C02
Indicator % of women aged 50-69 receiving 2 -yearly screening mammograms,
Tracer Breast cancer
Numerator or calculation
Number of women age 51 to 69 in year t who had a mammogram in t or t-1
Denominator or set of people for whom to calculate
Total women aged 51-69 in year t
Source of data 1 NHS outpatient databases: manipulation database.
Source of data 2 Women database
Diagnosis and manipulation codes
Manipulation codes: Mammography in other diagnostics
Outstanding issues
Notes Compute for 2010-2014. Denominator includes only alive women at the time of the indicator is computed. If the women died the previous year, it does not count in the denominator. If the women died during the year of the manipulation/diagnosis, it does count for the denominator. We merged the women list into the manipulations database (to look for the relevant manipulation codes) OECD uses country specific guidelines in order to calculate this indicator. The data available excludes privately financed mammograms (private facilities or over-quota situations).
References http://www.oecd-ilibrary.org/docserver/download/8112121ec047.pdf?expires=1460136579&id=id&accname=guest&checksum=EA4C867E103BC33C7BB2ABAB858842FE definition used by OECD is based on the definition used in each country. According to OECD report for 2000-2010 in Latvia is 0.417 using survey data. See Graph 4.8.1
Status DONE
Indicator Nr C03
Indicator % of women sent a mammogram invitation letters in year t, who receive a mammogram within 12 months from sending of the letter.
Tracer Breast cancer
Numerator or calculation
Women sent a breast cancer invitation letter on date d in year t and receive a mammogram by d+12 months
Denominator or set of people for whom to calculate
Women sent a breast cancer invitation letter in year t
Source of data 1 NHS outpatient manipulation database: mammogram codes NHS outpatient record database: start date of the outpatient record
Source of data 2
Diagnosis and manipulation codes
Manipulation codes: Mammography in other diagnostics
Outstanding issues
Notes Compute for 2009-2013 We merged the list of (PID/year) from invitation database into the outpatient manipulation database. we merged it into the records database (using opr_id) to extract the start date of the outpatient episode. We compared dates of sending letters and start date of the outpatient record. The data available excludes privately financed mammograms (private facilities or over-quota situations).
References
Status DONE
Indicator Nr C03_1
Indicator % of women sent a mammogram invitation letter in year t (i) who receive a mammogram 12 months after the sending of the letter (ii) who receive a mammogram 12 months before the sending of the letter (iii) who do not receive a mammogram 12 months before or 12 months after the sending of the letter
Tracer Breast cancer
Numerator or calculation
Women sent a breast cancer invitation letter on date d in year t and receive a mammogram by (i) d+12 months, (ii)by d-12 months, or (iii) who do not receive a mammogram by d+12 months or d-12 months
Denominator or set of people for whom to calculate
Women sent a breast cancer invitation letter in year t
Source of data 1 NHS outpatient manipulation database: mammogram codes
NHS outpatient record database: start date of the outpatient record
Source of data 2 Database of letters for breast cancer screening
Diagnosis and manipulation codes
Manipulation codes: Mammography in other diagnostics
Outstanding issues
Notes Compute for 2010-2013. Categories of the indicator should add up to 100%. We merged the list of (PID/year) from invitation database into the outpatient manipulation database. we merged it into the records database (using opr_id) to extract the start date of the outpatient episode. We compared dates of sending letters and start date of the outpatient record. The data available excludes privately financed mammograms (private facilities or over-quota situations).
References
Status DONE
Indicator Nr C05
Indicator Percentage of breast cancers diagnosed at Stage s= 0, I, II, III, IV, Unknown, Unavailable separately by year for 2011, 2012, 2013
Tracer Breast cancer
Numerator or calculation
Breast cancer cases diagnosed in year t at stage s or unkonwn or unavailable
Denominator or set of people for whom to calculate
Persons with first diagnosis of breast cancer in year t, conditional on not having the same diagnosis in the previous 24 months
Source of data 1 Staging : Cancer registry.
Source of data 2 People : Constructed database on patients with dates of diagnosis and source of data.
Diagnosis and manipulation codes
Diagnosis: breastcancer confirmed
Outstanding issues
Notes Compute for 2011-2013. Years 2009 and 2010 are missing because we need 24 month lead to initial diagnosis . We excluded diagnoses made through the death registry. Around 70% of patients with first diagnosis of breast cancer (confirmed) in year t were not found in cancer registry in year t. Date of diagnosis in cancer registry is not precise. Also, it is not clear if date in cancer registry refers to first date of diagnosis. Note that in year 2014 numbers of observations in the cancer registry dramatically declined since August onwards.
We merged datasets (by PID and by year of diagnosis). If person with diagnosis is not in cancer registry, we set staging to "unavailable". Note that in order to merge stages of cancer from cancer registry with list of people first diagnosis with cancer (in a given year) we used year of diagnosis and PID variables. Whitin a given year, the same patient could have more than one stage. We considered only the first stage occurred in that year.
References Benchmark countries (stage I): Canada (43.9%) Denmark (30.1%) Norway (44.5%) Sweden (45.2%) Source: http://www.nature.com/bjc/journal/v108/n5/full/bjc20136a.html
Status DONE
Indicator Nr C06
Indicator % of initial diagnoses occuring in place p= outpatient, inpatient, SEMS, postmortem setting, separately by year.
Tracer Breast cancer
Numerator or calculation
First diagnosis breast cancer cases in place p in year t, conditional on not having the same diagnosis in the previous 24 months
Denominator or set of people for whom to calculate
First diagnosis breast cancer cases in year t, conditional on not having the same diagnosis in the previous 24 months
Source of data 1 Constructed database on patients with dates of diagnosis and source of data.
Source of data 2
Diagnosis and manipulation codes
Diagnosis: breastcancer confirmed
Outstanding issues
Notes Compute for 2011-2014. Years 2009 and 2010 are missing because we need 24 month lead to initial diagnosis . If patients go to non-NHS paid services for diagnosis/biopsy, they might show up for the first time in NHS records with a cancer diagnosis at the time of treatment.
References
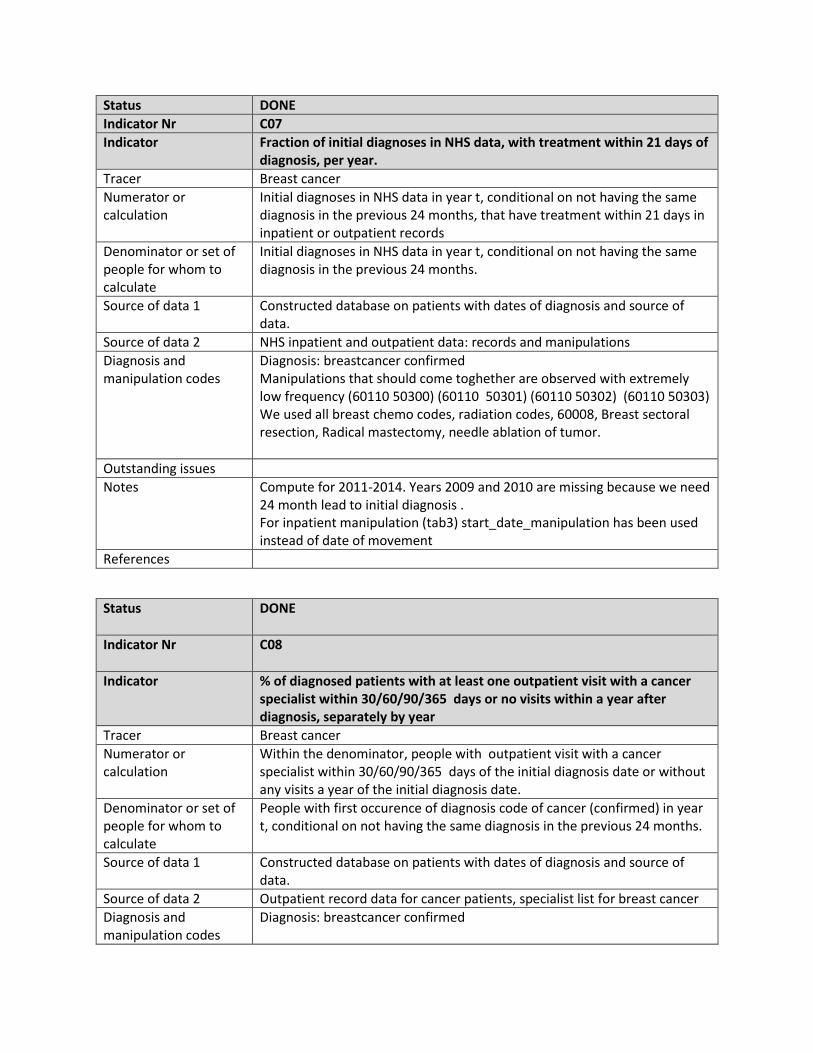
Status DONE
Indicator Nr C07
Indicator Fraction of initial diagnoses in NHS data, with treatment within 21 days of diagnosis, per year.
Tracer Breast cancer
Numerator or calculation
Initial diagnoses in NHS data in year t, conditional on not having the same diagnosis in the previous 24 months, that have treatment within 21 days in inpatient or outpatient records
Denominator or set of people for whom to calculate
Initial diagnoses in NHS data in year t, conditional on not having the same diagnosis in the previous 24 months.
Source of data 1 Constructed database on patients with dates of diagnosis and source of data.
Source of data 2 NHS inpatient and outpatient data: records and manipulations
Diagnosis and manipulation codes
Diagnosis: breastcancer confirmed Manipulations that should come toghether are observed with extremely low frequency (60110 50300) (60110 50301) (60110 50302) (60110 50303) We used all breast chemo codes, radiation codes, 60008, Breast sectoral resection, Radical mastectomy, needle ablation of tumor.
Outstanding issues
Notes Compute for 2011-2014. Years 2009 and 2010 are missing because we need 24 month lead to initial diagnosis . For inpatient manipulation (tab3) start_date_manipulation has been used instead of date of movement
References
Status DONE
Indicator Nr C08
Indicator % of diagnosed patients with at least one outpatient visit with a cancer specialist within 30/60/90/365 days or no visits within a year after diagnosis, separately by year
Tracer Breast cancer
Numerator or calculation
Within the denominator, people with outpatient visit with a cancer specialist within 30/60/90/365 days of the initial diagnosis date or without any visits a year of the initial diagnosis date.
Denominator or set of people for whom to calculate
People with first occurence of diagnosis code of cancer (confirmed) in year t, conditional on not having the same diagnosis in the previous 24 months.
Source of data 1 Constructed database on patients with dates of diagnosis and source of data.
Source of data 2 Outpatient record data for cancer patients, specialist list for breast cancer
Diagnosis and manipulation codes
Diagnosis: breastcancer confirmed
Outstanding issues
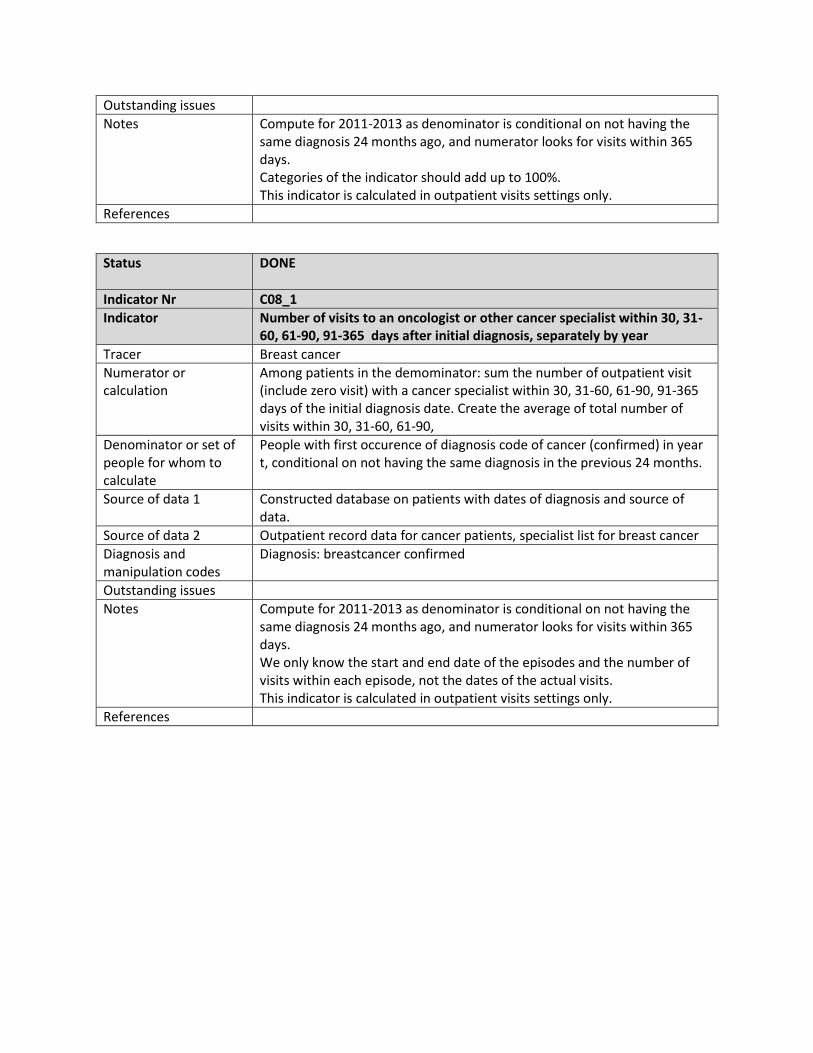
Notes Compute for 2011-2013 as denominator is conditional on not having the same diagnosis 24 months ago, and numerator looks for visits within 365 days. Categories of the indicator should add up to 100%. This indicator is calculated in outpatient visits settings only.
References
Status DONE
Indicator Nr C08_1
Indicator Number of visits to an oncologist or other cancer specialist within 30, 31-60, 61-90, 91-365 days after initial diagnosis, separately by year
Tracer Breast cancer
Numerator or calculation
Among patients in the demominator: sum the number of outpatient visit (include zero visit) with a cancer specialist within 30, 31-60, 61-90, 91-365 days of the initial diagnosis date. Create the average of total number of visits within 30, 31-60, 61-90,
Denominator or set of people for whom to calculate
People with first occurence of diagnosis code of cancer (confirmed) in year t, conditional on not having the same diagnosis in the previous 24 months.
Source of data 1 Constructed database on patients with dates of diagnosis and source of data.
Source of data 2 Outpatient record data for cancer patients, specialist list for breast cancer
Diagnosis and manipulation codes
Diagnosis: breastcancer confirmed
Outstanding issues
Notes Compute for 2011-2013 as denominator is conditional on not having the same diagnosis 24 months ago, and numerator looks for visits within 365 days. We only know the start and end date of the episodes and the number of visits within each episode, not the dates of the actual visits. This indicator is calculated in outpatient visits settings only.
References
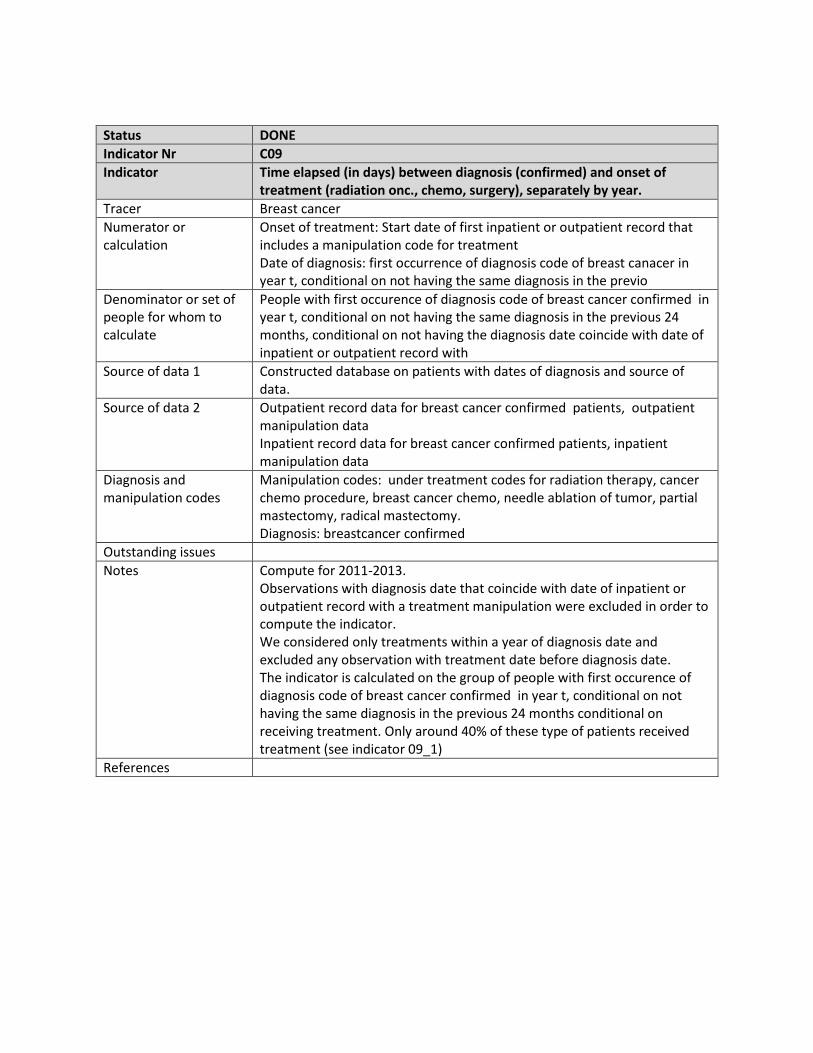
Status DONE
Indicator Nr C09
Indicator Time elapsed (in days) between diagnosis (confirmed) and onset of treatment (radiation onc., chemo, surgery), separately by year.
Tracer Breast cancer
Numerator or calculation
Onset of treatment: Start date of first inpatient or outpatient record that includes a manipulation code for treatment Date of diagnosis: first occurrence of diagnosis code of breast canacer in year t, conditional on not having the same diagnosis in the previo
Denominator or set of people for whom to calculate
People with first occurence of diagnosis code of breast cancer confirmed in year t, conditional on not having the same diagnosis in the previous 24 months, conditional on not having the diagnosis date coincide with date of inpatient or outpatient record with
Source of data 1 Constructed database on patients with dates of diagnosis and source of data.
Source of data 2 Outpatient record data for breast cancer confirmed patients, outpatient manipulation data Inpatient record data for breast cancer confirmed patients, inpatient manipulation data
Diagnosis and manipulation codes
Manipulation codes: under treatment codes for radiation therapy, cancer chemo procedure, breast cancer chemo, needle ablation of tumor, partial mastectomy, radical mastectomy. Diagnosis: breastcancer confirmed
Outstanding issues
Notes Compute for 2011-2013. Observations with diagnosis date that coincide with date of inpatient or outpatient record with a treatment manipulation were excluded in order to compute the indicator. We considered only treatments within a year of diagnosis date and excluded any observation with treatment date before diagnosis date. The indicator is calculated on the group of people with first occurence of diagnosis code of breast cancer confirmed in year t, conditional on not having the same diagnosis in the previous 24 months conditional on receiving treatment. Only around 40% of these type of patients received treatment (see indicator 09_1)
References
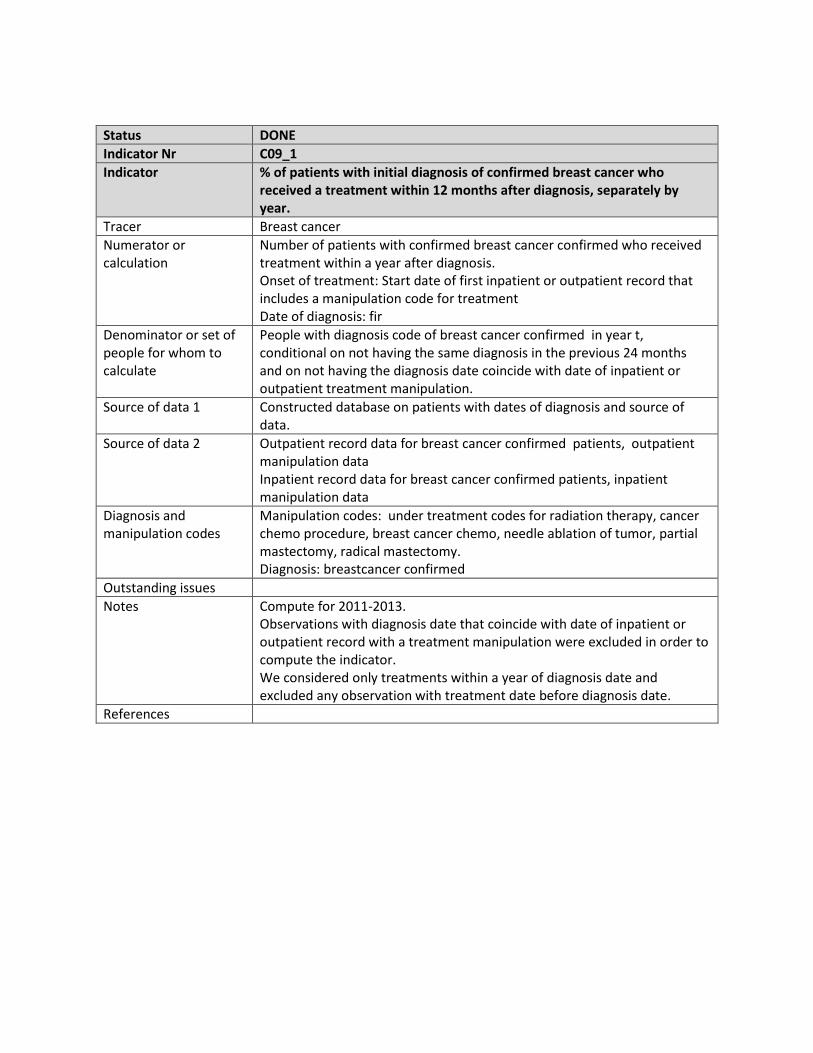
Status DONE
Indicator Nr C09_1
Indicator % of patients with initial diagnosis of confirmed breast cancer who received a treatment within 12 months after diagnosis, separately by year.
Tracer Breast cancer
Numerator or calculation
Number of patients with confirmed breast cancer confirmed who received treatment within a year after diagnosis. Onset of treatment: Start date of first inpatient or outpatient record that includes a manipulation code for treatment Date of diagnosis: fir
Denominator or set of people for whom to calculate
People with diagnosis code of breast cancer confirmed in year t, conditional on not having the same diagnosis in the previous 24 months and on not having the diagnosis date coincide with date of inpatient or outpatient treatment manipulation.
Source of data 1 Constructed database on patients with dates of diagnosis and source of data.
Source of data 2 Outpatient record data for breast cancer confirmed patients, outpatient manipulation data Inpatient record data for breast cancer confirmed patients, inpatient manipulation data
Diagnosis and manipulation codes
Manipulation codes: under treatment codes for radiation therapy, cancer chemo procedure, breast cancer chemo, needle ablation of tumor, partial mastectomy, radical mastectomy. Diagnosis: breastcancer confirmed
Outstanding issues
Notes Compute for 2011-2013. Observations with diagnosis date that coincide with date of inpatient or outpatient record with a treatment manipulation were excluded in order to compute the indicator. We considered only treatments within a year of diagnosis date and excluded any observation with treatment date before diagnosis date.
References
Status DONE
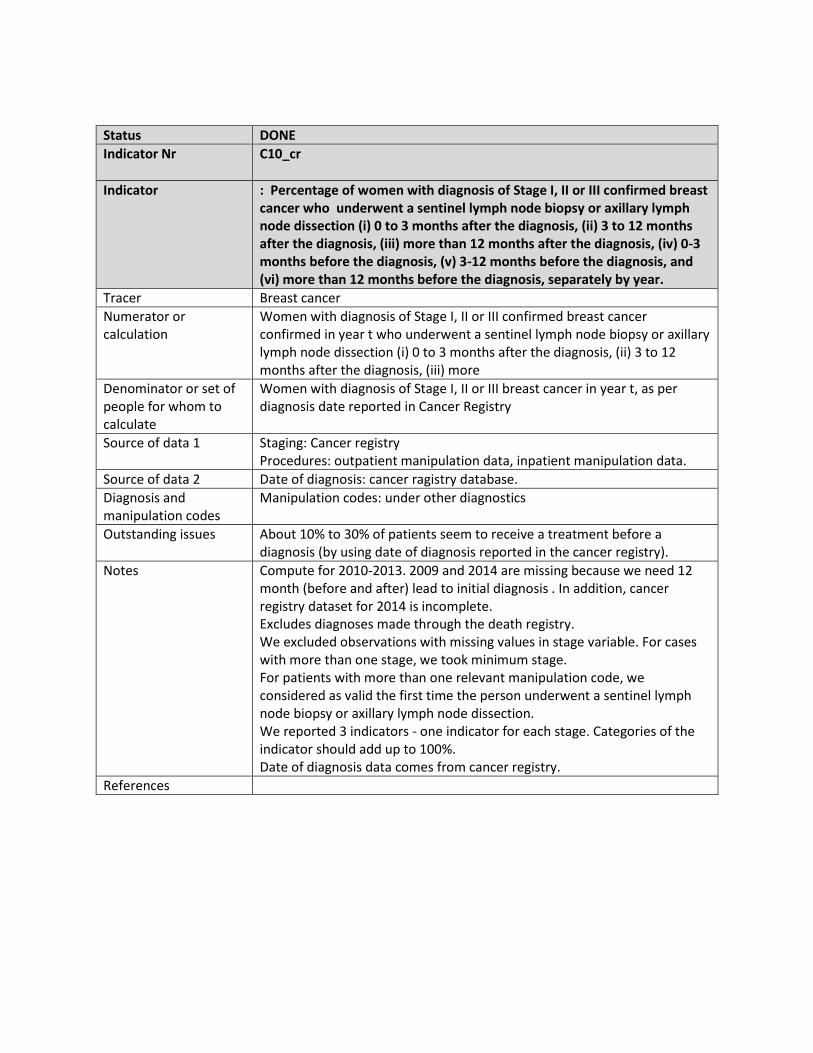
Indicator Nr C10_cr
Indicator : Percentage of women with diagnosis of Stage I, II or III confirmed breast cancer who underwent a sentinel lymph node biopsy or axillary lymph node dissection (i) 0 to 3 months after the diagnosis, (ii) 3 to 12 months after the diagnosis, (iii) more than 12 months after the diagnosis, (iv) 0-3 months before the diagnosis, (v) 3-12 months before the diagnosis, and (vi) more than 12 months before the diagnosis, separately by year.
Tracer Breast cancer
Numerator or calculation
Women with diagnosis of Stage I, II or III confirmed breast cancer confirmed in year t who underwent a sentinel lymph node biopsy or axillary lymph node dissection (i) 0 to 3 months after the diagnosis, (ii) 3 to 12 months after the diagnosis, (iii) more
Denominator or set of people for whom to calculate
Women with diagnosis of Stage I, II or III breast cancer in year t, as per diagnosis date reported in Cancer Registry
Source of data 1 Staging: Cancer registry Procedures: outpatient manipulation data, inpatient manipulation data.
Source of data 2 Date of diagnosis: cancer ragistry database.
Diagnosis and manipulation codes
Manipulation codes: under other diagnostics
Outstanding issues About 10% to 30% of patients seem to receive a treatment before a diagnosis (by using date of diagnosis reported in the cancer registry).
Notes Compute for 2010-2013. 2009 and 2014 are missing because we need 12 month (before and after) lead to initial diagnosis . In addition, cancer registry dataset for 2014 is incomplete. Excludes diagnoses made through the death registry. We excluded observations with missing values in stage variable. For cases with more than one stage, we took minimum stage. For patients with more than one relevant manipulation code, we considered as valid the first time the person underwent a sentinel lymph node biopsy or axillary lymph node dissection. We reported 3 indicators - one indicator for each stage. Categories of the indicator should add up to 100%. Date of diagnosis data comes from cancer registry.
References
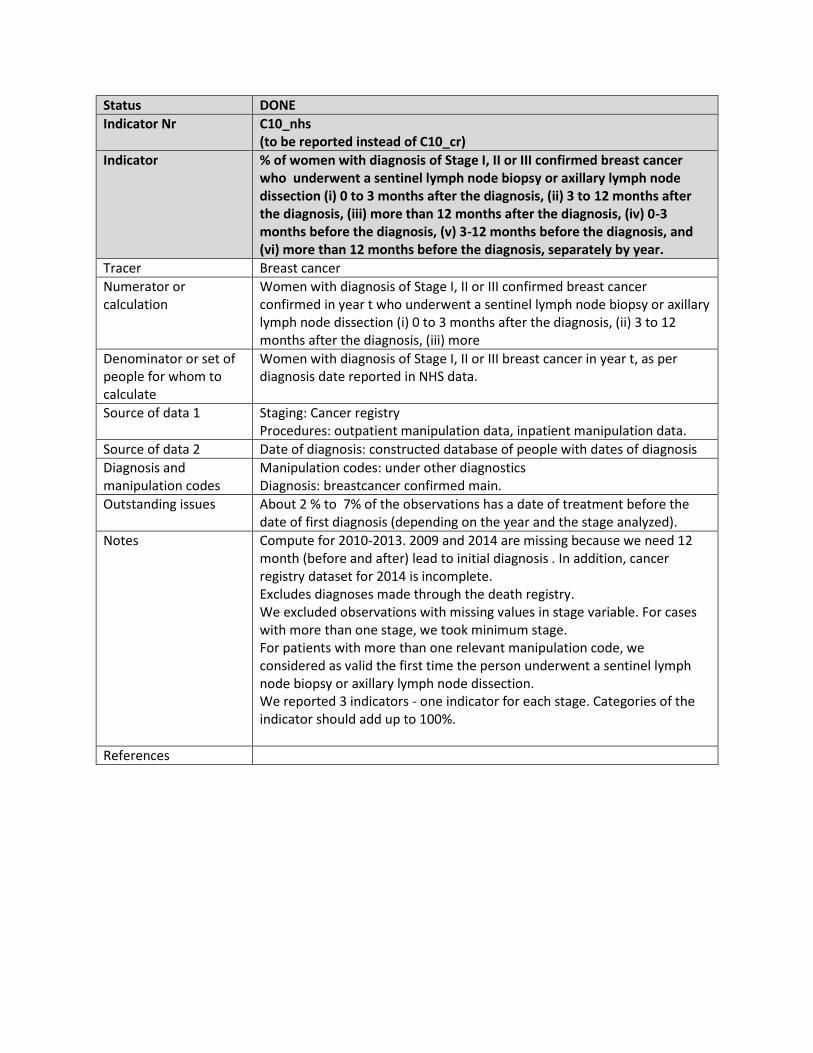
Status DONE
Indicator Nr C10_nhs (to be reported instead of C10_cr)
Indicator % of women with diagnosis of Stage I, II or III confirmed breast cancer who underwent a sentinel lymph node biopsy or axillary lymph node dissection (i) 0 to 3 months after the diagnosis, (ii) 3 to 12 months after the diagnosis, (iii) more than 12 months after the diagnosis, (iv) 0-3 months before the diagnosis, (v) 3-12 months before the diagnosis, and (vi) more than 12 months before the diagnosis, separately by year.
Tracer Breast cancer
Numerator or calculation
Women with diagnosis of Stage I, II or III confirmed breast cancer confirmed in year t who underwent a sentinel lymph node biopsy or axillary lymph node dissection (i) 0 to 3 months after the diagnosis, (ii) 3 to 12 months after the diagnosis, (iii) more
Denominator or set of people for whom to calculate
Women with diagnosis of Stage I, II or III breast cancer in year t, as per diagnosis date reported in NHS data.
Source of data 1 Staging: Cancer registry Procedures: outpatient manipulation data, inpatient manipulation data.
Source of data 2 Date of diagnosis: constructed database of people with dates of diagnosis
Diagnosis and manipulation codes
Manipulation codes: under other diagnostics Diagnosis: breastcancer confirmed main.
Outstanding issues About 2 % to 7% of the observations has a date of treatment before the date of first diagnosis (depending on the year and the stage analyzed).
Notes Compute for 2010-2013. 2009 and 2014 are missing because we need 12 month (before and after) lead to initial diagnosis . In addition, cancer registry dataset for 2014 is incomplete. Excludes diagnoses made through the death registry. We excluded observations with missing values in stage variable. For cases with more than one stage, we took minimum stage. For patients with more than one relevant manipulation code, we considered as valid the first time the person underwent a sentinel lymph node biopsy or axillary lymph node dissection. We reported 3 indicators - one indicator for each stage. Categories of the indicator should add up to 100%.
References

Appendix 3:
Status DONE
Indicator Nr C12
Indicator Location of breast cancer patient deaths (hospital, home, hospice, other)
Tracer Breast cancer
Numerator or calculation
Number of deaths where the diagnosis code for cause of death is C50(bucket) in the death registry [diag_code_cause_death] , by location L [place_death], in year t
Denominator or set of people for whom to calculate
Number of deaths where the diagnosis code for cause of death is C50 (bucket) in the death registry, in year t
Source of data 1 Death registry
Source of data 2
Diagnosis and manipulation codes
Diagnosis: breastcancer confirmed main
Outstanding issues
Notes Compute for 2009-2014. Categories of the indicator should add up to 100%. Cases with missing values in death year or place of death were excluded from the analysis (0.5% of total deaths)
References
Status DONE
Indicator Nr C13
Indicator For inpatient deaths: Percentage of days spent as inpatient in the 30/60/90 days prior to death
Tracer Breast cancer
Numerator or calculation
For the patients in the denominator: number of days spent as an inpatient within the 30/60/90 days before death, divided by 30/60/90
Denominator or set of people for whom to calculate
Number of patients who died in the hospital and had a breast cancer diagnosis code in the "dead" movement
Source of data 1 NHS inpatient records and movements for breast cancer patients
Source of data 2
Diagnosis and manipulation codes
Diagnosis: breastcancer confirmed main
Outstanding issues This is complicated to compute: many admissions are not real admissions but correspond to a fictitious checkout - however, in the data there is no link between the fictitious checkout and the ensuing fictitious admission
Notes Compute for 2009-2014. We identified those ipr where one of the movements activity code is "dead". We also identified those movement records that are for a person who eventually died and that are within 30/60/90 days of death.
Per patient: we count the number of admissions (as in code_movement admissions) minus the number of fictitious checkouts. This is because after a fictitious checkout, there is an admission which is not coded as a fictitious admission but rather as a regular admission. If patient admission is the same day of death, is count as 1 day.
References
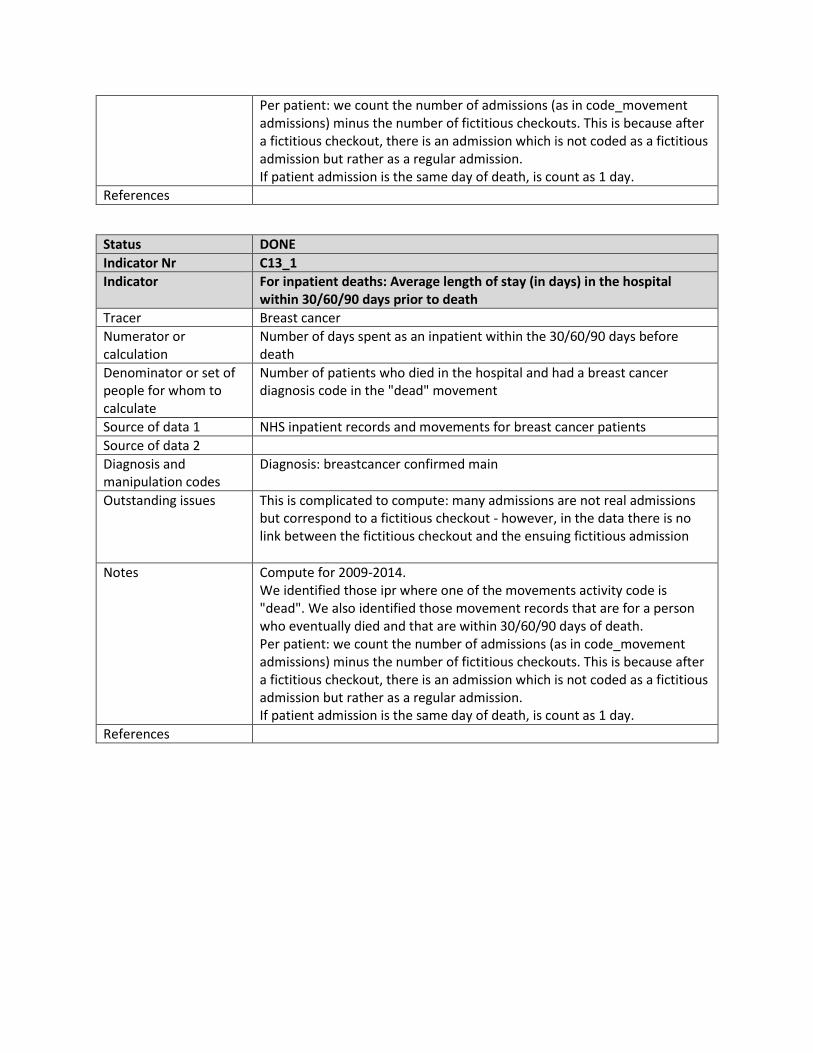
Status DONE
Indicator Nr C13_1
Indicator For inpatient deaths: Average length of stay (in days) in the hospital within 30/60/90 days prior to death
Tracer Breast cancer
Numerator or calculation
Number of days spent as an inpatient within the 30/60/90 days before death
Denominator or set of people for whom to calculate
Number of patients who died in the hospital and had a breast cancer diagnosis code in the "dead" movement
Source of data 1 NHS inpatient records and movements for breast cancer patients
Source of data 2
Diagnosis and manipulation codes
Diagnosis: breastcancer confirmed main
Outstanding issues This is complicated to compute: many admissions are not real admissions but correspond to a fictitious checkout - however, in the data there is no link between the fictitious checkout and the ensuing fictitious admission
Notes Compute for 2009-2014. We identified those ipr where one of the movements activity code is "dead". We also identified those movement records that are for a person who eventually died and that are within 30/60/90 days of death. Per patient: we count the number of admissions (as in code_movement admissions) minus the number of fictitious checkouts. This is because after a fictitious checkout, there is an admission which is not coded as a fictitious admission but rather as a regular admission. If patient admission is the same day of death, is count as 1 day.
References
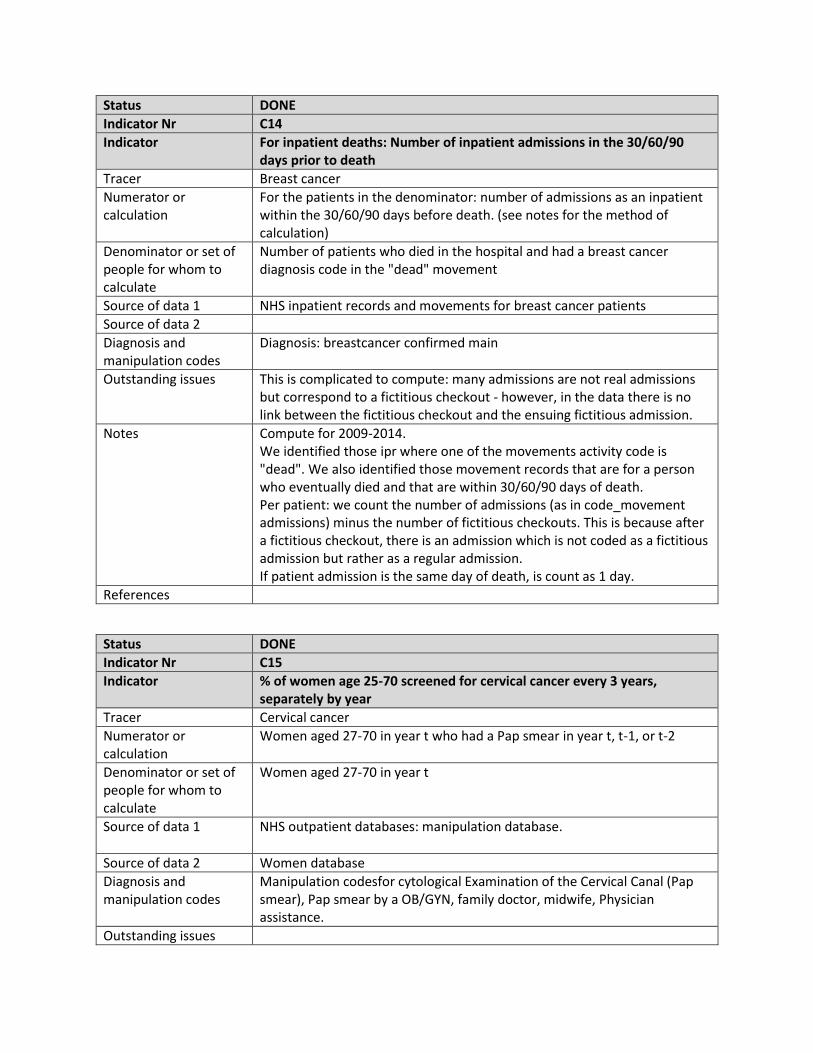
Status DONE
Indicator Nr C14
Indicator For inpatient deaths: Number of inpatient admissions in the 30/60/90 days prior to death
Tracer Breast cancer
Numerator or calculation
For the patients in the denominator: number of admissions as an inpatient within the 30/60/90 days before death. (see notes for the method of calculation)
Denominator or set of people for whom to calculate
Number of patients who died in the hospital and had a breast cancer diagnosis code in the "dead" movement
Source of data 1 NHS inpatient records and movements for breast cancer patients
Source of data 2
Diagnosis and manipulation codes
Diagnosis: breastcancer confirmed main
Outstanding issues This is complicated to compute: many admissions are not real admissions but correspond to a fictitious checkout - however, in the data there is no link between the fictitious checkout and the ensuing fictitious admission.
Notes Compute for 2009-2014. We identified those ipr where one of the movements activity code is "dead". We also identified those movement records that are for a person who eventually died and that are within 30/60/90 days of death. Per patient: we count the number of admissions (as in code_movement admissions) minus the number of fictitious checkouts. This is because after a fictitious checkout, there is an admission which is not coded as a fictitious admission but rather as a regular admission. If patient admission is the same day of death, is count as 1 day.
References
Status DONE
Indicator Nr C15
Indicator % of women age 25-70 screened for cervical cancer every 3 years, separately by year
Tracer Cervical cancer
Numerator or calculation
Women aged 27-70 in year t who had a Pap smear in year t, t-1, or t-2
Denominator or set of people for whom to calculate
Women aged 27-70 in year t
Source of data 1 NHS outpatient databases: manipulation database.
Source of data 2 Women database
Diagnosis and manipulation codes
Manipulation codesfor cytological Examination of the Cervical Canal (Pap smear), Pap smear by a OB/GYN, family doctor, midwife, Physician assistance.
Outstanding issues

Notes Compute for 2011-2014.
References
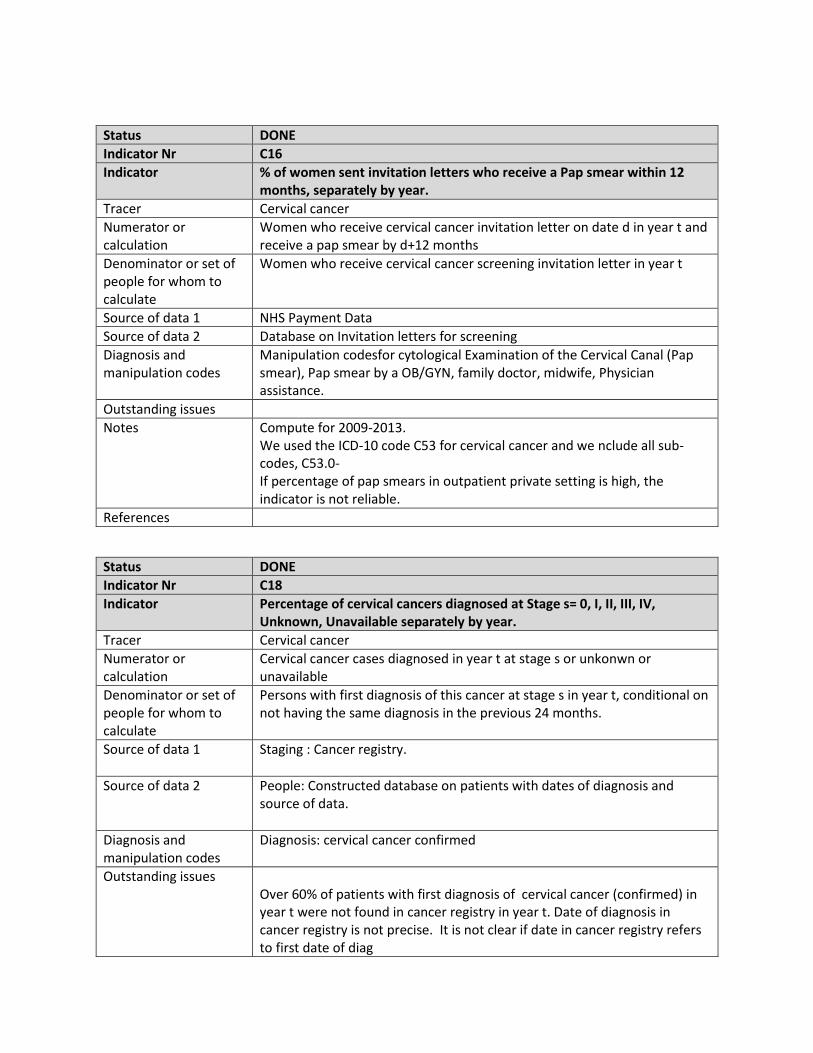
Status DONE
Indicator Nr C16
Indicator % of women sent invitation letters who receive a Pap smear within 12 months, separately by year.
Tracer Cervical cancer
Numerator or calculation
Women who receive cervical cancer invitation letter on date d in year t and receive a pap smear by d+12 months
Denominator or set of people for whom to calculate
Women who receive cervical cancer screening invitation letter in year t
Source of data 1 NHS Payment Data
Source of data 2 Database on Invitation letters for screening
Diagnosis and manipulation codes
Manipulation codesfor cytological Examination of the Cervical Canal (Pap smear), Pap smear by a OB/GYN, family doctor, midwife, Physician assistance.
Outstanding issues
Notes Compute for 2009-2013. We used the ICD-10 code C53 for cervical cancer and we nclude all sub-codes, C53.0- If percentage of pap smears in outpatient private setting is high, the indicator is not reliable.
References
Status DONE
Indicator Nr C18
Indicator Percentage of cervical cancers diagnosed at Stage s= 0, I, II, III, IV, Unknown, Unavailable separately by year.
Tracer Cervical cancer
Numerator or calculation
Cervical cancer cases diagnosed in year t at stage s or unkonwn or unavailable
Denominator or set of people for whom to calculate
Persons with first diagnosis of this cancer at stage s in year t, conditional on not having the same diagnosis in the previous 24 months.
Source of data 1 Staging : Cancer registry.
Source of data 2 People: Constructed database on patients with dates of diagnosis and source of data.
Diagnosis and manipulation codes
Diagnosis: cervical cancer confirmed
Outstanding issues Over 60% of patients with first diagnosis of cervical cancer (confirmed) in year t were not found in cancer registry in year t. Date of diagnosis in cancer registry is not precise. It is not clear if date in cancer registry refers to first date of diag
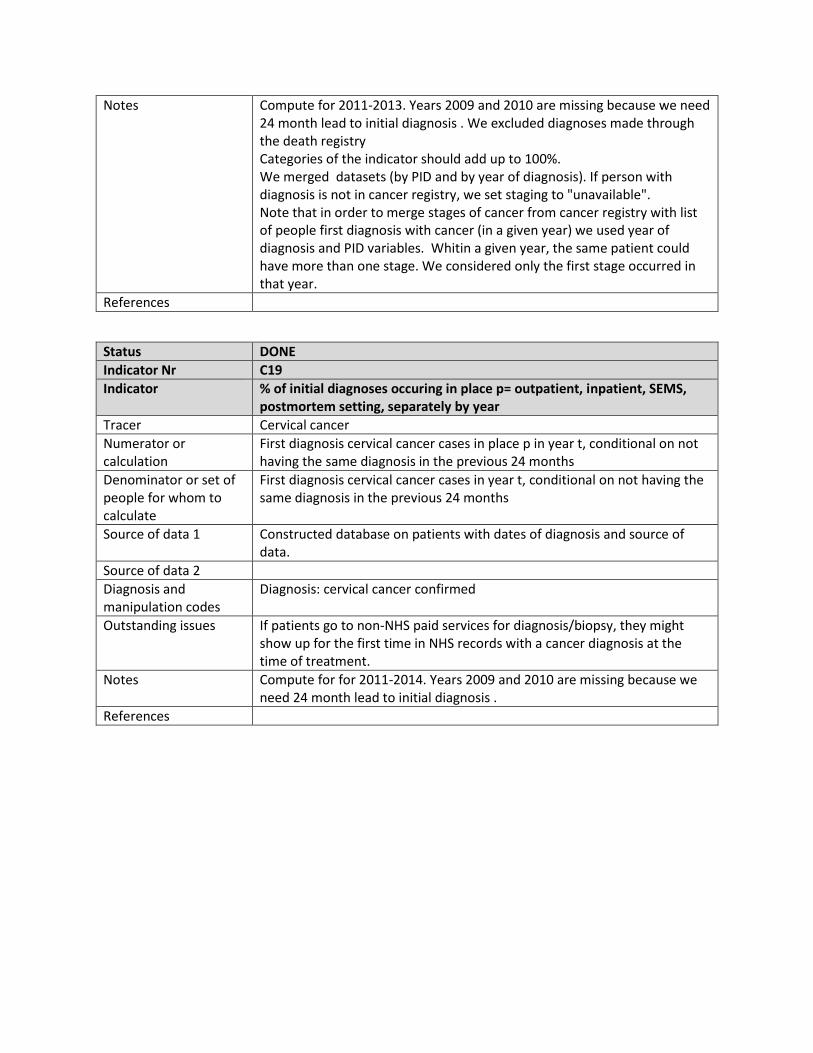
Notes Compute for 2011-2013. Years 2009 and 2010 are missing because we need 24 month lead to initial diagnosis . We excluded diagnoses made through the death registry Categories of the indicator should add up to 100%. We merged datasets (by PID and by year of diagnosis). If person with diagnosis is not in cancer registry, we set staging to "unavailable". Note that in order to merge stages of cancer from cancer registry with list of people first diagnosis with cancer (in a given year) we used year of diagnosis and PID variables. Whitin a given year, the same patient could have more than one stage. We considered only the first stage occurred in that year.
References
Status DONE
Indicator Nr C19
Indicator % of initial diagnoses occuring in place p= outpatient, inpatient, SEMS, postmortem setting, separately by year
Tracer Cervical cancer
Numerator or calculation
First diagnosis cervical cancer cases in place p in year t, conditional on not having the same diagnosis in the previous 24 months
Denominator or set of people for whom to calculate
First diagnosis cervical cancer cases in year t, conditional on not having the same diagnosis in the previous 24 months
Source of data 1 Constructed database on patients with dates of diagnosis and source of data.
Source of data 2
Diagnosis and manipulation codes
Diagnosis: cervical cancer confirmed
Outstanding issues If patients go to non-NHS paid services for diagnosis/biopsy, they might show up for the first time in NHS records with a cancer diagnosis at the time of treatment.
Notes Compute for for 2011-2014. Years 2009 and 2010 are missing because we need 24 month lead to initial diagnosis .
References
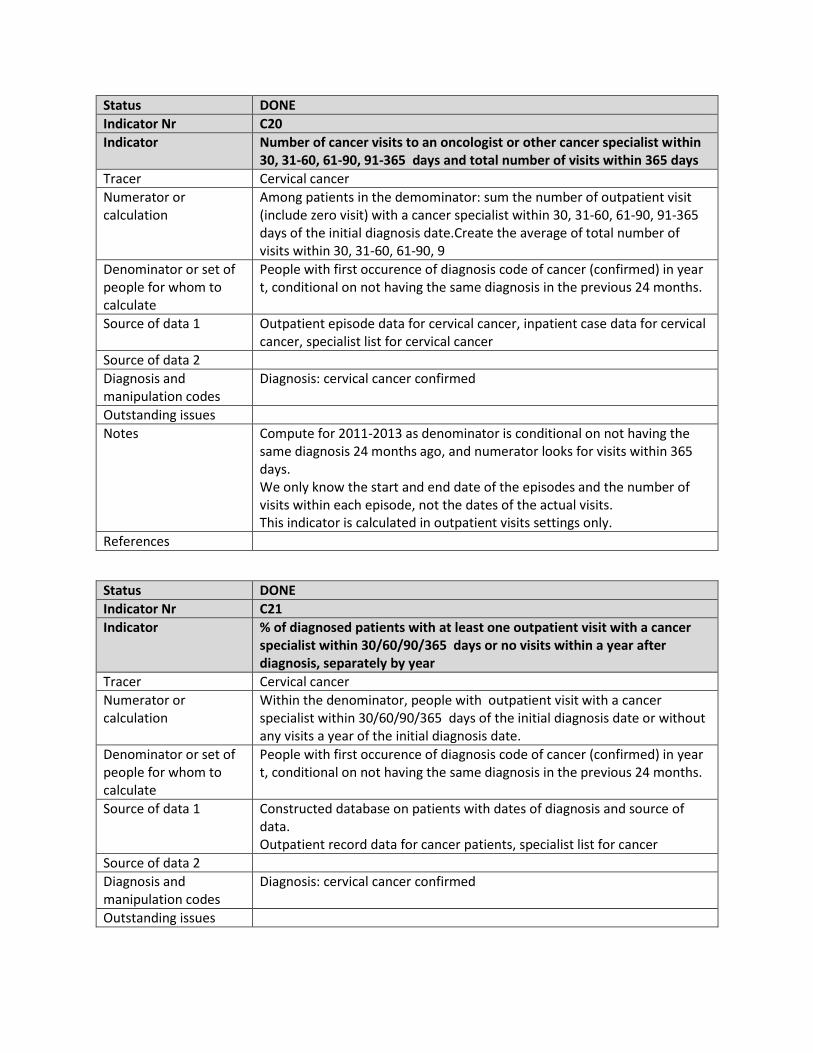
Status DONE
Indicator Nr C20
Indicator Number of cancer visits to an oncologist or other cancer specialist within 30, 31-60, 61-90, 91-365 days and total number of visits within 365 days
Tracer Cervical cancer
Numerator or calculation
Among patients in the demominator: sum the number of outpatient visit (include zero visit) with a cancer specialist within 30, 31-60, 61-90, 91-365 days of the initial diagnosis date.Create the average of total number of visits within 30, 31-60, 61-90, 9
Denominator or set of people for whom to calculate
People with first occurence of diagnosis code of cancer (confirmed) in year t, conditional on not having the same diagnosis in the previous 24 months.
Source of data 1 Outpatient episode data for cervical cancer, inpatient case data for cervical cancer, specialist list for cervical cancer
Source of data 2
Diagnosis and manipulation codes
Diagnosis: cervical cancer confirmed
Outstanding issues
Notes Compute for 2011-2013 as denominator is conditional on not having the same diagnosis 24 months ago, and numerator looks for visits within 365 days. We only know the start and end date of the episodes and the number of visits within each episode, not the dates of the actual visits. This indicator is calculated in outpatient visits settings only.
References
Status DONE
Indicator Nr C21
Indicator % of diagnosed patients with at least one outpatient visit with a cancer specialist within 30/60/90/365 days or no visits within a year after diagnosis, separately by year
Tracer Cervical cancer
Numerator or calculation
Within the denominator, people with outpatient visit with a cancer specialist within 30/60/90/365 days of the initial diagnosis date or without any visits a year of the initial diagnosis date.
Denominator or set of people for whom to calculate
People with first occurence of diagnosis code of cancer (confirmed) in year t, conditional on not having the same diagnosis in the previous 24 months.
Source of data 1 Constructed database on patients with dates of diagnosis and source of data. Outpatient record data for cancer patients, specialist list for cancer
Source of data 2
Diagnosis and manipulation codes
Diagnosis: cervical cancer confirmed
Outstanding issues
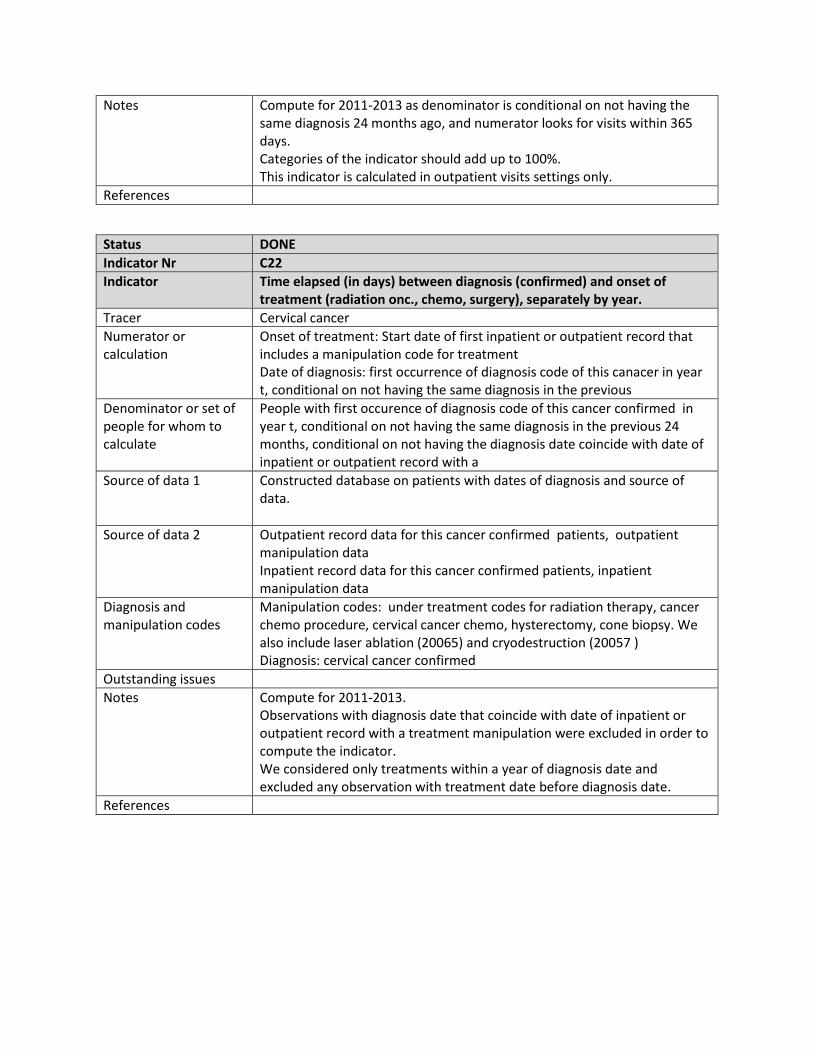
Notes Compute for 2011-2013 as denominator is conditional on not having the same diagnosis 24 months ago, and numerator looks for visits within 365 days. Categories of the indicator should add up to 100%. This indicator is calculated in outpatient visits settings only.
References
Status DONE
Indicator Nr C22
Indicator Time elapsed (in days) between diagnosis (confirmed) and onset of treatment (radiation onc., chemo, surgery), separately by year.
Tracer Cervical cancer
Numerator or calculation
Onset of treatment: Start date of first inpatient or outpatient record that includes a manipulation code for treatment Date of diagnosis: first occurrence of diagnosis code of this canacer in year t, conditional on not having the same diagnosis in the previous
Denominator or set of people for whom to calculate
People with first occurence of diagnosis code of this cancer confirmed in year t, conditional on not having the same diagnosis in the previous 24 months, conditional on not having the diagnosis date coincide with date of inpatient or outpatient record with a
Source of data 1 Constructed database on patients with dates of diagnosis and source of data.
Source of data 2 Outpatient record data for this cancer confirmed patients, outpatient manipulation data Inpatient record data for this cancer confirmed patients, inpatient manipulation data
Diagnosis and manipulation codes
Manipulation codes: under treatment codes for radiation therapy, cancer chemo procedure, cervical cancer chemo, hysterectomy, cone biopsy. We also include laser ablation (20065) and cryodestruction (20057 ) Diagnosis: cervical cancer confirmed
Outstanding issues
Notes Compute for 2011-2013. Observations with diagnosis date that coincide with date of inpatient or outpatient record with a treatment manipulation were excluded in order to compute the indicator. We considered only treatments within a year of diagnosis date and excluded any observation with treatment date before diagnosis date.
References
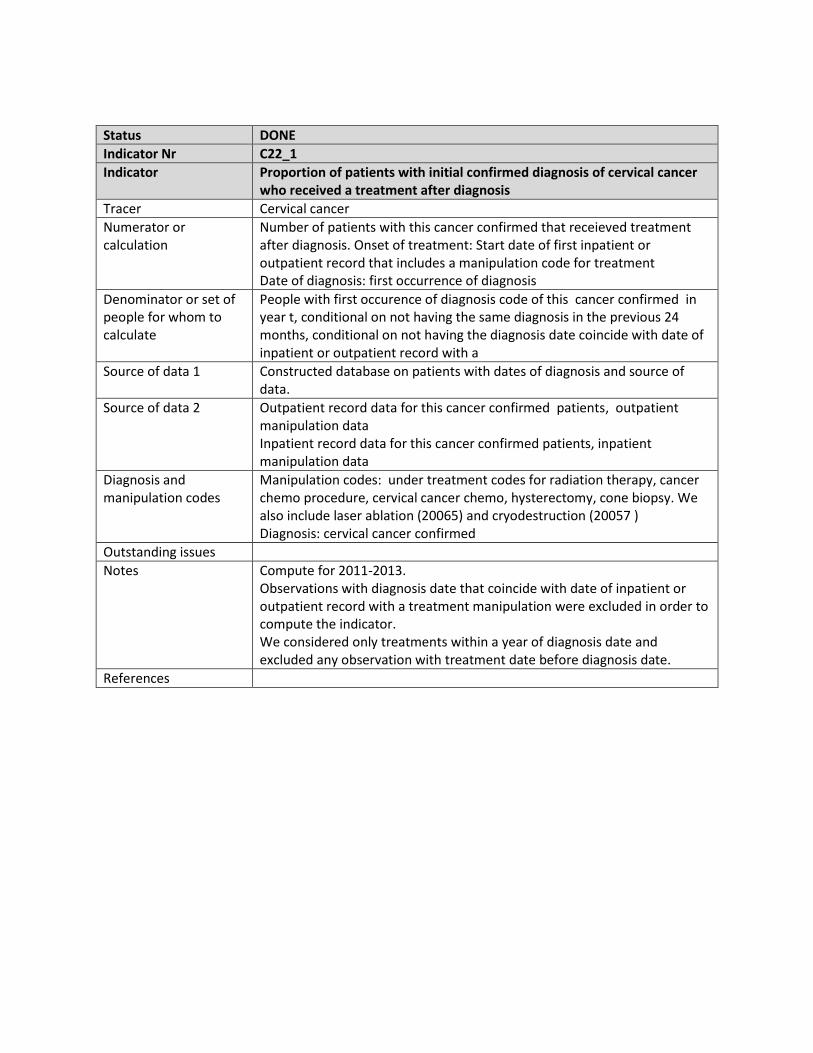
Status DONE
Indicator Nr C22_1
Indicator Proportion of patients with initial confirmed diagnosis of cervical cancer who received a treatment after diagnosis
Tracer Cervical cancer
Numerator or calculation
Number of patients with this cancer confirmed that receieved treatment after diagnosis. Onset of treatment: Start date of first inpatient or outpatient record that includes a manipulation code for treatment Date of diagnosis: first occurrence of diagnosis
Denominator or set of people for whom to calculate
People with first occurence of diagnosis code of this cancer confirmed in year t, conditional on not having the same diagnosis in the previous 24 months, conditional on not having the diagnosis date coincide with date of inpatient or outpatient record with a
Source of data 1 Constructed database on patients with dates of diagnosis and source of data.
Source of data 2 Outpatient record data for this cancer confirmed patients, outpatient manipulation data Inpatient record data for this cancer confirmed patients, inpatient manipulation data
Diagnosis and manipulation codes
Manipulation codes: under treatment codes for radiation therapy, cancer chemo procedure, cervical cancer chemo, hysterectomy, cone biopsy. We also include laser ablation (20065) and cryodestruction (20057 ) Diagnosis: cervical cancer confirmed
Outstanding issues
Notes Compute for 2011-2013. Observations with diagnosis date that coincide with date of inpatient or outpatient record with a treatment manipulation were excluded in order to compute the indicator. We considered only treatments within a year of diagnosis date and excluded any observation with treatment date before diagnosis date.
References
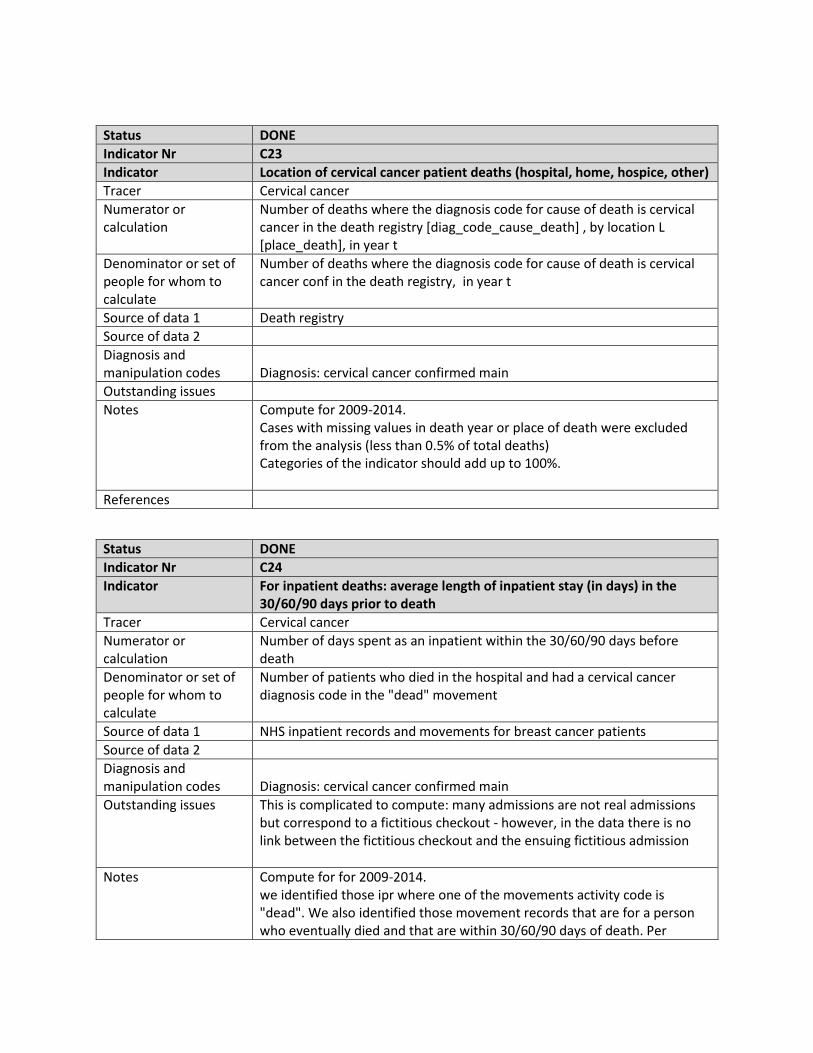
Status DONE
Indicator Nr C23
Indicator Location of cervical cancer patient deaths (hospital, home, hospice, other)
Tracer Cervical cancer
Numerator or calculation
Number of deaths where the diagnosis code for cause of death is cervical cancer in the death registry [diag_code_cause_death] , by location L [place_death], in year t
Denominator or set of people for whom to calculate
Number of deaths where the diagnosis code for cause of death is cervical cancer conf in the death registry, in year t
Source of data 1 Death registry
Source of data 2
Diagnosis and manipulation codes
Diagnosis: cervical cancer confirmed main
Outstanding issues
Notes Compute for 2009-2014. Cases with missing values in death year or place of death were excluded from the analysis (less than 0.5% of total deaths) Categories of the indicator should add up to 100%.
References
Status DONE
Indicator Nr C24
Indicator For inpatient deaths: average length of inpatient stay (in days) in the 30/60/90 days prior to death
Tracer Cervical cancer
Numerator or calculation
Number of days spent as an inpatient within the 30/60/90 days before death
Denominator or set of people for whom to calculate
Number of patients who died in the hospital and had a cervical cancer diagnosis code in the "dead" movement
Source of data 1 NHS inpatient records and movements for breast cancer patients
Source of data 2
Diagnosis and manipulation codes
Diagnosis: cervical cancer confirmed main
Outstanding issues This is complicated to compute: many admissions are not real admissions but correspond to a fictitious checkout - however, in the data there is no link between the fictitious checkout and the ensuing fictitious admission
Notes Compute for for 2009-2014. we identified those ipr where one of the movements activity code is "dead". We also identified those movement records that are for a person who eventually died and that are within 30/60/90 days of death. Per
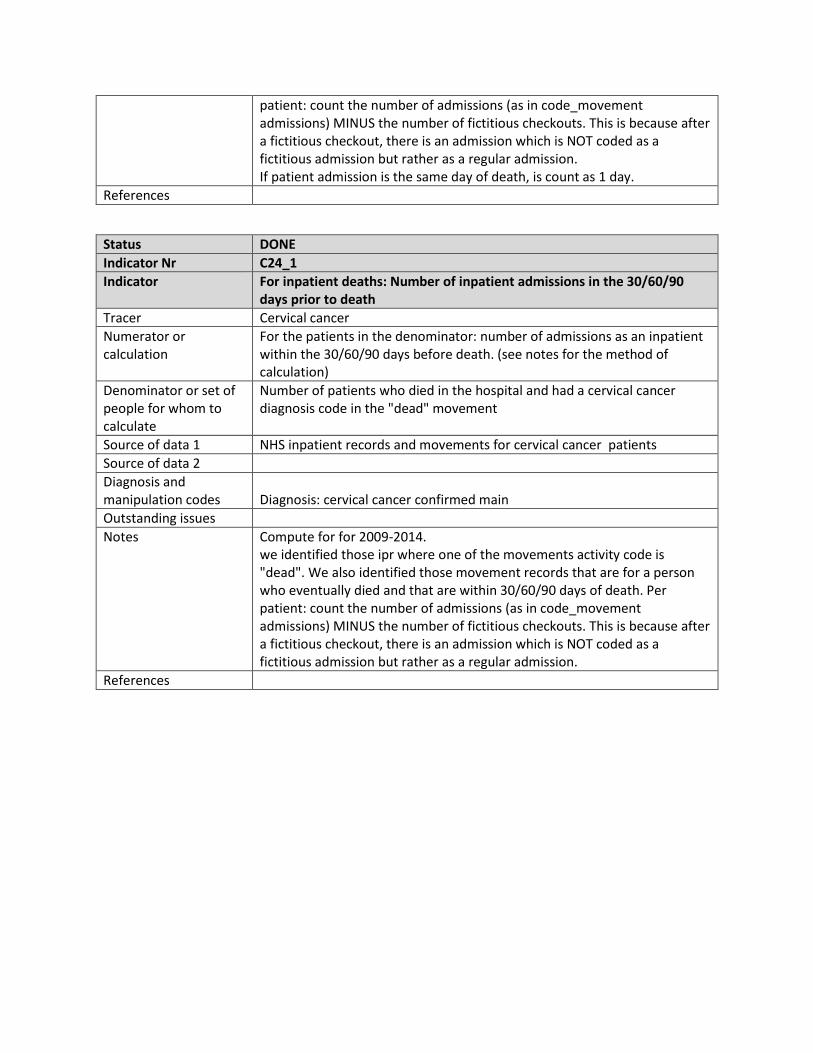
patient: count the number of admissions (as in code_movement admissions) MINUS the number of fictitious checkouts. This is because after a fictitious checkout, there is an admission which is NOT coded as a fictitious admission but rather as a regular admission. If patient admission is the same day of death, is count as 1 day.
References
Status DONE
Indicator Nr C24_1
Indicator For inpatient deaths: Number of inpatient admissions in the 30/60/90 days prior to death
Tracer Cervical cancer
Numerator or calculation
For the patients in the denominator: number of admissions as an inpatient within the 30/60/90 days before death. (see notes for the method of calculation)
Denominator or set of people for whom to calculate
Number of patients who died in the hospital and had a cervical cancer diagnosis code in the "dead" movement
Source of data 1 NHS inpatient records and movements for cervical cancer patients
Source of data 2
Diagnosis and manipulation codes
Diagnosis: cervical cancer confirmed main
Outstanding issues
Notes Compute for for 2009-2014. we identified those ipr where one of the movements activity code is "dead". We also identified those movement records that are for a person who eventually died and that are within 30/60/90 days of death. Per patient: count the number of admissions (as in code_movement admissions) MINUS the number of fictitious checkouts. This is because after a fictitious checkout, there is an admission which is NOT coded as a fictitious admission but rather as a regular admission.
References
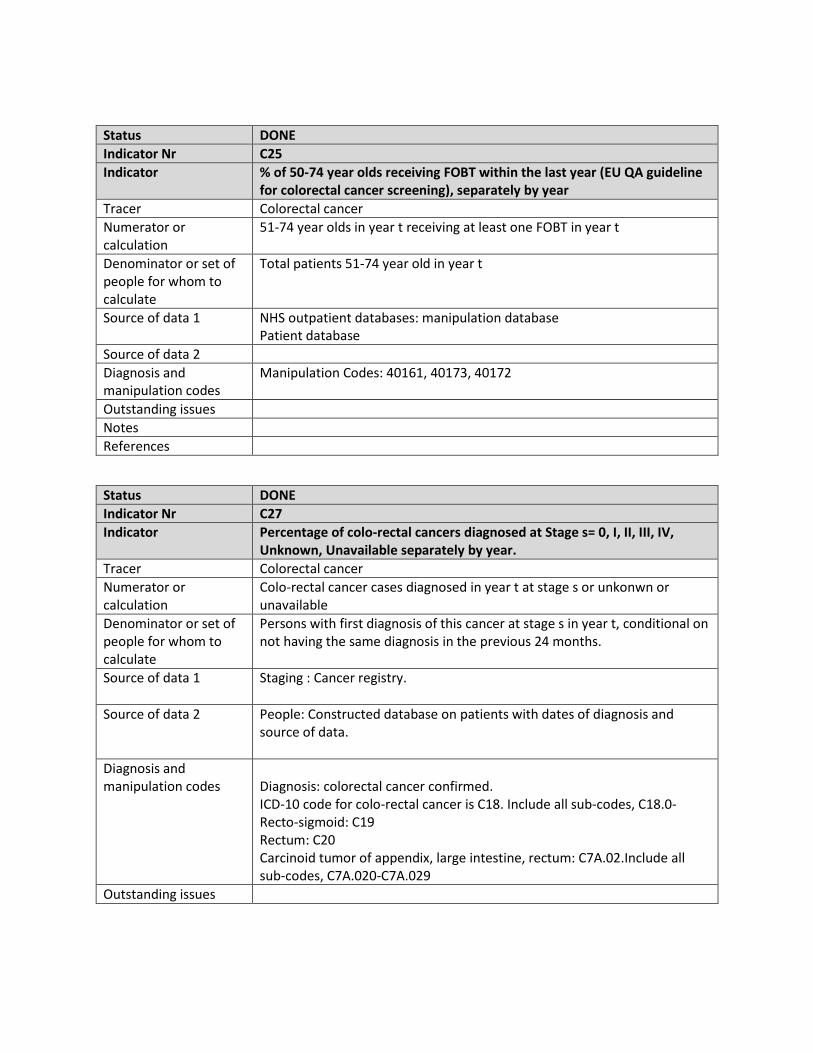
Status DONE
Indicator Nr C25
Indicator % of 50-74 year olds receiving FOBT within the last year (EU QA guideline for colorectal cancer screening), separately by year
Tracer Colorectal cancer
Numerator or calculation
51-74 year olds in year t receiving at least one FOBT in year t
Denominator or set of people for whom to calculate
Total patients 51-74 year old in year t
Source of data 1 NHS outpatient databases: manipulation database Patient database
Source of data 2
Diagnosis and manipulation codes
Manipulation Codes: 40161, 40173, 40172
Outstanding issues
Notes
References
Status DONE
Indicator Nr C27
Indicator Percentage of colo-rectal cancers diagnosed at Stage s= 0, I, II, III, IV, Unknown, Unavailable separately by year.
Tracer Colorectal cancer
Numerator or calculation
Colo-rectal cancer cases diagnosed in year t at stage s or unkonwn or unavailable
Denominator or set of people for whom to calculate
Persons with first diagnosis of this cancer at stage s in year t, conditional on not having the same diagnosis in the previous 24 months.
Source of data 1 Staging : Cancer registry.
Source of data 2 People: Constructed database on patients with dates of diagnosis and source of data.
Diagnosis and manipulation codes
Diagnosis: colorectal cancer confirmed. ICD-10 code for colo-rectal cancer is C18. Include all sub-codes, C18.0- Recto-sigmoid: C19 Rectum: C20 Carcinoid tumor of appendix, large intestine, rectum: C7A.02.Include all sub-codes, C7A.020-C7A.029
Outstanding issues
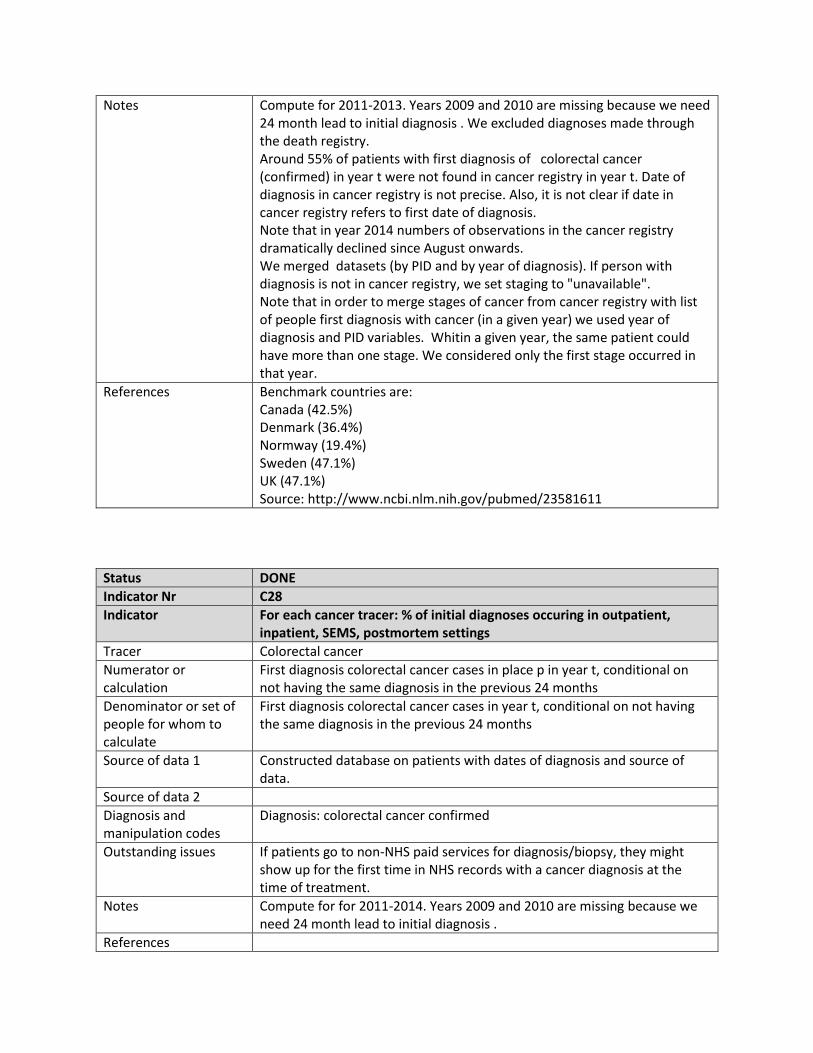
Notes Compute for 2011-2013. Years 2009 and 2010 are missing because we need 24 month lead to initial diagnosis . We excluded diagnoses made through the death registry. Around 55% of patients with first diagnosis of colorectal cancer (confirmed) in year t were not found in cancer registry in year t. Date of diagnosis in cancer registry is not precise. Also, it is not clear if date in cancer registry refers to first date of diagnosis. Note that in year 2014 numbers of observations in the cancer registry dramatically declined since August onwards. We merged datasets (by PID and by year of diagnosis). If person with diagnosis is not in cancer registry, we set staging to "unavailable". Note that in order to merge stages of cancer from cancer registry with list of people first diagnosis with cancer (in a given year) we used year of diagnosis and PID variables. Whitin a given year, the same patient could have more than one stage. We considered only the first stage occurred in that year.
References Benchmark countries are: Canada (42.5%) Denmark (36.4%) Normway (19.4%) Sweden (47.1%) UK (47.1%) Source: http://www.ncbi.nlm.nih.gov/pubmed/23581611
Status DONE
Indicator Nr C28
Indicator For each cancer tracer: % of initial diagnoses occuring in outpatient, inpatient, SEMS, postmortem settings
Tracer Colorectal cancer
Numerator or calculation
First diagnosis colorectal cancer cases in place p in year t, conditional on not having the same diagnosis in the previous 24 months
Denominator or set of people for whom to calculate
First diagnosis colorectal cancer cases in year t, conditional on not having the same diagnosis in the previous 24 months
Source of data 1 Constructed database on patients with dates of diagnosis and source of data.
Source of data 2
Diagnosis and manipulation codes
Diagnosis: colorectal cancer confirmed
Outstanding issues If patients go to non-NHS paid services for diagnosis/biopsy, they might show up for the first time in NHS records with a cancer diagnosis at the time of treatment.
Notes Compute for for 2011-2014. Years 2009 and 2010 are missing because we need 24 month lead to initial diagnosis .
References
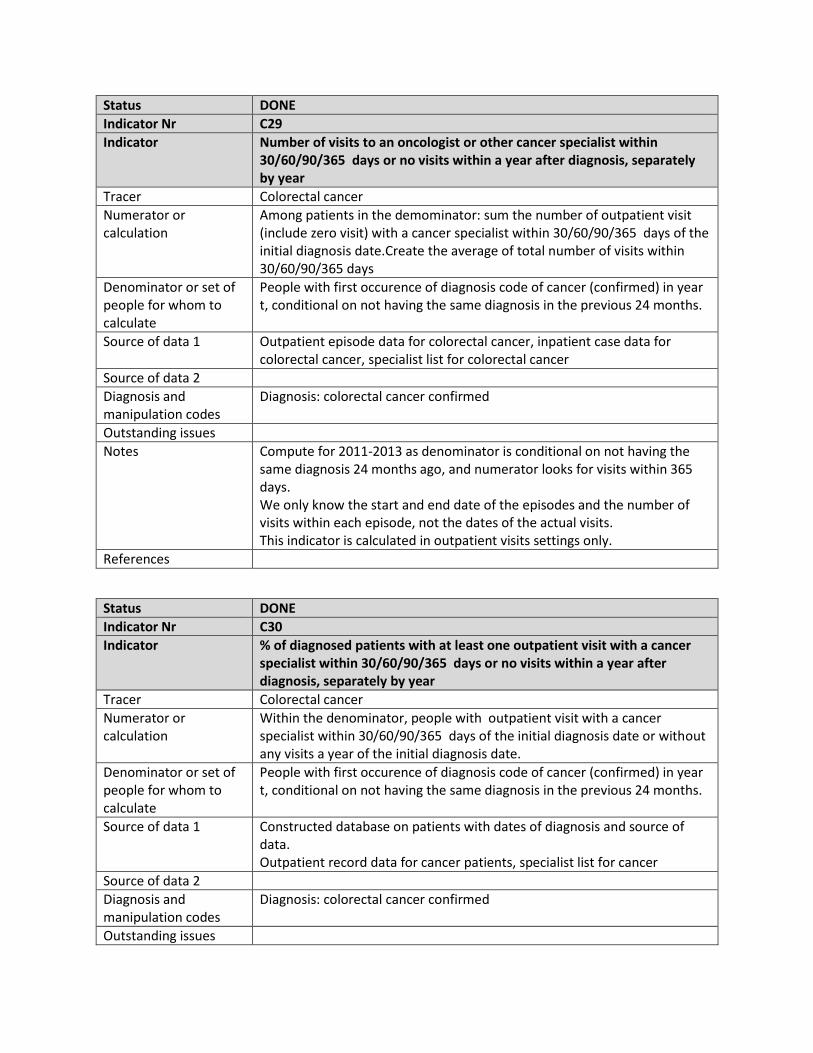
Status DONE
Indicator Nr C29
Indicator Number of visits to an oncologist or other cancer specialist within 30/60/90/365 days or no visits within a year after diagnosis, separately by year
Tracer Colorectal cancer
Numerator or calculation
Among patients in the demominator: sum the number of outpatient visit (include zero visit) with a cancer specialist within 30/60/90/365 days of the initial diagnosis date.Create the average of total number of visits within 30/60/90/365 days
Denominator or set of people for whom to calculate
People with first occurence of diagnosis code of cancer (confirmed) in year t, conditional on not having the same diagnosis in the previous 24 months.
Source of data 1 Outpatient episode data for colorectal cancer, inpatient case data for colorectal cancer, specialist list for colorectal cancer
Source of data 2
Diagnosis and manipulation codes
Diagnosis: colorectal cancer confirmed
Outstanding issues
Notes Compute for 2011-2013 as denominator is conditional on not having the same diagnosis 24 months ago, and numerator looks for visits within 365 days. We only know the start and end date of the episodes and the number of visits within each episode, not the dates of the actual visits. This indicator is calculated in outpatient visits settings only.
References
Status DONE
Indicator Nr C30
Indicator % of diagnosed patients with at least one outpatient visit with a cancer specialist within 30/60/90/365 days or no visits within a year after diagnosis, separately by year
Tracer Colorectal cancer
Numerator or calculation
Within the denominator, people with outpatient visit with a cancer specialist within 30/60/90/365 days of the initial diagnosis date or without any visits a year of the initial diagnosis date.
Denominator or set of people for whom to calculate
People with first occurence of diagnosis code of cancer (confirmed) in year t, conditional on not having the same diagnosis in the previous 24 months.
Source of data 1 Constructed database on patients with dates of diagnosis and source of data. Outpatient record data for cancer patients, specialist list for cancer
Source of data 2
Diagnosis and manipulation codes
Diagnosis: colorectal cancer confirmed
Outstanding issues
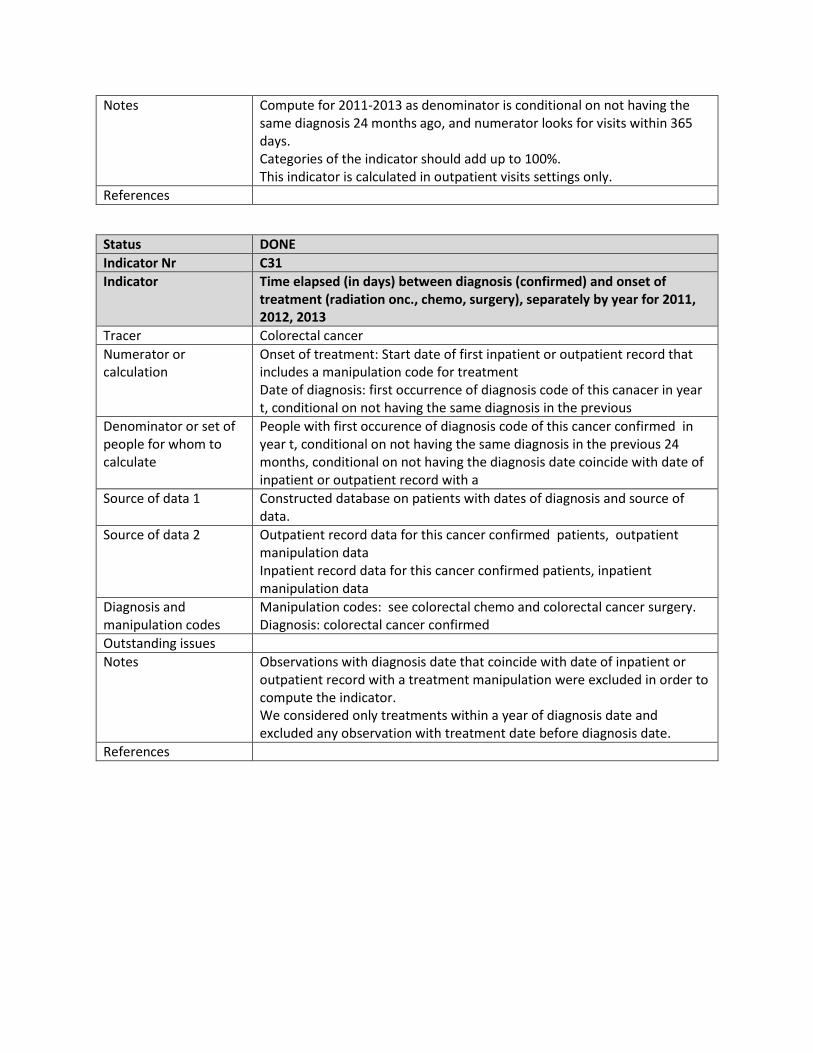
Notes Compute for 2011-2013 as denominator is conditional on not having the same diagnosis 24 months ago, and numerator looks for visits within 365 days. Categories of the indicator should add up to 100%. This indicator is calculated in outpatient visits settings only.
References
Status DONE
Indicator Nr C31
Indicator Time elapsed (in days) between diagnosis (confirmed) and onset of treatment (radiation onc., chemo, surgery), separately by year for 2011, 2012, 2013
Tracer Colorectal cancer
Numerator or calculation
Onset of treatment: Start date of first inpatient or outpatient record that includes a manipulation code for treatment Date of diagnosis: first occurrence of diagnosis code of this canacer in year t, conditional on not having the same diagnosis in the previous
Denominator or set of people for whom to calculate
People with first occurence of diagnosis code of this cancer confirmed in year t, conditional on not having the same diagnosis in the previous 24 months, conditional on not having the diagnosis date coincide with date of inpatient or outpatient record with a
Source of data 1 Constructed database on patients with dates of diagnosis and source of data.
Source of data 2 Outpatient record data for this cancer confirmed patients, outpatient manipulation data Inpatient record data for this cancer confirmed patients, inpatient manipulation data
Diagnosis and manipulation codes
Manipulation codes: see colorectal chemo and colorectal cancer surgery. Diagnosis: colorectal cancer confirmed
Outstanding issues
Notes Observations with diagnosis date that coincide with date of inpatient or outpatient record with a treatment manipulation were excluded in order to compute the indicator. We considered only treatments within a year of diagnosis date and excluded any observation with treatment date before diagnosis date.
References
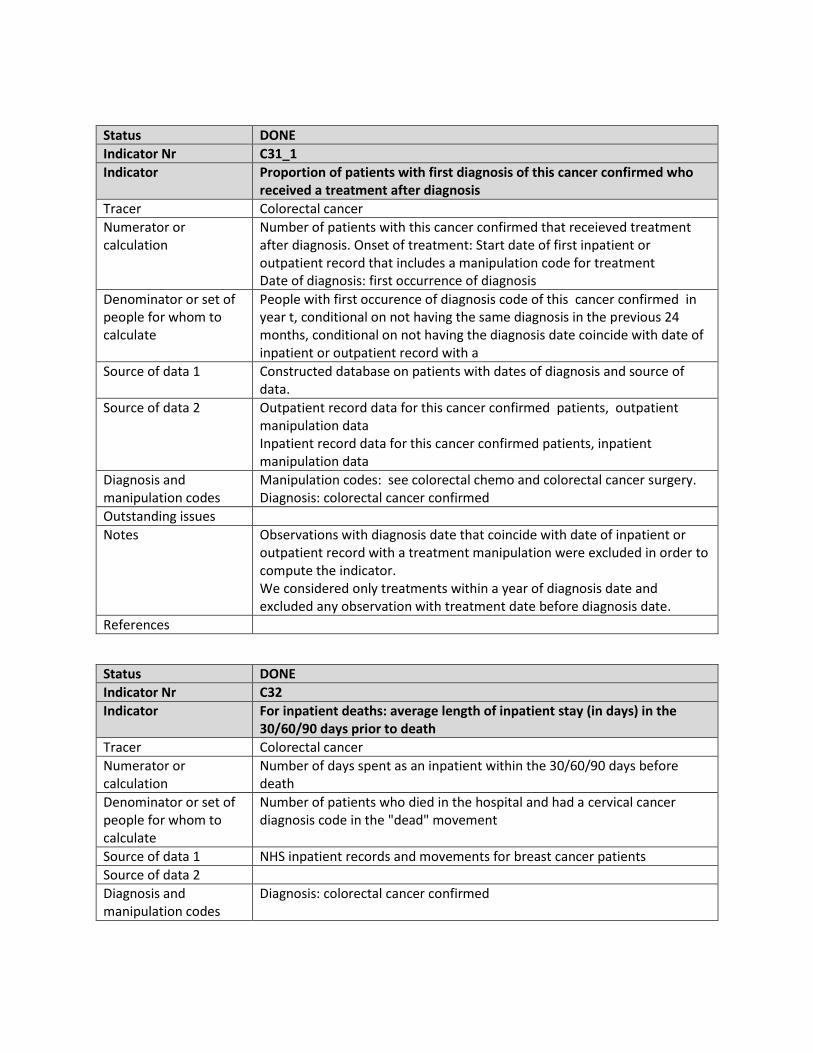
Status DONE
Indicator Nr C31_1
Indicator Proportion of patients with first diagnosis of this cancer confirmed who received a treatment after diagnosis
Tracer Colorectal cancer
Numerator or calculation
Number of patients with this cancer confirmed that receieved treatment after diagnosis. Onset of treatment: Start date of first inpatient or outpatient record that includes a manipulation code for treatment Date of diagnosis: first occurrence of diagnosis
Denominator or set of people for whom to calculate
People with first occurence of diagnosis code of this cancer confirmed in year t, conditional on not having the same diagnosis in the previous 24 months, conditional on not having the diagnosis date coincide with date of inpatient or outpatient record with a
Source of data 1 Constructed database on patients with dates of diagnosis and source of data.
Source of data 2 Outpatient record data for this cancer confirmed patients, outpatient manipulation data Inpatient record data for this cancer confirmed patients, inpatient manipulation data
Diagnosis and manipulation codes
Manipulation codes: see colorectal chemo and colorectal cancer surgery. Diagnosis: colorectal cancer confirmed
Outstanding issues
Notes Observations with diagnosis date that coincide with date of inpatient or outpatient record with a treatment manipulation were excluded in order to compute the indicator. We considered only treatments within a year of diagnosis date and excluded any observation with treatment date before diagnosis date.
References
Status DONE
Indicator Nr C32
Indicator For inpatient deaths: average length of inpatient stay (in days) in the 30/60/90 days prior to death
Tracer Colorectal cancer
Numerator or calculation
Number of days spent as an inpatient within the 30/60/90 days before death
Denominator or set of people for whom to calculate
Number of patients who died in the hospital and had a cervical cancer diagnosis code in the "dead" movement
Source of data 1 NHS inpatient records and movements for breast cancer patients
Source of data 2
Diagnosis and manipulation codes
Diagnosis: colorectal cancer confirmed
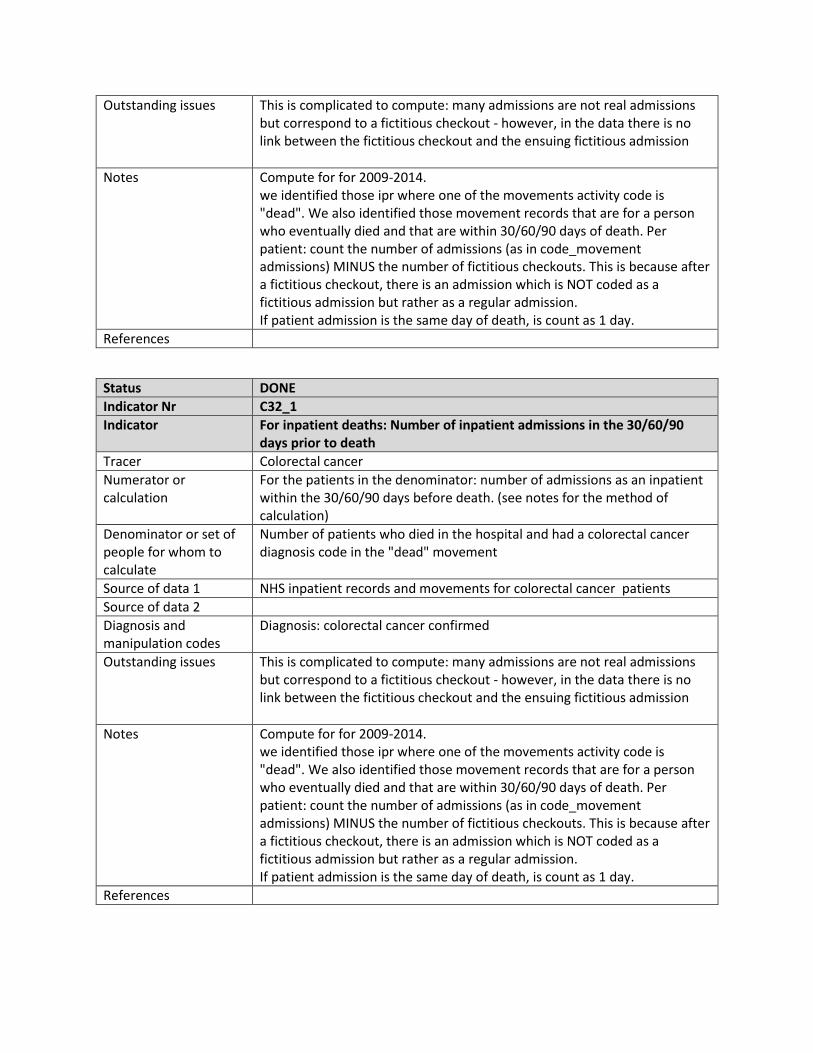
Outstanding issues This is complicated to compute: many admissions are not real admissions but correspond to a fictitious checkout - however, in the data there is no link between the fictitious checkout and the ensuing fictitious admission
Notes Compute for for 2009-2014. we identified those ipr where one of the movements activity code is "dead". We also identified those movement records that are for a person who eventually died and that are within 30/60/90 days of death. Per patient: count the number of admissions (as in code_movement admissions) MINUS the number of fictitious checkouts. This is because after a fictitious checkout, there is an admission which is NOT coded as a fictitious admission but rather as a regular admission. If patient admission is the same day of death, is count as 1 day.
References
Status DONE
Indicator Nr C32_1
Indicator For inpatient deaths: Number of inpatient admissions in the 30/60/90 days prior to death
Tracer Colorectal cancer
Numerator or calculation
For the patients in the denominator: number of admissions as an inpatient within the 30/60/90 days before death. (see notes for the method of calculation)
Denominator or set of people for whom to calculate
Number of patients who died in the hospital and had a colorectal cancer diagnosis code in the "dead" movement
Source of data 1 NHS inpatient records and movements for colorectal cancer patients
Source of data 2
Diagnosis and manipulation codes
Diagnosis: colorectal cancer confirmed
Outstanding issues This is complicated to compute: many admissions are not real admissions but correspond to a fictitious checkout - however, in the data there is no link between the fictitious checkout and the ensuing fictitious admission
Notes Compute for for 2009-2014. we identified those ipr where one of the movements activity code is "dead". We also identified those movement records that are for a person who eventually died and that are within 30/60/90 days of death. Per patient: count the number of admissions (as in code_movement admissions) MINUS the number of fictitious checkouts. This is because after a fictitious checkout, there is an admission which is NOT coded as a fictitious admission but rather as a regular admission. If patient admission is the same day of death, is count as 1 day.
References

Status DONE
Indicator Nr M19
Indicator % of initial diagnoses occuring at primary level
Tracer Depression
Numerator or calculation
Among people in the denominator: Number of people who had their initial diagnosis at the primary care level.
Denominator or set of people for whom to calculate
Number of people with a diagnosis of depression in year t, as per any NHS, SEMS or death registry database, who did not have this diagnosis in the preceding 12 months in any NHS or SEMS database.
Source of data 1 NHS inpatient and outpatient databases, SEMS database, death registry
Source of data 2
Diagnosis and manipulation codes
See diagnosis codes in the diagnosis codes sheet
Outstanding issues --
Notes Compute for 2010-2014 Indicators M19 to M23 should add up to 100%
References
Status DONE
Indicator Nr M20
Indicator % of initial diagnoses occuring at specialist outpatient level
Tracer Depression
Numerator or calculation
Among people in the denominator: Number of people who had their initial diagnosis in an outpatient specialist setting.
Denominator or set of people for whom to calculate
Number of people with a diagnosis of depression in year t, as per any NHS, SEMS or death registry database, who did not have this diagnosis in the preceding 12 months in any NHS or SEMS database.
Source of data 1 NHS inpatient and outpatient databases, SEMS database, death registry
Source of data 2
Diagnosis and manipulation codes
See diagnosis codes in the diagnosis codes sheet
Outstanding issues --
Notes Compute for 2010-2014 Indicators M19 to M23 should add up to 100%
References
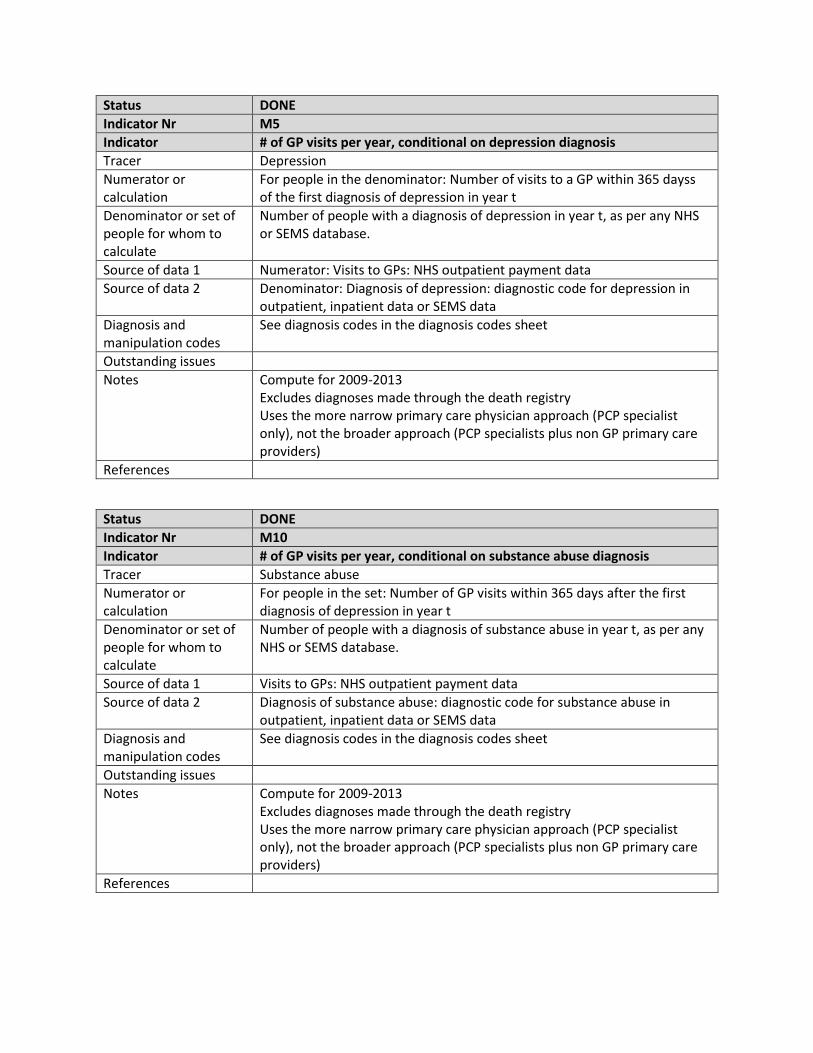
Status DONE
Indicator Nr M5
Indicator # of GP visits per year, conditional on depression diagnosis
Tracer Depression
Numerator or calculation
For people in the denominator: Number of visits to a GP within 365 dayss of the first diagnosis of depression in year t
Denominator or set of people for whom to calculate
Number of people with a diagnosis of depression in year t, as per any NHS or SEMS database.
Source of data 1 Numerator: Visits to GPs: NHS outpatient payment data
Source of data 2 Denominator: Diagnosis of depression: diagnostic code for depression in outpatient, inpatient data or SEMS data
Diagnosis and manipulation codes
See diagnosis codes in the diagnosis codes sheet
Outstanding issues
Notes Compute for 2009-2013 Excludes diagnoses made through the death registry Uses the more narrow primary care physician approach (PCP specialist only), not the broader approach (PCP specialists plus non GP primary care providers)
References
Status DONE
Indicator Nr M10
Indicator # of GP visits per year, conditional on substance abuse diagnosis
Tracer Substance abuse
Numerator or calculation
For people in the set: Number of GP visits within 365 days after the first diagnosis of depression in year t
Denominator or set of people for whom to calculate
Number of people with a diagnosis of substance abuse in year t, as per any NHS or SEMS database.
Source of data 1 Visits to GPs: NHS outpatient payment data
Source of data 2 Diagnosis of substance abuse: diagnostic code for substance abuse in outpatient, inpatient data or SEMS data
Diagnosis and manipulation codes
See diagnosis codes in the diagnosis codes sheet
Outstanding issues
Notes Compute for 2009-2013 Excludes diagnoses made through the death registry Uses the more narrow primary care physician approach (PCP specialist only), not the broader approach (PCP specialists plus non GP primary care providers)
References
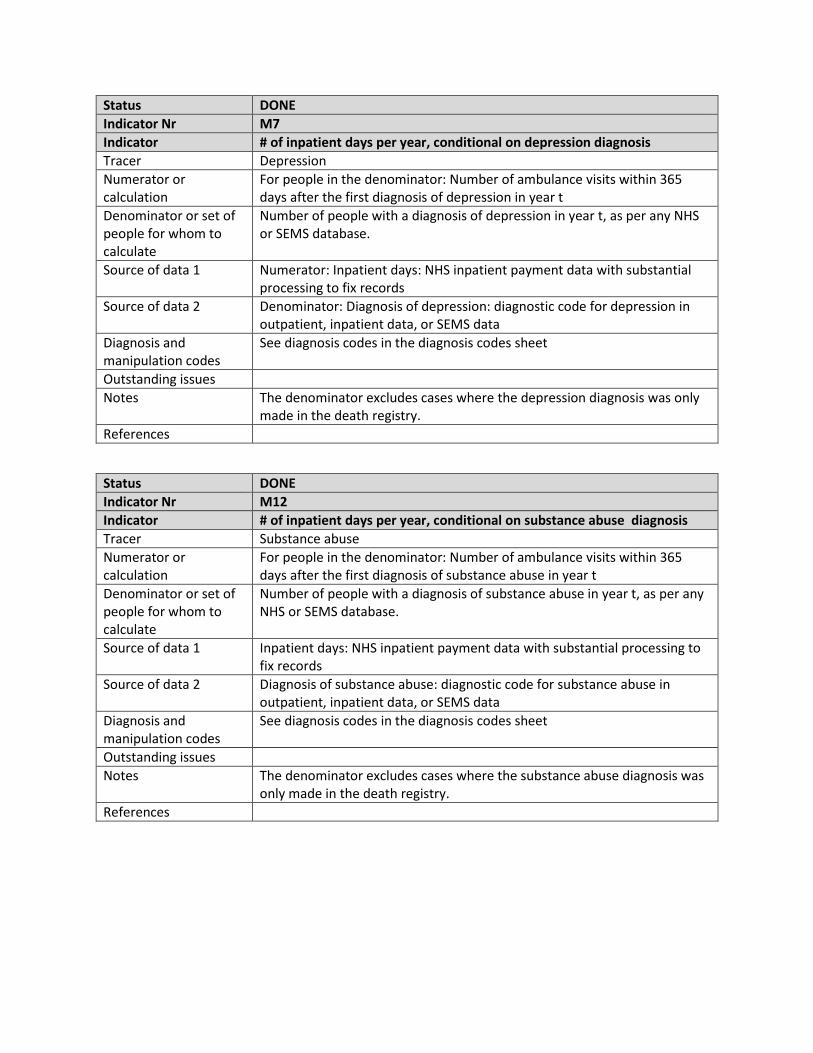
Status DONE
Indicator Nr M7
Indicator # of inpatient days per year, conditional on depression diagnosis
Tracer Depression
Numerator or calculation
For people in the denominator: Number of ambulance visits within 365 days after the first diagnosis of depression in year t
Denominator or set of people for whom to calculate
Number of people with a diagnosis of depression in year t, as per any NHS or SEMS database.
Source of data 1 Numerator: Inpatient days: NHS inpatient payment data with substantial processing to fix records
Source of data 2 Denominator: Diagnosis of depression: diagnostic code for depression in outpatient, inpatient data, or SEMS data
Diagnosis and manipulation codes
See diagnosis codes in the diagnosis codes sheet
Outstanding issues
Notes The denominator excludes cases where the depression diagnosis was only made in the death registry.
References
Status DONE
Indicator Nr M12
Indicator # of inpatient days per year, conditional on substance abuse diagnosis
Tracer Substance abuse
Numerator or calculation
For people in the denominator: Number of ambulance visits within 365 days after the first diagnosis of substance abuse in year t
Denominator or set of people for whom to calculate
Number of people with a diagnosis of substance abuse in year t, as per any NHS or SEMS database.
Source of data 1 Inpatient days: NHS inpatient payment data with substantial processing to fix records
Source of data 2 Diagnosis of substance abuse: diagnostic code for substance abuse in outpatient, inpatient data, or SEMS data
Diagnosis and manipulation codes
See diagnosis codes in the diagnosis codes sheet
Outstanding issues
Notes The denominator excludes cases where the substance abuse diagnosis was only made in the death registry.
References
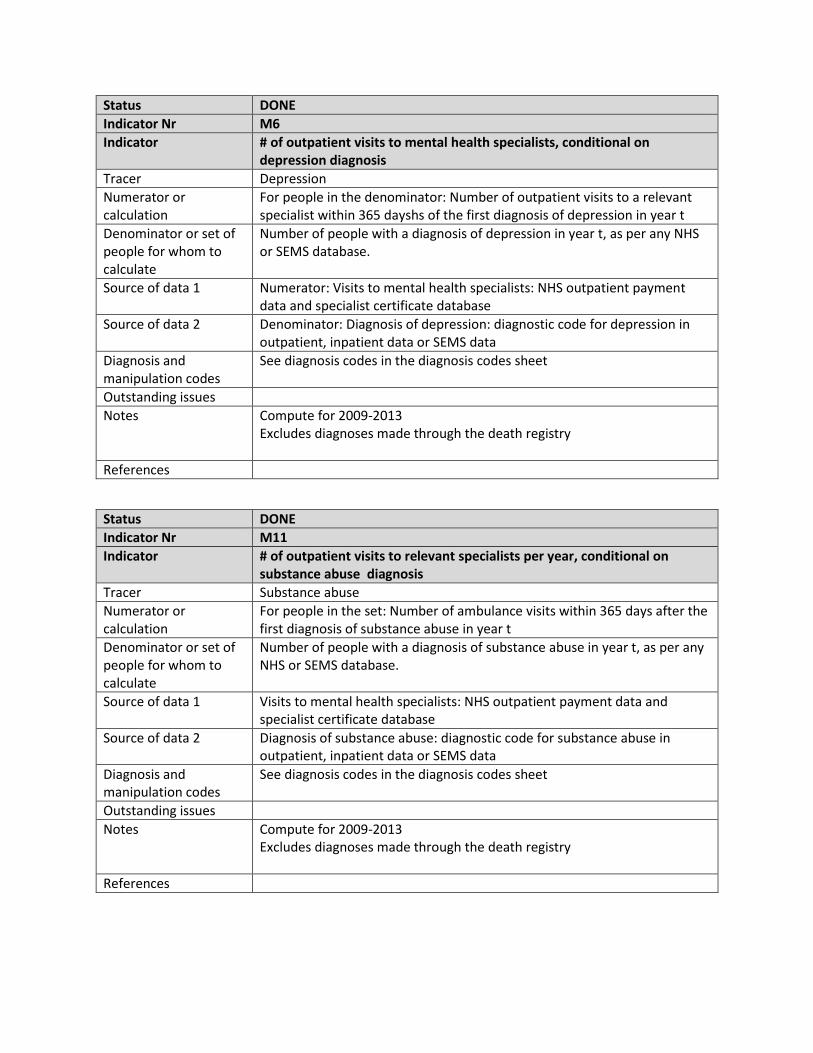
Status DONE
Indicator Nr M6
Indicator # of outpatient visits to mental health specialists, conditional on depression diagnosis
Tracer Depression
Numerator or calculation
For people in the denominator: Number of outpatient visits to a relevant specialist within 365 dayshs of the first diagnosis of depression in year t
Denominator or set of people for whom to calculate
Number of people with a diagnosis of depression in year t, as per any NHS or SEMS database.
Source of data 1 Numerator: Visits to mental health specialists: NHS outpatient payment data and specialist certificate database
Source of data 2 Denominator: Diagnosis of depression: diagnostic code for depression in outpatient, inpatient data or SEMS data
Diagnosis and manipulation codes
See diagnosis codes in the diagnosis codes sheet
Outstanding issues
Notes Compute for 2009-2013 Excludes diagnoses made through the death registry
References
Status DONE
Indicator Nr M11
Indicator # of outpatient visits to relevant specialists per year, conditional on substance abuse diagnosis
Tracer Substance abuse
Numerator or calculation
For people in the set: Number of ambulance visits within 365 days after the first diagnosis of substance abuse in year t
Denominator or set of people for whom to calculate
Number of people with a diagnosis of substance abuse in year t, as per any NHS or SEMS database.
Source of data 1 Visits to mental health specialists: NHS outpatient payment data and specialist certificate database
Source of data 2 Diagnosis of substance abuse: diagnostic code for substance abuse in outpatient, inpatient data or SEMS data
Diagnosis and manipulation codes
See diagnosis codes in the diagnosis codes sheet
Outstanding issues
Notes Compute for 2009-2013 Excludes diagnoses made through the death registry
References
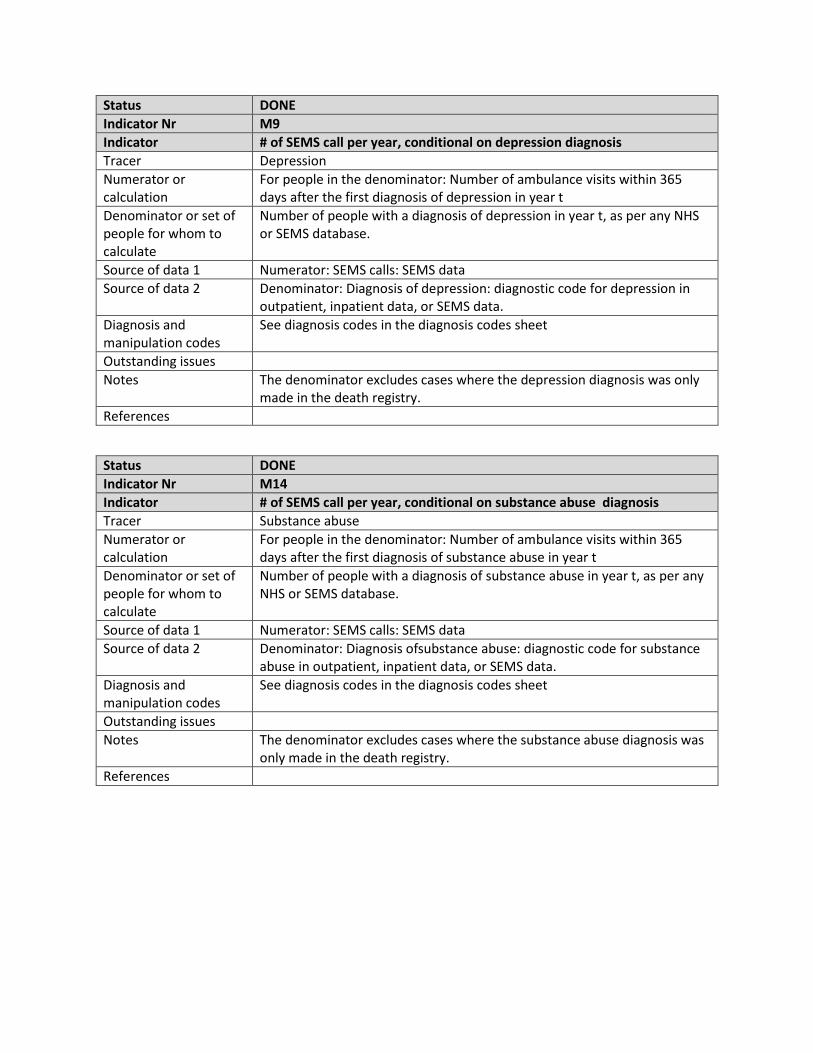
Status DONE
Indicator Nr M9
Indicator # of SEMS call per year, conditional on depression diagnosis
Tracer Depression
Numerator or calculation
For people in the denominator: Number of ambulance visits within 365 days after the first diagnosis of depression in year t
Denominator or set of people for whom to calculate
Number of people with a diagnosis of depression in year t, as per any NHS or SEMS database.
Source of data 1 Numerator: SEMS calls: SEMS data
Source of data 2 Denominator: Diagnosis of depression: diagnostic code for depression in outpatient, inpatient data, or SEMS data.
Diagnosis and manipulation codes
See diagnosis codes in the diagnosis codes sheet
Outstanding issues
Notes The denominator excludes cases where the depression diagnosis was only made in the death registry.
References
Status DONE
Indicator Nr M14
Indicator # of SEMS call per year, conditional on substance abuse diagnosis
Tracer Substance abuse
Numerator or calculation
For people in the denominator: Number of ambulance visits within 365 days after the first diagnosis of substance abuse in year t
Denominator or set of people for whom to calculate
Number of people with a diagnosis of substance abuse in year t, as per any NHS or SEMS database.
Source of data 1 Numerator: SEMS calls: SEMS data
Source of data 2 Denominator: Diagnosis ofsubstance abuse: diagnostic code for substance abuse in outpatient, inpatient data, or SEMS data.
Diagnosis and manipulation codes
See diagnosis codes in the diagnosis codes sheet
Outstanding issues
Notes The denominator excludes cases where the substance abuse diagnosis was only made in the death registry.
References
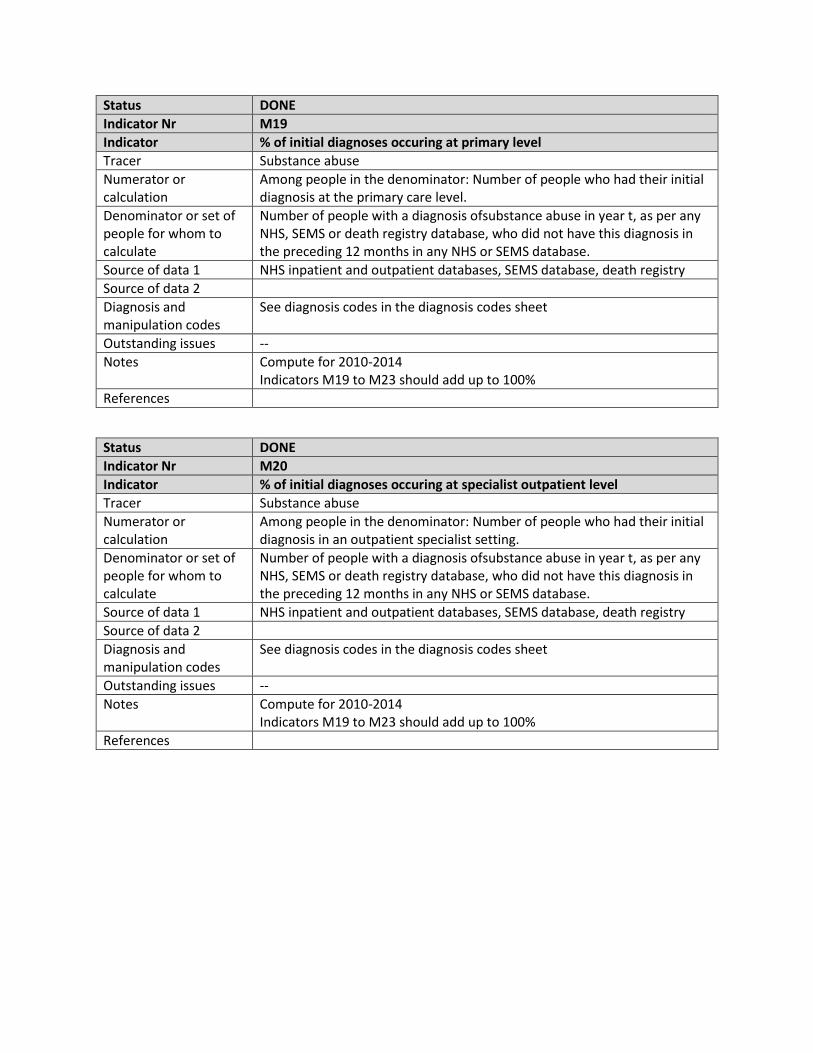
Status DONE
Indicator Nr M19
Indicator % of initial diagnoses occuring at primary level
Tracer Substance abuse
Numerator or calculation
Among people in the denominator: Number of people who had their initial diagnosis at the primary care level.
Denominator or set of people for whom to calculate
Number of people with a diagnosis ofsubstance abuse in year t, as per any NHS, SEMS or death registry database, who did not have this diagnosis in the preceding 12 months in any NHS or SEMS database.
Source of data 1 NHS inpatient and outpatient databases, SEMS database, death registry
Source of data 2
Diagnosis and manipulation codes
See diagnosis codes in the diagnosis codes sheet
Outstanding issues --
Notes Compute for 2010-2014 Indicators M19 to M23 should add up to 100%
References
Status DONE
Indicator Nr M20
Indicator % of initial diagnoses occuring at specialist outpatient level
Tracer Substance abuse
Numerator or calculation
Among people in the denominator: Number of people who had their initial diagnosis in an outpatient specialist setting.
Denominator or set of people for whom to calculate
Number of people with a diagnosis ofsubstance abuse in year t, as per any NHS, SEMS or death registry database, who did not have this diagnosis in the preceding 12 months in any NHS or SEMS database.
Source of data 1 NHS inpatient and outpatient databases, SEMS database, death registry
Source of data 2
Diagnosis and manipulation codes
See diagnosis codes in the diagnosis codes sheet
Outstanding issues --
Notes Compute for 2010-2014 Indicators M19 to M23 should add up to 100%
References

Status DONE
Indicator Nr M21
Indicator % of initial diagnoses occuring in inpatient settings
Tracer Depression
Numerator or calculation
Among people in the denominator: Number of people who had their initial diagnosis in an inpatient setting.
Denominator or set of people for whom to calculate
Number of people with a diagnosis of depression in year t, as per any NHS, SEMS or death registry database, who did not have this diagnosis in the preceding 12 months in any NHS or SEMS database.
Source of data 1 NHS inpatient and outpatient databases, SEMS database, death registry
Source of data 2
Diagnosis and manipulation codes
See diagnosis codes in the diagnosis codes sheet
Outstanding issues --
Notes Compute for 2010-2014 Indicators M19 to M23 should add up to 100%
References
Status DONE
Indicator Nr M21
Indicator % of initial diagnoses occuring in inpatient settings
Tracer Substance abuse
Numerator or calculation
Among people in the denominator: Number of people who had their initial diagnosis in an inpatient setting.
Denominator or set of people for whom to calculate
Number of people with a diagnosis ofsubstance abuse in year t, as per any NHS, SEMS or death registry database, who did not have this diagnosis in the preceding 12 months in any NHS or SEMS database.
Source of data 1 NHS inpatient and outpatient databases, SEMS database, death registry
Source of data 2
Diagnosis and manipulation codes
See diagnosis codes in the diagnosis codes sheet
Outstanding issues --
Notes Compute for 2010-2014 Indicators M19 to M23 should add up to 100%
References
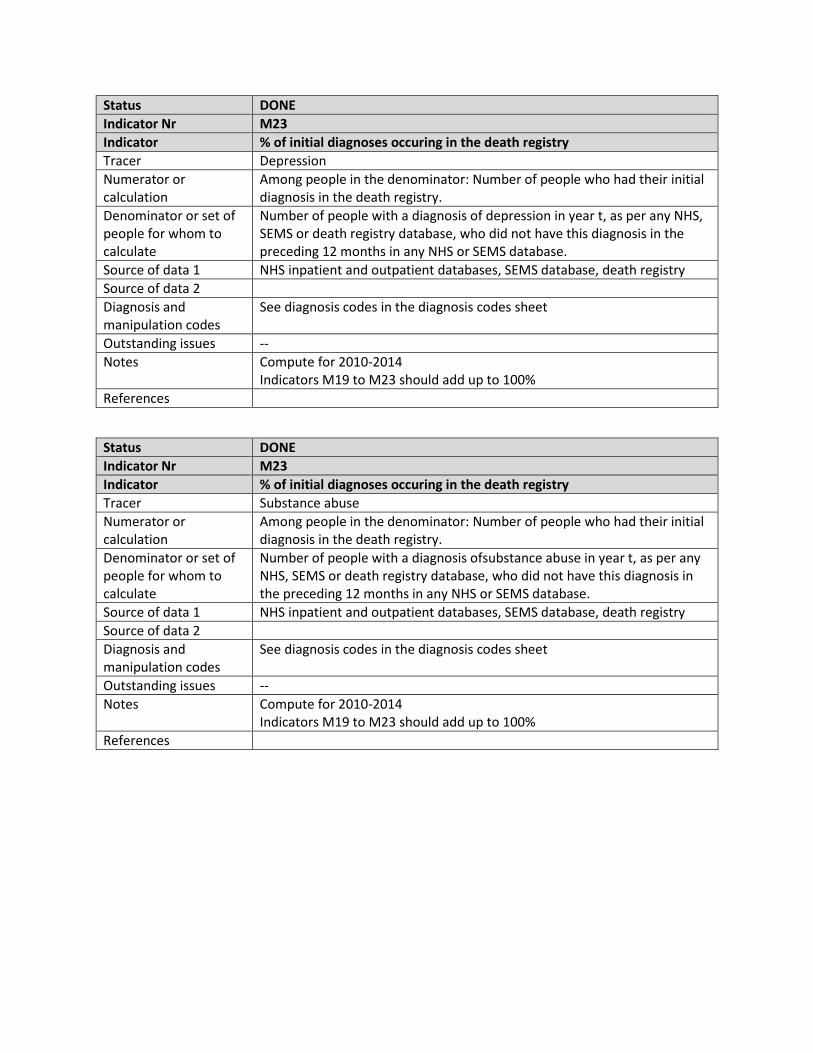
Status DONE
Indicator Nr M23
Indicator % of initial diagnoses occuring in the death registry
Tracer Depression
Numerator or calculation
Among people in the denominator: Number of people who had their initial diagnosis in the death registry.
Denominator or set of people for whom to calculate
Number of people with a diagnosis of depression in year t, as per any NHS, SEMS or death registry database, who did not have this diagnosis in the preceding 12 months in any NHS or SEMS database.
Source of data 1 NHS inpatient and outpatient databases, SEMS database, death registry
Source of data 2
Diagnosis and manipulation codes
See diagnosis codes in the diagnosis codes sheet
Outstanding issues --
Notes Compute for 2010-2014 Indicators M19 to M23 should add up to 100%
References
Status DONE
Indicator Nr M23
Indicator % of initial diagnoses occuring in the death registry
Tracer Substance abuse
Numerator or calculation
Among people in the denominator: Number of people who had their initial diagnosis in the death registry.
Denominator or set of people for whom to calculate
Number of people with a diagnosis ofsubstance abuse in year t, as per any NHS, SEMS or death registry database, who did not have this diagnosis in the preceding 12 months in any NHS or SEMS database.
Source of data 1 NHS inpatient and outpatient databases, SEMS database, death registry
Source of data 2
Diagnosis and manipulation codes
See diagnosis codes in the diagnosis codes sheet
Outstanding issues --
Notes Compute for 2010-2014 Indicators M19 to M23 should add up to 100%
References
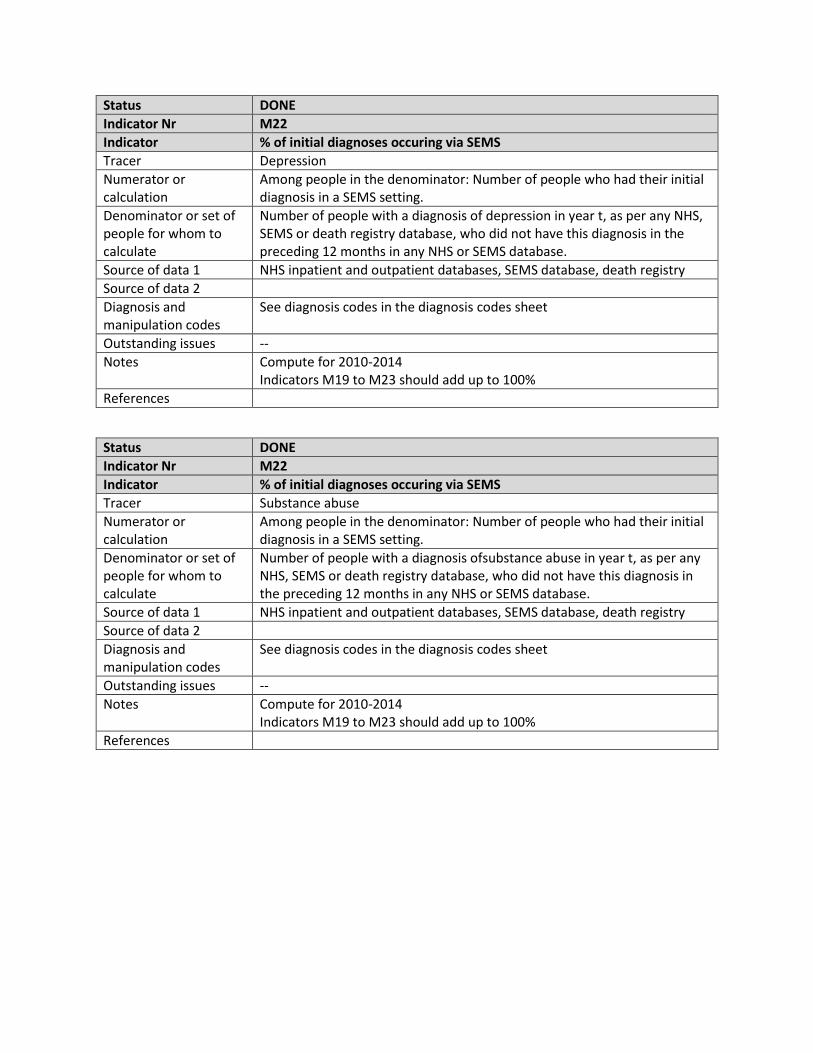
Status DONE
Indicator Nr M22
Indicator % of initial diagnoses occuring via SEMS
Tracer Depression
Numerator or calculation
Among people in the denominator: Number of people who had their initial diagnosis in a SEMS setting.
Denominator or set of people for whom to calculate
Number of people with a diagnosis of depression in year t, as per any NHS, SEMS or death registry database, who did not have this diagnosis in the preceding 12 months in any NHS or SEMS database.
Source of data 1 NHS inpatient and outpatient databases, SEMS database, death registry
Source of data 2
Diagnosis and manipulation codes
See diagnosis codes in the diagnosis codes sheet
Outstanding issues --
Notes Compute for 2010-2014 Indicators M19 to M23 should add up to 100%
References
Status DONE
Indicator Nr M22
Indicator % of initial diagnoses occuring via SEMS
Tracer Substance abuse
Numerator or calculation
Among people in the denominator: Number of people who had their initial diagnosis in a SEMS setting.
Denominator or set of people for whom to calculate
Number of people with a diagnosis ofsubstance abuse in year t, as per any NHS, SEMS or death registry database, who did not have this diagnosis in the preceding 12 months in any NHS or SEMS database.
Source of data 1 NHS inpatient and outpatient databases, SEMS database, death registry
Source of data 2
Diagnosis and manipulation codes
See diagnosis codes in the diagnosis codes sheet
Outstanding issues --
Notes Compute for 2010-2014 Indicators M19 to M23 should add up to 100%
References
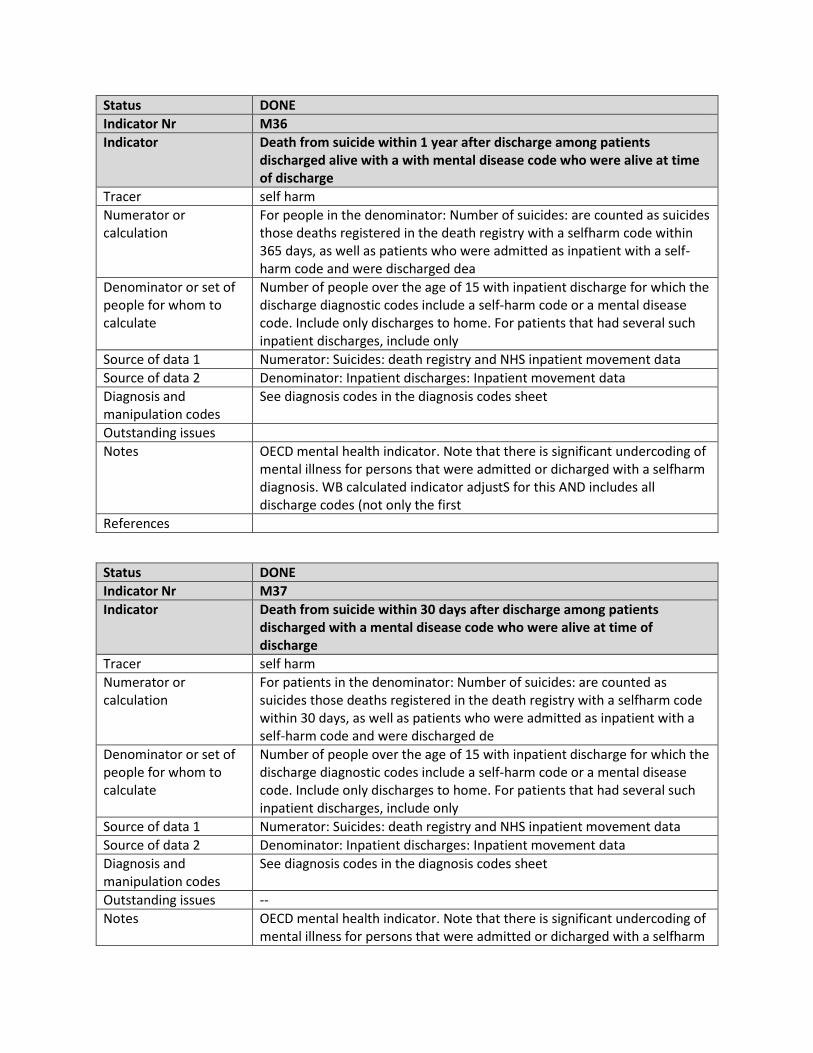
Status DONE
Indicator Nr M36
Indicator Death from suicide within 1 year after discharge among patients discharged alive with a with mental disease code who were alive at time of discharge
Tracer self harm
Numerator or calculation
For people in the denominator: Number of suicides: are counted as suicides those deaths registered in the death registry with a selfharm code within 365 days, as well as patients who were admitted as inpatient with a self-harm code and were discharged dea
Denominator or set of people for whom to calculate
Number of people over the age of 15 with inpatient discharge for which the discharge diagnostic codes include a self-harm code or a mental disease code. Include only discharges to home. For patients that had several such inpatient discharges, include only
Source of data 1 Numerator: Suicides: death registry and NHS inpatient movement data
Source of data 2 Denominator: Inpatient discharges: Inpatient movement data
Diagnosis and manipulation codes
See diagnosis codes in the diagnosis codes sheet
Outstanding issues
Notes OECD mental health indicator. Note that there is significant undercoding of mental illness for persons that were admitted or dicharged with a selfharm diagnosis. WB calculated indicator adjustS for this AND includes all discharge codes (not only the first
References
Status DONE
Indicator Nr M37
Indicator Death from suicide within 30 days after discharge among patients discharged with a mental disease code who were alive at time of discharge
Tracer self harm
Numerator or calculation
For patients in the denominator: Number of suicides: are counted as suicides those deaths registered in the death registry with a selfharm code within 30 days, as well as patients who were admitted as inpatient with a self-harm code and were discharged de
Denominator or set of people for whom to calculate
Number of people over the age of 15 with inpatient discharge for which the discharge diagnostic codes include a self-harm code or a mental disease code. Include only discharges to home. For patients that had several such inpatient discharges, include only
Source of data 1 Numerator: Suicides: death registry and NHS inpatient movement data
Source of data 2 Denominator: Inpatient discharges: Inpatient movement data
Diagnosis and manipulation codes
See diagnosis codes in the diagnosis codes sheet
Outstanding issues --
Notes OECD mental health indicator. Note that there is significant undercoding of mental illness for persons that were admitted or dicharged with a selfharm
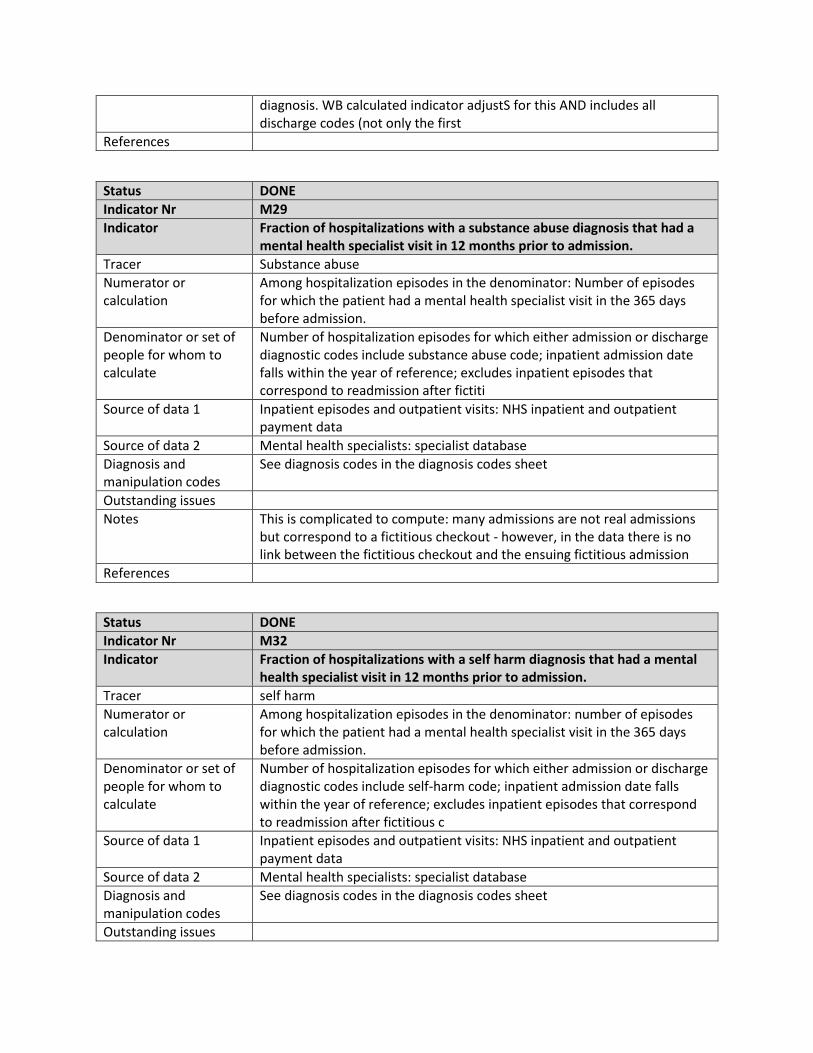
diagnosis. WB calculated indicator adjustS for this AND includes all discharge codes (not only the first
References
Status DONE
Indicator Nr M29
Indicator Fraction of hospitalizations with a substance abuse diagnosis that had a mental health specialist visit in 12 months prior to admission.
Tracer Substance abuse
Numerator or calculation
Among hospitalization episodes in the denominator: Number of episodes for which the patient had a mental health specialist visit in the 365 days before admission.
Denominator or set of people for whom to calculate
Number of hospitalization episodes for which either admission or discharge diagnostic codes include substance abuse code; inpatient admission date falls within the year of reference; excludes inpatient episodes that correspond to readmission after fictiti
Source of data 1 Inpatient episodes and outpatient visits: NHS inpatient and outpatient payment data
Source of data 2 Mental health specialists: specialist database
Diagnosis and manipulation codes
See diagnosis codes in the diagnosis codes sheet
Outstanding issues
Notes This is complicated to compute: many admissions are not real admissions but correspond to a fictitious checkout - however, in the data there is no link between the fictitious checkout and the ensuing fictitious admission
References
Status DONE
Indicator Nr M32
Indicator Fraction of hospitalizations with a self harm diagnosis that had a mental health specialist visit in 12 months prior to admission.
Tracer self harm
Numerator or calculation
Among hospitalization episodes in the denominator: number of episodes for which the patient had a mental health specialist visit in the 365 days before admission.
Denominator or set of people for whom to calculate
Number of hospitalization episodes for which either admission or discharge diagnostic codes include self-harm code; inpatient admission date falls within the year of reference; excludes inpatient episodes that correspond to readmission after fictitious c
Source of data 1 Inpatient episodes and outpatient visits: NHS inpatient and outpatient payment data
Source of data 2 Mental health specialists: specialist database
Diagnosis and manipulation codes
See diagnosis codes in the diagnosis codes sheet
Outstanding issues
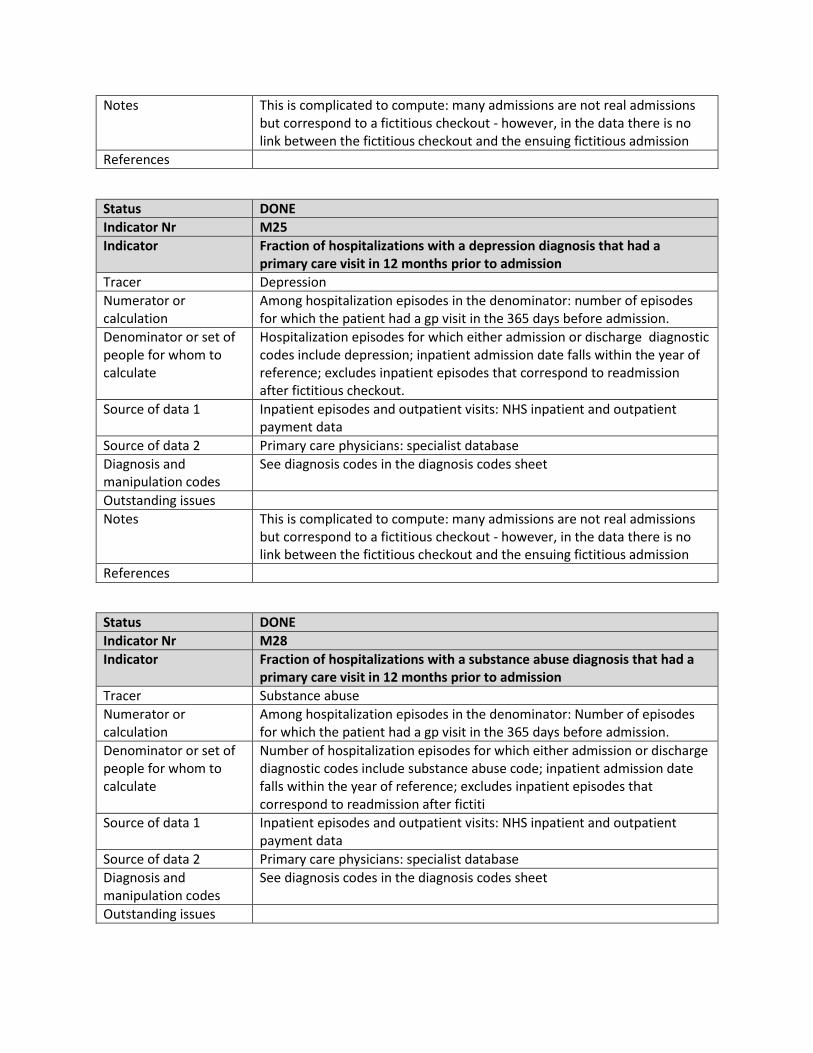
Notes This is complicated to compute: many admissions are not real admissions but correspond to a fictitious checkout - however, in the data there is no link between the fictitious checkout and the ensuing fictitious admission
References
Status DONE
Indicator Nr M25
Indicator Fraction of hospitalizations with a depression diagnosis that had a primary care visit in 12 months prior to admission
Tracer Depression
Numerator or calculation
Among hospitalization episodes in the denominator: number of episodes for which the patient had a gp visit in the 365 days before admission.
Denominator or set of people for whom to calculate
Hospitalization episodes for which either admission or discharge diagnostic codes include depression; inpatient admission date falls within the year of reference; excludes inpatient episodes that correspond to readmission after fictitious checkout.
Source of data 1 Inpatient episodes and outpatient visits: NHS inpatient and outpatient payment data
Source of data 2 Primary care physicians: specialist database
Diagnosis and manipulation codes
See diagnosis codes in the diagnosis codes sheet
Outstanding issues
Notes This is complicated to compute: many admissions are not real admissions but correspond to a fictitious checkout - however, in the data there is no link between the fictitious checkout and the ensuing fictitious admission
References
Status DONE
Indicator Nr M28
Indicator Fraction of hospitalizations with a substance abuse diagnosis that had a primary care visit in 12 months prior to admission
Tracer Substance abuse
Numerator or calculation
Among hospitalization episodes in the denominator: Number of episodes for which the patient had a gp visit in the 365 days before admission.
Denominator or set of people for whom to calculate
Number of hospitalization episodes for which either admission or discharge diagnostic codes include substance abuse code; inpatient admission date falls within the year of reference; excludes inpatient episodes that correspond to readmission after fictiti
Source of data 1 Inpatient episodes and outpatient visits: NHS inpatient and outpatient payment data
Source of data 2 Primary care physicians: specialist database
Diagnosis and manipulation codes
See diagnosis codes in the diagnosis codes sheet
Outstanding issues
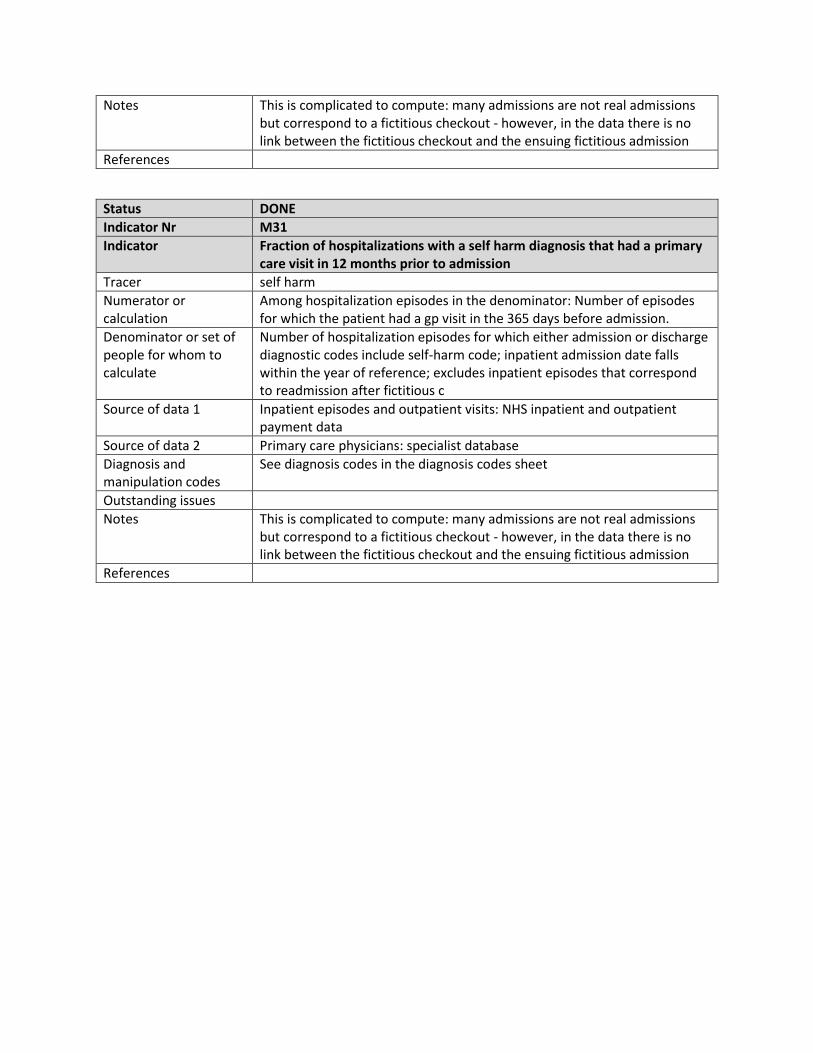
Notes This is complicated to compute: many admissions are not real admissions but correspond to a fictitious checkout - however, in the data there is no link between the fictitious checkout and the ensuing fictitious admission
References
Status DONE
Indicator Nr M31
Indicator Fraction of hospitalizations with a self harm diagnosis that had a primary care visit in 12 months prior to admission
Tracer self harm
Numerator or calculation
Among hospitalization episodes in the denominator: Number of episodes for which the patient had a gp visit in the 365 days before admission.
Denominator or set of people for whom to calculate
Number of hospitalization episodes for which either admission or discharge diagnostic codes include self-harm code; inpatient admission date falls within the year of reference; excludes inpatient episodes that correspond to readmission after fictitious c
Source of data 1 Inpatient episodes and outpatient visits: NHS inpatient and outpatient payment data
Source of data 2 Primary care physicians: specialist database
Diagnosis and manipulation codes
See diagnosis codes in the diagnosis codes sheet
Outstanding issues
Notes This is complicated to compute: many admissions are not real admissions but correspond to a fictitious checkout - however, in the data there is no link between the fictitious checkout and the ensuing fictitious admission
References
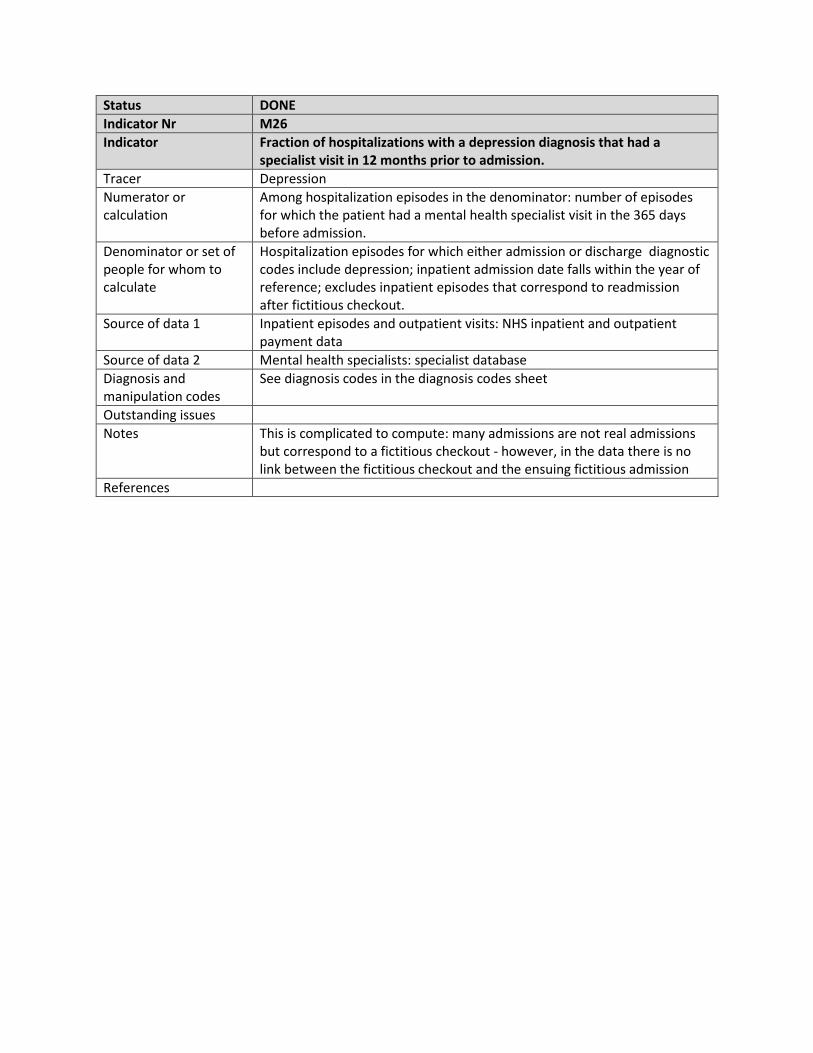
Status DONE
Indicator Nr M26
Indicator Fraction of hospitalizations with a depression diagnosis that had a specialist visit in 12 months prior to admission.
Tracer Depression
Numerator or calculation
Among hospitalization episodes in the denominator: number of episodes for which the patient had a mental health specialist visit in the 365 days before admission.
Denominator or set of people for whom to calculate
Hospitalization episodes for which either admission or discharge diagnostic codes include depression; inpatient admission date falls within the year of reference; excludes inpatient episodes that correspond to readmission after fictitious checkout.
Source of data 1 Inpatient episodes and outpatient visits: NHS inpatient and outpatient payment data
Source of data 2 Mental health specialists: specialist database
Diagnosis and manipulation codes
See diagnosis codes in the diagnosis codes sheet
Outstanding issues
Notes This is complicated to compute: many admissions are not real admissions but correspond to a fictitious checkout - however, in the data there is no link between the fictitious checkout and the ensuing fictitious admission
References
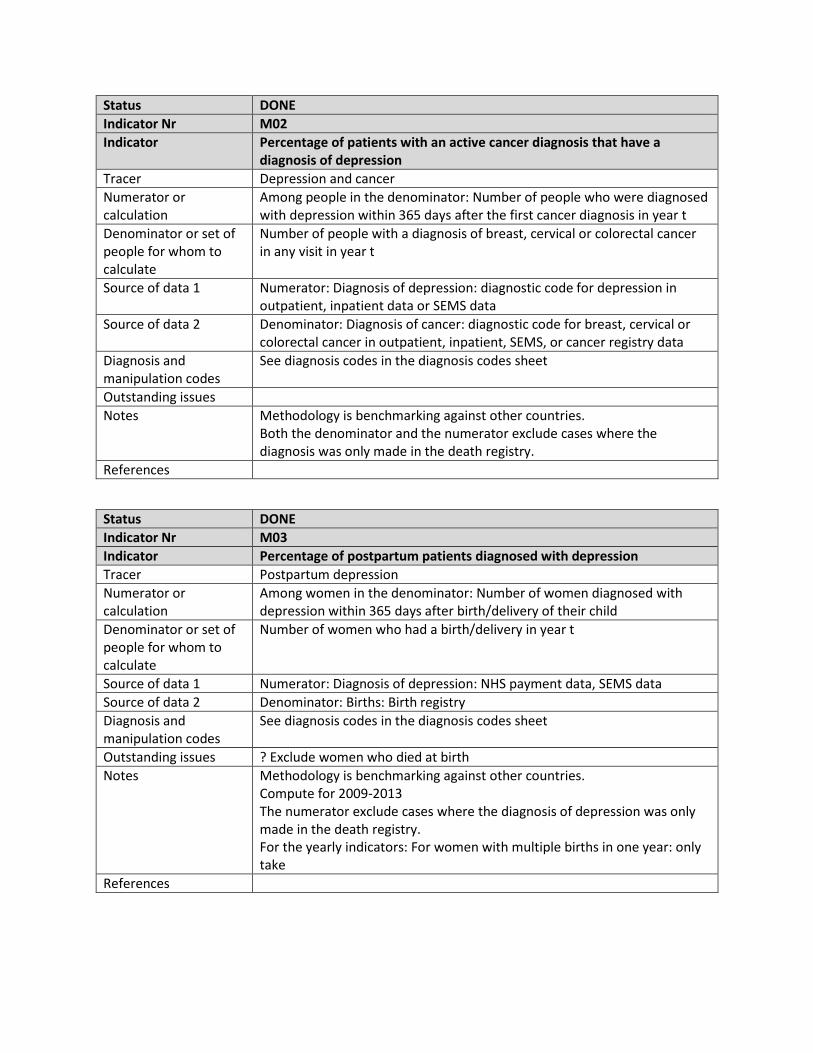
Status DONE
Indicator Nr M02
Indicator Percentage of patients with an active cancer diagnosis that have a diagnosis of depression
Tracer Depression and cancer
Numerator or calculation
Among people in the denominator: Number of people who were diagnosed with depression within 365 days after the first cancer diagnosis in year t
Denominator or set of people for whom to calculate
Number of people with a diagnosis of breast, cervical or colorectal cancer in any visit in year t
Source of data 1 Numerator: Diagnosis of depression: diagnostic code for depression in outpatient, inpatient data or SEMS data
Source of data 2 Denominator: Diagnosis of cancer: diagnostic code for breast, cervical or colorectal cancer in outpatient, inpatient, SEMS, or cancer registry data
Diagnosis and manipulation codes
See diagnosis codes in the diagnosis codes sheet
Outstanding issues
Notes Methodology is benchmarking against other countries. Both the denominator and the numerator exclude cases where the diagnosis was only made in the death registry.
References
Status DONE
Indicator Nr M03
Indicator Percentage of postpartum patients diagnosed with depression
Tracer Postpartum depression
Numerator or calculation
Among women in the denominator: Number of women diagnosed with depression within 365 days after birth/delivery of their child
Denominator or set of people for whom to calculate
Number of women who had a birth/delivery in year t
Source of data 1 Numerator: Diagnosis of depression: NHS payment data, SEMS data
Source of data 2 Denominator: Births: Birth registry
Diagnosis and manipulation codes
See diagnosis codes in the diagnosis codes sheet
Outstanding issues ? Exclude women who died at birth
Notes Methodology is benchmarking against other countries. Compute for 2009-2013 The numerator exclude cases where the diagnosis of depression was only made in the death registry. For the yearly indicators: For women with multiple births in one year: only take
References
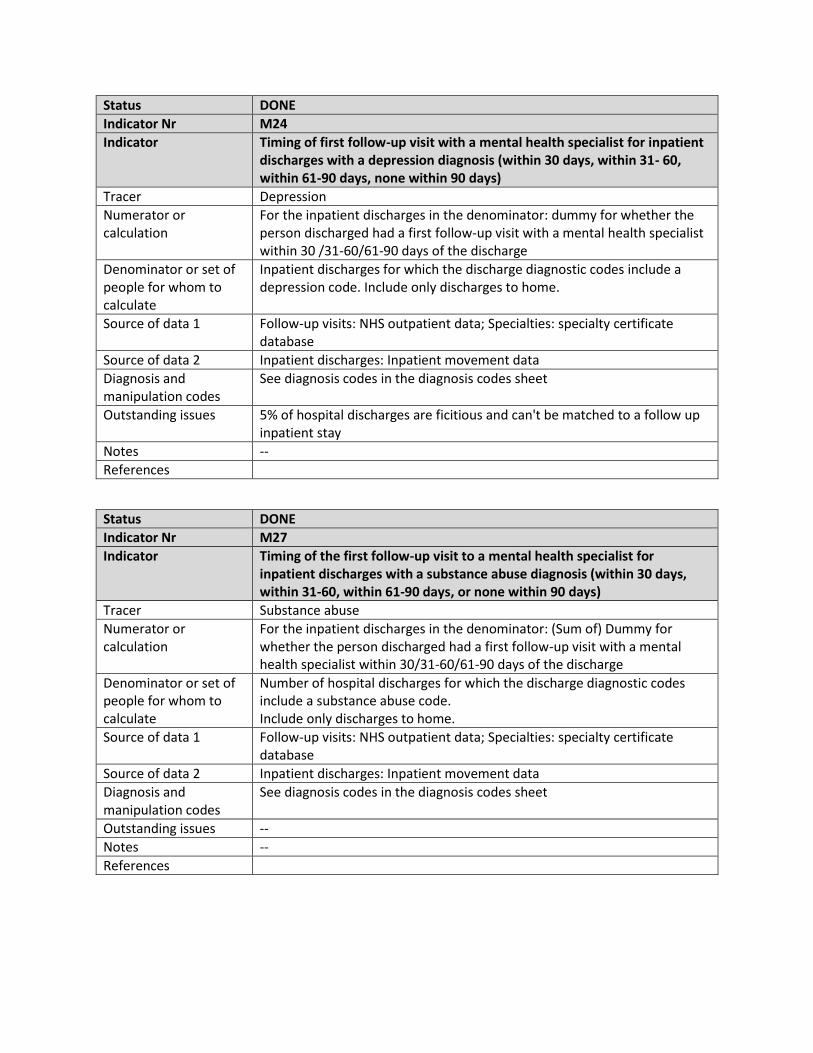
Status DONE
Indicator Nr M24
Indicator Timing of first follow-up visit with a mental health specialist for inpatient discharges with a depression diagnosis (within 30 days, within 31- 60, within 61-90 days, none within 90 days)
Tracer Depression
Numerator or calculation
For the inpatient discharges in the denominator: dummy for whether the person discharged had a first follow-up visit with a mental health specialist within 30 /31-60/61-90 days of the discharge
Denominator or set of people for whom to calculate
Inpatient discharges for which the discharge diagnostic codes include a depression code. Include only discharges to home.
Source of data 1 Follow-up visits: NHS outpatient data; Specialties: specialty certificate database
Source of data 2 Inpatient discharges: Inpatient movement data
Diagnosis and manipulation codes
See diagnosis codes in the diagnosis codes sheet
Outstanding issues 5% of hospital discharges are ficitious and can't be matched to a follow up inpatient stay
Notes --
References
Status DONE
Indicator Nr M27
Indicator Timing of the first follow-up visit to a mental health specialist for inpatient discharges with a substance abuse diagnosis (within 30 days, within 31-60, within 61-90 days, or none within 90 days)
Tracer Substance abuse
Numerator or calculation
For the inpatient discharges in the denominator: (Sum of) Dummy for whether the person discharged had a first follow-up visit with a mental health specialist within 30/31-60/61-90 days of the discharge
Denominator or set of people for whom to calculate
Number of hospital discharges for which the discharge diagnostic codes include a substance abuse code. Include only discharges to home.
Source of data 1 Follow-up visits: NHS outpatient data; Specialties: specialty certificate database
Source of data 2 Inpatient discharges: Inpatient movement data
Diagnosis and manipulation codes
See diagnosis codes in the diagnosis codes sheet
Outstanding issues --
Notes --
References
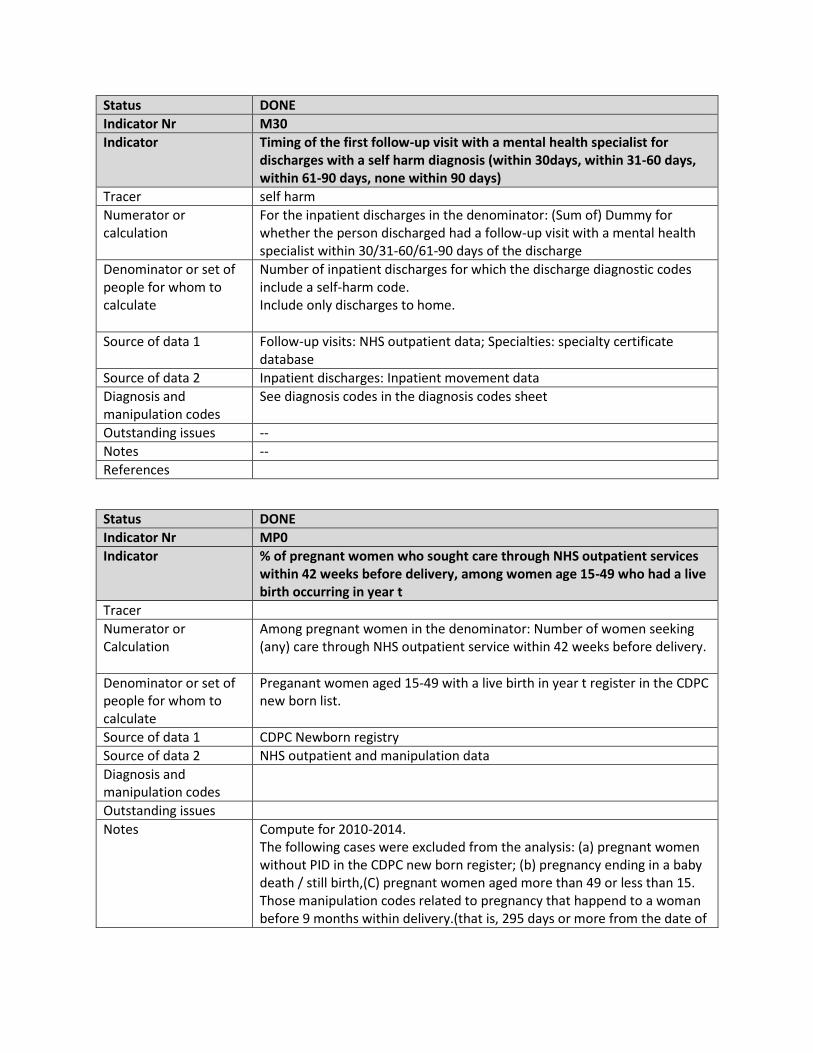
Status DONE
Indicator Nr M30
Indicator Timing of the first follow-up visit with a mental health specialist for discharges with a self harm diagnosis (within 30days, within 31-60 days, within 61-90 days, none within 90 days)
Tracer self harm
Numerator or calculation
For the inpatient discharges in the denominator: (Sum of) Dummy for whether the person discharged had a follow-up visit with a mental health specialist within 30/31-60/61-90 days of the discharge
Denominator or set of people for whom to calculate
Number of inpatient discharges for which the discharge diagnostic codes include a self-harm code. Include only discharges to home.
Source of data 1 Follow-up visits: NHS outpatient data; Specialties: specialty certificate database
Source of data 2 Inpatient discharges: Inpatient movement data
Diagnosis and manipulation codes
See diagnosis codes in the diagnosis codes sheet
Outstanding issues --
Notes --
References
Status DONE
Indicator Nr MP0
Indicator % of pregnant women who sought care through NHS outpatient services within 42 weeks before delivery, among women age 15-49 who had a live birth occurring in year t
Tracer
Numerator or Calculation
Among pregnant women in the denominator: Number of women seeking (any) care through NHS outpatient service within 42 weeks before delivery.
Denominator or set of people for whom to calculate
Preganant women aged 15-49 with a live birth in year t register in the CDPC new born list.
Source of data 1 CDPC Newborn registry
Source of data 2 NHS outpatient and manipulation data
Diagnosis and manipulation codes
Outstanding issues
Notes Compute for 2010-2014. The following cases were excluded from the analysis: (a) pregnant women without PID in the CDPC new born register; (b) pregnancy ending in a baby death / still birth,(C) pregnant women aged more than 49 or less than 15. Those manipulation codes related to pregnancy that happend to a woman before 9 months within delivery.(that is, 295 days or more from the date of
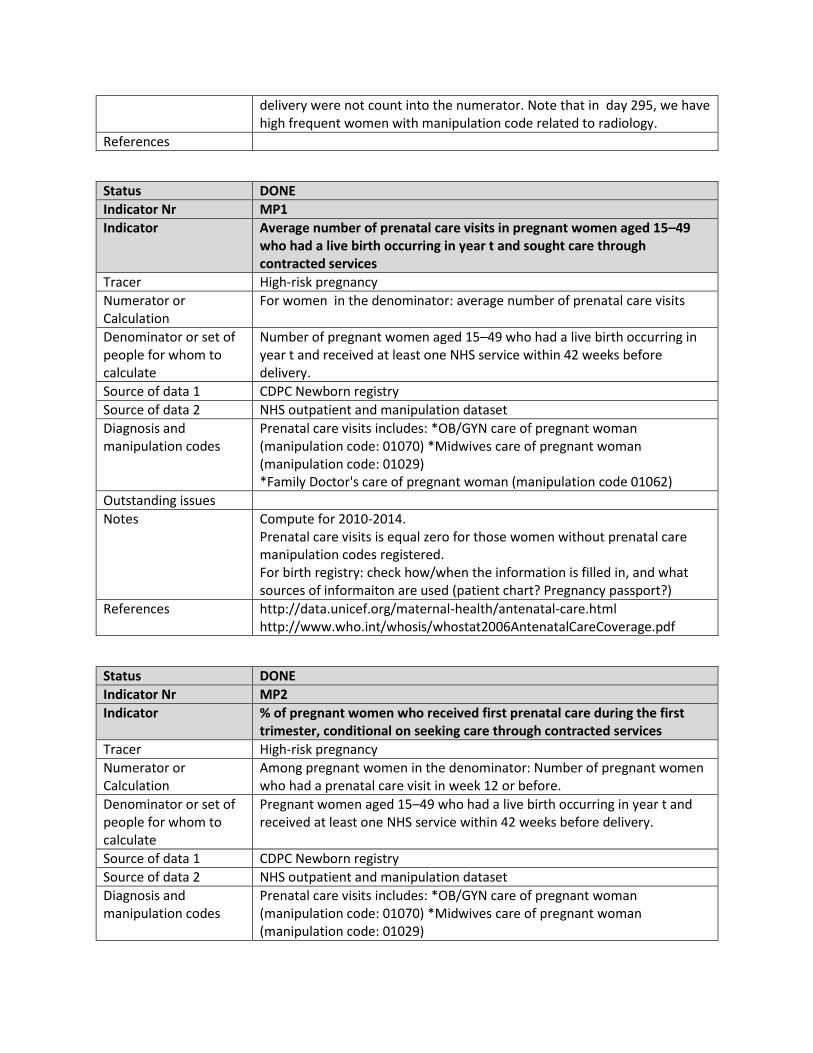
delivery were not count into the numerator. Note that in day 295, we have high frequent women with manipulation code related to radiology.
References
Status DONE
Indicator Nr MP1
Indicator Average number of prenatal care visits in pregnant women aged 15–49 who had a live birth occurring in year t and sought care through contracted services
Tracer High-risk pregnancy
Numerator or Calculation
For women in the denominator: average number of prenatal care visits
Denominator or set of people for whom to calculate
Number of pregnant women aged 15–49 who had a live birth occurring in year t and received at least one NHS service within 42 weeks before delivery.
Source of data 1 CDPC Newborn registry
Source of data 2 NHS outpatient and manipulation dataset
Diagnosis and manipulation codes
Prenatal care visits includes: *OB/GYN care of pregnant woman (manipulation code: 01070) *Midwives care of pregnant woman (manipulation code: 01029) *Family Doctor's care of pregnant woman (manipulation code 01062)
Outstanding issues
Notes Compute for 2010-2014. Prenatal care visits is equal zero for those women without prenatal care manipulation codes registered. For birth registry: check how/when the information is filled in, and what sources of informaiton are used (patient chart? Pregnancy passport?)
References http://data.unicef.org/maternal-health/antenatal-care.html http://www.who.int/whosis/whostat2006AntenatalCareCoverage.pdf
Status DONE
Indicator Nr MP2
Indicator % of pregnant women who received first prenatal care during the first trimester, conditional on seeking care through contracted services
Tracer High-risk pregnancy
Numerator or Calculation
Among pregnant women in the denominator: Number of pregnant women who had a prenatal care visit in week 12 or before.
Denominator or set of people for whom to calculate
Pregnant women aged 15–49 who had a live birth occurring in year t and received at least one NHS service within 42 weeks before delivery.
Source of data 1 CDPC Newborn registry
Source of data 2 NHS outpatient and manipulation dataset
Diagnosis and manipulation codes
Prenatal care visits includes: *OB/GYN care of pregnant woman (manipulation code: 01070) *Midwives care of pregnant woman (manipulation code: 01029)
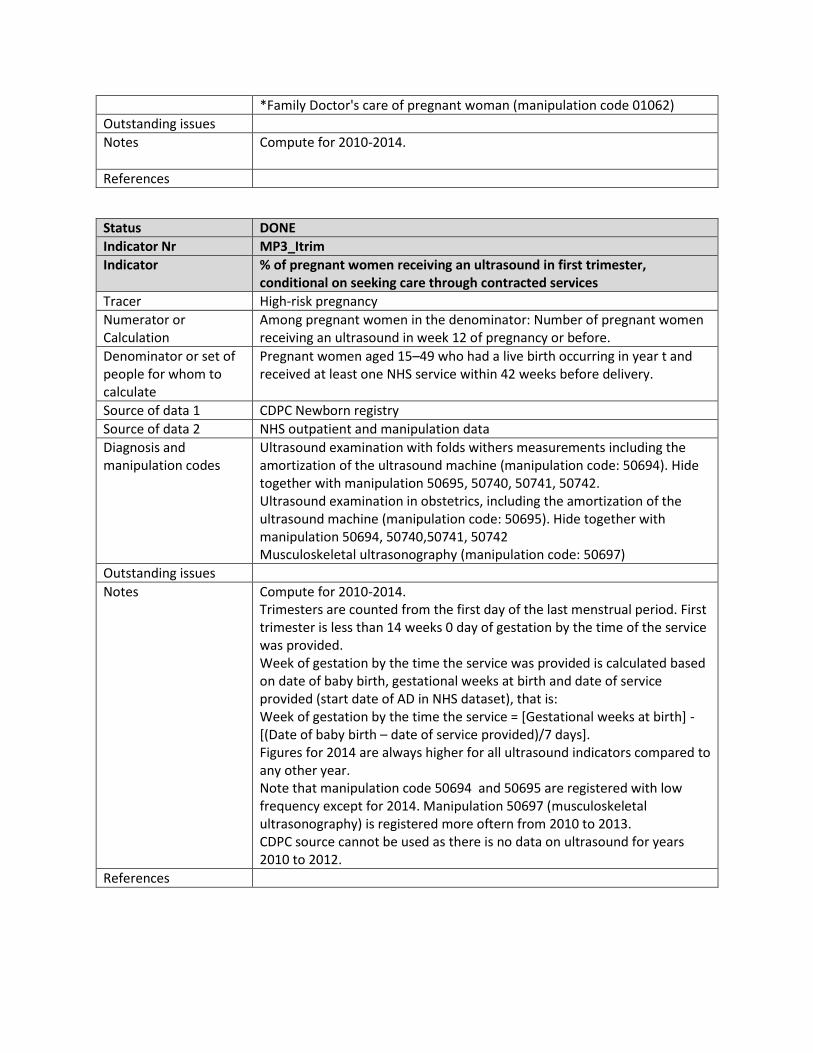
*Family Doctor's care of pregnant woman (manipulation code 01062)
Outstanding issues
Notes Compute for 2010-2014.
References
Status DONE
Indicator Nr MP3_Itrim
Indicator % of pregnant women receiving an ultrasound in first trimester, conditional on seeking care through contracted services
Tracer High-risk pregnancy
Numerator or Calculation
Among pregnant women in the denominator: Number of pregnant women receiving an ultrasound in week 12 of pregnancy or before.
Denominator or set of people for whom to calculate
Pregnant women aged 15–49 who had a live birth occurring in year t and received at least one NHS service within 42 weeks before delivery.
Source of data 1 CDPC Newborn registry
Source of data 2 NHS outpatient and manipulation data
Diagnosis and manipulation codes
Ultrasound examination with folds withers measurements including the amortization of the ultrasound machine (manipulation code: 50694). Hide together with manipulation 50695, 50740, 50741, 50742. Ultrasound examination in obstetrics, including the amortization of the ultrasound machine (manipulation code: 50695). Hide together with manipulation 50694, 50740,50741, 50742 Musculoskeletal ultrasonography (manipulation code: 50697)
Outstanding issues
Notes Compute for 2010-2014. Trimesters are counted from the first day of the last menstrual period. First trimester is less than 14 weeks 0 day of gestation by the time of the service was provided. Week of gestation by the time the service was provided is calculated based on date of baby birth, gestational weeks at birth and date of service provided (start date of AD in NHS dataset), that is: Week of gestation by the time the service = [Gestational weeks at birth] - [(Date of baby birth – date of service provided)/7 days]. Figures for 2014 are always higher for all ultrasound indicators compared to any other year. Note that manipulation code 50694 and 50695 are registered with low frequency except for 2014. Manipulation 50697 (musculoskeletal ultrasonography) is registered more oftern from 2010 to 2013. CDPC source cannot be used as there is no data on ultrasound for years 2010 to 2012.
References
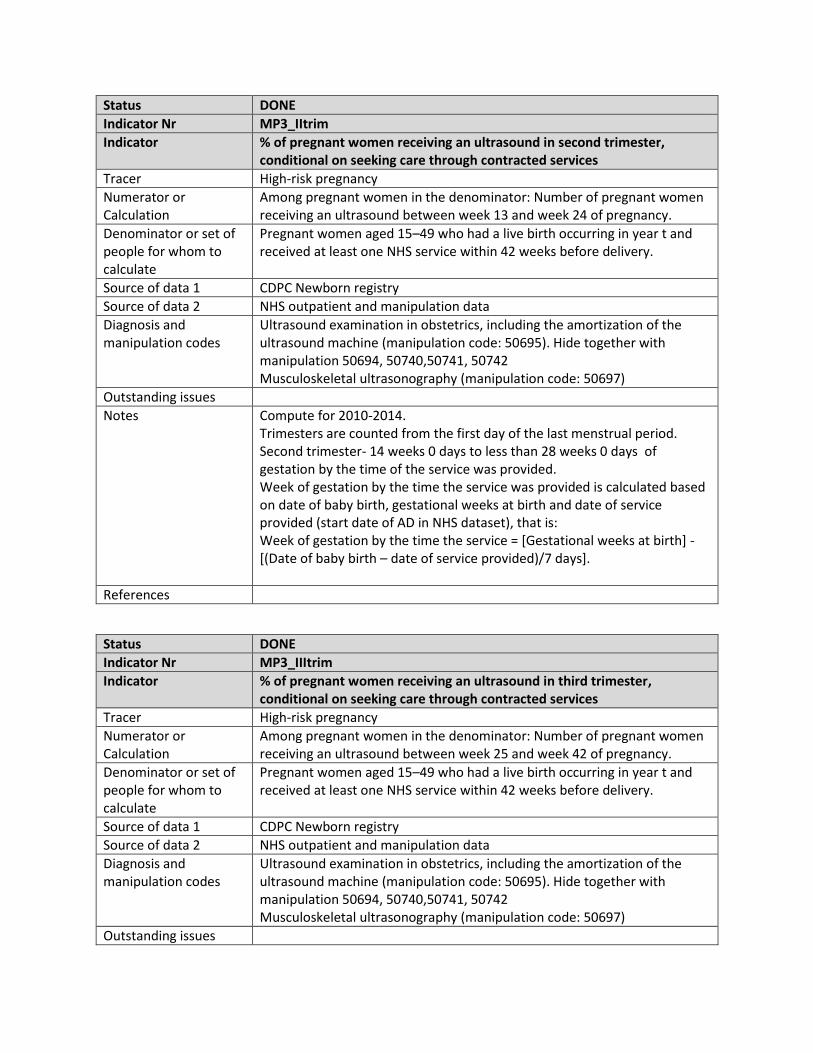
Status DONE
Indicator Nr MP3_IItrim
Indicator % of pregnant women receiving an ultrasound in second trimester, conditional on seeking care through contracted services
Tracer High-risk pregnancy
Numerator or Calculation
Among pregnant women in the denominator: Number of pregnant women receiving an ultrasound between week 13 and week 24 of pregnancy.
Denominator or set of people for whom to calculate
Pregnant women aged 15–49 who had a live birth occurring in year t and received at least one NHS service within 42 weeks before delivery.
Source of data 1 CDPC Newborn registry
Source of data 2 NHS outpatient and manipulation data
Diagnosis and manipulation codes
Ultrasound examination in obstetrics, including the amortization of the ultrasound machine (manipulation code: 50695). Hide together with manipulation 50694, 50740,50741, 50742 Musculoskeletal ultrasonography (manipulation code: 50697)
Outstanding issues
Notes Compute for 2010-2014. Trimesters are counted from the first day of the last menstrual period. Second trimester- 14 weeks 0 days to less than 28 weeks 0 days of gestation by the time of the service was provided. Week of gestation by the time the service was provided is calculated based on date of baby birth, gestational weeks at birth and date of service provided (start date of AD in NHS dataset), that is: Week of gestation by the time the service = [Gestational weeks at birth] - [(Date of baby birth – date of service provided)/7 days].
References
Status DONE
Indicator Nr MP3_IIItrim
Indicator % of pregnant women receiving an ultrasound in third trimester, conditional on seeking care through contracted services
Tracer High-risk pregnancy
Numerator or Calculation
Among pregnant women in the denominator: Number of pregnant women receiving an ultrasound between week 25 and week 42 of pregnancy.
Denominator or set of people for whom to calculate
Pregnant women aged 15–49 who had a live birth occurring in year t and received at least one NHS service within 42 weeks before delivery.
Source of data 1 CDPC Newborn registry
Source of data 2 NHS outpatient and manipulation data
Diagnosis and manipulation codes
Ultrasound examination in obstetrics, including the amortization of the ultrasound machine (manipulation code: 50695). Hide together with manipulation 50694, 50740,50741, 50742 Musculoskeletal ultrasonography (manipulation code: 50697)
Outstanding issues
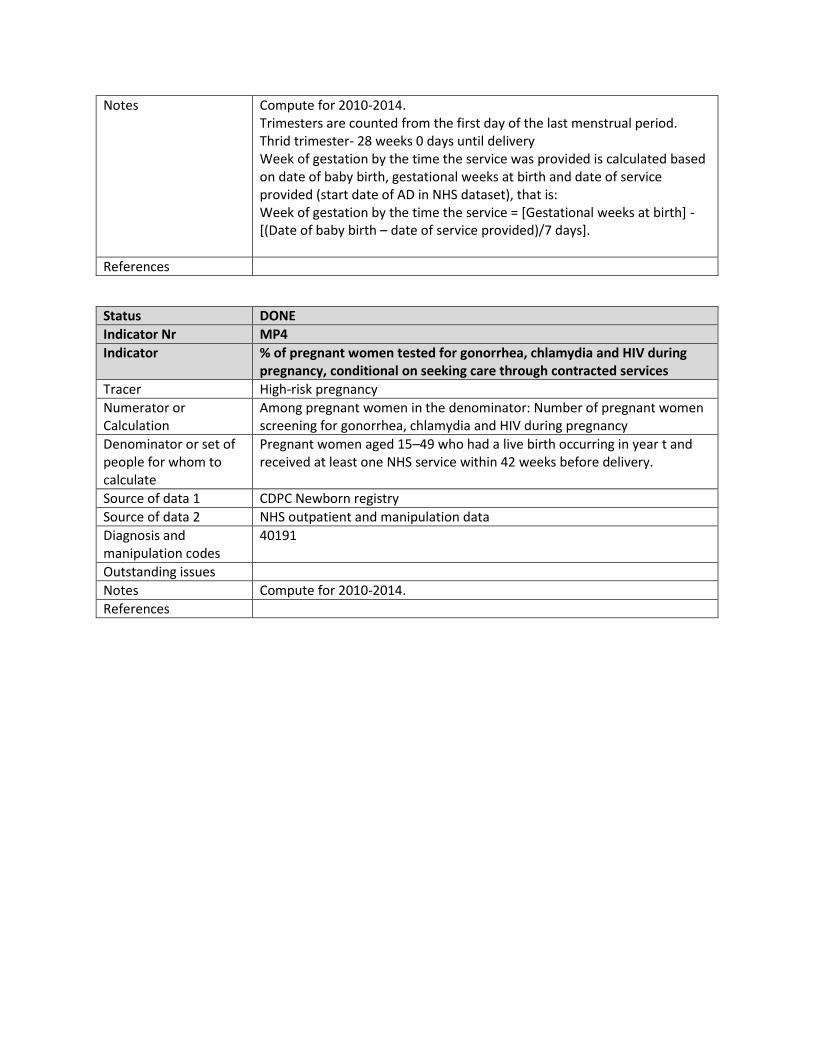
Notes Compute for 2010-2014. Trimesters are counted from the first day of the last menstrual period. Thrid trimester- 28 weeks 0 days until delivery Week of gestation by the time the service was provided is calculated based on date of baby birth, gestational weeks at birth and date of service provided (start date of AD in NHS dataset), that is: Week of gestation by the time the service = [Gestational weeks at birth] - [(Date of baby birth – date of service provided)/7 days].
References
Status DONE
Indicator Nr MP4
Indicator % of pregnant women tested for gonorrhea, chlamydia and HIV during pregnancy, conditional on seeking care through contracted services
Tracer High-risk pregnancy
Numerator or Calculation
Among pregnant women in the denominator: Number of pregnant women screening for gonorrhea, chlamydia and HIV during pregnancy
Denominator or set of people for whom to calculate
Pregnant women aged 15–49 who had a live birth occurring in year t and received at least one NHS service within 42 weeks before delivery.
Source of data 1 CDPC Newborn registry
Source of data 2 NHS outpatient and manipulation data
Diagnosis and manipulation codes
40191
Outstanding issues
Notes Compute for 2010-2014.
References
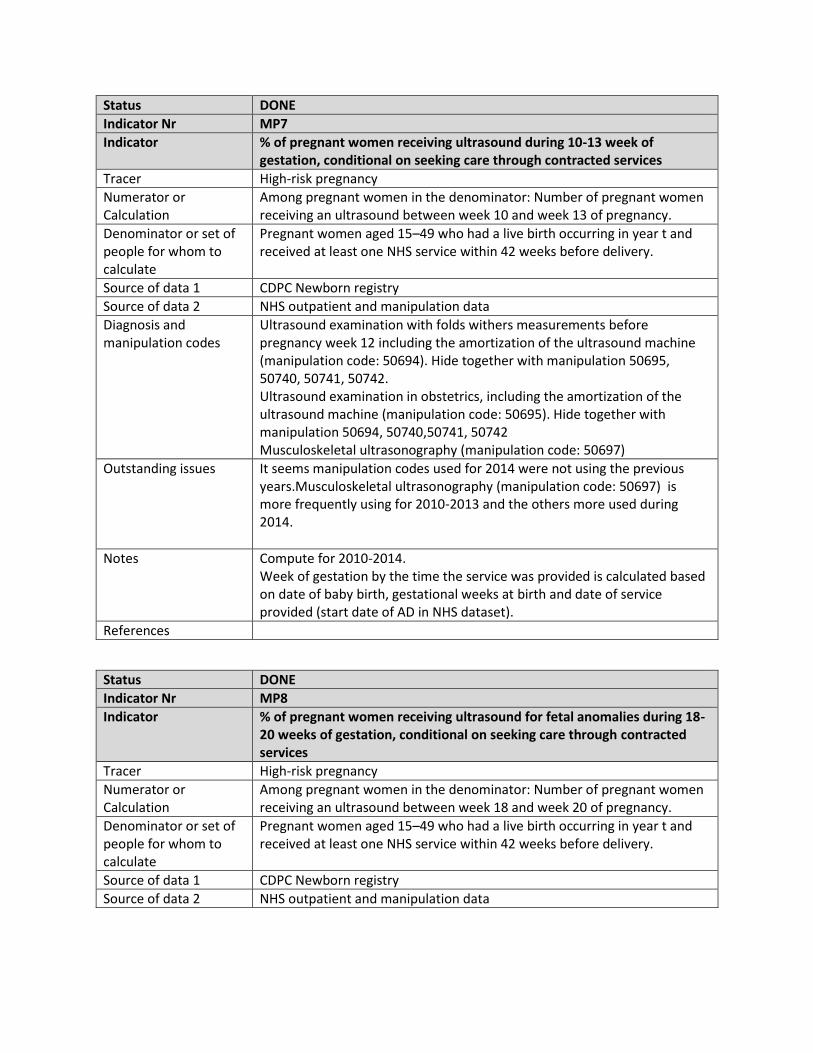
Status DONE
Indicator Nr MP7
Indicator % of pregnant women receiving ultrasound during 10-13 week of gestation, conditional on seeking care through contracted services
Tracer High-risk pregnancy
Numerator or Calculation
Among pregnant women in the denominator: Number of pregnant women receiving an ultrasound between week 10 and week 13 of pregnancy.
Denominator or set of people for whom to calculate
Pregnant women aged 15–49 who had a live birth occurring in year t and received at least one NHS service within 42 weeks before delivery.
Source of data 1 CDPC Newborn registry
Source of data 2 NHS outpatient and manipulation data
Diagnosis and manipulation codes
Ultrasound examination with folds withers measurements before pregnancy week 12 including the amortization of the ultrasound machine (manipulation code: 50694). Hide together with manipulation 50695, 50740, 50741, 50742. Ultrasound examination in obstetrics, including the amortization of the ultrasound machine (manipulation code: 50695). Hide together with manipulation 50694, 50740,50741, 50742 Musculoskeletal ultrasonography (manipulation code: 50697)
Outstanding issues It seems manipulation codes used for 2014 were not using the previous years.Musculoskeletal ultrasonography (manipulation code: 50697) is more frequently using for 2010-2013 and the others more used during 2014.
Notes Compute for 2010-2014. Week of gestation by the time the service was provided is calculated based on date of baby birth, gestational weeks at birth and date of service provided (start date of AD in NHS dataset).
References
Status DONE
Indicator Nr MP8
Indicator % of pregnant women receiving ultrasound for fetal anomalies during 18-20 weeks of gestation, conditional on seeking care through contracted services
Tracer High-risk pregnancy
Numerator or Calculation
Among pregnant women in the denominator: Number of pregnant women receiving an ultrasound between week 18 and week 20 of pregnancy.
Denominator or set of people for whom to calculate
Pregnant women aged 15–49 who had a live birth occurring in year t and received at least one NHS service within 42 weeks before delivery.
Source of data 1 CDPC Newborn registry
Source of data 2 NHS outpatient and manipulation data
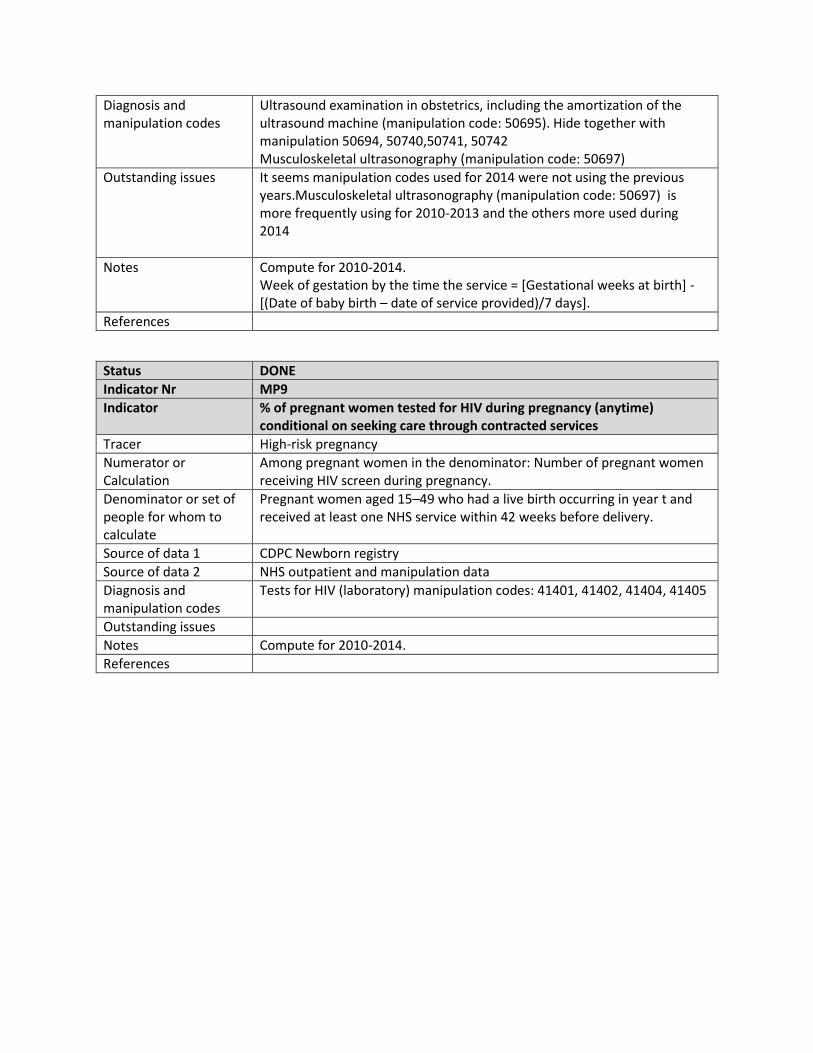
Diagnosis and manipulation codes
Ultrasound examination in obstetrics, including the amortization of the ultrasound machine (manipulation code: 50695). Hide together with manipulation 50694, 50740,50741, 50742 Musculoskeletal ultrasonography (manipulation code: 50697)
Outstanding issues It seems manipulation codes used for 2014 were not using the previous years.Musculoskeletal ultrasonography (manipulation code: 50697) is more frequently using for 2010-2013 and the others more used during 2014
Notes Compute for 2010-2014. Week of gestation by the time the service = [Gestational weeks at birth] - [(Date of baby birth – date of service provided)/7 days].
References
Status DONE
Indicator Nr MP9
Indicator % of pregnant women tested for HIV during pregnancy (anytime) conditional on seeking care through contracted services
Tracer High-risk pregnancy
Numerator or Calculation
Among pregnant women in the denominator: Number of pregnant women receiving HIV screen during pregnancy.
Denominator or set of people for whom to calculate
Pregnant women aged 15–49 who had a live birth occurring in year t and received at least one NHS service within 42 weeks before delivery.
Source of data 1 CDPC Newborn registry
Source of data 2 NHS outpatient and manipulation data
Diagnosis and manipulation codes
Tests for HIV (laboratory) manipulation codes: 41401, 41402, 41404, 41405
Outstanding issues
Notes Compute for 2010-2014.
References
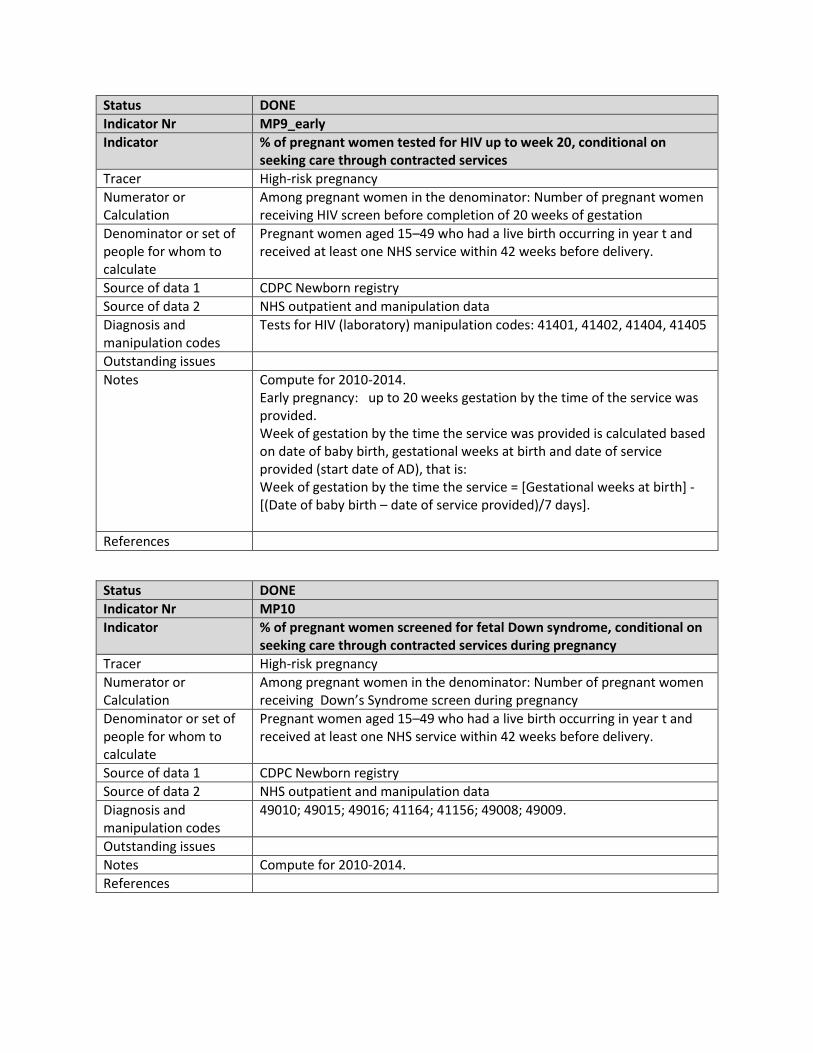
Status DONE
Indicator Nr MP9_early
Indicator % of pregnant women tested for HIV up to week 20, conditional on seeking care through contracted services
Tracer High-risk pregnancy
Numerator or Calculation
Among pregnant women in the denominator: Number of pregnant women receiving HIV screen before completion of 20 weeks of gestation
Denominator or set of people for whom to calculate
Pregnant women aged 15–49 who had a live birth occurring in year t and received at least one NHS service within 42 weeks before delivery.
Source of data 1 CDPC Newborn registry
Source of data 2 NHS outpatient and manipulation data
Diagnosis and manipulation codes
Tests for HIV (laboratory) manipulation codes: 41401, 41402, 41404, 41405
Outstanding issues
Notes Compute for 2010-2014. Early pregnancy: up to 20 weeks gestation by the time of the service was provided. Week of gestation by the time the service was provided is calculated based on date of baby birth, gestational weeks at birth and date of service provided (start date of AD), that is: Week of gestation by the time the service = [Gestational weeks at birth] - [(Date of baby birth – date of service provided)/7 days].
References
Status DONE
Indicator Nr MP10
Indicator % of pregnant women screened for fetal Down syndrome, conditional on seeking care through contracted services during pregnancy
Tracer High-risk pregnancy
Numerator or Calculation
Among pregnant women in the denominator: Number of pregnant women receiving Down’s Syndrome screen during pregnancy
Denominator or set of people for whom to calculate
Pregnant women aged 15–49 who had a live birth occurring in year t and received at least one NHS service within 42 weeks before delivery.
Source of data 1 CDPC Newborn registry
Source of data 2 NHS outpatient and manipulation data
Diagnosis and manipulation codes
49010; 49015; 49016; 41164; 41156; 49008; 49009.
Outstanding issues
Notes Compute for 2010-2014.
References
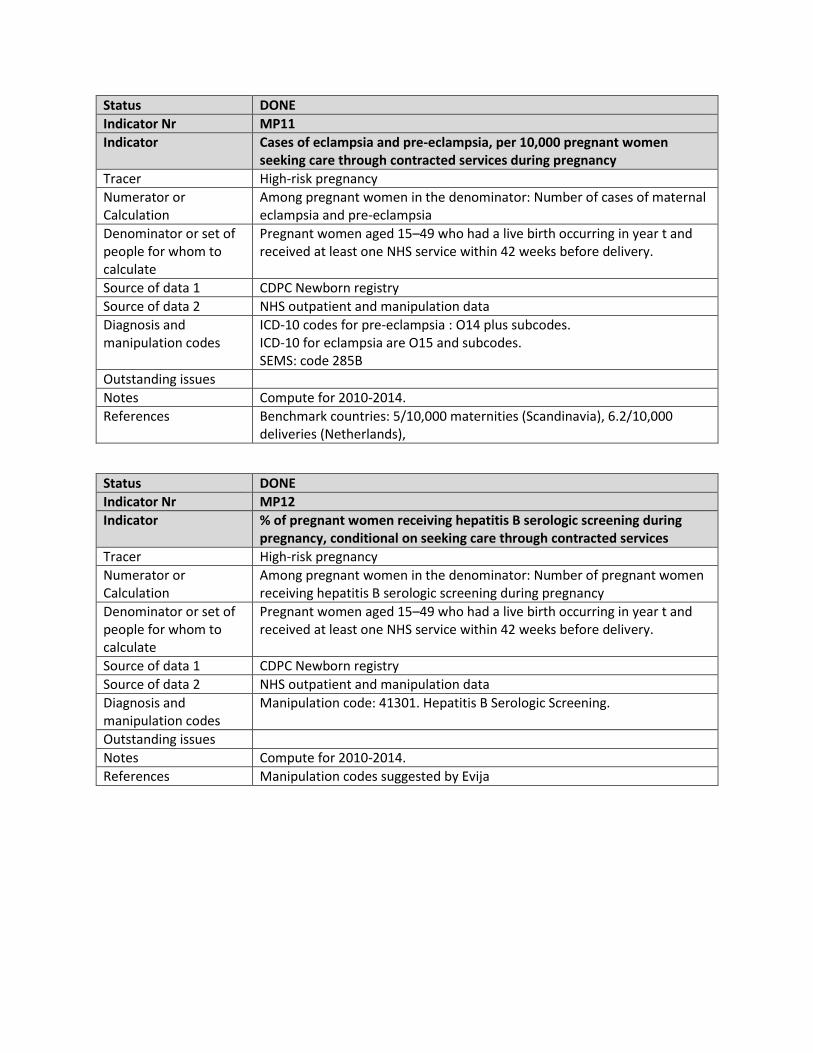
Status DONE
Indicator Nr MP11
Indicator Cases of eclampsia and pre-eclampsia, per 10,000 pregnant women seeking care through contracted services during pregnancy
Tracer High-risk pregnancy
Numerator or Calculation
Among pregnant women in the denominator: Number of cases of maternal eclampsia and pre-eclampsia
Denominator or set of people for whom to calculate
Pregnant women aged 15–49 who had a live birth occurring in year t and received at least one NHS service within 42 weeks before delivery.
Source of data 1 CDPC Newborn registry
Source of data 2 NHS outpatient and manipulation data
Diagnosis and manipulation codes
ICD-10 codes for pre-eclampsia : O14 plus subcodes. ICD-10 for eclampsia are O15 and subcodes. SEMS: code 285B
Outstanding issues
Notes Compute for 2010-2014.
References Benchmark countries: 5/10,000 maternities (Scandinavia), 6.2/10,000 deliveries (Netherlands),
Status DONE
Indicator Nr MP12
Indicator % of pregnant women receiving hepatitis B serologic screening during pregnancy, conditional on seeking care through contracted services
Tracer High-risk pregnancy
Numerator or Calculation
Among pregnant women in the denominator: Number of pregnant women receiving hepatitis B serologic screening during pregnancy
Denominator or set of people for whom to calculate
Pregnant women aged 15–49 who had a live birth occurring in year t and received at least one NHS service within 42 weeks before delivery.
Source of data 1 CDPC Newborn registry
Source of data 2 NHS outpatient and manipulation data
Diagnosis and manipulation codes
Manipulation code: 41301. Hepatitis B Serologic Screening.
Outstanding issues
Notes Compute for 2010-2014.
References Manipulation codes suggested by Evija
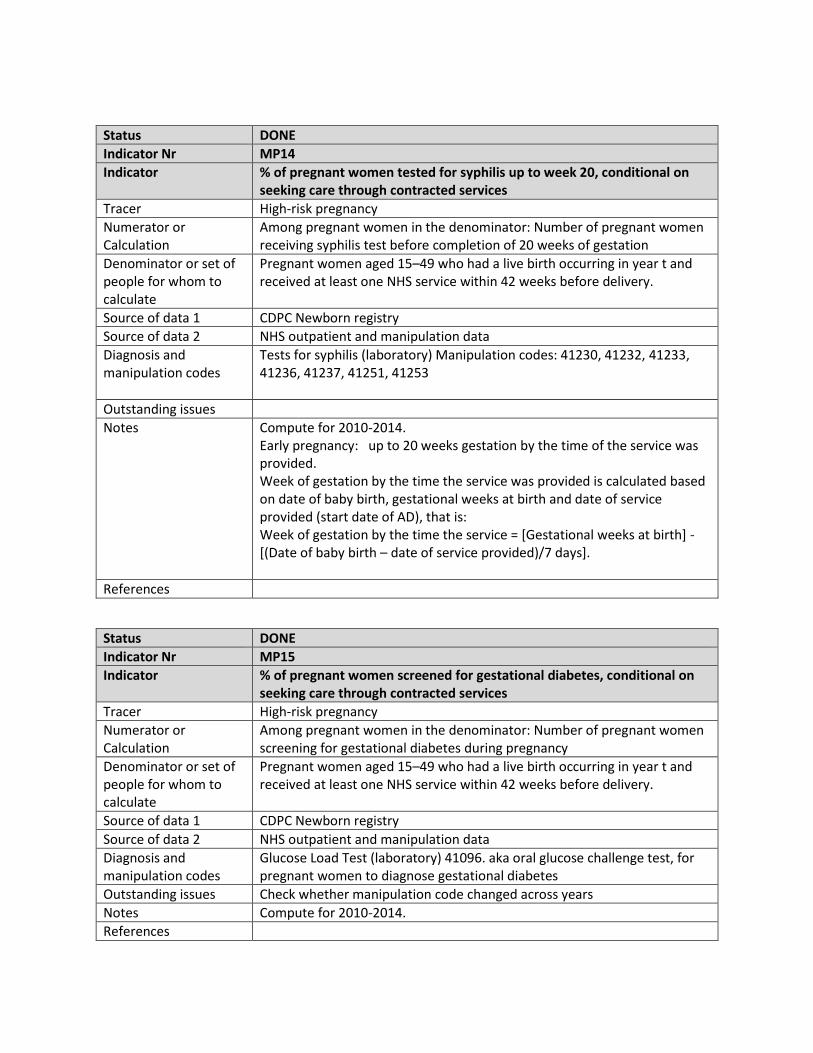
Status DONE
Indicator Nr MP14
Indicator % of pregnant women tested for syphilis up to week 20, conditional on seeking care through contracted services
Tracer High-risk pregnancy
Numerator or Calculation
Among pregnant women in the denominator: Number of pregnant women receiving syphilis test before completion of 20 weeks of gestation
Denominator or set of people for whom to calculate
Pregnant women aged 15–49 who had a live birth occurring in year t and received at least one NHS service within 42 weeks before delivery.
Source of data 1 CDPC Newborn registry
Source of data 2 NHS outpatient and manipulation data
Diagnosis and manipulation codes
Tests for syphilis (laboratory) Manipulation codes: 41230, 41232, 41233, 41236, 41237, 41251, 41253
Outstanding issues
Notes Compute for 2010-2014. Early pregnancy: up to 20 weeks gestation by the time of the service was provided. Week of gestation by the time the service was provided is calculated based on date of baby birth, gestational weeks at birth and date of service provided (start date of AD), that is: Week of gestation by the time the service = [Gestational weeks at birth] - [(Date of baby birth – date of service provided)/7 days].
References
Status DONE
Indicator Nr MP15
Indicator % of pregnant women screened for gestational diabetes, conditional on seeking care through contracted services
Tracer High-risk pregnancy
Numerator or Calculation
Among pregnant women in the denominator: Number of pregnant women screening for gestational diabetes during pregnancy
Denominator or set of people for whom to calculate
Pregnant women aged 15–49 who had a live birth occurring in year t and received at least one NHS service within 42 weeks before delivery.
Source of data 1 CDPC Newborn registry
Source of data 2 NHS outpatient and manipulation data
Diagnosis and manipulation codes
Glucose Load Test (laboratory) 41096. aka oral glucose challenge test, for pregnant women to diagnose gestational diabetes
Outstanding issues Check whether manipulation code changed across years
Notes Compute for 2010-2014.
References
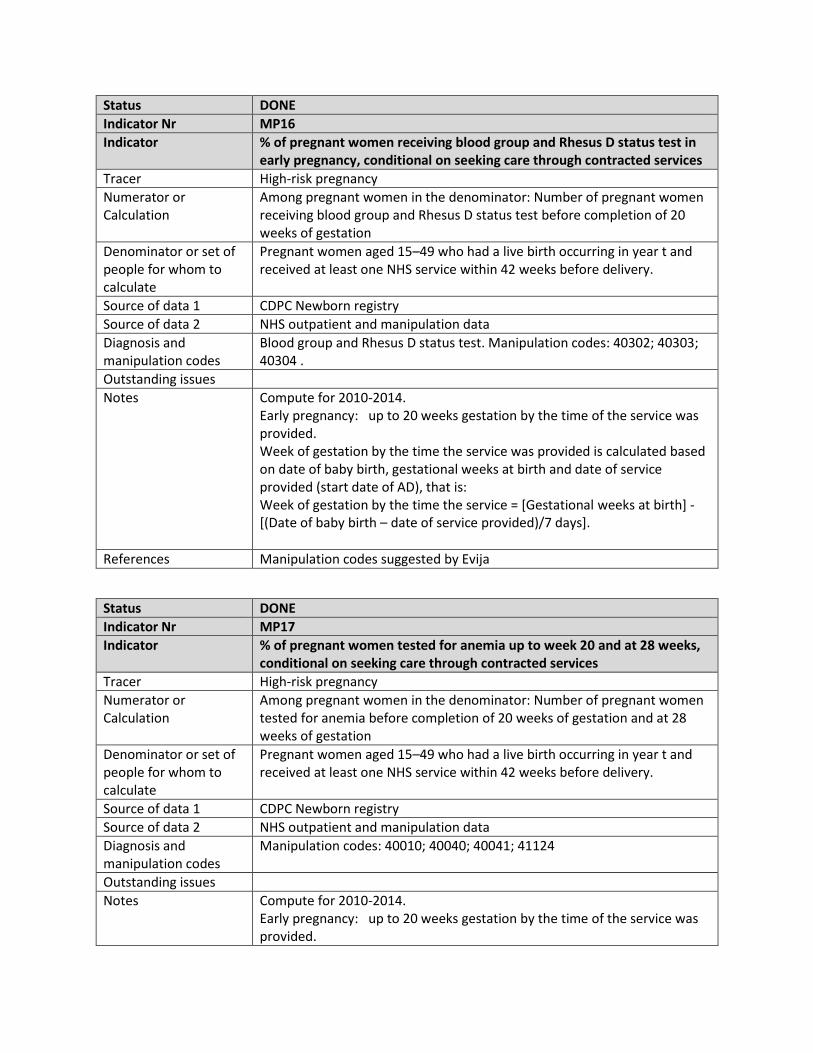
Status DONE
Indicator Nr MP16
Indicator % of pregnant women receiving blood group and Rhesus D status test in early pregnancy, conditional on seeking care through contracted services
Tracer High-risk pregnancy
Numerator or Calculation
Among pregnant women in the denominator: Number of pregnant women receiving blood group and Rhesus D status test before completion of 20 weeks of gestation
Denominator or set of people for whom to calculate
Pregnant women aged 15–49 who had a live birth occurring in year t and received at least one NHS service within 42 weeks before delivery.
Source of data 1 CDPC Newborn registry
Source of data 2 NHS outpatient and manipulation data
Diagnosis and manipulation codes
Blood group and Rhesus D status test. Manipulation codes: 40302; 40303; 40304 .
Outstanding issues
Notes Compute for 2010-2014. Early pregnancy: up to 20 weeks gestation by the time of the service was provided. Week of gestation by the time the service was provided is calculated based on date of baby birth, gestational weeks at birth and date of service provided (start date of AD), that is: Week of gestation by the time the service = [Gestational weeks at birth] - [(Date of baby birth – date of service provided)/7 days].
References Manipulation codes suggested by Evija
Status DONE
Indicator Nr MP17
Indicator % of pregnant women tested for anemia up to week 20 and at 28 weeks, conditional on seeking care through contracted services
Tracer High-risk pregnancy
Numerator or Calculation
Among pregnant women in the denominator: Number of pregnant women tested for anemia before completion of 20 weeks of gestation and at 28 weeks of gestation
Denominator or set of people for whom to calculate
Pregnant women aged 15–49 who had a live birth occurring in year t and received at least one NHS service within 42 weeks before delivery.
Source of data 1 CDPC Newborn registry
Source of data 2 NHS outpatient and manipulation data
Diagnosis and manipulation codes
Manipulation codes: 40010; 40040; 40041; 41124
Outstanding issues
Notes Compute for 2010-2014. Early pregnancy: up to 20 weeks gestation by the time of the service was provided.
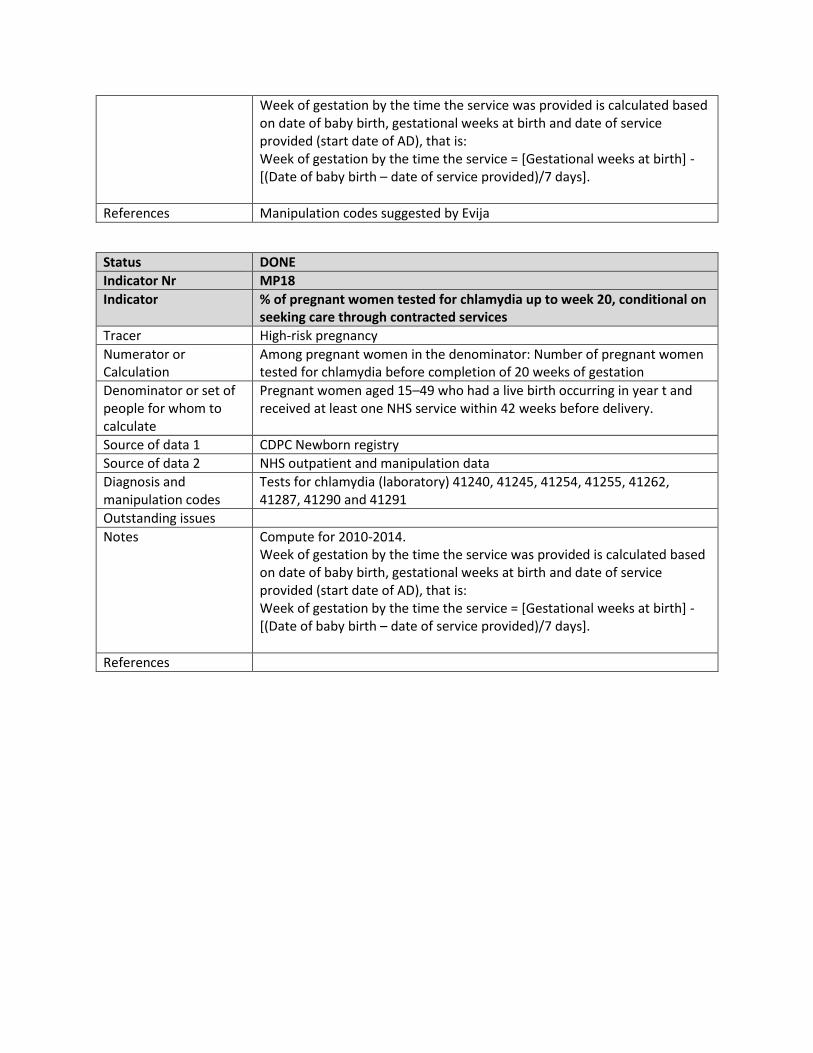
Week of gestation by the time the service was provided is calculated based on date of baby birth, gestational weeks at birth and date of service provided (start date of AD), that is: Week of gestation by the time the service = [Gestational weeks at birth] - [(Date of baby birth – date of service provided)/7 days].
References Manipulation codes suggested by Evija
Status DONE
Indicator Nr MP18
Indicator % of pregnant women tested for chlamydia up to week 20, conditional on seeking care through contracted services
Tracer High-risk pregnancy
Numerator or Calculation
Among pregnant women in the denominator: Number of pregnant women tested for chlamydia before completion of 20 weeks of gestation
Denominator or set of people for whom to calculate
Pregnant women aged 15–49 who had a live birth occurring in year t and received at least one NHS service within 42 weeks before delivery.
Source of data 1 CDPC Newborn registry
Source of data 2 NHS outpatient and manipulation data
Diagnosis and manipulation codes
Tests for chlamydia (laboratory) 41240, 41245, 41254, 41255, 41262, 41287, 41290 and 41291
Outstanding issues
Notes Compute for 2010-2014. Week of gestation by the time the service was provided is calculated based on date of baby birth, gestational weeks at birth and date of service provided (start date of AD), that is: Week of gestation by the time the service = [Gestational weeks at birth] - [(Date of baby birth – date of service provided)/7 days].
References
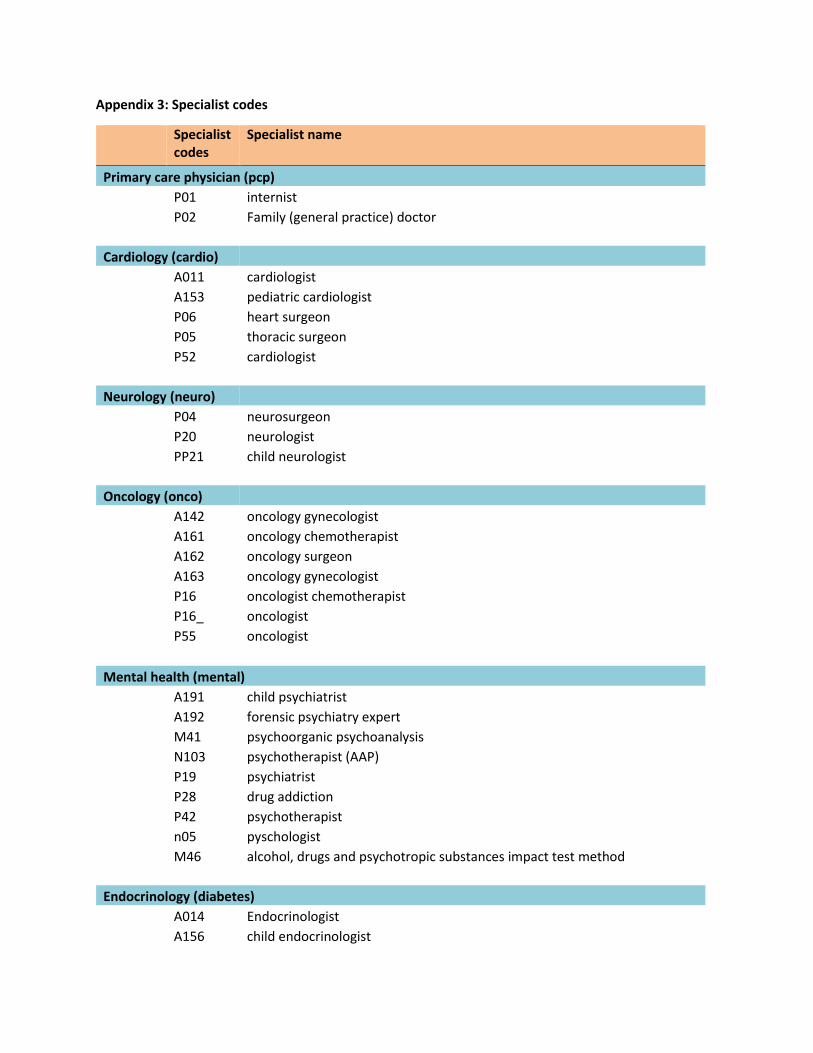
Appendix 3: Specialist codes
Specialist codes
Specialist name
Primary care physician (pcp)
P01 internist
P02 Family (general practice) doctor
Cardiology (cardio)
A011 cardiologist
A153 pediatric cardiologist
P06 heart surgeon
P05 thoracic surgeon
P52 cardiologist
Neurology (neuro)
P04 neurosurgeon
P20 neurologist
PP21 child neurologist
Oncology (onco)
A142 oncology gynecologist
A161 oncology chemotherapist
A162 oncology surgeon
A163 oncology gynecologist
P16 oncologist chemotherapist
P16_ oncologist
P55 oncologist
Mental health (mental)
A191 child psychiatrist
A192 forensic psychiatry expert
M41 psychoorganic psychoanalysis
N103 psychotherapist (AAP)
P19 psychiatrist
P28 drug addiction
P42 psychotherapist
n05 pyschologist
M46 alcohol, drugs and psychotropic substances impact test method
Endocrinology (diabetes)
A014 Endocrinologist
A156 child endocrinologist
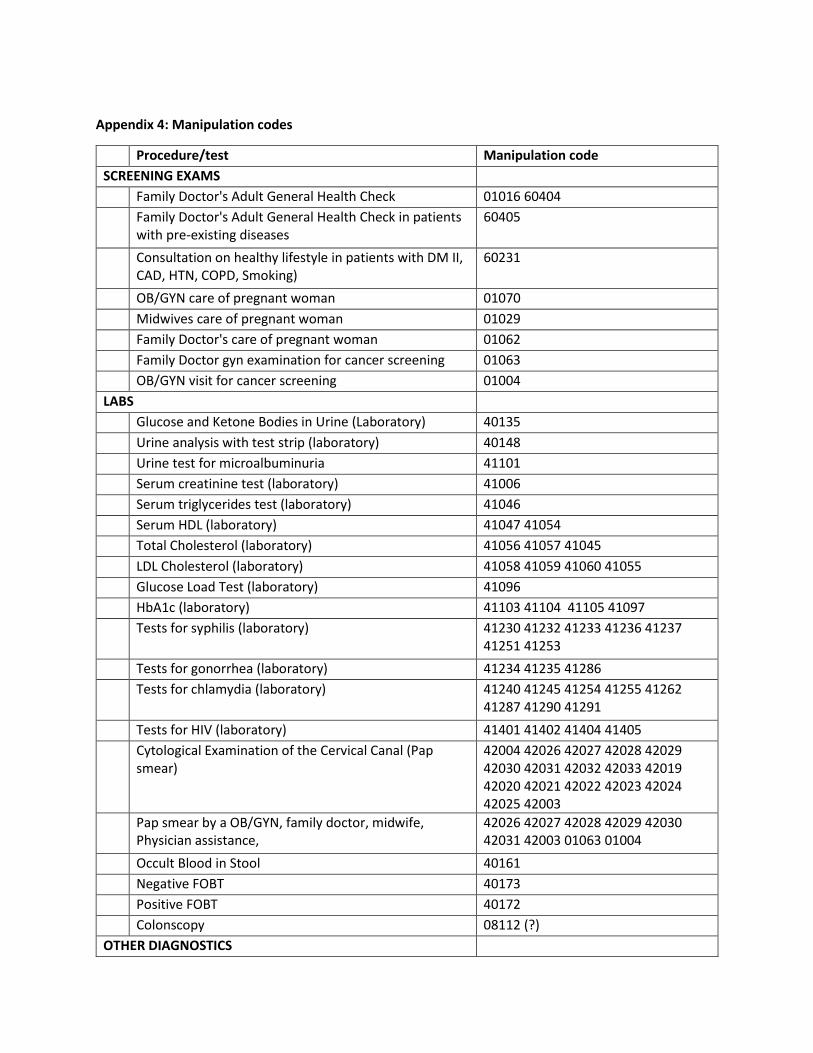
Appendix 4: Manipulation codes
Procedure/test Manipulation code
SCREENING EXAMS
Family Doctor's Adult General Health Check 01016 60404
Family Doctor's Adult General Health Check in patients with pre-existing diseases
60405
Consultation on healthy lifestyle in patients with DM II, CAD, HTN, COPD, Smoking)
60231
OB/GYN care of pregnant woman 01070
Midwives care of pregnant woman 01029
Family Doctor's care of pregnant woman 01062
Family Doctor gyn examination for cancer screening 01063
OB/GYN visit for cancer screening 01004
LABS
Glucose and Ketone Bodies in Urine (Laboratory) 40135
Urine analysis with test strip (laboratory) 40148
Urine test for microalbuminuria 41101
Serum creatinine test (laboratory) 41006
Serum triglycerides test (laboratory) 41046
Serum HDL (laboratory) 41047 41054
Total Cholesterol (laboratory) 41056 41057 41045
LDL Cholesterol (laboratory) 41058 41059 41060 41055
Glucose Load Test (laboratory) 41096
HbA1c (laboratory) 41103 41104 41105 41097
Tests for syphilis (laboratory) 41230 41232 41233 41236 41237 41251 41253
Tests for gonorrhea (laboratory) 41234 41235 41286
Tests for chlamydia (laboratory) 41240 41245 41254 41255 41262 41287 41290 41291
Tests for HIV (laboratory) 41401 41402 41404 41405
Cytological Examination of the Cervical Canal (Pap smear)
42004 42026 42027 42028 42029 42030 42031 42032 42033 42019 42020 42021 42022 42023 42024 42025 42003
Pap smear by a OB/GYN, family doctor, midwife, Physician assistance,
42026 42027 42028 42029 42030 42031 42003 01063 01004
Occult Blood in Stool 40161
Negative FOBT 40173
Positive FOBT 40172
Colonscopy 08112 (?)
OTHER DIAGNOSTICS
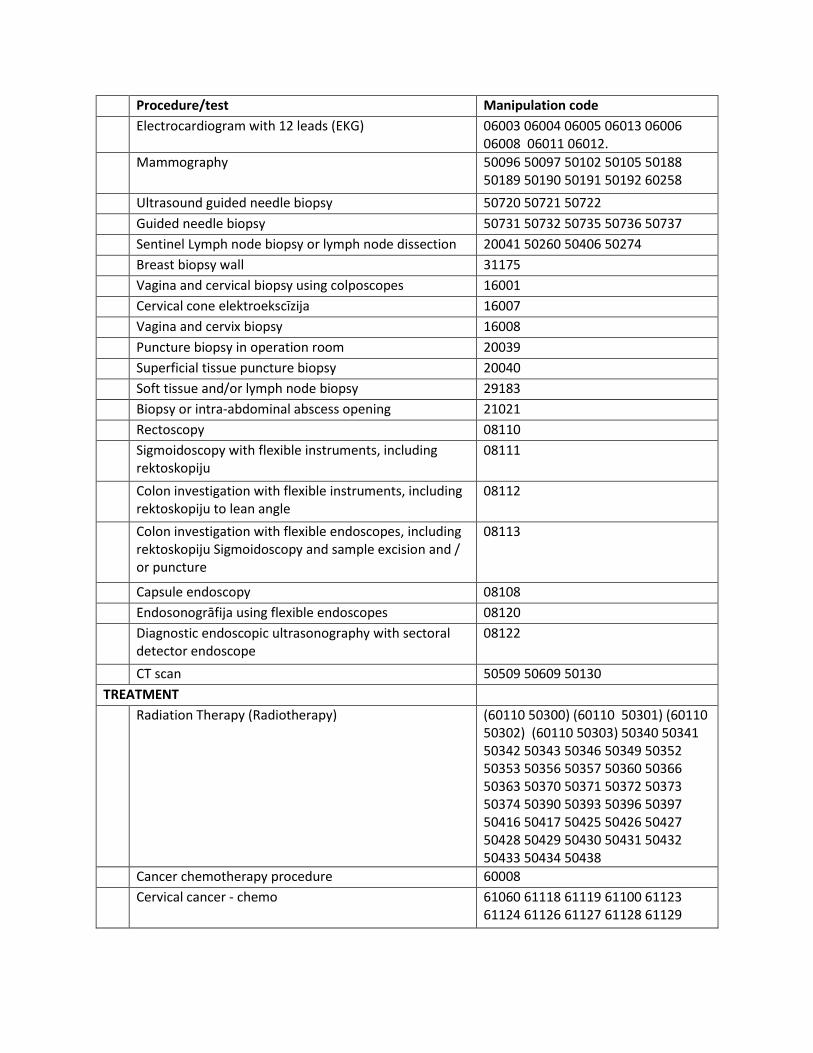
Procedure/test Manipulation code
Electrocardiogram with 12 leads (EKG) 06003 06004 06005 06013 06006 06008 06011 06012.
Mammography 50096 50097 50102 50105 50188 50189 50190 50191 50192 60258
Ultrasound guided needle biopsy 50720 50721 50722
Guided needle biopsy 50731 50732 50735 50736 50737
Sentinel Lymph node biopsy or lymph node dissection 20041 50260 50406 50274
Breast biopsy wall 31175
Vagina and cervical biopsy using colposcopes 16001
Cervical cone elektroekscīzija 16007
Vagina and cervix biopsy 16008
Puncture biopsy in operation room 20039
Superficial tissue puncture biopsy 20040
Soft tissue and/or lymph node biopsy 29183
Biopsy or intra-abdominal abscess opening 21021
Rectoscopy 08110
Sigmoidoscopy with flexible instruments, including rektoskopiju
08111
Colon investigation with flexible instruments, including rektoskopiju to lean angle
08112
Colon investigation with flexible endoscopes, including rektoskopiju Sigmoidoscopy and sample excision and / or puncture
08113
Capsule endoscopy 08108
Endosonogrāfija using flexible endoscopes 08120
Diagnostic endoscopic ultrasonography with sectoral detector endoscope
08122
CT scan 50509 50609 50130
TREATMENT
Radiation Therapy (Radiotherapy) (60110 50300) (60110 50301) (60110 50302) (60110 50303) 50340 50341 50342 50343 50346 50349 50352 50353 50356 50357 50360 50366 50363 50370 50371 50372 50373 50374 50390 50393 50396 50397 50416 50417 50425 50426 50427 50428 50429 50430 50431 50432 50433 50434 50438
Cancer chemotherapy procedure 60008
Cervical cancer - chemo 61060 61118 61119 61100 61123 61124 61126 61127 61128 61129
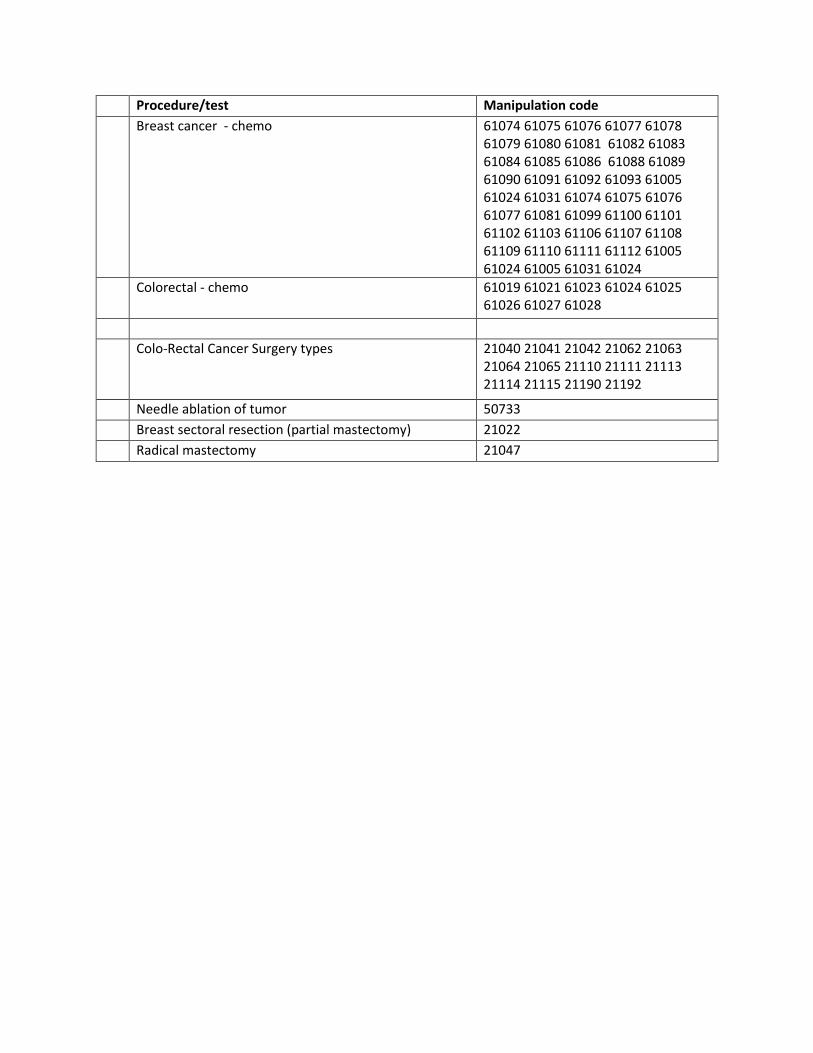
Procedure/test Manipulation code
Breast cancer - chemo 61074 61075 61076 61077 61078 61079 61080 61081 61082 61083 61084 61085 61086 61088 61089 61090 61091 61092 61093 61005 61024 61031 61074 61075 61076 61077 61081 61099 61100 61101 61102 61103 61106 61107 61108 61109 61110 61111 61112 61005 61024 61005 61031 61024
Colorectal - chemo 61019 61021 61023 61024 61025 61026 61027 61028
Colo-Rectal Cancer Surgery types 21040 21041 21042 21062 21063 21064 21065 21110 21111 21113 21114 21115 21190 21192
Needle ablation of tumor 50733
Breast sectoral resection (partial mastectomy) 21022
Radical mastectomy 21047
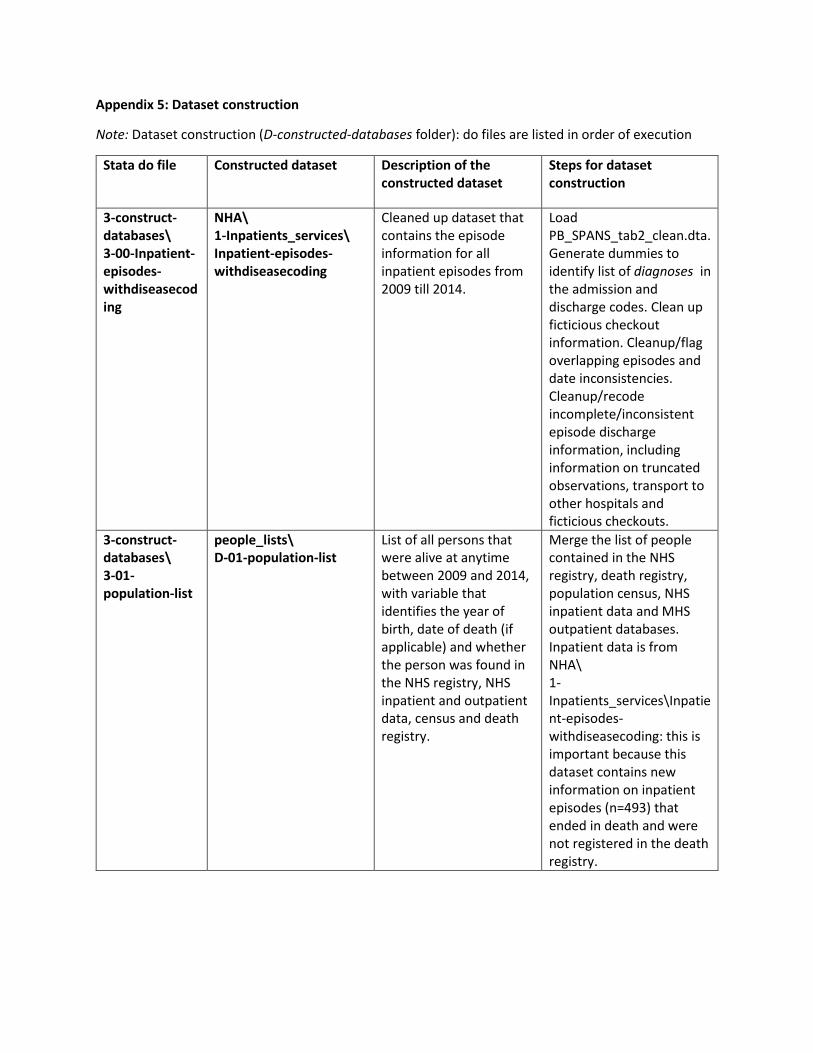
Appendix 5: Dataset construction
Note: Dataset construction (D-constructed-databases folder): do files are listed in order of execution
Stata do file Constructed dataset Description of the constructed dataset
Steps for dataset construction
3-construct-databases\ 3-00-Inpatient-episodes-withdiseasecoding
NHA\ 1-Inpatients_services\ Inpatient-episodes-withdiseasecoding
Cleaned up dataset that contains the episode information for all inpatient episodes from 2009 till 2014.
Load PB_SPANS_tab2_clean.dta. Generate dummies to identify list of diagnoses in the admission and discharge codes. Clean up ficticious checkout information. Cleanup/flag overlapping episodes and date inconsistencies. Cleanup/recode incomplete/inconsistent episode discharge information, including information on truncated observations, transport to other hospitals and ficticious checkouts.
3-construct-databases\ 3-01-population-list
people_lists\ D-01-population-list
List of all persons that were alive at anytime between 2009 and 2014, with variable that identifies the year of birth, date of death (if applicable) and whether the person was found in the NHS registry, NHS inpatient and outpatient data, census and death registry.
Merge the list of people contained in the NHS registry, death registry, population census, NHS inpatient data and MHS outpatient databases. Inpatient data is from NHA\ 1-Inpatients_services\Inpatient-episodes-withdiseasecoding: this is important because this dataset contains new information on inpatient episodes (n=493) that ended in death and were not registered in the death registry.
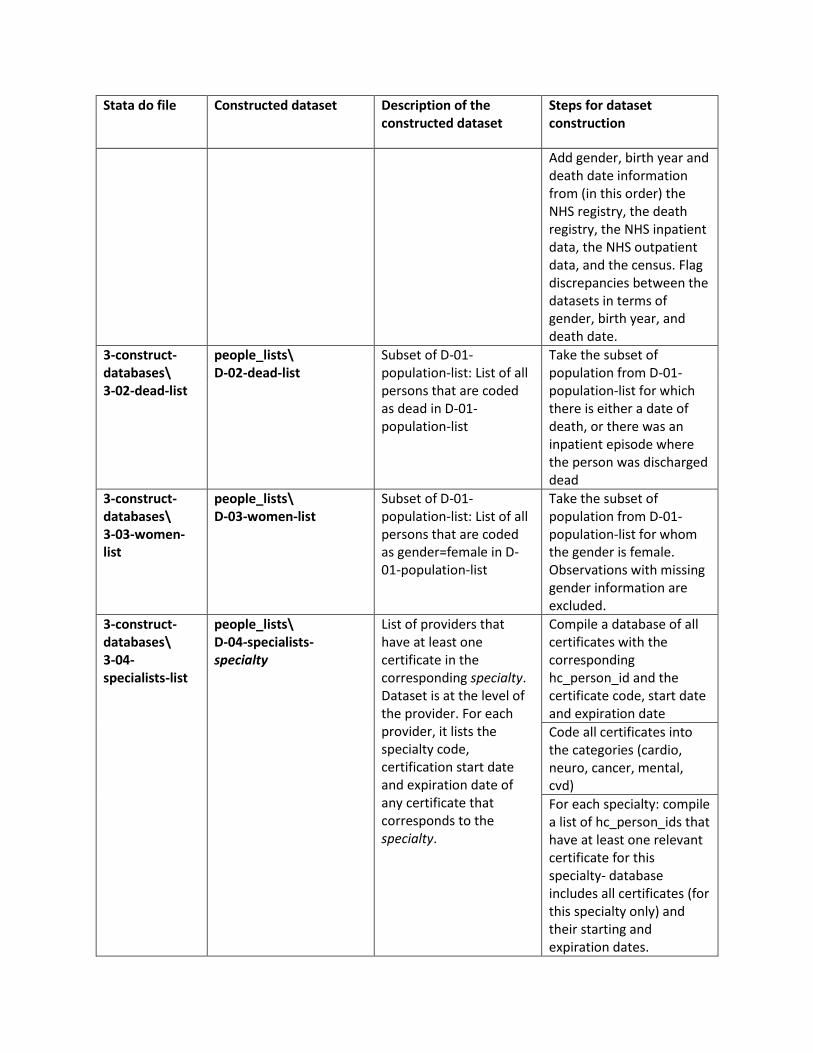
Stata do file Constructed dataset Description of the constructed dataset
Steps for dataset construction
Add gender, birth year and death date information from (in this order) the NHS registry, the death registry, the NHS inpatient data, the NHS outpatient data, and the census. Flag discrepancies between the datasets in terms of gender, birth year, and death date.
3-construct-databases\ 3-02-dead-list
people_lists\ D-02-dead-list
Subset of D-01-population-list: List of all persons that are coded as dead in D-01-population-list
Take the subset of population from D-01-population-list for which there is either a date of death, or there was an inpatient episode where the person was discharged dead
3-construct-databases\ 3-03-women-list
people_lists\ D-03-women-list
Subset of D-01-population-list: List of all persons that are coded as gender=female in D-01-population-list
Take the subset of population from D-01-population-list for whom the gender is female. Observations with missing gender information are excluded.
3-construct-databases\ 3-04-specialists-list
people_lists\ D-04-specialists-specialty
List of providers that have at least one certificate in the corresponding specialty. Dataset is at the level of the provider. For each provider, it lists the specialty code, certification start date and expiration date of any certificate that corresponds to the specialty.
Compile a database of all certificates with the corresponding hc_person_id and the certificate code, start date and expiration date
Code all certificates into the categories (cardio, neuro, cancer, mental, cvd)
For each specialty: compile a list of hc_person_ids that have at least one relevant certificate for this specialty- database includes all certificates (for this specialty only) and their starting and expiration dates.
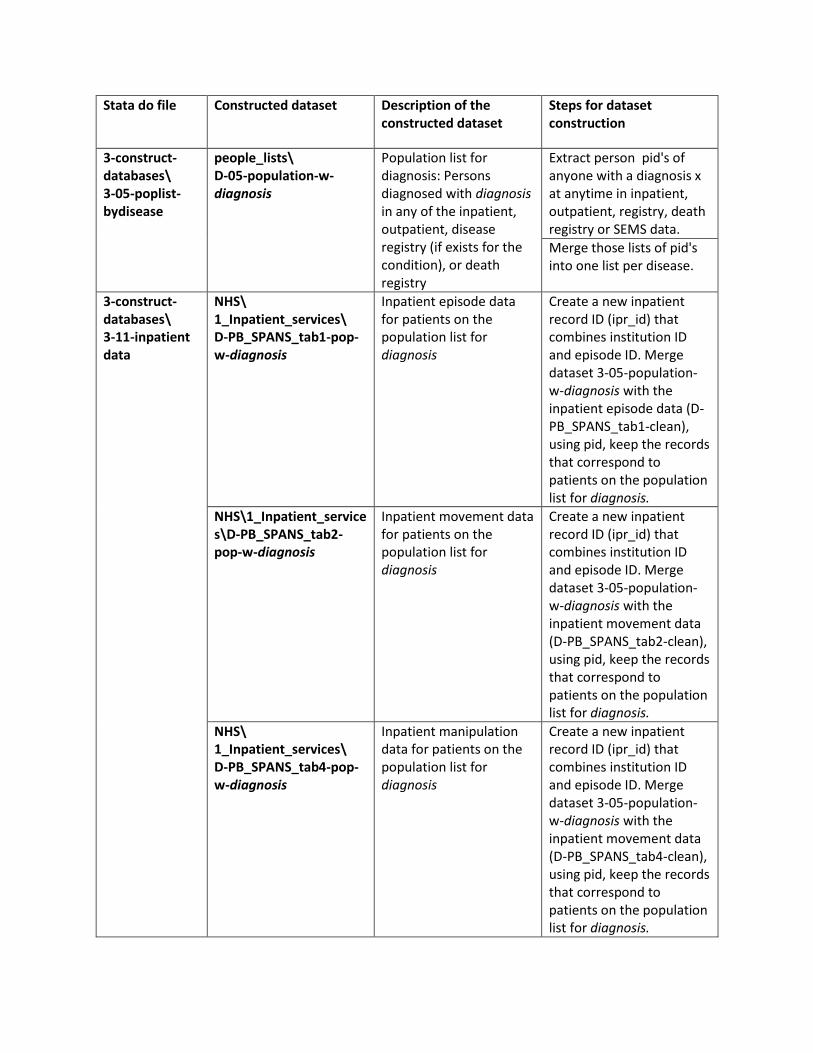
Stata do file Constructed dataset Description of the constructed dataset
Steps for dataset construction
3-construct-databases\ 3-05-poplist-bydisease
people_lists\ D-05-population-w-diagnosis
Population list for diagnosis: Persons diagnosed with diagnosis in any of the inpatient, outpatient, disease registry (if exists for the condition), or death registry
Extract person pid's of anyone with a diagnosis x at anytime in inpatient, outpatient, registry, death registry or SEMS data.
Merge those lists of pid's into one list per disease.
3-construct-databases\ 3-11-inpatient data
NHS\ 1_Inpatient_services\ D-PB_SPANS_tab1-pop-w-diagnosis
Inpatient episode data for patients on the population list for diagnosis
Create a new inpatient record ID (ipr_id) that combines institution ID and episode ID. Merge dataset 3-05-population-w-diagnosis with the inpatient episode data (D-PB_SPANS_tab1-clean), using pid, keep the records that correspond to patients on the population list for diagnosis.
NHS\1_Inpatient_services\D-PB_SPANS_tab2-pop-w-diagnosis
Inpatient movement data for patients on the population list for diagnosis
Create a new inpatient record ID (ipr_id) that combines institution ID and episode ID. Merge dataset 3-05-population-w-diagnosis with the inpatient movement data (D-PB_SPANS_tab2-clean), using pid, keep the records that correspond to patients on the population list for diagnosis.
NHS\ 1_Inpatient_services\ D-PB_SPANS_tab4-pop-w-diagnosis
Inpatient manipulation data for patients on the population list for diagnosis
Create a new inpatient record ID (ipr_id) that combines institution ID and episode ID. Merge dataset 3-05-population-w-diagnosis with the inpatient movement data (D-PB_SPANS_tab4-clean), using pid, keep the records that correspond to patients on the population list for diagnosis.
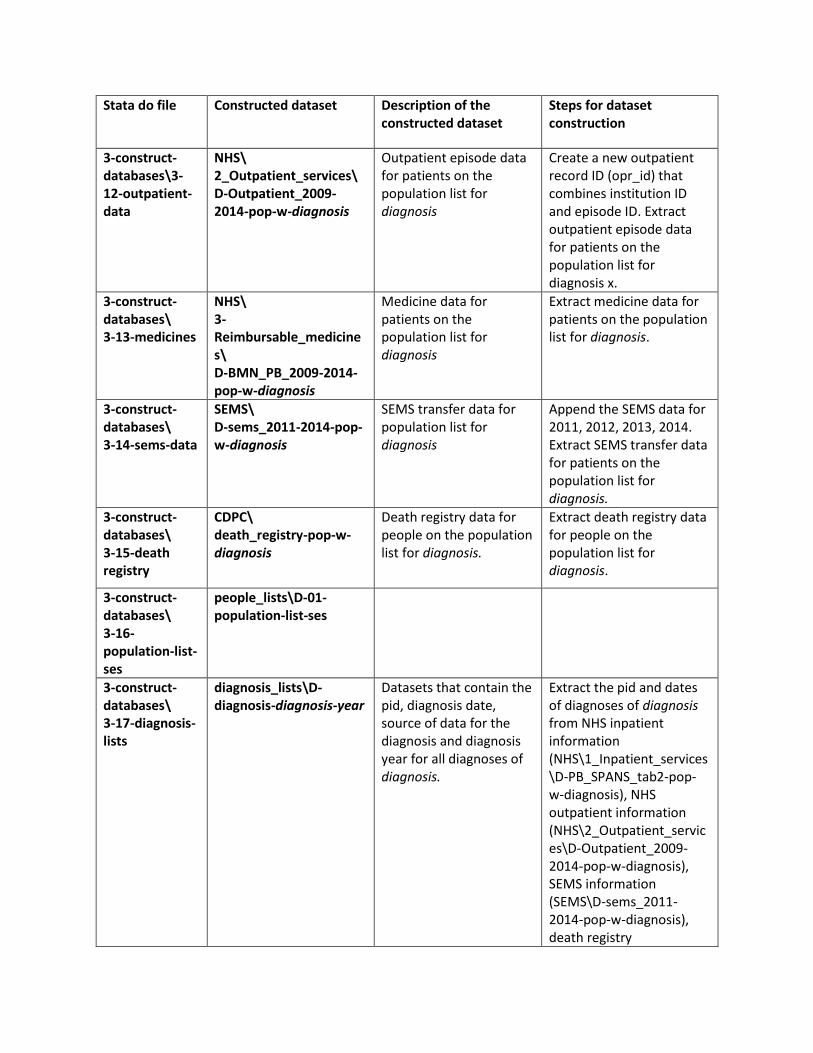
Stata do file Constructed dataset Description of the constructed dataset
Steps for dataset construction
3-construct-databases\3-12-outpatient-data
NHS\ 2_Outpatient_services\ D-Outpatient_2009-2014-pop-w-diagnosis
Outpatient episode data for patients on the population list for diagnosis
Create a new outpatient record ID (opr_id) that combines institution ID and episode ID. Extract outpatient episode data for patients on the population list for diagnosis x.
3-construct-databases\ 3-13-medicines
NHS\ 3-Reimbursable_medicines\ D-BMN_PB_2009-2014-pop-w-diagnosis
Medicine data for patients on the population list for diagnosis
Extract medicine data for patients on the population list for diagnosis.
3-construct-databases\ 3-14-sems-data
SEMS\ D-sems_2011-2014-pop-w-diagnosis
SEMS transfer data for population list for diagnosis
Append the SEMS data for 2011, 2012, 2013, 2014. Extract SEMS transfer data for patients on the population list for diagnosis.
3-construct-databases\ 3-15-death registry
CDPC\ death_registry-pop-w-diagnosis
Death registry data for people on the population list for diagnosis.
Extract death registry data for people on the population list for diagnosis.
3-construct-databases\ 3-16-population-list-ses
people_lists\D-01-population-list-ses
3-construct-databases\ 3-17-diagnosis-lists
diagnosis_lists\D-diagnosis-diagnosis-year
Datasets that contain the pid, diagnosis date, source of data for the diagnosis and diagnosis year for all diagnoses of diagnosis.
Extract the pid and dates of diagnoses of diagnosis from NHS inpatient information (NHS\1_Inpatient_services\D-PB_SPANS_tab2-pop-w-diagnosis), NHS outpatient information (NHS\2_Outpatient_services\D-Outpatient_2009-2014-pop-w-diagnosis), SEMS information (SEMS\D-sems_2011-2014-pop-w-diagnosis), death registry

Stata do file Constructed dataset Description of the constructed dataset
Steps for dataset construction
(CDPC\death_registry-pop-w-diagnosis). Create yearly files.
3-construct-databases\3-18-inpatient-episodes-dates-bydisease
NHS\ 1-Inpatients_services\ Inpatient-dates
Cleaned up dataset that contains the dates of all inpatient episodes for all patients that were inpatient at least once between 2009 and 2014.
Load NHA\1-Inpatients_services\Inpatient-episodes-withdiseasecoding. Reshape into a dataset at the level of the person. For each person, list the start, end dates of each inpatient episode as well as the admission codes and corrected discharge codes.
NHS\ 1-Inpatients_services\ Inpatient-dates-pop-w-diagnosis
Dataset is a subset of NHS\1-Inpatients_services\Inpatient-dates-pop-w-diagnosis and contains the dates of all inpatient episodes for those patients on the population list for diagnosis
Merge NHS\1-Inpatients_services\Inpatient-dates with people_lists\D-05-population-w-diagnosis. Keep the records for those pid that appear in both datasets.