Embed Size (px)
Citation preview

Noise Analysis for the Harmony Grove Industrial Project Escondido, California
Prepared for Exeter 2005 Harmony Grove Land LLC 101 West Elm Street, Suite 600 Conshohocken, PA 19428 Contact: Richard Poolis
Prepared by RECON Environmental, Inc. 1927 Fifth Avenue San Diego, CA 92101 P 619.308.9333
RECON Number 8811
September 19, 2017
Jessica Fleming, Associate Environmental Analyst

Noise Analysis
Harmony Grove Industrial Project i
TABLE OF CONTENTS
Acronyms.................................................................................................................... iii
Executive Summary ................................................................................................... 1
1.0 Introduction ..................................................................................................... 2 1.1 Project Description ............................................................................................. 2 1.2 Fundamentals of Noise ....................................................................................... 2
2.0 Applicable Noise Standards City of Escondido ....................................... 7 2.1 General Plan ....................................................................................................... 7 2.2 Municipal Code ................................................................................................... 7
3.0 Existing Conditions....................................................................................... 11
4.0 Analysis Methodology ................................................................................... 13 4.1 Construction Noise Analysis ............................................................................ 13 4.2 Operation Noise Analysis ................................................................................. 15
5.0 Future Acoustical Environment and Impacts......................................... 17 5.1 Construction Noise ........................................................................................... 17 5.2 Traffic Noise ..................................................................................................... 19 5.3 On-site Noise .................................................................................................... 21
6.0 Conclusions and Noise Abatement Measures ......................................... 25 6.1 Construction Noise ........................................................................................... 25 6.2 Traffic Noise ..................................................................................................... 25 6.3 On-site Generated Noise .................................................................................. 26
7.0 References Cited ............................................................................................ 26
FIGURES
1: Regional Location .......................................................................................................... 3 2: Project Location on Aerial Photograph ......................................................................... 4 3: Site Plan ........................................................................................................................ 5 4: Noise Measurement Locations .....................................................................................12 5: Construction Noise Contours and Modeled Receivers ................................................19 6: On-Site Noise Sources and Property Line Receivers ..................................................22 7: Daytime Operation Noise Level Contours ...................................................................23 8: Nighttime Operation Noise Level Contours ................................................................24

Noise Analysis
Harmony Grove Industrial Project ii
TABLE OF CONTENTS (cont.)
TABLES
1: Land Use Compatibility Standards .............................................................................. 8 2: Exterior Incremental Environmental Noise Impact Standards for
Noise-Sensitive Uses .................................................................................................. 9 3: City of Escondido Exterior Sound Limit Levels ........................................................... 9 4: Noise Measurements ....................................................................................................13 5: 15-minute Traffic Counts .............................................................................................13 6: Typical Construction Equipment Noise Levels ...........................................................14 7: Future Vehicle Traffic Parameters ..............................................................................16 8: Construction Noise Levels at Residential Uses ..........................................................18 9: Traffic Noise Impacts - CNEL at 50 Feet ....................................................................20 10: On-Site Generated Noise Levels ..................................................................................25
ATTACHMENTS
1: Noise Measurement Data 2: HVAC Example Specifications 3: SoundPLAN Data – Construction Noise 4: FHWA RD-77-108 Traffic Noise Calculations 5: SoundPLAN Data – On-Site Generated Noise

Noise Analysis
Harmony Grove Industrial Project iii
Acronyms ADT average daily traffic AHU Air Handling Unit CEQA California Environmental Quality Act City City of Escondido CNEL community noise equivalent level dB decibel dB(A) A-weighted Decibel FHWA Federal Highway Administration HVAC heating, ventilating, and air conditioning Leq one-hour equivalent noise level Lpw sound power level

Noise Analysis
Harmony Grove Industrial Project Page 1
Executive Summary The proposed Harmony Grove Industrial (project) site is located at 1925 and 2005 Harmony Grove Road in Escondido, California. The 11.04-acre site is currently undeveloped. The project would construct 215,275 square feet of industrial uses in one building. The light industrial use would consist of 204,775 square feet of warehouse space and 10,500 square feet of office space. The project would include surface parking and truck loading docks.
This report discusses potential noise impacts from the construction and operation of the project. As part of this assessment, noise levels due to vehicle traffic were calculated and evaluated against City of Escondido (City) noise and land use compatibility guidelines. In addition to compatibility, the potential for noise to impact adjacent uses from future on-site sources and construction activity was assessed. A summary of the findings is provided below.
Construction Noise There are residential uses located to the north, east, and south of the project site. Hourly equivalent construction noise levels at the nearest residential property uses would range from 56 to 71 A-weighted decibels [dB(A) Leq] at the nearest residential uses. Since construction activities associated with the project would comply with the applicable noise level limit for construction, 75 dB(A) Leq, temporary increases in noise levels from construction activities would be less than significant.
Traffic Noise The project would result in a less than 1 decibel (dB) increase in traffic noise over the existing condition along all affected roadway segments. Since 1 dB is not an audible increase in noise levels, the project would result in a less than significant impact related to traffic noise. Additionally, while the cumulative plus project traffic would increase noise along Harmony Grove Road west of Enterprise Street by more than 3 dB, the project’s contribution to this increase would be less than 1 dB. Therefore, the project’s contribution to the cumulative increase is less than cumulatively considerable.
On-site Generated Noise The noise sources on the project site after completion of construction are anticipated to be those that would be typical of any industrial use, such as mechanical ventilation equipment, vehicles arriving and leaving, including truck loading and unloading, and landscape maintenance. The primary noise sources on-site would be heating, ventilation, and air conditioning (HVAC) equipment and the loading docks. As calculated in this analysis, daytime on-site generated noise levels would range from 26 to 45 dB(A) Leq at the residential property lines and 37 to 59 dB(A) Leq at the industrial property lines, and nighttime noise levels would range from 25 to 42 dB(A) Leq at the residential property lines and 37 to 59 dB(A) Leq at the industrial property lines. Noise levels would not exceed the applicable Noise Ordinance limits at the property lines.

Noise Analysis
Harmony Grove Industrial Project Page 2
1.0 Introduction 1.1 Project Description The Harmony Grove Industrial Project (project) site is located at 1925 and 2005 Harmony Grove Road in Escondido, California. Figure 1 shows the regional location of the project site. Figure 2 shows an aerial photograph of the project vicinity. As shown, the 11.04-acre site is currently undeveloped; however, the southern portion of the project site has been graded in preparation of development associated with the approved Victory Industrial Park project. Site grading is visible in Figure 2.
The project would construct 215,275 square feet of industrial uses in one building. The light industrial use would consist of 204,775 square feet of warehouse space and 10,500 square feet of office space. The project would include surface parking and truck loading docks. The project design includes installation of signage at loading docks requiring that engines be turned off when loading and unloading. Additionally, an 8-foot-high wall would be constructed between the project site and the adjacent residences to the north. Figure 3 shows the proposed site plan.
1.2 Fundamentals of Noise Sound levels are described in units called the decibel (dB). Decibels are measured on a logarithmic scale that quantifies sound intensity in a manner similar to the Richter scale used for earthquake magnitudes. Thus, a doubling of the energy of a noise source, such as doubling of traffic volume, would increase the noise level by 3 dB; a halving of the energy would result in a 3 dB decrease. However, human perception of noise has no simple correlation with acoustical energy. A change in noise levels is generally perceived as follows: 3 A-weighted dB [dB(A)] barely perceptible, 5 dB(A) readily perceptible, and 10 dB(A) perceived as a doubling or halving of noise (California Department of Transportation 2013).
In technical terms, sound levels are described as either a “sound power level” or a “sound pressure level,” which while commonly confused are two distinct characteristics of sound. Both share the same unit of measure, the dB. However, sound power, expressed as Lpw, is the energy converted into sound by the source. As sound energy travels through the air, it creates a sound wave that exerts pressure on receivers such as an ear drum or microphone, the sound pressure level. Sound measurement instruments only measure sound pressure, and limits used in standards are generally sound pressure levels.

FIGURE 1
Regional Location
kj
USMC AIRSTATION
MIRAMAR
USMC AIRSTATION
MIRAMAR
CAMP PENDLETONMARINE CO BASE
Daley Ranch
Los PenasquitosCanyon Presv
Mission TrailsRegional Park
Cleveland NF
LakeWohlford
Batiquitos Lagoon
Lake Hodges
San VicenteReservoir
Sa
nD
i eg u i t o
Ri
v
er
S a nL
ui s
Re
yR
iv
er
S a n t aY
sa
be
l
C r ee
k
Sa
n
D
i e g u i t o
Ri
v e r
Sa n
t
aM
ar
ga
ri
ta
R
i ve
r
Sa n D i e
go
R i v e r
E
sc
o
nd
id
o
Cr
e
ek
Pauma and
YuimaReservation
Pala
Reservation
San Pasqual
Reservation
Rincon
Reservation
La Jolla Reservation
Barona
Reservation
CampPendleton
South
Bonsall
CampPendleton
North
Fallbrook
Valley Center
Bostonia
Crest
FairbanksRanch
Granite Hills
Hidden Meadows
LakeSan Marcos
Lakeside
RamonaRancho
Santa Fe
Winter Gardens
UV78
UV56
UV125
UV76
UV67
UV163
UV52§̈¦805
§̈¦8
§̈¦5
§̈¦15
S A N D I E G O
C O U N T Y
Carlsbad
DelMar
El Cajon
Encinitas
Escondido
La Mesa
Oceanside
Poway
San Diego
San Marcos
Santee
SolanaBeach
Vista
0 5Miles [
M:\JOBS5\8811\common_gis\fig1.mxd 8/23/2017 sab
SAN DIEGO
RIVERSIDE
SAN BERNARDINO
ORANGE
MEXICO
Project Locationkj

FIGURE 2
Project Location on Aerial Photograph
E
NTE
RPR
ISEST
HARMONY GROVE RD
HO
WA
RD
AV
E
PA
CIF
ICO
AK
SP
L
PR
INC
ES
SK
YR
AP
L
E
NTE
RPR
ISEST
HARMONY GROVE RD
HO
WA
RD
AV
E
PA
CIF
ICO
AK
SP
L
PR
INC
ES
SK
YR
AP
L
Image Source: Nearmaps (flown June 2017)
0 200Feet [
Project Boundary
M:\JOBS5\8811\common_gis\fig2_air.mxd 8/31/2017 fmm

M:\JOBS5\8811\air\graphics\fig3.ai 09/15/17 fmm
Map Source: WARE MALCOMB
FIGURE 3Site Plan
0 100Feet
DETENTIONBASIN
DET.
DETENTIONBASIN
HARMONY GROVE ROAD
HARMONY GROVE ROAD
26'
30'
24'
28'
30'47'
24'
INDUSTRIAL BLDGFOOTPRINT 212,275 SF
CLR.HGT: 32' 282'
60'
50'
TYP
.22
'
54'-6" TYP.
28'
812'
573'
135'
40'
276'
28'
6.5K SFSALESOFFICE
4K SFWH OFF.
33'
75'
60'
28'
28'
28'
20'
60'
10'
T

Noise Analysis
Harmony Grove Industrial Project Page 6
The human ear is not equally sensitive to all frequencies within the sound spectrum. To accommodate this phenomenon, the A-scale, which approximates the frequency response of the average young ear when listening to most ordinary everyday sounds, was devised. When people make relative judgments of the loudness or annoyance of a sound, their judgments correlate well with the A-scale sound levels of those sounds. Therefore, the “A-weighted” noise scale is used for measurements and standards involving the human perception of noise. Noise levels using A-weighted measurements are designated with the notation dB(A).
1.2.1 Descriptors The impact of noise is not a function of loudness alone. The time of day when noise occurs and the duration of the noise are also important. In addition, most noise that lasts for more than a few seconds is variable in its intensity. Consequently, a variety of noise descriptors has been developed. The noise descriptors used for this study are the equivalent noise level (Leq) and the community noise equivalent level (CNEL).
The Leq is the equivalent steady-state noise level in a stated period of time that is calculated by averaging the acoustic energy over a time period; when no period is specified, a 1-hour period is assumed.
The CNEL is a 24-hour equivalent sound level. The CNEL calculation applies an additional 5 dB(A) penalty to noise occurring during evening hours, between 7:00 p.m. and 10:00 p.m., and a 10 dB(A) penalty is added to noise occurring during the night, between 10:00 p.m. and 7:00 a.m. These increases for certain times are intended to account for the added sensitivity of humans to noise during the evening and night.
1.2.2 Propagation Sound from a localized source (approximating a “point” source) radiates uniformly outward as it travels away from the source in a spherical pattern, known as geometric spreading. The sound level decreases or drops off at a rate of 6 dB(A) for each doubling of the distance.
Traffic noise is not a single, stationary point source of sound. The movement of vehicles makes the source of the sound appear to emanate from a line (line source) rather than a point when viewed over some time interval. The drop-off rate for a line source is 3 dB(A) for each doubling of distance.
The propagation of noise is also affected by the intervening ground, known as ground absorption. A hard site (such as parking lots or smooth bodies of water) receives no additional ground attenuation, and the changes in noise levels with distance (drop-off rate) are simply the geometric spreading of the source. A soft site (such as soft dirt, grass, or scattered bushes and trees) provides an additional ground attenuation value of 1.5 dB(A) per doubling of distance. Thus, a point source over a soft site would drop off at 7.5 dB(A) per doubling of distance.
Noise Analysis
Harmony Grove Industrial Project Page 7
2.0 Applicable Noise Standards City of Escondido
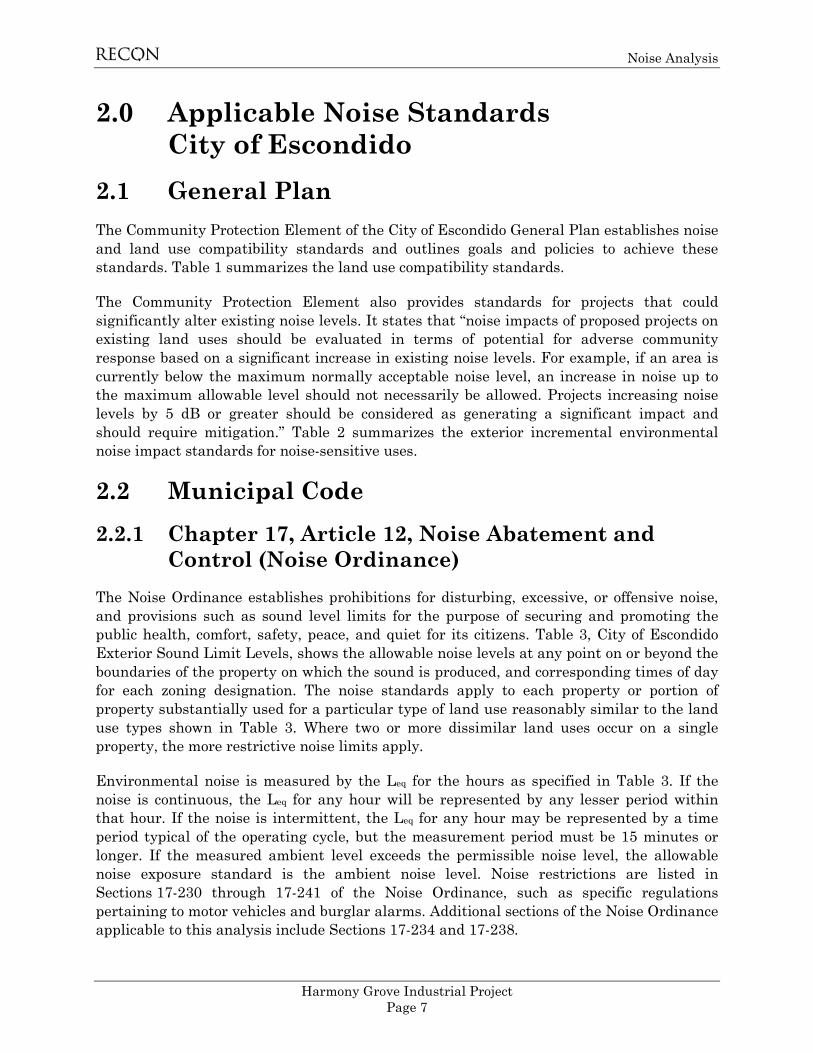
2.1 General Plan The Community Protection Element of the City of Escondido General Plan establishes noise and land use compatibility standards and outlines goals and policies to achieve these standards. Table 1 summarizes the land use compatibility standards.
The Community Protection Element also provides standards for projects that could significantly alter existing noise levels. It states that “noise impacts of proposed projects on existing land uses should be evaluated in terms of potential for adverse community response based on a significant increase in existing noise levels. For example, if an area is currently below the maximum normally acceptable noise level, an increase in noise up to the maximum allowable level should not necessarily be allowed. Projects increasing noise levels by 5 dB or greater should be considered as generating a significant impact and should require mitigation.” Table 2 summarizes the exterior incremental environmental noise impact standards for noise-sensitive uses.
2.2 Municipal Code 2.2.1 Chapter 17, Article 12, Noise Abatement and
Control (Noise Ordinance) The Noise Ordinance establishes prohibitions for disturbing, excessive, or offensive noise, and provisions such as sound level limits for the purpose of securing and promoting the public health, comfort, safety, peace, and quiet for its citizens. Table 3, City of Escondido Exterior Sound Limit Levels, shows the allowable noise levels at any point on or beyond the boundaries of the property on which the sound is produced, and corresponding times of day for each zoning designation. The noise standards apply to each property or portion of property substantially used for a particular type of land use reasonably similar to the land use types shown in Table 3. Where two or more dissimilar land uses occur on a single property, the more restrictive noise limits apply.
Environmental noise is measured by the Leq for the hours as specified in Table 3. If the noise is continuous, the Leq for any hour will be represented by any lesser period within that hour. If the noise is intermittent, the Leq for any hour may be represented by a time period typical of the operating cycle, but the measurement period must be 15 minutes or longer. If the measured ambient level exceeds the permissible noise level, the allowable noise exposure standard is the ambient noise level. Noise restrictions are listed in Sections 17-230 through 17-241 of the Noise Ordinance, such as specific regulations pertaining to motor vehicles and burglar alarms. Additional sections of the Noise Ordinance applicable to this analysis include Sections 17-234 and 17-238.

Noise Analysis
Harmony Grove Industrial Project Page 8
Table 1 Land Use Compatibility Standards
Land Use Category CNEL
55 60 65 70 75 80 85
Residential – Single Family, Duplex, Mobile Home
Residential – Multi-Family, Residential Mixed Use
Transient Lodging, Motels, Hotels
Schools, Libraries, Churches, Hospitals, Nursing Home
Auditoriums, Concert Halls, Amphitheaters
Sports Arena, Outdoor Spectator Sports
Playgrounds, Parks
Golf Courses, Riding Stables, Water Recreation, Cemeteries
Office Buildings, Business Commercial, Professional
Industrial, Manufacturing, Utilities, Agriculture
Normally Acceptable Specified land use is satisfactory, based upon the assumption that buildings involved are of normal conventional construction, without any special noise insulation requirements.
Conditionally Acceptable
New construction or development should be undertaken only after a detailed analysis of the noise reduction requirements is made and needed noise insulation features included in the design. Conventional construction, but with closed windows and fresh air supply systems or air conditioning will usually suffice.
Normally
Unacceptable
New construction or development should generally be discouraged. If new construction or development does proceed, a detailed analysis of the noise reduction requirements must be made with noise insulation features included in the design.
Clearly Unacceptable New construction or development should generally not be undertaken.
SOURCE: City of Escondido 2012.

Noise Analysis
Harmony Grove Industrial Project Page 9
Table 2 Exterior Incremental Environmental Noise Impact Standards for Noise-Sensitive Uses
Residences and Buildings where People Normally Sleepa
Institutional Land Uses with Primarily Daytime and Evening Usesb
Existing Ldn Allowable Noise
Increment Existing
Peak Hour Leq Allowable Noise Increment 45 8 45 12 50 5 50 9 55 3 55 6 60 2 60 5 65 1 65 3 70 1 70 3 75 0 75 1 80 0 80 0
SOURCE: Federal Transit Administration 2006; City of Escondido 2012 NOTE: Noise levels are measured at the property line of the noise-sensitive use. aThis category includes homes, hospitals, and hotels where a nighttime sensitivity to noise is assumed to be of utmost importance.
bThis category includes schools, libraries, theaters, and churches where it is important to avoid interference with such activities as speech, meditation, and concentration on reading material.
Table 3 City of Escondido Exterior Sound Limit Levels
Zone Time
Applicable Limit 1-hour Average Sound
Level (Decibels)
Residential zones 7:00 a.m. to 10:00 p.m. 50 10:00 p.m. to 7:00 a.m. 45
Multi-residential zones 7:00 a.m. to 10:00 p.m. 55 10:00 p.m. to 7:00 a.m. 50
Commercial zones 7:00 a.m. to 10:00 p.m. 60 10:00 p.m. to 7:00 a.m. 55
Light Industrial/Industrial Park zones Anytime 70 General Industrial zones Anytime 75 SOURCE: City of Escondido Municipal Code.
2.2.2 Chapter 17, Article 12, Construction Equipment and Grading
Sections 17-234 and 17-238 provide regulations for construction equipment and grading activities.
Section 17-234
Except for emergency work, the following applies to all construction equipment operating in the City:
a) It shall be unlawful for any person, including the City of Escondido, to operate construction equipment at any construction site, except on Monday through Friday

Noise Analysis
Harmony Grove Industrial Project Page 10
during a week between the hours of 7:00 a.m. and 6:00 p.m. and on Saturdays between the hours of 9:00 a.m. and 5:00 p.m., and provided that the operation of such construction equipment complies with the requirements of subsection (c) of this section.
b) It shall be unlawful for any person, including the City of Escondido, to operate construction equipment at any construction site on Sundays and on days designated by the President, Governor, or City Council as public holidays.
c) No construction equipment or combination of equipment, regardless of age or date of acquisition, shall be operated so as to cause noise in excess of a one-hour average sound level limit of 75 dB at any time, unless a variance has been obtained in advance from the City Manager.
Section 17-238
a) It shall be unlawful for any person, including the City of Escondido, to do any authorized grading at any construction site, except on Mondays through Fridays during a week between the hours of 7:00 a.m. and 6:00 p.m. and, provided a variance has been obtained in advance from the City Manager, on Saturdays from 10:00 a.m. to 5:00 p.m.
b) For the purpose of this section, “grading” shall include, but not be limited to, compacting, drilling, rock crushing or splitting, bulldozing, clearing, dredging, digging, filling and blasting.
c) In addition, any equipment used for grading shall not be operated so as to cause noise in excess of a one-hour sound level limit of 75 dB at any time when measured at or within the property lines of any property which is developed and used in whole or in part for residential purposes, unless a variance has been obtained in advance from the City Manager.
2.2.3 Chapter 33, Article 47, Environmental Quality Regulations
The Environmental Quality Regulations implement the California Environmental Quality Act (CEQA) and the CEQA Guidelines by applying the provisions and procedures contained in CEQA to development projects proposed within the City of Escondido. Section (a)(2) pertains to noise impacts, specifically noise impacts related to the widening of Mobility and Infrastructure Element streets. According to this section, the following incremental noise increases are generally not considered significant:
a) Short- or long-term increases, regardless of the extent, that do not result in noise increases in excess of general plan standards,
b) Short- or long-term increases that result in a 3 dB(A) or less incremental increase in noise beyond the general plan’s noise standards.

Noise Analysis
Harmony Grove Industrial Project Page 11
3.0 Existing Conditions Existing noise levels in the vicinity of the project site were measured on February 18, 2016, using a Larson-Davis Model LxT, Type 1 Integrating Sound Level Meter, serial number 3827. The following parameters were used:
Filter: A-weighted Response: Slow Interval Period 1 minute Time History Period: 5 seconds
The meter was calibrated before and after each measurement. The meter was set 5 feet above the ground level for each measurement.
Noise measurements were taken to obtain typical ambient noise levels at the project site and in the vicinity. The weather was cool and cloudy with a slight breeze, one to two miles per hour on average. Four 15-minute measurements were taken, as described below. The primary sources of on-site noise were due to traffic on Harmony Grove Road and industrial activity beyond Escondido Creek. Secondary sources of noise were activity in parking lots west and southwest of the project site, air traffic, and regular bird vocalization. The measurement locations are shown on Figure 4, and detailed data is contained in Attachment 1.
Measurement 1 was located south of the project site, approximately 20 feet west of the levee for Escondido Creek. The main noise source at this location was industrial activity beyond the creek. Secondary sources of noise were activity in parking lots southwest of the project site, air traffic, and regular bird vocalization.
Measurement 2 was located near the southern project boundary, in the center of the levee road along Escondido Creek. The main noise source at this location was industrial activity beyond the creek. Secondary sources of noise were Harmony Grove Road, approximately 600 feet north, air traffic, and regular bird vocalization.
Measurement 3 was located at the western project boundary, approximately 50 feet east of Harmony Grove Road, in line with the center of the east-west segment of the road. The main noise source at this location was vehicle traffic on Harmony Grove Road with regular bird vocalization as a significant secondary source. During the measurement period, traffic was moving freely on Harmony Grove Road.
Measurement 4 was located at the northern project boundary, 50 feet south of Harmony Grove Road, and approximately 500 feet east of Enterprise Street. The main noise source at this location was vehicle traffic on Harmony Grove Road with air traffic and regular bird vocalization as significant secondary sources. During the measurement period, traffic was moving freely on Harmony Grove Road.

FIGURE 4
Noise Measurement Locations
!(
!(
!(
!(
HARMONY GROVE RD
ENTE
RPRISE
ST
PR
INC
ES
S K
YR
A P
L
PA
CIF
ICO
AK
SP
L
1
2
3
4
!(
!(
!(
!(
HARMONY GROVE RD
ENTE
RPRISE
ST
PR
INC
ES
S K
YR
A P
L
PA
CIF
ICO
AK
SP
L
1
2
3
4
Image Source: Nearmaps (flown June 2017)
0 200Feet [Project Boundary
!( Measurement Locations
M:\JOBS5\8811\common_gis\fig4_nos.mxd 8/28/2017 sab

Noise Analysis
Harmony Grove Industrial Project Page 13
Noise measurements are summarized in Table 4. Traffic counts conducted during Measurements 3 and 4 are summarized in Table 5.
Table 4 Noise Measurements
Measurement Location Time Noise Sources Leq L90
1 South of project site, 20 feet west of Escondido Creek levee
10:52 a.m. – 11:07 a.m.
Industrial activity, parking lots, air traffic, and bird vocalizations 43.1 37.4
2 Near southern project boundary, center of levee road
11:20 a.m. – 11:35 a.m.
Industrial activity, Harmony Grove Road, air traffic, and bird vocalizations
47.1 45.4
3 Near western project boundary, 50 feet east of Harmony Grove Road
11:50 a.m. – 12:05 p.m.
Harmony Grove Road and bird vocalizations 57.1 48.2
4 Near northern project boundary, 50 feet south of Harmony Grove Road
12:28 p.m. – 12:43 p.m.
Harmony Grove Road, air traffic, and bird vocalizations 61.4 51.2
NOTE: Noise measurement data is contained in Attachment 1. Leq = one-hour equivalent noise level; L90 = noise level exceeded 90 percent of the time
Table 5 15-minute Traffic Counts
Measurement Roadway Direction
Vehicle Type
Autos Medium Trucks
Heavy Trucks Buses Motorcycles
3 Harmony Grove Road, south of Enterprise Street
Northeast-bound 47 3 0 0 0 Southwest-bound 31 0 0 0 1
4 Harmony Grove Road, east of Enterprise Street
Eastbound 66 4 0 0 0 Westbound 81 4 0 0 0
Note: Traffic counts were not conducted during Measurements 1 and 2.
4.0 Analysis Methodology 4.1 Construction Noise Analysis Noise level predictions and contour mapping were developed using noise modeling software, SoundPlan Essential, version 3.0 (Navcon Engineering 2015). SoundPLAN calculates noise propagation based on the International Organization for Standardization method (ISO 9613-2 – Acoustics, Attenuation of Sound during Propagation Outdoors). The model calculates noise levels at selected receiver locations using input parameter estimates such as total noise generated by each noise source; distances between sources, barriers, and receivers; and shielding provided by intervening terrain, barriers, and structures. The model outputs can be developed as noise level contour maps or noise levels at specific receivers. In all cases, receivers were modeled at 5 feet above ground elevation, which represents the average height of the human ear.
Project construction noise would be generated by diesel engine-driven construction equipment used for site preparation and grading, building construction, loading, unloading, and placing materials and paving. Diesel engine-driven trucks also would bring materials to the site and remove the soils from excavation.

Noise Analysis
Harmony Grove Industrial Project Page 14
A variety of noise-generating equipment would be used during the construction phase of the project, such as excavators, backhoes, front-end loaders, and concrete saws, along with others. Construction equipment with a diesel engine typically generates maximum noise levels from 80 to 90 dB(A) Leq at a distance of 50 feet (Federal Highway Administration [FHWA] 2006). Table 6 summarizes typical construction equipment noise levels.
Table 6 Typical Construction Equipment Noise Levels
Equipment Noise Level at 50 Feet
[dB(A) Leq] Typical Duty Cycle Auger Drill Rig 85 20% Backhoe 80 40% Blasting 94 1% Chain Saw 85 20% Clam Shovel 93 20% Compactor (ground) 80 20% Compressor (air) 80 40% Concrete Mixer Truck 85 40% Concrete Pump 82 20% Concrete Saw 90 20% Crane (mobile or stationary) 85 20% Dozer 85 40% Dump Truck 84 40% Excavator 85 40% Front End Loader 80 40% Generator (25 kilovolt amps or less) 70 50% Generator (more than 25 kilovolt amps) 82 50% Grader 85 40% Hydra Break Ram 90 10% Impact Pile Driver (diesel or drop) 95 20% Insitu Soil Sampling Rig 84 20% Jackhammer 85 20% Mounted Impact Hammer (hoe ram) 90 20% Paver 85 50% Pneumatic Tools 85 50% Pumps 77 50% Rock Drill 85 20% Roller 74 40% Scraper 85 40% Tractor 84 40% Vacuum Excavator (vac-truck) 85 40% Vibratory Concrete Mixer 80 20% Vibratory Pile Driver 95 20% SOURCE: Federal Highway Administration 2006. dB(A) Leq = A-weighted decibel one-hour equivalent noise level
During excavation, grading, and paving operations, equipment moves to different locations and goes through varying load cycles, and there are breaks for the operators and for non-equipment tasks, such as measurement. Although maximum noise levels may be 85 to 90 dB(A) at a distance of 50 feet, hourly average noise levels would be lower when taking into account the equipment usage factors. For the project, the loudest phase of construction would be the excavation phase and would include dozers, loaders, and excavators.

Noise Analysis
Harmony Grove Industrial Project Page 15
Construction noise levels were calculated based on all three pieces of equipment being active simultaneously. Hourly average noise levels associated with the grading phase of construction would be 85 dB(A) Leq at 50 feet, or a sound power level of approximately 117 dB(A) from the center of construction activity when assessing the loudest pieces of equipment working simultaneously.
Construction noise is considered a point source and would attenuate at approximately 6 dB(A) for every doubling of distance. To reflect the nature of grading and construction activities, equipment was modeled as an area source distributed over the project footprint.
4.2 Operation Noise Analysis 4.2.1 Traffic Noise Off-site traffic noise was modeled using the FHWA’s Traffic Noise Prediction Model algorithms and reference levels. Traffic noise levels were calculated at 50 feet from the centerline of the affected roadways to determine the noise level increase associated with the project. The model uses various input parameters, such as traffic volumes; vehicle mix, distribution, and speed.
The main source of traffic noise from the project site would be vehicle traffic on Harmony Grove Road, Hale Avenue, Enterprise Street, and Andreasen Drive. Traffic noise levels were calculated based on the total average daily traffic (ADT) volume on each roadway segment. For modeling purposes, “pavement” ground conditions were used for the analysis of future conditions, since off-site conditions differ and the hard site provides the most conservative impact assessment.
Existing and future (year 2035) traffic volumes on Harmony Grove Road, Hale Avenue, Enterprise Street, and Andreasen Drive were obtained from the project traffic report (Linscott, Law & Greenspan 2017). For existing and cumulative traffic not associated with the project, a vehicle classification mix of 95 percent automobiles, 3.5 percent medium trucks, and 1.5 percent heavy trucks was modeled. Based on the field traffic counts, this is a conservative vehicle mix. The proposed warehouse would include 8 percent heavy trucks. For project-only traffic, a vehicle classification mix of 88.5 percent automobiles, 3.5 percent medium trucks, and 8.0 percent heavy trucks was modeled. This project-generated traffic was added to the existing and cumulative traffic volumes to determine the project-related increase in vehicle traffic noise. Table 7 summarizes the future traffic volumes and speeds for the adjacent roadways. Modeled noise levels do not account for shielding provided by intervening barriers and structures.

Noise Analysis
Harmony Grove Industrial Project Page 16
Table 7 Future Vehicle Traffic Parameters
Roadway and Segment Existing Existing Plus
Project Cumulative Cumulative Plus Project
Speed (mph)
Harmony Grove Road West of Enterprise Street Enterprise Street to Hale Avenue
5,760 9,310
6,140 9,830
11,965 14,270
12,345 14,790
40 40
Hale Avenue Harmony Grove Road to 9th Avenue
7,950
8,232
11,010
11,292
35
Enterprise Street Andreasen Drive to Harmony Grove Road
6,100
6,447
8,780
9,127
35
ADT = average daily traffic SOURCE: Linscott, Law & Greenspan 2017.
4.2.2 Heating, Ventilation, and Air Conditioning Units The project would include roof-mounted heating, ventilation, and air conditioning (HVAC) units. Property line noise levels due to HVAC equipment were calculated. The equipment would be shielded from view by building parapets that extend 6 inches above the top of the mechanical equipment.
It is not known at this time which manufacturer, brand, or model of unit or units will be selected for use in the project. HVAC units would be located on the rooftop of the building. Typically, a capacity of 1-ton per 340 square feet would be required for large office buildings. Based on this ratio, the 10,500 square feet of office space would require three 10-ton HVAC units. Based on review of manufacturer specifications for a sample unit (Trane Mode T/YSCE120ED), a representative noise level for a 10-ton unit would be a sound power level of 79 dB. Noise specifications are contained in Attachment 2. For the daytime hours, all units were modeled at full capacity. For the nighttime hours, it was assumed that the units would operate a maximum of 50 percent of the time, i.e., an average of 30 minutes an hour.
The warehouse portion of the building would require an air handler unit (AHU) for ventilation. According to the American Society of Heating, Refrigeration, and Air-Conditioning Engineers standards, the proposed building would require a ventilation rate of 0.06 cubic feet per minute per square foot. The 204,775 square feet of warehouse space would, therefore, require air handlers with a capacity of approximately 12,300 cubic feet per minute. For modeling purposes, the air handler unit was conservatively modeled based on noise level data for a unit with a capacity of 93,900 cubic feet per minute. Noise specifications are contained in Attachment 2. The unit was modeled at full capacity during the daytime and nighttime hours.
4.2.3 Loading Dock The site plan identifies 20 dock high doors and two grade level doors at the northwest side of the building. The site plan also identifies four knock-out panels, which could be knocked out to operate as future loading docks if needed. Property line noise levels due to loading

Noise Analysis
Harmony Grove Industrial Project Page 17
dock activities (including the 4 potential future loading docks) were calculated using SoundPLAN. In order to evaluate the truck delivery noise impacts, the analysis utilized reference noise level measurements taken at an Albertson’s Shopping Center in San Diego, California in 2011. The measurements include truck drive-by noise, truck loading/unloading, and truck engine noise. The unmitigated exterior noise levels for truck drive-by noise and truck engine noise were measured at 66.5 dB(A) Leq at a distance of 25 feet from the loading dock. This is equivalent to a sound power level of 92.1 dB(A).
The on-site maneuvering associated with the delivery trucks consists of the truck entering the site and backing into the loading dock, idling, loading and unloading, and leaving the site. The proposed operation would have a maximum of one truck per dock per hour, or 22 trucks per hour during daytime hours (7:00 a.m. to 10:00 p.m.) and nighttime hours (10:00 p.m. to 7:00 a.m.). It was assumed that it would take 5 minutes for a truck to enter and leave the project site. During the loading/unloading of the truck, the engine can only idle for a maximum of 5 minutes in compliance with state regulations for air quality. However, the project design (as noted on the project plans) includes installation of signage at truck docks that requires engines to be turned off when unloading and unloading. Installation of signage and enforcement of these idling restrictions would limit idling at truck docks. However, to be conservative, the analysis assumes a maximum of 5 minutes of daytime idling consistent with existing state air quality regulations and assumes 1 minute of idling during the nighttime hours of 10:00 p.m. and 7:00 a.m. To calculate property line noise levels, trucks were modeled as a line source while entering and leaving the site, and as a point source at each loading dock (including knock-out panel locations) while idling.
5.0 Future Acoustical Environment and Impacts
5.1 Construction Noise
Noise associated with the grading, building, and paving for the project would potentially result in short-term impacts to surrounding residential properties. There are residential uses located to the north, east, and south of the project site. A variety of noise-generating equipment would be used during the construction phase of the project, such as excavators, backhoes, front-end loaders, and concrete saws, along with others. The exact number and pieces of construction equipment required are not known at this time. Although maximum noise levels may be 85 to 90 dB(A) at a distance of 50 feet during most construction activities, hourly average noise levels would be lower when taking into account the equipment usage factors. The loudest phase of construction would be the excavation phase and would include dozers, loaders, and excavators. Construction noise levels were calculated based on all three pieces of equipment being active simultaneously.
Construction noise is considered a point source and would attenuate at approximately 6 dB(A) for every doubling of distance. An excavator generates a maximum noise level of 85 dB(A) at 50 feet, a front-end loader generates a maximum noise level of 80 dB(A) at 50 feet, and a dozer generates a maximum noise level of 85 dB(A) at 50 feet. All three pieces

Noise Analysis
Harmony Grove Industrial Project Page 18
of equipment generally operate with a usage factor, the ration of an hour spent at full power, of 40 percent (FHWA 2006). Average hourly noise levels due to simultaneous activity would be 85 dB(A) Leq at 50 feet, or a sound power level of approximately 117 dB(A). To reflect the nature of grading and construction activities, equipment was modeled as an area source distributed over the project footprint. The total sound energy of the area source was modeled with all pieces of equipment operating simultaneously. Noise levels were modeled at a series of 16 receivers located at the adjacent residential uses. The results are summarized in Table 8. Modeled receiver locations and construction noise contours are shown in Figure 5. SoundPLAN data is contained in Attachment 3.
Table 8 Construction Noise Levels at Residential Uses
Receiver Noise Level [dB(A) Leq] 1 71 2 71 3 70 4 70 5 69 6 68 7 64 8 63 9 64
10 62 11 59 12 56 13 58 14 59 15 58 16 58
dB(A) Leq = A-weighted decibels one-hour equivalent level
As shown, construction noise levels would range from 56 to 71 dB(A) Leq at the nearest residential uses. Construction activities would generally occur over the 8-hour period between 7:00 a.m. and 5:00 p.m. on weekdays. Although the existing adjacent residences would be exposed to construction noise levels that may be heard above ambient conditions, the exposure would be temporary and would not exceed the City’s standards. As construction activities would comply with the City Municipal Code Sections 17-234 and 117-238, temporary increases in noise levels from construction activities would be less than significant.

FIGURE 5Construction Noise Contours
and Modeled Receivers
!(!(
!(
!(!(
!(!(
!(
!(
!(
!(
!(
!(
!(
!(
!(
EN
TERPRISE
ST
BORR
A PL
HO
WA
RD
AV
E
PEPPERMINT PL
HARMONY GROVE RD
PR
INC
ES
SK
YR
AP
L
PA
CIF
ICO
AK
SP
L
1
2
3
4
5
67
8
9
10
11
12
13
14
15
16
!(!(
!(
!(!(
!(!(
!(
!(
!(
!(
!(
!(
!(
!(
!(
EN
TERPRISE
ST
BORR
A PL
HO
WA
RD
AV
E
PEPPERMINT PL
HARMONY GROVE RD
PR
INC
ES
SK
YR
AP
L
PA
CIF
ICO
AK
SP
L
1
2
3
4
5
67
8
9
10
11
12
13
14
15
16
Image Source: Nearmaps (flown June 2017)
0 250Feet [Project Boundary
!( Construction Noise Receivers
Construction Noise Contours
60 dB(A) Leq
65 dB(A) Leq
70 dB(A) Leq
75 dB(A) Leq
M:\JOBS5\8811\common_gis\fig5_nos.mxd 8/28/2017 sab

Noise Analysis
Harmony Grove Industrial Project Page 20
5.2 Traffic Noise The project would increase traffic volumes on local roadways. However, the project would not substantially alter the vehicle classifications mix on local or regional roadways, nor would the project alter the speed on an existing roadway or create a new roadway. Thus, the primary factor affecting off-site noise levels would be increased traffic volumes. While changes in noise levels would occur along any roadway where project-related traffic occurs, for noise assessment purposes, noise level increases are assumed to be greatest nearest the project site, as this location would represent the greatest concentration of project-related traffic. Additionally, surrounding streets affected by the project carry greater volumes of traffic and the relative increase would be less along those segments. The project would generate traffic on nearby roadways. Based on the traffic report, the project would result in the generation of 1,085 trips (Linscott, Law & Greenspan 2017). The vehicles associated with project trips would utilize the surrounding roadway network.
As discussed in Section 1.2, doubling of the energy of a noise source, such as traffic volumes on a roadway, would result in a 3 dB(A) increase in noise levels (California Department of Transportation 2013). As stated in Section 2.2.3, noise increases, regardless of the extent, that do not result in noise increases in excess of General Plan standards are not considered significant, and noise increases that result in a 3 dB(A) or less incremental increase in noise beyond the General Plan’s noise standards are not considered significant.
Table 9 presents a conservative assessment of traffic noise levels based on the Existing, Existing plus Project, Cumulative (cumulative projects and existing), and Cumulative plus Project noise levels generated by traffic. Table 9 also summarizes the direct traffic noise level increases due to the project, the cumulative noise increase in the future, and the project’s contribution to any cumulative increases in traffic noise. Traffic noise calculations are contained in Attachment 4.
Table 9 Traffic Noise Impacts - CNEL at 50 Feet
Roadway and Segment Existing
Existing Plus
Project Increase Cumulative Cumulative Plus Project
Cumulative Increase
Project Contribution
to Cumulative
Increase Harmony Grove Road West of Enterprise St. Enterprise Street to
Hale Avenue
65
67
66
68
<1
<1
69
69
69
70
3
2
<1
<1
Hale Avenue Harmony Grove Road
to 9th Avenue
66
66
<1
67
67
2
<1
Enterprise Street Andreasen Drive to
Harmony Grove Road
64
65
<1
66
66
2
<1
NOTE: Differences may vary due to independent rounding.
As shown in Table 9, the project would result in a less than 1 dB increase in traffic noise over the existing condition along all affected roadway segments. Therefore, the project

Noise Analysis
Harmony Grove Industrial Project Page 21
would result in less than significant direct impact related to traffic noise. Additionally, while the cumulative plus project traffic would result in a potentially cumulative impact noise along Harmony Grove Road west of Enterprise Street, the project’s contribution to that increase would be less than 1 dB. Therefore, the project’s contribution to the cumulative increase is less than cumulatively considerable.
5.3 On-site Noise The primary noise sources on-site would be HVAC equipment and the loading docks. Using the on-site noise source parameters discussed in Section 4.2, Operation Noise Analysis, noise levels were modeled at a series of 26 receivers located at the property line. Modeled noise levels took into account shielding provided by the proposed building as well as the proposed 8-foot-high wall located adjacent to the residences to the north.
Modeled receivers and the locations of the modeled on-site noise sources are shown in Figure 6. Modeled data is included in Attachment 5. Future projected noise levels are summarized in Table 10. Daytime noise contours for on-site noise sources are shown in Figure 7 and nighttime noise contours are shown in Figure 8.
As shown in Table 10, daytime on-site generated noise levels would range from 26 to 45 dB(A) Leq at the residential property lines and 37 to 59 dB(A) Leq at the industrial property lines, and nighttime noise levels would range from 25 to 42 dB(A) Leq at the residential property lines and 37 to 59 dB(A) Leq at the industrial property lines. Noise levels would not exceed the applicable Noise Ordinance limits at the property lines.

FIGURE 6On-Site Noise Sources
and Modeled Receivers
!(!(
!(
!(
!(!(
!(
!(
!(
!(
!(
!(
!(
!(
!(
!(
!(
!(
!(
!(
!(
!(
!(
!(
!(
!(
#*#*#*#*#*#*#*#*#*
#*#*#*#*#*#*#*#*#*#*
#*#*#*
")
")
")
HARMONY GROVE RD
EN
TERPRISE
ST
HO
WA
RD
AV
EPR
INC
ES
SK
YR
AP
L
PA
CIF
ICO
AK
SP
L
12
3
4
5
6
7
8
9
10
11
12
13
14
15
16
17
18
19
20
21
22
23
24
25
26!(
!(!(
!(
!(!(
!(
!(
!(
!(
!(
!(
!(
!(
!(
!(
!(
!(
!(
!(
!(
!(
!(
!(
!(
!(
#*#*#*#*#*#*#*#*#*
#*#*#*#*#*#*#*#*#*#*
#*#*#*
")
")
")
HARMONY GROVE RD
EN
TERPRISE
ST
HO
WA
RD
AV
EPR
INC
ES
SK
YR
AP
L
PA
CIF
ICO
AK
SP
L
12
3
4
5
6
7
8
9
10
11
12
13
14
15
16
17
18
19
20
21
22
23
24
25
26
Image Source: Nearmaps (flown June 2017)
0 250Feet [Project Boundary
Proposed Building
!( Receivers
Proposed 8-ft Wall
") AHU Location
") HVAC Unit
#* Loading Docks
Truck Routes
M:\JOBS5\8811\common_gis\fig6_nos.mxd 8/28/2017 sab

FIGURE 7
Daytime On-Site Noise Contours
!(!(
!(
!(
!(!(
!(
!(
!(
!(
!(
!(
!(
!(
!(
!(
!(
!(
!(
!(
!(
!(
!(
!(
!(
!(
#*#*#*#*#*#*#*#*#*
#*#*#*#*#*#*#*#*#*#*
#*#*#*
")
")
")
HARMONY GROVE RD
EN
TERPRISE
ST
CH
AB
LIS
CT
BOR
RAP
L
HO
WA
RD
AV
E
PR
INC
ES
SK
YR
AP
L
PA
CIF
ICO
AK
SP
L
12
3
4
5
6
7
8
9
10
11
12
13
14
15
16
17
18
19
20
21
22
23
24
25
26!(
!(!(
!(
!(!(
!(
!(
!(
!(
!(
!(
!(
!(
!(
!(
!(
!(
!(
!(
!(
!(
!(
!(
!(
!(
#*#*#*#*#*#*#*#*#*
#*#*#*#*#*#*#*#*#*#*
#*#*#*
")
")
")
HARMONY GROVE RD
EN
TERPRISE
ST
CH
AB
LIS
CT
BOR
RAP
L
HO
WA
RD
AV
E
PR
INC
ES
SK
YR
AP
L
PA
CIF
ICO
AK
SP
L
12
3
4
5
6
7
8
9
10
11
12
13
14
15
16
17
18
19
20
21
22
23
24
25
26
Image Source: Nearmaps (flown June 2017)
0 250Feet [Project Boundary
Proposed Building
!( Receivers
Proposed 8-ft Wall
") AHU Location
") HVAC Unit
#* Loading Docks
Truck Routes
Daytime Noise Contours
40 dB(A) Leq
45 dB(A) Leq
50 dB(A) Leq
55 dB(A) Leq
60 dB(A) Leq
65 dB(A) Leq
M:\JOBS5\8811\common_gis\fig7_nos.mxd 8/28/2017 sab

FIGURE 8
Nighttime On-Site Noise Contours
!(!(
!(
!(
!(!(
!(
!(
!(
!(
!(
!(
!(
!(
!(
!(
!(
!(
!(
!(
!(
!(
!(
!(
!(
!(
#*#*#*#*#*#*#*#*#*
#*#*#*#*#*#*#*#*#*#*
#*#*#*
")
")
")
HARMONY GROVE RD
EN
TERPRISE
ST
CH
AB
LIS
CT
BOR
RAP
L
HO
WA
RD
AV
E
PR
INC
ES
SK
YR
AP
L
PA
CIF
ICO
AK
SP
L
12
3
4
5
6
7
8
9
10
11
12
13
14
15
16
17
18
19
20
21
22
23
24
25
26!(
!(!(
!(
!(!(
!(
!(
!(
!(
!(
!(
!(
!(
!(
!(
!(
!(
!(
!(
!(
!(
!(
!(
!(
!(
#*#*#*#*#*#*#*#*#*
#*#*#*#*#*#*#*#*#*#*
#*#*#*
")
")
")
HARMONY GROVE RD
EN
TERPRISE
ST
CH
AB
LIS
CT
BOR
RAP
L
HO
WA
RD
AV
E
PR
INC
ES
SK
YR
AP
L
PA
CIF
ICO
AK
SP
L
12
3
4
5
6
7
8
9
10
11
12
13
14
15
16
17
18
19
20
21
22
23
24
25
26
Image Source: Nearmaps (flown June 2017)
0 250Feet [Project Boundary
Proposed Building
!( Receivers
Proposed 8-ft Wall
") AHU Location
") HVAC Unit
#* Loading Docks
Truck Routes
Nighttime Noise Contours
40 dB(A) Leq
45 dB(A) Leq
50 dB(A) Leq
55 dB(A) Leq
60 dB(A) Leq
65 dB(A) Leq
M:\JOBS5\8811\common_gis\fig8_nos.mxd 8/28/2017 sab

Noise Analysis
Harmony Grove Industrial Project Page 25
Table 10 On-Site Generated Noise Levels
Receiver Land Use Daytime Noise
Level [dB(A) Leq] Nighttime Noise Level [dB(A) Leq]
Noise Ordinance Limit [Daytime/Nighttime dB(A) Leq]
1 Residential 30 28 50/45 2 Residential 31 28 50/45 3 Residential 32 30 50/45 4 Residential 45 42 50/45 5 Residential 45 42 50/45 6 Residential 45 42 50/45 7 Residential 45 42 50/45 8 Industrial Park 48 46 70/70 9 Industrial Park 51 49 70/70
10 Industrial Park 58 58 70/70 11 Industrial Park 59 59 70/70 12 Industrial Park 52 50 70/70 13 Industrial Park 48 45 70/70 14 Industrial Park 42 41 70/70 15 Industrial Park 39 39 70/70 16 Industrial Park 37 37 70/70 17 Residential 34 33 50/45 18 Residential 30 28 50/45 19 Residential 29 27 50/45 20 Residential 28 27 50/45 21 Residential 29 28 50/45 22 Residential 30 29 50/45 23 Residential 29 28 50/45 24 Residential 26 25 50/45 25 Residential 29 27 50/45 26 Residential 29 27 50/45
6.0 Conclusions and Noise Abatement Measures
6.1 Construction Noise Construction activities would generally occur between 7:00 a.m. and 5:00 p.m. on weekdays. As demonstrated, construction noise levels would range from 56 to 71 dB(A) Leq at the nearest residential uses. While construction may be heard over other noise sources in the area, the exposure would be temporary and would not exceed the applicable regulation of 75 dB(A) Leq at the nearest residential property. Therefore, temporary increases in noise levels from construction activities would be less than significant.
6.2 Traffic Noise The project would result in a less than 1 dB increase in traffic noise over the existing condition along all affected roadway segments. Therefore, the project would result in a less than significant impact. Additionally, while the cumulative plus project traffic would increase noise along Harmony Grove Road west of Enterprise Street by more than 3 dB, the

Noise Analysis
Harmony Grove Industrial Project Page 26
project’s contribution to this increase would be less than 1 dB. Therefore, the project’s contribution to the cumulative increase would be less than cumulatively considerable.
6.3 On-site Generated Noise The primary noise sources on-site would be HVAC and ventilation equipment and the loading docks. As shown in Table 10, daytime on-site generated noise levels would range from 26 to 45 dB(A) Leq at the residential property lines and 37 to 59 dB(A) Leq at the industrial property lines, and nighttime noise levels would range from 25 to 42 dB(A) Leq at the residential property lines and 37 to 59 dB(A) Leq at the industrial property lines. Noise levels would not exceed the applicable Noise Ordinance limits at the property lines.
7.0 References Cited California Department of Transportation 2013 Technical Noise Supplement. November. Escondido, City of 2012 General Plan. Federal Highway Administration (FHWA) 2006 FHWA Roadway Construction Noise Model User’s Guide, Final Report. January
2006. Federal Transit Administration 2006 Transit Noise and Vibration Impact Assessment. Office of Planning and
Environment. FTA-VA-90-1003-06. May 2006. Linscott, Law & Greenspan 2017 Victory Industrial Park/Escondido Innovation Center: Warehouse. Prepared for
Exeter Property Group. LLG Ref. 3-17-2780. August 7, 2017. NavCon Engineering 2005 SoundPlan Essential, version 3.0.

Noise Analysis
Harmony Grove Industrial Project
ATTACHMENTS

Noise Analysis
Harmony Grove Industrial Project
ATTACHMENT 1
Noise Measurement Data

8811 Escondido Harmony Grove Industrial
Summary
Filename LxT_Data.102
Serial Number 3827
Model SoundExpert™ LxT
Firmware Version 2.206
User
Location MS1
Job Description
Note
Measurement Description
Start 2016/02/18 10:52:31
Stop 2016/02/18 11:07:32
Duration 0:15:00.6
Run Time 0:15:00.6
Pause 0:00:00.0
Pre Calibration 2016/02/18 10:52:01
Post Calibration None
Calibration Deviation ---
Overall Settings
RMS Weight A Weighting
Peak Weight A Weighting
Detector Slow
Preamp PRMLxT1L
Microphone Correction Off
Integration Method Linear
OBA Range Normal
OBA Bandwidth 1/1 and 1/3
OBA Freq. Weighting A Weighting
OBA Max Spectrum At Lmax
Overload 121.6 dB
A C Z
Under Range Peak 77.8 74.8 79.8 dB
Under Range Limit 25.9 25.2 31.9 dB
Noise Floor 16.2 16.0 21.9 dB
Results
LAeq 43.1 dB
LAE 72.7 dB
EA 2.060 µPa²h
LApeak (max) 2016/02/18 10:54:20 102.5 dB
LASmax 2016/02/18 10:54:20 66.7 dB
LASmin 2016/02/18 11:04:26 36.4 dB
SEA -99.9 dB
LAS > 85.0 dB (Exceedence Counts / Duration) 0 0.0 s
LAS > 115.0 dB (Exceedence Counts / Duration) 0 0.0 s
LApeak > 135.0 dB (Exceedence Counts / Duration) 0 0.0 s
LApeak > 137.0 dB (Exceedence Counts / Duration) 0 0.0 s
LApeak > 140.0 dB (Exceedence Counts / Duration) 0 0.0 s
LCeq 55.9 dB
LAeq 43.1 dB
LCeq - LAeq 12.8 dB
LAIeq 53.5 dB
LAeq 43.1 dB
LAIeq - LAeq 10.4 dB
# Overloads 0
Overload Duration 0.0 s
# OBA Overloads 0
OBA Overload Duration 0.0 s
Statistics
LAS5.00 46.2 dB
LAS10.00 44.6 dB
LAS33.30 41.2 dB
LAS50.00 39.9 dB
LAS66.60 39.0 dB
LAS90.00 37.4 dB
Measurement 1

8811 Escondido Harmony Grove Industrial
Summary
Filename LxT_Data.103
Serial Number 3827
Model SoundExpert™ LxT
Firmware Version 2.206
User
Location MS2
Job Description
Note
Measurement Description
Start 2016/02/18 11:20:22
Stop 2016/02/18 11:35:23
Duration 0:15:00.6
Run Time 0:15:00.6
Pause 0:00:00.0
Pre Calibration 2016/02/18 11:19:57
Post Calibration None
Calibration Deviation ---
Overall Settings
RMS Weight A Weighting
Peak Weight A Weighting
Detector Slow
Preamp PRMLxT1L
Microphone Correction Off
Integration Method Linear
OBA Range Normal
OBA Bandwidth 1/1 and 1/3
OBA Freq. Weighting A Weighting
OBA Max Spectrum At Lmax
Overload 121.6 dB
A C Z
Under Range Peak 77.9 74.9 79.9 dB
Under Range Limit 25.9 25.2 31.9 dB
Noise Floor 16.2 16.0 21.9 dB
Results
LAeq 47.1 dB
LAE 76.6 dB
EA 5.104 µPa²h
LApeak (max) 2016/02/18 11:26:32 87.6 dB
LASmax 2016/02/18 11:33:59 57.7 dB
LASmin 2016/02/18 11:35:19 44.1 dB
SEA -99.9 dB
LAS > 85.0 dB (Exceedence Counts / Duration) 0 0.0 s
LAS > 115.0 dB (Exceedence Counts / Duration) 0 0.0 s
LApeak > 135.0 dB (Exceedence Counts / Duration) 0 0.0 s
LApeak > 137.0 dB (Exceedence Counts / Duration) 0 0.0 s
LApeak > 140.0 dB (Exceedence Counts / Duration) 0 0.0 s
LCeq 59.2 dB
LAeq 47.1 dB
LCeq - LAeq 12.1 dB
LAIeq 51.2 dB
LAeq 47.1 dB
LAIeq - LAeq 4.1 dB
# Overloads 0
Overload Duration 0.0 s
# OBA Overloads 0
OBA Overload Duration 0.0 s
Statistics
LAS5.00 49.4 dB
LAS10.00 48.4 dB
LAS33.30 47.0 dB
LAS50.00 46.4 dB
LAS66.60 46.1 dB
LAS90.00 45.4 dB
Measurement 2

8811 Escondido Harmony Grove Industrial
Summary
Filename LxT_Data.104
Serial Number 3827
Model SoundExpert™ LxT
Firmware Version 2.206
User
Location MS3
Job Description
Note
Measurement Description
Start 2016/02/18 11:50:12
Stop 2016/02/18 12:05:12
Duration 0:15:00.5
Run Time 0:15:00.5
Pause 0:00:00.0
Pre Calibration 2016/02/18 11:49:27
Post Calibration None
Calibration Deviation ---
Overall Settings
RMS Weight A Weighting
Peak Weight A Weighting
Detector Slow
Preamp PRMLxT1L
Microphone Correction Off
Integration Method Linear
OBA Range Normal
OBA Bandwidth 1/1 and 1/3
OBA Freq. Weighting A Weighting
OBA Max Spectrum At Lmax
Overload 121.6 dB
A C Z
Under Range Peak 77.9 74.9 79.9 dB
Under Range Limit 25.9 25.2 31.9 dB
Noise Floor 16.2 16.0 21.9 dB
Results
LAeq 57.1 dB
LAE 86.7 dB
EA 51.605 µPa²h
LApeak (max) 2016/02/18 11:56:28 98.4 dB
LASmax 2016/02/18 12:04:54 73.0 dB
LASmin 2016/02/18 11:57:01 42.9 dB
SEA -99.9 dB
LAS > 85.0 dB (Exceedence Counts / Duration) 0 0.0 s
LAS > 115.0 dB (Exceedence Counts / Duration) 0 0.0 s
LApeak > 135.0 dB (Exceedence Counts / Duration) 0 0.0 s
LApeak > 137.0 dB (Exceedence Counts / Duration) 0 0.0 s
LApeak > 140.0 dB (Exceedence Counts / Duration) 0 0.0 s
LCeq 67.0 dB
LAeq 57.1 dB
LCeq - LAeq 9.9 dB
LAIeq 59.4 dB
LAeq 57.1 dB
LAIeq - LAeq 2.3 dB
# Overloads 0
Overload Duration 0.0 s
# OBA Overloads 0
OBA Overload Duration 0.0 s
Statistics
LAS5.00 61.5 dB
LAS10.00 60.2 dB
LAS33.30 57.3 dB
LAS50.00 55.3 dB
LAS66.60 53.0 dB
LAS90.00 48.2 dB
Measurement 3

8811 Escondido Harmony Grove Industrial
Summary
Filename LxT_Data.105
Serial Number 3827
Model SoundExpert™ LxT
Firmware Version 2.206
User
Location MS4
Job Description
Note
Measurement Description
Start 2016/02/18 12:27:48
Stop 2016/02/18 12:42:49
Duration 0:15:00.7
Run Time 0:15:00.7
Pause 0:00:00.0
Pre Calibration 2016/02/18 12:27:08
Post Calibration None
Calibration Deviation ---
Overall Settings
RMS Weight A Weighting
Peak Weight A Weighting
Detector Slow
Preamp PRMLxT1L
Microphone Correction Off
Integration Method Linear
OBA Range Normal
OBA Bandwidth 1/1 and 1/3
OBA Freq. Weighting A Weighting
OBA Max Spectrum At Lmax
Overload 121.6 dB
A C Z
Under Range Peak 77.9 74.9 79.9 dB
Under Range Limit 25.9 25.2 31.9 dB
Noise Floor 16.2 16.0 21.9 dB
Results
LAeq 61.4 dB
LAE 90.9 dB
EA 137.083 µPa²h
LApeak (max) 2016/02/18 12:35:20 97.6 dB
LASmax 2016/02/18 12:40:03 71.2 dB
LASmin 2016/02/18 12:27:49 46.4 dB
SEA -99.9 dB
LAS > 85.0 dB (Exceedence Counts / Duration) 0 0.0 s
LAS > 115.0 dB (Exceedence Counts / Duration) 0 0.0 s
LApeak > 135.0 dB (Exceedence Counts / Duration) 0 0.0 s
LApeak > 137.0 dB (Exceedence Counts / Duration) 0 0.0 s
LApeak > 140.0 dB (Exceedence Counts / Duration) 0 0.0 s
LCeq 69.4 dB
LAeq 61.4 dB
LCeq - LAeq 8.0 dB
LAIeq 62.8 dB
LAeq 61.4 dB
LAIeq - LAeq 1.4 dB
# Overloads 0
Overload Duration 0.0 s
# OBA Overloads 0
OBA Overload Duration 0.0 s
Statistics
LAS5.00 66.3 dB
LAS10.00 64.8 dB
LAS33.30 61.5 dB
LAS50.00 59.5 dB
LAS66.60 57.1 dB
LAS90.00 51.2 dB
Measurement 4

Noise Analysis
Harmony Grove Industrial Project
ATTACHMENT 2
HVAC Example Specifications

118 RT-PRC039C-EN
Fan Performance
\
Table 6. Standard motor & low static drive accessory sheave/fan speed (rpm)
Unit ModelNumber
Fan 6 Turns 5 Turns 4 Turns 3 Turns 2 Turns 1 Turn
Tons Sheave Open Open Open Open Open Open Closed
5 WSC060ED AK44x3/4" N/A 720 791 861 931 1002 1072
6 WSC072ED AK56x1" N/A 558 612 665 718 772 825
7½ WSC090ED AK57x1" N/A 688 737 787 837 887 N/A
10 WSC120ED AK105X1" N/A 724 776 828 880 932 984
Note: Factory set at 3 turns open.
Table 7. Standard motor & high static drive accessory sheave/fan speed (rpm)
Unit ModelNumber
Fan 6 Turns 5 Turns 4 Turns 3 Turns 2 Turns 1 Turn
Tons Sheave Open Open Open Open Open Open Closed
6 WSC072ED AK56x1" N/A 968 1018 1068 1118 1169 1219
7½ WSC090ED AK57x1" 1053 1091 1129 1166 1204 1242 N/A
10 WSC120ED AK105X1" 1110 1159 1209 1258 1308 1357 N/A
Note: Factory set at 3 turns open.
Table 8. Oversized motor & high static drive accessory sheave/fan speed (rpm)
Unit ModelNumber
Fan 6 Turns 5 Turns 4 Turns 3 Turns 2 Turns 1 Turn
Tons Sheave Open Open Open Open Open Open Closed
7½ WSC090ED AK85x1" 1186 1249 1311 1373 1436 N/A N/A
Note: Factory set at 3 turns open.
Table 9. Outdoor sound power level—dB (ref. 10—2 W)
Unit ModelNumber
Octave Center Frequency Overall dBATons 63 125 250 500 1000 2000 4000 8000
5 T/YSC060ED 84 91 79 77 74 71 68 63 80
6 T/YSC072ED 83 90 86 82 79 75 70 63 85
7½ T/YSC090ED 83 90 86 83 80 75 71 64 85
8.5 T/YSC102ED 83 89 84 81 77 72 69 62 83
10 T/YSC120ED 83 86 80 77 73 69 66 60 79
Note: Tests follow ARI270-95.
Table 10. Outdoor sound power level—dB (ref. 10—12 W)
Unit ModelNumber
Octave Center Frequency Overall
Tons 63 125 250 500 1000 2000 4000 8000 dBA
5 WSC060ED 84 91 79 77 74 71 68 63 80
6 WSC072ED 83 90 86 82 79 75 70 63 85
7½ WSC090ED 83 90 86 83 80 75 71 64 85
10 WSC120ED 83 86 80 77 73 69 66 60 79
Note: Tests follow ARI270-95.

01
Ja
nu
ary
, 2000
©
Ca
nn
on
D
esig
n 2
010
All
rig
hts
re
se
rve
d.
No
pa
rt o
f th
is d
ocum
ent m
ay
be
re
pro
du
ce
d o
r u
tiliz
ed
in
any form
, w
ithout prior
wri
tte
n a
uth
ori
za
tio
n b
y T
he
Cannon C
orp
ora
tion.
mic
hae
l bar
ker
11/1
0/2
015 1
1:1
2 A
Mg:
\2008\2
008353\d
wgs
\ucs
d e
ast
cam
pus
bed
tow
er\s
hee
ts\3
53.0
1-m
0008
t: +1.858.597.0555 | f: +1.858.597.0565
5670 Oberlin Drive
San Diego, CA 92121 U.S.A.
www.exp.com
exp U.S. Services Inc.
BUILDINGS EARTH & ENVIRONMENT ENERGY
INDUSTRIAL INFRASTRUCTURE SUSTAINABILITY
The new identity of X-nth
Scale:
Issue Date:
CD Project No.:
Drawing Title:
1901 Avenue of the Stars, Suite 175Los Angeles, CA 90067 310.229.2700
© Cannon Design 2011
AGENCY APPROVAL
ARCHITECT
CONSULTANT
Baltimore ■ Boston ■ Buffalo ■ Calgary ■ ChicagoHouston ■ Los Angeles ■ Mumbai ■ New York ■ Phoenix
St. Louis ■ San Francisco ■ Shanghai ■ TorontoVancouver ■ Victoria ■ Washington DC
UCSD FD&C PROJECT NUMBER 4153
ARCHITECT SEAL CONSULTANT SEAL
KEY PLAN
REVISIONS
9300 CAMPUS POINT DRIVELA JOLLA, CA 92037
BED TOWER
JUNE 4, 2013
003043.00
INCREMENT 6
Checked by:Drawn by:
OSPHD #: IL-092778-6
No. Description Date
AS NOTED
M0008
MECHANICAL EQUIPMENT SCHEDULES
- -
CO #0175 04/17/20141

Noise Analysis
Harmony Grove Industrial Project
ATTACHMENT 3
SoundPLAN Data – Construction Noise

8811 Escondido Harmony Grove Industrial
SoundPLAN Data - Construction
Level Corrections
Source name Reference Leq1 Kwall CI CT
dB(A) dB(A) dB(A) dB(A)
Construction Unit 117 - - -
Construction

8811 Escondido Harmony Grove Industrial
SoundPLAN Data - Construction
Limit Level w/o NP Level w. NP Difference Conflict
No. Receiver name X Y Floor Height Leq1 Leq1 Leq1 Leq1 Leq1
m dB(A) dB(A) dB(A) dB(A) dB(A)
1 1 489361.22 3663487.14 1.Fl 1.5 - 70.9 0 -70.9 -
2 2 489387.00 3663474.90 1.Fl 1.5 - 71.1 0 -71.1 -
3 3 489443.13 3663455.52 1.Fl 1.5 - 69.7 0 -69.7 -
4 4 489444.23 3663436.50 1.Fl 1.5 - 70.4 0 -70.4 -
5 5 489464.52 3663426.81 1.Fl 1.5 - 69.1 0 -69.1 -
6 6 489484.45 3663416.76 1.Fl 1.5 - 67.7 0 -67.7 -
7 7 489502.91 3663407.62 1.Fl 1.5 - 64.3 0 -64.3 -
8 8 489411.68 3663516.40 1.Fl 1.5 - 62.8 0 -62.8 -
9 9 489449.71 3663493.36 1.Fl 1.5 - 64.3 0 -64.3 -
10 10 489484.81 3663476.91 1.Fl 1.5 - 61.6 0 -61.6 -
11 11 489531.98 3663454.24 1.Fl 1.5 - 59.2 0 -59.2 -
12 12 489613.19 3663416.49 1.Fl 1.5 - 55.6 0 -55.6 -
13 13 489558.29 3663356.96 1.Fl 1.5 - 58.1 0 -58.1 -
14 14 489488.17 3663258.40 1.Fl 1.5 - 58.8 0 -58.8 -
15 15 489424.01 3663192.26 1.Fl 1.5 - 58.3 0 -58.3 -
16 16 489355.66 3663136.29 1.Fl 1.5 - 57.5 0 -57.5 -
Coordinates
in meter
Receivers

Noise Analysis
Harmony Grove Industrial Project
ATTACHMENT 4
FHWA RD-77-108 Traffic Noise Calculations

FHWA RD-77-108
Data Input Sheet
Project Name : Escondido Harmony Grove Industrial
Project Number : 8324 Surface Refelction: CNEL
Modeled Condition : Existing, Existing + Project, Existing + Cumulative, Existing + Cumulative + Project Assessment Metric: Hard
Peak ratio to ADT: 10.00
Traffic Desc. (Peak or ADT) : ADT
Segment Roadway Segment Traffic Vol. % Autos %MT % HT Day % Eve % Night %
EXISTING
1 Harmony Grove Road West of Enterprise Street 5,760 40 50 95.00 3.50 1.50 80.00 10.00 10.00
2 Harmony Grove Road Enterprise Street to Hale Avenue 9,310 40 50 95.00 3.50 1.50 80.00 10.00 10.00
3 Hale Avenue Harmony Grove Road to 9th Avenue 7,950 35 50 95.00 3.50 1.50 80.00 10.00 10.00
4 Enterprise Street Andreasen Drive to Harmony Grove Road 6,100 35 50 95.00 3.50 1.50 80.00 10.00 10.00
EXISTING + PROJECT
1 Harmony Grove Road West of Enterprise Street 6,140 40 50 94.60 3.50 1.90 80.00 10.00 10.00
2 Harmony Grove Road Enterprise Street to Hale Avenue 9,830 40 50 94.60 3.50 1.90 80.00 10.00 10.00
3 Hale Avenue Harmony Grove Road to 9th Avenue 8,232 35 50 94.60 3.50 1.90 80.00 10.00 10.00
4 Enterprise Street Andreasen Drive to Harmony Grove Road 6,447 35 50 94.60 3.50 1.90 80.00 10.00 10.00
EXISTING + CUMULATIVE
1 Harmony Grove Road West of Enterprise Street 11,965 40 50 95.00 3.50 1.50 80.00 10.00 10.00
2 Harmony Grove Road Enterprise Street to Hale Avenue 14,270 40 50 95.00 3.50 1.50 80.00 10.00 10.00
3 Hale Avenue Harmony Grove Road to 9th Avenue 11,010 35 50 95.00 3.50 1.50 80.00 10.00 10.00
4 Enterprise Street Andreasen Drive to Harmony Grove Road 8,780 35 50 95.00 3.50 1.50 80.00 10.00 10.00
EXISTING + CUMULATIVE + PROJECT
1 Harmony Grove Road West of Enterprise Street 12,345 40 50 94.80 3.50 1.70 80.00 10.00 10.00
2 Harmony Grove Road Enterprise Street to Hale Avenue 14,790 40 50 94.80 3.50 1.70 80.00 10.00 10.00
3 Hale Avenue Harmony Grove Road to 9th Avenue 11,292 35 50 94.80 3.50 1.70 80.00 10.00 10.00
4 Enterprise Street Andreasen Drive to Harmony Grove Road 9,127 35 50 94.80 3.50 1.70 80.00 10.00 10.00
Predicted Noise Levels
Project Name : Escondido Harmony Grove Industrial
Project Number : 8324
Modeled Condition : Existing, Existing + Project, Existing + Cumulative, Existing + Cumulative + Project
Assessment Metric: Hard
Segment Roadway Segment Auto MT HT Total 75 dB 70 dB 65 dB 60 dB 55 dB 50 dB
EXISTING
1 Harmony Grove Road West of Enterprise Street 63.2 57.7 58.9 65.4 5 17 55 173 548 1,734
2 Harmony Grove Road Enterprise Street to Hale Avenue 65.2 59.8 61.0 67.4 9 27 87 275 869 2,748
3 Hale Avenue Harmony Grove Road to 9th Avenue 62.9 58.2 59.8 65.5 6 18 56 177 561 1,774
4 Enterprise Street Andreasen Drive to Harmony Grove Road 61.7 57.1 58.6 64.4 4 14 44 138 435 1,377
EXISTING + PROJECT
1 Harmony Grove Road West of Enterprise Street 63.4 58.0 60.2 65.9 6 19 62 195 615 1,945
2 Harmony Grove Road Enterprise Street to Hale Avenue 65.5 60.1 62.2 67.9 10 31 97 308 975 3,083
3 Hale Avenue Harmony Grove Road to 9th Avenue 63.0 58.4 60.9 65.9 6 19 62 195 615 1,945
4 Enterprise Street Andreasen Drive to Harmony Grove Road 62.0 57.3 59.9 64.9 5 15 49 155 489 1,545
EXISTING + CUMULATIVE
1 Harmony Grove Road West of Enterprise Street 66.3 60.9 62.1 68.5 11 35 112 354 1,119 3,540
2 Harmony Grove Road Enterprise Street to Hale Avenue 67.1 61.7 62.8 69.3 13 43 135 426 1,346 4,256
3 Hale Avenue Harmony Grove Road to 9th Avenue 64.3 59.7 61.2 66.9 8 24 77 245 774 2,449
4 Enterprise Street Andreasen Drive to Harmony Grove Road 63.3 58.7 60.2 65.9 6 19 62 195 615 1,945
EXISTING + CUMULATIVE + PROJECT
1 Harmony Grove Road West of Enterprise Street 66.5 61.1 62.7 68.8 12 38 120 379 1,199 3,793
2 Harmony Grove Road Enterprise Street to Hale Avenue 67.2 61.8 63.5 69.6 14 46 144 456 1,442 4,560
3 Hale Avenue Harmony Grove Road to 9th Avenue 64.4 59.8 61.8 67.2 8 26 83 262 830 2,624
4 Enterprise Street Andreasen Drive to Harmony Grove Road 63.5 58.8 60.9 66.3 7 21 67 213 674 2,133
Distance to Traffic Noise Level Contours, Feet
FHWA RD-77-108
Traffic Noise Prediction Model
Speed
(Mph)Distance
to CL K-Factor
FHWA RD-77-108
Traffic Noise Prediction Model
Noise Levels, dBA Hard

Classification Mix
Existing Auto (95%) MT (3.5%) HT (1.5%) Project Only Auto (88.5%) MT (3.5%) HT (8%) Existing + Project Auto MT HT
1 Harmony Grove Road West of Enterprise Street 5760 5472 201.6 86.4 380 336.3 13.3 30.4 6140 5808.3 214.9 116.8
2 Harmony Grove Road Enterprise Street to Hale Avenue 9310 8844.5 325.85 139.65 520 460.2 18.2 41.6 9830 9304.7 344.05 181.25
3 Hale Avenue Escondido Harmony Grove Industrial 7950 7552.5 278.25 119.25 282 249.57 9.87 22.56 8232 7802.07 288.12 141.81
4 Enterprise Street Andreasen Drive to Harmony Grove Road 6100 5795 213.5 91.5 347 307.095 12.145 27.76 6447 6102.095 225.645 119.26
94.6% 3.5% 1.9%
Cumulative + Existing Auto (95%) MT (3.5%) HT (1.5%) Project Only Auto (88.5%) MT (3.5%) HT (8%) Cumulative + Existing + Project Auto MT HT
1 Harmony Grove Road West of Enterprise Street 11,965 11366.75 418.775 179.475 380 336.3 13.3 30.4 12345 11703.05 432.075 209.875
2 Harmony Grove Road Enterprise Street to Hale Avenue 14,270 13556.5 499.45 214.05 520 460.2 18.2 41.6 14790 14016.7 517.65 255.65
3 Hale Avenue Harmony Grove Road to 9th Avenue 11,010 10459.5 385.35 165.15 282 249.57 9.87 22.56 11292 10709.07 395.22 187.71
4 Enterprise Street Andreasen Drive to Harmony Grove Road 8,780 8341 307.3 131.7 347 307.095 12.145 27.76 9127 8648.095 319.445 159.46
94.8% 3.5% 1.7%

Noise Analysis
Harmony Grove Industrial Project
ATTACHMENT 5
SoundPLAN Data – On-Site Generated Noise

8811 Escondido Harmony Grove Industrial
SoundPLAN Data - On-Site
Source name Reference Level 63 125 250 500 1 2 4 8 Kwall CI CT
dB(A) Hz Hz Hz Hz kHz kHz kHz kHz dB(A) dB(A) dB(A)
AHU Unit Leq1 86.5 69.8 71.8 81.3 83.8 75 70.2 66 56.9 - - -
AHU Unit Leq2 86.5 69.8 71.8 81.3 83.8 75 70.2 66 56.9 - - -
HVAC - Sales Office Unit Leq1 76.2 53.8 66.8 68.3 70.8 70 67.2 64 55.9 - - -
HVAC - Sales Office Unit Leq2 79.2 56.8 69.8 71.3 73.8 73 70.2 67 58.9 - - -
HVAC - Warehouse Office Unit Leq1 79.2 56.8 69.8 71.3 73.8 73 70.2 67 58.9 - - -
HVAC - Warehouse Office Unit Leq2 82.2 59.8 72.8 74.3 76.8 76 73.2 70 61.9 - - -
Loading Dock 1 Unit Leq1 74.3 - - -
Loading Dock 1 Unit Leq2 81.3 - - -
Loading Dock 2 Unit Leq1 74.3 - - -
Loading Dock 2 Unit Leq2 81.3 - - -
Loading Dock 3 Unit Leq1 74.3 - - -
Loading Dock 3 Unit Leq2 81.3 - - -
Loading Dock 4 Unit Leq1 74.3 - - -
Loading Dock 4 Unit Leq2 81.3 - - -
Loading Dock 5 Unit Leq1 74.3 - - -
Loading Dock 5 Unit Leq2 81.3 - - -
Loading Dock 6 Unit Leq1 74.3 - - -
Loading Dock 6 Unit Leq2 81.3 - - -
Loading Dock 7 Unit Leq1 74.3 - - -
Loading Dock 7 Unit Leq2 81.3 - - -
Loading Dock 8 Unit Leq1 74.3 - - -
Loading Dock 8 Unit Leq2 81.3 - - -
Loading Dock 9 Unit Leq1 74.3 - - -
Loading Dock 9 Unit Leq2 81.3 - - -
Loading Dock 10 Unit Leq1 74.3 - - -
Loading Dock 10 Unit Leq2 81.3 - - -
Loading Dock 11 Unit Leq1 74.3 - - -
Loading Dock 11 Unit Leq2 81.3 - - -
Loading Dock 12 Unit Leq1 74.3 - - -
Loading Dock 12 Unit Leq2 81.3 - - -
Loading Dock 13 Unit Leq1 74.3 - - -
Loading Dock 13 Unit Leq2 81.3 - - -
Loading Dock 14 Unit Leq1 74.3 - - -
Loading Dock 14 Unit Leq2 81.3 - - -
Loading Dock 15 Unit Leq1 74.3 - - -
Loading Dock 15 Unit Leq2 81.3 - - -
Loading Dock 16 Unit Leq1 74.3 - - -
Loading Dock 16 Unit Leq2 81.3 - - -
Loading Dock 17 Unit Leq1 74.3 - - -
Loading Dock 17 Unit Leq2 81.3 - - -
Loading Dock 18 Unit Leq1 74.3 - - -
Loading Dock 18 Unit Leq2 81.3 - - -
Loading Dock 19 Unit Leq1 74.3 - - -
Loading Dock 19 Unit Leq2 81.3 - - -
Loading Dock 20 Unit Leq1 74.3 - - -
Loading Dock 20 Unit Leq2 81.3 - - -
Loading Dock 21 Unit Leq1 74.3 - - -
Loading Dock 21 Unit Leq2 81.3 - - -
Loading Dock 22 Unit Leq1 74.3 - - -
Loading Dock 22 Unit Leq2 81.3 - - -
Knock Out Door 1 Unit Leq1 74.3 - - -
Knock Out Door 1 Unit Leq2 81.3 - - -
Knock Out Door 2 Unit Leq1 74.3 - - -
Knock Out Door 2 Unit Leq2 81.3 - - -
Knock Out Door 3 Unit Leq1 74.3 - - -
Knock Out Door 3 Unit Leq2 81.3 - - -
Knock Out Door 4 Unit Leq1 74.3 - - -
Knock Out Door 4 Unit Leq2 81.3 - - -
Truck Route 1 Unit Leq1 87.3 - - -
Truck Route 1 Unit Leq2 87.3 - - -
Truck Route 2 Unit Leq1 89.1 - - -
Truck Route 2 Unit Leq2 89.1 - - -
Truck Route 3 Unit Leq1 89.1 - - -
Truck Route 3 Unit Leq2 89.1 - - -
Truck Route 4 Unit Leq1 89.1 - - -
Truck Route 4 Unit Leq2 89.1 - - -
Truck Route 5 Unit Leq1 87.3 - - -
Truck Route 5 Unit Leq2 87.3 - - -
Frequency spectrum [dB(A)] Corrections
Sources

8811 Escondido Harmony Grove Industrial
SoundPLAN Data - On-Site
No. X Y Floor Height Leq1 Leq2 Leq1 Leq2 Leq1 Leq2 Leq1 Leq2 Leq1 Leq2
m
1 489486.91 3663418.80 1.Fl 1.5 50 45 27.6 29.7 0 0 -27.6 -29.7 - -
2 489466.62 3663428.19 1.Fl 1.5 50 45 28.3 30.7 0 0 -28.3 -30.7 - -
3 489447.18 3663437.72 1.Fl 1.5 50 45 29.7 32.2 0 0 -29.7 -32.2 - -
4 489439.07 3663500.24 1.Fl 1.5 50 45 41.8 45.1 0 0 -41.8 -45.1 - -
5 489388.87 3663477.92 1.Fl 1.5 50 45 42.2 45.4 0 0 -42.2 -45.4 - -
6 489362.86 3663490.25 1.Fl 1.5 50 45 41.9 44.8 0 0 -41.9 -44.8 - -
7 489360.48 3663542.98 1.Fl 1.5 50 45 42.1 44.6 0 0 -42.1 -44.6 - -
8 489326.10 3663505.61 1.Fl 1.5 70 70 46.0 48.3 0 0 -46.0 -48.3 - -
9 489312.49 3663477.49 1.Fl 1.5 70 70 49.4 51.2 0 0 -49.4 -51.2 - -
10 489295.40 3663442.20 1.Fl 1.5 70 70 57.9 58.4 0 0 -57.9 -58.4 - -
11 489259.64 3663396.24 1.Fl 1.5 70 70 58.5 59.2 0 0 -58.5 -59.2 - -
12 489243.41 3663369.73 1.Fl 1.5 70 70 50.3 52.3 0 0 -50.3 -52.3 - -
13 489228.95 3663338.18 1.Fl 1.5 70 70 44.9 47.6 0 0 -44.9 -47.6 - -
14 489210.99 3663302.25 1.Fl 1.5 70 70 40.6 41.6 0 0 -40.6 -41.6 - -
15 489194.78 3663269.17 1.Fl 1.5 70 70 39.0 39.3 0 0 -39.0 -39.3 - -
16 489176.81 3663233.02 1.Fl 1.5 70 70 37.1 37.4 0 0 -37.1 -37.4 - -
17 489162.87 3663182.49 1.Fl 1.5 50 45 33.3 33.7 0 0 -33.3 -33.7 - -
18 489208.63 3663203.80 1.Fl 1.5 50 45 28.4 29.9 0 0 -28.4 -29.9 - -
19 489248.45 3663225.79 1.Fl 1.5 50 45 26.9 29.1 0 0 -26.9 -29.1 - -
20 489293.14 3663252.30 1.Fl 1.5 50 45 26.9 28.4 0 0 -26.9 -28.4 - -
21 489325.35 3663270.70 1.Fl 1.5 50 45 28.1 29.1 0 0 -28.1 -29.1 - -
22 489363.68 3663292.17 1.Fl 1.5 50 45 29.1 29.9 0 0 -29.1 -29.9 - -
23 489409.69 3663320.65 1.Fl 1.5 50 45 28.2 29.2 0 0 -28.2 -29.2 - -
24 489446.36 3663358.67 1.Fl 1.5 50 45 24.8 26.4 0 0 -24.8 -26.4 - -
25 489481.45 3663388.25 1.Fl 1.5 50 45 27.4 29.3 0 0 -27.4 -29.3 - -
26 489503.66 3663410.28 1.Fl 1.5 50 45 26.9 28.8 0 0 -26.9 -28.8 - -
dB(A) dB(A)in meter
Limit
dB(A) dB(A) dB(A)
Level w/o NP Level w. NP Difference ConflictCoordinates
Receivers

8811 Escondido Harmony Grove Industrial
SoundPLAN Data - On-Site
Source name Leq1 Leq2 Leq1 Leq2
1 1.Fl 27.6 29.7 0.0 0.0
AHU 18.7 18.7 0 0
HVAC - Sales Office 3.0 6.0 0 0
HVAC - Warehouse Office 23.9 26.9 0 0
Knock Out Door 1 1.4 8.4 0 0
Knock Out Door 2 0.3 7.3 0 0
Knock Out Door 3 -0.9 6.1 0 0
Knock Out Door 4 -1.8 5.2 0 0
Loading Dock 1 2.4 9.4 0 0
Loading Dock 2 2.5 9.5 0 0
Loading Dock 3 2.3 9.3 0 0
Loading Dock 4 2.1 9.1 0 0
Loading Dock 5 1.4 8.4 0 0
Loading Dock 6 1.2 8.2 0 0
Loading Dock 7 1.0 8.0 0 0
Loading Dock 8 0.9 7.9 0 0
Loading Dock 9 0.7 7.7 0 0
Loading Dock 10 0.2 7.2 0 0
Loading Dock 11 0.1 7.1 0 0
Loading Dock 12 0.0 7.0 0 0
Loading Dock 13 -0.2 6.8 0 0
Loading Dock 14 -0.4 6.6 0 0
Loading Dock 15 -1.0 6.0 0 0
Loading Dock 16 -1.1 5.9 0 0
Loading Dock 17 -1.3 5.7 0 0
Loading Dock 18 -1.4 5.6 0 0
Loading Dock 19 -1.5 5.5 0 0
Loading Dock 20 -1.7 5.3 0 0
Loading Dock 21 -1.8 5.2 0 0
Loading Dock 22 -2.4 4.6 0 0
Truck Route 1 16.0 16.0 0 0
Truck Route 2 17.3 17.3 0 0
Truck Route 3 17.0 17.0 0 0
Truck Route 4 16.9 16.9 0 0
Truck Route 5 15.0 15.0 0 0
2 1.Fl 28.3 30.7 0.0 0.0
AHU 18.2 18.2 0 0
HVAC - Sales Office 2.3 5.3 0 0
HVAC - Warehouse Office 25.3 28.3 0 0
Knock Out Door 1 2.9 9.9 0 0
Knock Out Door 2 1.5 8.5 0 0
Knock Out Door 3 0.1 7.1 0 0
Knock Out Door 4 -0.9 6.1 0 0
Loading Dock 1 4.3 11.3 0 0
Loading Dock 2 4.3 11.3 0 0
Loading Dock 3 4.0 11.0 0 0
Loading Dock 4 3.7 10.7 0 0
Loading Dock 5 2.8 9.8 0 0
Loading Dock 6 2.6 9.6 0 0
Loading Dock 7 2.4 9.4 0 0
Loading Dock 8 2.2 9.2 0 0
Loading Dock 9 2.0 9.0 0 0
Level w/o NP Level w. NP
dB(A) dB(A)
Contributions

8811 Escondido Harmony Grove Industrial
SoundPLAN Data - On-Site
Loading Dock 10 1.4 8.4 0 0
Loading Dock 11 1.3 8.3 0 0
Loading Dock 12 1.1 8.1 0 0
Loading Dock 13 0.9 7.9 0 0
Loading Dock 14 0.6 7.6 0 0
Loading Dock 15 0.0 7.0 0 0
Loading Dock 16 -0.2 6.8 0 0
Loading Dock 17 -0.3 6.7 0 0
Loading Dock 18 -0.5 6.5 0 0
Loading Dock 19 -0.6 6.4 0 0
Loading Dock 20 -0.9 6.1 0 0
Loading Dock 21 -1.1 5.9 0 0
Loading Dock 22 -1.6 5.4 0 0
Truck Route 1 16.5 16.5 0 0
Truck Route 2 17.6 17.6 0 0
Truck Route 3 17.1 17.1 0 0
Truck Route 4 16.8 16.8 0 0
Truck Route 5 15.0 15.0 0 0
3 1.Fl 29.7 32.2 0.0 0.0
AHU 21.7 21.7 0 0
HVAC - Sales Office 6.0 9.0 0 0
HVAC - Warehouse Office 27.0 30.0 0 0
Knock Out Door 1 4.6 11.6 0 0
Knock Out Door 2 2.7 9.7 0 0
Knock Out Door 3 1.0 8.0 0 0
Knock Out Door 4 -0.3 6.7 0 0
Loading Dock 1 6.6 13.6 0 0
Loading Dock 2 6.4 13.4 0 0
Loading Dock 3 5.9 12.9 0 0
Loading Dock 4 5.6 12.6 0 0
Loading Dock 5 4.4 11.4 0 0
Loading Dock 6 4.1 11.1 0 0
Loading Dock 7 3.8 10.8 0 0
Loading Dock 8 3.5 10.5 0 0
Loading Dock 9 3.3 10.3 0 0
Loading Dock 10 2.5 9.5 0 0
Loading Dock 11 2.3 9.3 0 0
Loading Dock 12 2.1 9.1 0 0
Loading Dock 13 1.9 8.9 0 0
Loading Dock 14 1.5 8.5 0 0
Loading Dock 15 0.8 7.8 0 0
Loading Dock 16 0.6 7.6 0 0
Loading Dock 17 0.4 7.4 0 0
Loading Dock 18 0.3 7.3 0 0
Loading Dock 19 0.1 7.1 0 0
Loading Dock 20 -0.3 6.7 0 0
Loading Dock 21 -0.5 6.5 0 0
Loading Dock 22 -1.0 6.0 0 0
Truck Route 1 17.3 17.3 0 0
Truck Route 2 17.8 17.8 0 0
Truck Route 3 17.1 17.1 0 0
Truck Route 4 16.7 16.7 0 0
Truck Route 5 14.7 14.7 0 0
4 1.Fl 41.8 45.1 0.0 0.0
AHU 24.1 24.1 0 0
Contributions

8811 Escondido Harmony Grove Industrial
SoundPLAN Data - On-Site
HVAC - Sales Office 9.7 12.7 0 0
HVAC - Warehouse Office 24.4 27.4 0 0
Knock Out Door 1 24.1 31.1 0 0
Knock Out Door 2 21.8 28.8 0 0
Knock Out Door 3 19.9 26.9 0 0
Knock Out Door 4 18.4 25.4 0 0
Loading Dock 1 26.3 33.3 0 0
Loading Dock 2 25.9 32.9 0 0
Loading Dock 3 25.4 32.4 0 0
Loading Dock 4 25.0 32.0 0 0
Loading Dock 5 23.7 30.7 0 0
Loading Dock 6 23.3 30.3 0 0
Loading Dock 7 23.0 30.0 0 0
Loading Dock 8 22.7 29.7 0 0
Loading Dock 9 22.4 29.4 0 0
Loading Dock 10 21.4 28.4 0 0
Loading Dock 11 21.2 28.2 0 0
Loading Dock 12 20.9 27.9 0 0
Loading Dock 13 20.7 27.7 0 0
Loading Dock 14 20.4 27.4 0 0
Loading Dock 15 19.7 26.7 0 0
Loading Dock 16 19.5 26.5 0 0
Loading Dock 17 19.2 26.2 0 0
Loading Dock 18 19.0 26.0 0 0
Loading Dock 19 18.8 25.8 0 0
Loading Dock 20 18.2 25.2 0 0
Loading Dock 21 18.0 25.0 0 0
Loading Dock 22 17.7 24.7 0 0
Truck Route 1 33.1 33.1 0 0
Truck Route 2 34.5 34.5 0 0
Truck Route 3 33.7 33.7 0 0
Truck Route 4 32.8 32.8 0 0
Truck Route 5 30.5 30.5 0 0
5 1.Fl 42.2 45.4 0.0 0.0
AHU 20.5 20.5 0 0
HVAC - Sales Office 4.7 7.7 0 0
HVAC - Warehouse Office 22.4 25.4 0 0
Knock Out Door 1 24.6 31.6 0 0
Knock Out Door 2 21.4 28.4 0 0
Knock Out Door 3 19.0 26.0 0 0
Knock Out Door 4 17.2 24.2 0 0
Loading Dock 1 27.8 34.8 0 0
Loading Dock 2 27.2 34.2 0 0
Loading Dock 3 26.5 33.5 0 0
Loading Dock 4 25.9 32.9 0 0
Loading Dock 5 24.0 31.0 0 0
Loading Dock 6 23.5 30.5 0 0
Loading Dock 7 23.0 30.0 0 0
Loading Dock 8 22.7 29.7 0 0
Loading Dock 9 22.2 29.2 0 0
Loading Dock 10 20.9 27.9 0 0
Loading Dock 11 20.7 27.7 0 0
Loading Dock 12 20.3 27.3 0 0
Loading Dock 13 20.0 27.0 0 0
Loading Dock 14 19.6 26.6 0 0
Contributions

8811 Escondido Harmony Grove Industrial
SoundPLAN Data - On-Site
Loading Dock 15 18.7 25.7 0 0
Loading Dock 16 18.5 25.5 0 0
Loading Dock 17 18.2 25.2 0 0
Loading Dock 18 18.0 25.0 0 0
Loading Dock 19 17.7 24.7 0 0
Loading Dock 20 17.0 24.0 0 0
Loading Dock 21 16.8 23.8 0 0
Loading Dock 22 16.4 23.4 0 0
Truck Route 1 35.2 35.2 0 0
Truck Route 2 34.8 34.8 0 0
Truck Route 3 33.5 33.5 0 0
Truck Route 4 32.7 32.7 0 0
Truck Route 5 30.6 30.6 0 0
6 1.Fl 41.9 44.8 0.0 0.0
AHU 21.2 21.2 0 0
HVAC - Sales Office 5.4 8.4 0 0
HVAC - Warehouse Office 21.0 24.0 0 0
Knock Out Door 1 23.6 30.6 0 0
Knock Out Door 2 21.1 28.1 0 0
Knock Out Door 3 18.9 25.9 0 0
Knock Out Door 4 17.2 24.2 0 0
Loading Dock 1 25.5 32.5 0 0
Loading Dock 2 25.2 32.2 0 0
Loading Dock 3 24.8 31.8 0 0
Loading Dock 4 24.5 31.5 0 0
Loading Dock 5 23.2 30.2 0 0
Loading Dock 6 22.9 29.9 0 0
Loading Dock 7 22.5 29.5 0 0
Loading Dock 8 22.2 29.2 0 0
Loading Dock 9 21.8 28.8 0 0
Loading Dock 10 20.7 27.7 0 0
Loading Dock 11 20.5 27.5 0 0
Loading Dock 12 20.1 27.1 0 0
Loading Dock 13 19.9 26.9 0 0
Loading Dock 14 19.6 26.6 0 0
Loading Dock 15 18.7 25.7 0 0
Loading Dock 16 18.4 25.4 0 0
Loading Dock 17 18.1 25.1 0 0
Loading Dock 18 17.9 24.9 0 0
Loading Dock 19 17.7 24.7 0 0
Loading Dock 20 17.0 24.0 0 0
Loading Dock 21 16.8 23.8 0 0
Loading Dock 22 16.4 23.4 0 0
Truck Route 1 34.8 34.8 0 0
Truck Route 2 34.9 34.9 0 0
Truck Route 3 33.7 33.7 0 0
Truck Route 4 33.0 33.0 0 0
Truck Route 5 30.9 30.9 0 0
7 1.Fl 42.1 44.6 0.0 0.0
AHU 26.2 26.2 0 0
HVAC - Sales Office 12.0 15.0 0 0
HVAC - Warehouse Office 21.8 24.8 0 0
Knock Out Door 1 22.1 29.1 0 0
Knock Out Door 2 20.7 27.7 0 0
Knock Out Door 3 19.7 26.7 0 0
Contributions

8811 Escondido Harmony Grove Industrial
SoundPLAN Data - On-Site
Knock Out Door 4 18.5 25.5 0 0
Loading Dock 1 23.1 30.1 0 0
Loading Dock 2 23.0 30.0 0 0
Loading Dock 3 22.8 29.8 0 0
Loading Dock 4 22.7 29.7 0 0
Loading Dock 5 21.9 28.9 0 0
Loading Dock 6 21.6 28.6 0 0
Loading Dock 7 21.4 28.4 0 0
Loading Dock 8 21.3 28.3 0 0
Loading Dock 9 21.1 28.1 0 0
Loading Dock 10 20.7 27.7 0 0
Loading Dock 11 20.6 27.6 0 0
Loading Dock 12 20.4 27.4 0 0
Loading Dock 13 20.2 27.2 0 0
Loading Dock 14 20.0 27.0 0 0
Loading Dock 15 19.5 26.5 0 0
Loading Dock 16 19.4 26.4 0 0
Loading Dock 17 19.2 26.2 0 0
Loading Dock 18 19.0 26.0 0 0
Loading Dock 19 18.9 25.9 0 0
Loading Dock 20 18.4 25.4 0 0
Loading Dock 21 18.3 25.3 0 0
Loading Dock 22 18.0 25.0 0 0
Truck Route 1 33.8 33.8 0 0
Truck Route 2 35.0 35.0 0 0
Truck Route 3 34.5 34.5 0 0
Truck Route 4 34.1 34.1 0 0
Truck Route 5 32.1 32.1 0 0
8 1.Fl 46.0 48.3 0.0 0.0
AHU 27.4 27.4 0 0
HVAC - Sales Office 13.2 16.2 0 0
HVAC - Warehouse Office 22.4 25.4 0 0
Knock Out Door 1 25.5 32.5 0 0
Knock Out Door 2 24.7 31.7 0 0
Knock Out Door 3 23.3 30.3 0 0
Knock Out Door 4 21.7 28.7 0 0
Loading Dock 1 25.5 32.5 0 0
Loading Dock 2 25.6 32.6 0 0
Loading Dock 3 25.7 32.7 0 0
Loading Dock 4 25.7 32.7 0 0
Loading Dock 5 25.5 32.5 0 0
Loading Dock 6 25.4 32.4 0 0
Loading Dock 7 25.3 32.3 0 0
Loading Dock 8 25.2 32.2 0 0
Loading Dock 9 25.0 32.0 0 0
Loading Dock 10 24.5 31.5 0 0
Loading Dock 11 24.3 31.3 0 0
Loading Dock 12 24.1 31.1 0 0
Loading Dock 13 23.9 30.9 0 0
Loading Dock 14 23.7 30.7 0 0
Loading Dock 15 23.1 30.1 0 0
Loading Dock 16 22.8 29.8 0 0
Loading Dock 17 22.6 29.6 0 0
Loading Dock 18 22.4 29.4 0 0
Loading Dock 19 22.2 29.2 0 0
Contributions

8811 Escondido Harmony Grove Industrial
SoundPLAN Data - On-Site
Loading Dock 20 21.6 28.6 0 0
Loading Dock 21 21.4 28.4 0 0
Loading Dock 22 21.0 28.0 0 0
Truck Route 1 38.0 38.0 0 0
Truck Route 2 39.2 39.2 0 0
Truck Route 3 38.6 38.6 0 0
Truck Route 4 38.1 38.1 0 0
Truck Route 5 36.2 36.2 0 0
9 1.Fl 49.4 51.2 0.0 0.0
AHU 28.0 28.0 0 0
HVAC - Sales Office 13.6 16.6 0 0
HVAC - Warehouse Office 22.6 25.6 0 0
Knock Out Door 1 27.4 34.4 0 0
Knock Out Door 2 27.4 34.4 0 0
Knock Out Door 3 26.0 33.0 0 0
Knock Out Door 4 24.2 31.2 0 0
Loading Dock 1 26.2 33.2 0 0
Loading Dock 2 26.7 33.7 0 0
Loading Dock 3 26.9 33.9 0 0
Loading Dock 4 27.1 34.1 0 0
Loading Dock 5 27.5 34.5 0 0
Loading Dock 6 27.6 34.6 0 0
Loading Dock 7 27.6 34.6 0 0
Loading Dock 8 27.6 34.6 0 0
Loading Dock 9 27.6 34.6 0 0
Loading Dock 10 27.3 34.3 0 0
Loading Dock 11 27.2 34.2 0 0
Loading Dock 12 27.0 34.0 0 0
Loading Dock 13 26.8 33.8 0 0
Loading Dock 14 26.6 33.6 0 0
Loading Dock 15 25.8 32.8 0 0
Loading Dock 16 25.5 32.5 0 0
Loading Dock 17 25.3 32.3 0 0
Loading Dock 18 25.0 32.0 0 0
Loading Dock 19 24.8 31.8 0 0
Loading Dock 20 24.0 31.0 0 0
Loading Dock 21 23.7 30.7 0 0
Loading Dock 22 23.2 30.2 0 0
Truck Route 1 41.2 41.2 0 0
Truck Route 2 42.9 42.9 0 0
Truck Route 3 42.3 42.3 0 0
Truck Route 4 41.9 41.9 0 0
Truck Route 5 40.1 40.1 0 0
10 1.Fl 57.9 58.4 0.0 0.0
AHU 28.7 28.7 0 0
HVAC - Sales Office 13.6 16.6 0 0
HVAC - Warehouse Office 22.1 25.1 0 0
Knock Out Door 1 27.6 34.6 0 0
Knock Out Door 2 30.3 37.3 0 0
Knock Out Door 3 30.7 37.7 0 0
Knock Out Door 4 28.6 35.6 0 0
Loading Dock 1 25.4 32.4 0 0
Loading Dock 2 26.0 33.0 0 0
Loading Dock 3 26.4 33.4 0 0
Loading Dock 4 26.8 33.8 0 0
Contributions

8811 Escondido Harmony Grove Industrial
SoundPLAN Data - On-Site
Loading Dock 5 28.1 35.1 0 0
Loading Dock 6 28.5 35.5 0 0
Loading Dock 7 28.9 35.9 0 0
Loading Dock 8 29.2 36.2 0 0
Loading Dock 9 29.6 36.6 0 0
Loading Dock 10 30.6 37.6 0 0
Loading Dock 11 30.7 37.7 0 0
Loading Dock 12 30.9 37.9 0 0
Loading Dock 13 31.0 38.0 0 0
Loading Dock 14 31.0 38.0 0 0
Loading Dock 15 30.5 37.5 0 0
Loading Dock 16 30.3 37.3 0 0
Loading Dock 17 30.0 37.0 0 0
Loading Dock 18 29.7 36.7 0 0
Loading Dock 19 29.4 36.4 0 0
Loading Dock 20 28.3 35.3 0 0
Loading Dock 21 28.0 35.0 0 0
Loading Dock 22 27.2 34.2 0 0
Truck Route 1 48.5 48.5 0 0
Truck Route 2 50.9 50.9 0 0
Truck Route 3 51.5 51.5 0 0
Truck Route 4 51.7 51.7 0 0
Truck Route 5 50.3 50.3 0 0
11 1.Fl 58.5 59.2 0.0 0.0
AHU 28.7 28.7 0 0
HVAC - Sales Office 14.0 17.0 0 0
HVAC - Warehouse Office 20.2 23.2 0 0
Knock Out Door 1 23.6 30.6 0 0
Knock Out Door 2 26.4 33.4 0 0
Knock Out Door 3 30.1 37.1 0 0
Knock Out Door 4 34.6 41.6 0 0
Loading Dock 1 21.8 28.8 0 0
Loading Dock 2 22.2 29.2 0 0
Loading Dock 3 22.6 29.6 0 0
Loading Dock 4 22.8 29.8 0 0
Loading Dock 5 24.0 31.0 0 0
Loading Dock 6 24.4 31.4 0 0
Loading Dock 7 24.8 31.8 0 0
Loading Dock 8 25.1 32.1 0 0
Loading Dock 9 25.5 32.5 0 0
Loading Dock 10 26.9 33.9 0 0
Loading Dock 11 27.3 34.3 0 0
Loading Dock 12 27.8 34.8 0 0
Loading Dock 13 28.3 35.3 0 0
Loading Dock 14 28.9 35.9 0 0
Loading Dock 15 30.7 37.7 0 0
Loading Dock 16 31.3 38.3 0 0
Loading Dock 17 32.0 39.0 0 0
Loading Dock 18 32.5 39.5 0 0
Loading Dock 19 33.3 40.3 0 0
Loading Dock 20 35.2 42.2 0 0
Loading Dock 21 35.7 42.7 0 0
Loading Dock 22 35.6 42.6 0 0
Truck Route 1 48.2 48.2 0 0
Truck Route 2 50.7 50.7 0 0
Contributions

8811 Escondido Harmony Grove Industrial
SoundPLAN Data - On-Site
Truck Route 3 51.5 51.5 0 0
Truck Route 4 52.6 52.6 0 0
Truck Route 5 52.3 52.3 0 0
12 1.Fl 50.3 52.3 0.0 0.0
AHU 27.4 27.4 0 0
HVAC - Sales Office 15.2 18.2 0 0
HVAC - Warehouse Office 19.0 22.0 0 0
Knock Out Door 1 21.7 28.7 0 0
Knock Out Door 2 24.1 31.1 0 0
Knock Out Door 3 27.1 34.1 0 0
Knock Out Door 4 31.5 38.5 0 0
Loading Dock 1 20.2 27.2 0 0
Loading Dock 2 20.6 27.6 0 0
Loading Dock 3 20.8 27.8 0 0
Loading Dock 4 21.1 28.1 0 0
Loading Dock 5 22.1 29.1 0 0
Loading Dock 6 22.4 29.4 0 0
Loading Dock 7 22.7 29.7 0 0
Loading Dock 8 23.0 30.0 0 0
Loading Dock 9 23.3 30.3 0 0
Loading Dock 10 24.5 31.5 0 0
Loading Dock 11 24.8 31.8 0 0
Loading Dock 12 25.3 32.3 0 0
Loading Dock 13 25.7 32.7 0 0
Loading Dock 14 26.1 33.1 0 0
Loading Dock 15 27.6 34.6 0 0
Loading Dock 16 28.2 35.2 0 0
Loading Dock 17 28.8 35.8 0 0
Loading Dock 18 29.3 36.3 0 0
Loading Dock 19 30.0 37.0 0 0
Loading Dock 20 32.2 39.2 0 0
Loading Dock 21 33.0 40.0 0 0
Loading Dock 22 34.2 41.2 0 0
Truck Route 1 40.0 40.0 0 0
Truck Route 2 42.3 42.3 0 0
Truck Route 3 43.0 43.0 0 0
Truck Route 4 43.7 43.7 0 0
Truck Route 5 43.1 43.1 0 0
13 1.Fl 44.9 47.6 0.0 0.0
AHU 25.0 25.0 0 0
HVAC - Sales Office 16.4 19.4 0 0
HVAC - Warehouse Office 16.0 19.0 0 0
Knock Out Door 1 20.0 27.0 0 0
Knock Out Door 2 21.9 28.9 0 0
Knock Out Door 3 24.3 31.3 0 0
Knock Out Door 4 27.5 34.5 0 0
Loading Dock 1 18.6 25.6 0 0
Loading Dock 2 19.0 26.0 0 0
Loading Dock 3 19.2 26.2 0 0
Loading Dock 4 19.4 26.4 0 0
Loading Dock 5 20.3 27.3 0 0
Loading Dock 6 20.5 27.5 0 0
Loading Dock 7 20.8 27.8 0 0
Loading Dock 8 21.0 28.0 0 0
Loading Dock 9 21.3 28.3 0 0
Contributions

8811 Escondido Harmony Grove Industrial
SoundPLAN Data - On-Site
Loading Dock 10 22.2 29.2 0 0
Loading Dock 11 22.5 29.5 0 0
Loading Dock 12 22.8 29.8 0 0
Loading Dock 13 23.2 30.2 0 0
Loading Dock 14 23.5 30.5 0 0
Loading Dock 15 24.7 31.7 0 0
Loading Dock 16 25.1 32.1 0 0
Loading Dock 17 25.5 32.5 0 0
Loading Dock 18 25.9 32.9 0 0
Loading Dock 19 26.4 33.4 0 0
Loading Dock 20 27.9 34.9 0 0
Loading Dock 21 28.5 35.5 0 0
Loading Dock 22 26.9 33.9 0 0
Truck Route 1 34.8 34.8 0 0
Truck Route 2 36.9 36.9 0 0
Truck Route 3 37.4 37.4 0 0
Truck Route 4 37.9 37.9 0 0
Truck Route 5 36.7 36.7 0 0
14 1.Fl 40.6 41.6 0.0 0.0
AHU 24.3 24.3 0 0
HVAC - Sales Office 18.1 21.1 0 0
HVAC - Warehouse Office 12.1 15.1 0 0
Knock Out Door 1 6.2 13.2 0 0
Knock Out Door 2 8.7 15.7 0 0
Knock Out Door 3 12.0 19.0 0 0
Knock Out Door 4 17.1 24.1 0 0
Loading Dock 1 5.0 12.0 0 0
Loading Dock 2 5.4 12.4 0 0
Loading Dock 3 5.7 12.7 0 0
Loading Dock 4 5.9 12.9 0 0
Loading Dock 5 6.8 13.8 0 0
Loading Dock 6 7.0 14.0 0 0
Loading Dock 7 7.4 14.4 0 0
Loading Dock 8 7.6 14.6 0 0
Loading Dock 9 8.0 15.0 0 0
Loading Dock 10 9.3 16.3 0 0
Loading Dock 11 9.6 16.6 0 0
Loading Dock 12 10.1 17.1 0 0
Loading Dock 13 10.6 17.6 0 0
Loading Dock 14 11.1 18.1 0 0
Loading Dock 15 12.6 19.6 0 0
Loading Dock 16 13.2 20.2 0 0
Loading Dock 17 14.0 21.0 0 0
Loading Dock 18 14.6 21.6 0 0
Loading Dock 19 15.4 22.4 0 0
Loading Dock 20 21.4 28.4 0 0
Loading Dock 21 21.7 28.7 0 0
Loading Dock 22 22.2 29.2 0 0
Truck Route 1 31.0 31.0 0 0
Truck Route 2 33.2 33.2 0 0
Truck Route 3 33.8 33.8 0 0
Truck Route 4 34.2 34.2 0 0
Truck Route 5 32.8 32.8 0 0
15 1.Fl 39.0 39.3 0.0 0.0
AHU 23.4 23.4 0 0
Contributions

8811 Escondido Harmony Grove Industrial
SoundPLAN Data - On-Site
HVAC - Sales Office 22.8 25.8 0 0
HVAC - Warehouse Office 11.8 14.8 0 0
Knock Out Door 1 1.4 8.4 0 0
Knock Out Door 2 3.0 10.0 0 0
Knock Out Door 3 5.1 12.1 0 0
Knock Out Door 4 9.3 16.3 0 0
Loading Dock 1 0.5 7.5 0 0
Loading Dock 2 1.0 8.0 0 0
Loading Dock 3 1.1 8.1 0 0
Loading Dock 4 1.3 8.3 0 0
Loading Dock 5 1.8 8.8 0 0
Loading Dock 6 2.0 9.0 0 0
Loading Dock 7 2.2 9.2 0 0
Loading Dock 8 2.4 9.4 0 0
Loading Dock 9 2.6 9.6 0 0
Loading Dock 10 3.4 10.4 0 0
Loading Dock 11 3.6 10.6 0 0
Loading Dock 12 3.9 10.9 0 0
Loading Dock 13 4.2 11.2 0 0
Loading Dock 14 4.5 11.5 0 0
Loading Dock 15 5.5 12.5 0 0
Loading Dock 16 5.9 12.9 0 0
Loading Dock 17 6.4 13.4 0 0
Loading Dock 18 6.9 13.9 0 0
Loading Dock 19 7.6 14.6 0 0
Loading Dock 20 10.5 17.5 0 0
Loading Dock 21 11.8 18.8 0 0
Loading Dock 22 13.9 20.9 0 0
Truck Route 1 29.1 29.1 0 0
Truck Route 2 31.5 31.5 0 0
Truck Route 3 32.3 32.3 0 0
Truck Route 4 32.9 32.9 0 0
Truck Route 5 31.8 31.8 0 0
16 1.Fl 37.1 37.4 0.0 0.0
AHU 23.6 23.6 0 0
HVAC - Sales Office 22.0 25.0 0 0
HVAC - Warehouse Office 11.6 14.6 0 0
Knock Out Door 1 -0.9 6.1 0 0
Knock Out Door 2 0.4 7.4 0 0
Knock Out Door 3 1.9 8.9 0 0
Knock Out Door 4 4.9 11.9 0 0
Loading Dock 1 -1.7 5.3 0 0
Loading Dock 2 -1.2 5.8 0 0
Loading Dock 3 -1.1 5.9 0 0
Loading Dock 4 -0.9 6.1 0 0
Loading Dock 5 -0.6 6.4 0 0
Loading Dock 6 -0.4 6.6 0 0
Loading Dock 7 -0.3 6.7 0 0
Loading Dock 8 -0.1 6.9 0 0
Loading Dock 9 0.0 7.0 0 0
Loading Dock 10 0.7 7.7 0 0
Loading Dock 11 0.8 7.8 0 0
Loading Dock 12 1.1 8.1 0 0
Loading Dock 13 1.3 8.3 0 0
Loading Dock 14 1.5 8.5 0 0
Contributions

8811 Escondido Harmony Grove Industrial
SoundPLAN Data - On-Site
Loading Dock 15 2.1 9.1 0 0
Loading Dock 16 2.5 9.5 0 0
Loading Dock 17 2.9 9.9 0 0
Loading Dock 18 3.2 10.2 0 0
Loading Dock 19 3.7 10.7 0 0
Loading Dock 20 5.9 12.9 0 0
Loading Dock 21 6.8 13.8 0 0
Loading Dock 22 8.8 15.8 0 0
Truck Route 1 27.0 27.0 0 0
Truck Route 2 29.5 29.5 0 0
Truck Route 3 30.2 30.2 0 0
Truck Route 4 31.1 31.1 0 0
Truck Route 5 29.9 29.9 0 0
17 1.Fl 33.3 33.7 0.0 0.0
AHU 24.5 24.5 0 0
HVAC - Sales Office 19.6 22.6 0 0
HVAC - Warehouse Office 13.0 16.0 0 0
Knock Out Door 1 -3.2 3.8 0 0
Knock Out Door 2 -2.3 4.7 0 0
Knock Out Door 3 -1.4 5.6 0 0
Knock Out Door 4 0.5 7.5 0 0
Loading Dock 1 -3.8 3.2 0 0
Loading Dock 2 -3.2 3.8 0 0
Loading Dock 3 -3.1 3.9 0 0
Loading Dock 4 -3.1 3.9 0 0
Loading Dock 5 -2.9 4.1 0 0
Loading Dock 6 -2.8 4.2 0 0
Loading Dock 7 -2.7 4.3 0 0
Loading Dock 8 -2.6 4.4 0 0
Loading Dock 9 -2.5 4.5 0 0
Loading Dock 10 -2.1 4.9 0 0
Loading Dock 11 -2.0 5.0 0 0
Loading Dock 12 -1.9 5.1 0 0
Loading Dock 13 -1.7 5.3 0 0
Loading Dock 14 -1.6 5.4 0 0
Loading Dock 15 -1.3 5.7 0 0
Loading Dock 16 -1.1 5.9 0 0
Loading Dock 17 -0.8 6.2 0 0
Loading Dock 18 -0.6 6.4 0 0
Loading Dock 19 -0.3 6.7 0 0
Loading Dock 20 1.2 8.2 0 0
Loading Dock 21 1.8 8.8 0 0
Loading Dock 22 3.1 10.1 0 0
Truck Route 1 22.6 22.6 0 0
Truck Route 2 25.1 25.1 0 0
Truck Route 3 25.8 25.8 0 0
Truck Route 4 26.8 26.8 0 0
Truck Route 5 25.7 25.7 0 0
18 1.Fl 28.4 29.9 0.0 0.0
AHU 23.0 23.0 0 0
HVAC - Sales Office 23.4 26.4 0 0
HVAC - Warehouse Office 10.8 13.8 0 0
Knock Out Door 1 -4.5 2.5 0 0
Knock Out Door 2 -3.6 3.4 0 0
Knock Out Door 3 -2.9 4.1 0 0
Contributions

8811 Escondido Harmony Grove Industrial
SoundPLAN Data - On-Site
Knock Out Door 4 -2.0 5.0 0 0
Loading Dock 1 -5.1 1.9 0 0
Loading Dock 2 -4.6 2.4 0 0
Loading Dock 3 -4.5 2.5 0 0
Loading Dock 4 -4.4 2.6 0 0
Loading Dock 5 -4.2 2.8 0 0
Loading Dock 6 -4.1 2.9 0 0
Loading Dock 7 -4.0 3.0 0 0
Loading Dock 8 -3.9 3.1 0 0
Loading Dock 9 -3.8 3.2 0 0
Loading Dock 10 -3.4 3.6 0 0
Loading Dock 11 -3.4 3.6 0 0
Loading Dock 12 -3.2 3.8 0 0
Loading Dock 13 -3.1 3.9 0 0
Loading Dock 14 -3.0 4.0 0 0
Loading Dock 15 -2.8 4.2 0 0
Loading Dock 16 -2.7 4.3 0 0
Loading Dock 17 -2.5 4.5 0 0
Loading Dock 18 -2.4 4.6 0 0
Loading Dock 19 -2.3 4.7 0 0
Loading Dock 20 -1.7 5.3 0 0
Loading Dock 21 -1.5 5.5 0 0
Loading Dock 22 -1.6 5.4 0 0
Truck Route 1 14.7 14.7 0 0
Truck Route 2 16.9 16.9 0 0
Truck Route 3 17.4 17.4 0 0
Truck Route 4 18.1 18.1 0 0
Truck Route 5 16.7 16.7 0 0
19 1.Fl 26.9 29.1 0.0 0.0
AHU 21.6 21.6 0 0
HVAC - Sales Office 24.3 27.3 0 0
HVAC - Warehouse Office 9.0 12.0 0 0
Knock Out Door 1 -5.6 1.4 0 0
Knock Out Door 2 -5.0 2.0 0 0
Knock Out Door 3 -4.1 2.9 0 0
Knock Out Door 4 -2.8 4.2 0 0
Loading Dock 1 -6.2 0.8 0 0
Loading Dock 2 -5.8 1.2 0 0
Loading Dock 3 -5.7 1.3 0 0
Loading Dock 4 -5.6 1.4 0 0
Loading Dock 5 -5.4 1.6 0 0
Loading Dock 6 -5.4 1.6 0 0
Loading Dock 7 -5.3 1.7 0 0
Loading Dock 8 -5.2 1.8 0 0
Loading Dock 9 -5.1 1.9 0 0
Loading Dock 10 -4.8 2.2 0 0
Loading Dock 11 -4.7 2.3 0 0
Loading Dock 12 -4.6 2.4 0 0
Loading Dock 13 -4.6 2.4 0 0
Loading Dock 14 -4.4 2.6 0 0
Loading Dock 15 -3.9 3.1 0 0
Loading Dock 16 -3.7 3.3 0 0
Loading Dock 17 -3.5 3.5 0 0
Loading Dock 18 -3.4 3.6 0 0
Loading Dock 19 -3.2 3.8 0 0
Contributions

8811 Escondido Harmony Grove Industrial
SoundPLAN Data - On-Site
Loading Dock 20 -2.7 4.3 0 0
Loading Dock 21 -2.5 4.5 0 0
Loading Dock 22 -2.2 4.8 0 0
Truck Route 1 9.2 9.2 0 0
Truck Route 2 11.2 11.2 0 0
Truck Route 3 11.4 11.4 0 0
Truck Route 4 11.5 11.5 0 0
Truck Route 5 9.9 9.9 0 0
20 1.Fl 26.9 28.4 0.0 0.0
AHU 24.3 24.3 0 0
HVAC - Sales Office 20.8 23.8 0 0
HVAC - Warehouse Office 10.9 13.9 0 0
Knock Out Door 1 -4.2 2.8 0 0
Knock Out Door 2 -3.4 3.6 0 0
Knock Out Door 3 -2.1 4.9 0 0
Knock Out Door 4 -1.0 6.0 0 0
Loading Dock 1 -4.8 2.2 0 0
Loading Dock 2 -4.4 2.6 0 0
Loading Dock 3 -4.3 2.7 0 0
Loading Dock 4 -4.2 2.8 0 0
Loading Dock 5 -4.0 3.0 0 0
Loading Dock 6 -3.9 3.1 0 0
Loading Dock 7 -3.8 3.2 0 0
Loading Dock 8 -3.7 3.3 0 0
Loading Dock 9 -3.7 3.3 0 0
Loading Dock 10 -3.2 3.8 0 0
Loading Dock 11 -3.1 3.9 0 0
Loading Dock 12 -2.9 4.1 0 0
Loading Dock 13 -2.7 4.3 0 0
Loading Dock 14 -2.5 4.5 0 0
Loading Dock 15 -2.0 5.0 0 0
Loading Dock 16 -1.8 5.2 0 0
Loading Dock 17 -1.6 5.4 0 0
Loading Dock 18 -1.5 5.5 0 0
Loading Dock 19 -1.3 5.7 0 0
Loading Dock 20 -0.9 6.1 0 0
Loading Dock 21 -0.7 6.3 0 0
Loading Dock 22 -0.5 6.5 0 0
Truck Route 1 10.5 10.5 0 0
Truck Route 2 12.5 12.5 0 0
Truck Route 3 12.6 12.6 0 0
Truck Route 4 12.6 12.6 0 0
Truck Route 5 10.9 10.9 0 0
21 1.Fl 28.1 29.1 0.0 0.0
AHU 26.4 26.4 0 0
HVAC - Sales Office 18.6 21.6 0 0
HVAC - Warehouse Office 12.3 15.3 0 0
Knock Out Door 1 -3.2 3.8 0 0
Knock Out Door 2 -2.0 5.0 0 0
Knock Out Door 3 -0.9 6.1 0 0
Knock Out Door 4 0.0 7.0 0 0
Loading Dock 1 -3.8 3.2 0 0
Loading Dock 2 -3.4 3.6 0 0
Loading Dock 3 -3.3 3.7 0 0
Loading Dock 4 -3.2 3.8 0 0
Contributions

8811 Escondido Harmony Grove Industrial
SoundPLAN Data - On-Site
Loading Dock 5 -2.9 4.1 0 0
Loading Dock 6 -2.8 4.2 0 0
Loading Dock 7 -2.6 4.4 0 0
Loading Dock 8 -2.5 4.5 0 0
Loading Dock 9 -2.3 4.7 0 0
Loading Dock 10 -1.8 5.2 0 0
Loading Dock 11 -1.7 5.3 0 0
Loading Dock 12 -1.5 5.5 0 0
Loading Dock 13 -1.4 5.6 0 0
Loading Dock 14 -1.2 5.8 0 0
Loading Dock 15 -0.7 6.3 0 0
Loading Dock 16 -0.6 6.4 0 0
Loading Dock 17 -0.5 6.5 0 0
Loading Dock 18 -0.4 6.6 0 0
Loading Dock 19 -0.3 6.7 0 0
Loading Dock 20 0.0 7.0 0 0
Loading Dock 21 0.1 7.1 0 0
Loading Dock 22 0.2 7.2 0 0
Truck Route 1 11.5 11.5 0 0
Truck Route 2 13.5 13.5 0 0
Truck Route 3 13.5 13.5 0 0
Truck Route 4 13.5 13.5 0 0
Truck Route 5 11.7 11.7 0 0
22 1.Fl 29.1 29.9 0.0 0.0
AHU 27.8 27.8 0 0
HVAC - Sales Office 17.2 20.2 0 0
HVAC - Warehouse Office 14.0 17.0 0 0
Knock Out Door 1 -1.6 5.4 0 0
Knock Out Door 2 -0.7 6.3 0 0
Knock Out Door 3 -0.1 6.9 0 0
Knock Out Door 4 0.0 7.0 0 0
Loading Dock 1 -2.5 4.5 0 0
Loading Dock 2 -2.2 4.8 0 0
Loading Dock 3 -2.1 4.9 0 0
Loading Dock 4 -2.0 5.0 0 0
Loading Dock 5 -1.5 5.5 0 0
Loading Dock 6 -1.3 5.7 0 0
Loading Dock 7 -1.2 5.8 0 0
Loading Dock 8 -1.1 5.9 0 0
Loading Dock 9 -0.9 6.1 0 0
Loading Dock 10 -0.6 6.4 0 0
Loading Dock 11 -0.5 6.5 0 0
Loading Dock 12 -0.4 6.6 0 0
Loading Dock 13 -0.3 6.7 0 0
Loading Dock 14 -0.2 6.8 0 0
Loading Dock 15 0.0 7.0 0 0
Loading Dock 16 0.0 7.0 0 0
Loading Dock 17 0.0 7.0 0 0
Loading Dock 18 0.0 7.0 0 0
Loading Dock 19 0.0 7.0 0 0
Loading Dock 20 -0.1 6.9 0 0
Loading Dock 21 -0.1 6.9 0 0
Loading Dock 22 -0.2 6.8 0 0
Truck Route 1 12.4 12.4 0 0
Truck Route 2 14.2 14.2 0 0
Contributions

8811 Escondido Harmony Grove Industrial
SoundPLAN Data - On-Site
Truck Route 3 14.3 14.3 0 0
Truck Route 4 14.2 14.2 0 0
Truck Route 5 12.3 12.3 0 0
23 1.Fl 28.2 29.2 0.0 0.0
AHU 26.5 26.5 0 0
HVAC - Sales Office 15.7 18.7 0 0
HVAC - Warehouse Office 15.6 18.6 0 0
Knock Out Door 1 -0.2 6.8 0 0
Knock Out Door 2 -0.2 6.8 0 0
Knock Out Door 3 -0.6 6.4 0 0
Knock Out Door 4 -1.4 5.6 0 0
Loading Dock 1 -0.8 6.2 0 0
Loading Dock 2 -0.6 6.4 0 0
Loading Dock 3 -0.5 6.5 0 0
Loading Dock 4 -0.5 6.5 0 0
Loading Dock 5 -0.2 6.8 0 0
Loading Dock 6 -0.2 6.8 0 0
Loading Dock 7 -0.2 6.8 0 0
Loading Dock 8 -0.2 6.8 0 0
Loading Dock 9 -0.1 6.9 0 0
Loading Dock 10 -0.2 6.8 0 0
Loading Dock 11 -0.2 6.8 0 0
Loading Dock 12 -0.3 6.7 0 0
Loading Dock 13 -0.3 6.7 0 0
Loading Dock 14 -0.4 6.6 0 0
Loading Dock 15 -0.7 6.3 0 0
Loading Dock 16 -0.8 6.2 0 0
Loading Dock 17 -0.9 6.1 0 0
Loading Dock 18 -1.0 6.0 0 0
Loading Dock 19 -1.1 5.9 0 0
Loading Dock 20 -1.5 5.5 0 0
Loading Dock 21 -1.6 5.4 0 0
Loading Dock 22 -1.9 5.1 0 0
Truck Route 1 12.7 12.7 0 0
Truck Route 2 14.4 14.4 0 0
Truck Route 3 14.3 14.3 0 0
Truck Route 4 14.2 14.2 0 0
Truck Route 5 12.2 12.2 0 0
24 1.Fl 24.8 26.4 0.0 0.0
AHU 22.1 22.1 0 0
HVAC - Sales Office 13.3 16.3 0 0
HVAC - Warehouse Office 14.7 17.7 0 0
Knock Out Door 1 0.5 7.5 0 0
Knock Out Door 2 -0.4 6.6 0 0
Knock Out Door 3 -1.6 5.4 0 0
Knock Out Door 4 -2.8 4.2 0 0
Loading Dock 1 0.9 7.9 0 0
Loading Dock 2 0.8 7.8 0 0
Loading Dock 3 0.7 7.7 0 0
Loading Dock 4 0.7 7.7 0 0
Loading Dock 5 0.4 7.4 0 0
Loading Dock 6 0.3 7.3 0 0
Loading Dock 7 0.1 7.1 0 0
Loading Dock 8 0.0 7.0 0 0
Loading Dock 9 -0.1 6.9 0 0
Contributions

8811 Escondido Harmony Grove Industrial
SoundPLAN Data - On-Site
Loading Dock 10 -0.6 6.4 0 0
Loading Dock 11 -0.8 6.2 0 0
Loading Dock 12 -0.9 6.1 0 0
Loading Dock 13 -1.1 5.9 0 0
Loading Dock 14 -1.3 5.7 0 0
Loading Dock 15 -1.8 5.2 0 0
Loading Dock 16 -1.9 5.1 0 0
Loading Dock 17 -2.1 4.9 0 0
Loading Dock 18 -2.3 4.7 0 0
Loading Dock 19 -2.5 4.5 0 0
Loading Dock 20 -3.0 4.0 0 0
Loading Dock 21 -3.2 3.8 0 0
Loading Dock 22 -3.4 3.6 0 0
Truck Route 1 10.9 10.9 0 0
Truck Route 2 12.4 12.4 0 0
Truck Route 3 12.0 12.0 0 0
Truck Route 4 11.6 11.6 0 0
Truck Route 5 9.6 9.6 0 0
25 1.Fl 27.4 29.3 0.0 0.0
AHU 21.6 21.6 0 0
HVAC - Sales Office 10.4 13.4 0 0
HVAC - Warehouse Office 23.2 26.2 0 0
Knock Out Door 1 0.7 7.7 0 0
Knock Out Door 2 -0.5 6.5 0 0
Knock Out Door 3 -1.8 5.2 0 0
Knock Out Door 4 -2.8 4.2 0 0
Loading Dock 1 2.4 9.4 0 0
Loading Dock 2 2.2 9.2 0 0
Loading Dock 3 1.8 8.8 0 0
Loading Dock 4 1.5 8.5 0 0
Loading Dock 5 0.6 7.6 0 0
Loading Dock 6 0.4 7.4 0 0
Loading Dock 7 0.2 7.2 0 0
Loading Dock 8 0.0 7.0 0 0
Loading Dock 9 -0.1 6.9 0 0
Loading Dock 10 -0.7 6.3 0 0
Loading Dock 11 -0.8 6.2 0 0
Loading Dock 12 -1.0 6.0 0 0
Loading Dock 13 -1.1 5.9 0 0
Loading Dock 14 -1.3 5.7 0 0
Loading Dock 15 -1.9 5.1 0 0
Loading Dock 16 -2.1 4.9 0 0
Loading Dock 17 -2.2 4.8 0 0
Loading Dock 18 -2.3 4.7 0 0
Loading Dock 19 -2.5 4.5 0 0
Loading Dock 20 -2.8 4.2 0 0
Loading Dock 21 -2.9 4.1 0 0
Loading Dock 22 -3.5 3.5 0 0
Truck Route 1 14.7 14.7 0 0
Truck Route 2 15.8 15.8 0 0
Truck Route 3 15.4 15.4 0 0
Truck Route 4 15.1 15.1 0 0
Truck Route 5 13.2 13.2 0 0
26 1.Fl 26.9 28.8 0.0 0.0
AHU 18.8 18.8 0 0
Contributions

8811 Escondido Harmony Grove Industrial
SoundPLAN Data - On-Site
HVAC - Sales Office 3.4 6.4 0 0
HVAC - Warehouse Office 22.8 25.8 0 0
Knock Out Door 1 0.2 7.2 0 0
Knock Out Door 2 -0.6 6.4 0 0
Knock Out Door 3 -2.1 4.9 0 0
Knock Out Door 4 -2.9 4.1 0 0
Loading Dock 1 1.0 8.0 0 0
Loading Dock 2 1.3 8.3 0 0
Loading Dock 3 1.0 8.0 0 0
Loading Dock 4 0.9 7.9 0 0
Loading Dock 5 0.2 7.2 0 0
Loading Dock 6 0.1 7.1 0 0
Loading Dock 7 -0.1 6.9 0 0
Loading Dock 8 -0.2 6.8 0 0
Loading Dock 9 -0.3 6.7 0 0
Loading Dock 10 -1.0 6.0 0 0
Loading Dock 11 -1.1 5.9 0 0
Loading Dock 12 -1.3 5.7 0 0
Loading Dock 13 -1.4 5.6 0 0
Loading Dock 14 -1.7 5.3 0 0
Loading Dock 15 -2.2 4.8 0 0
Loading Dock 16 -2.3 4.7 0 0
Loading Dock 17 -2.4 4.6 0 0
Loading Dock 18 -2.5 4.5 0 0
Loading Dock 19 -2.6 4.4 0 0
Loading Dock 20 -2.9 4.1 0 0
Loading Dock 21 -3.0 4.0 0 0
Loading Dock 22 -3.6 3.4 0 0
Truck Route 1 15.4 15.4 0 0
Truck Route 2 16.6 16.6 0 0
Truck Route 3 16.5 16.5 0 0
Truck Route 4 16.4 16.4 0 0
Truck Route 5 14.7 14.7 0 0
Contributions