Embed Size (px)
Citation preview
I-405 Bellevue Nickel Improvement Project I-90 to Southeast 8th Street
NOISE AND VIBRATION DISCIPLINE REPORT January 2006
%&e(
!"b$
AÉ
!"̀$
!"̀$
Aæ
%&e(
LakeWashington
B o t h e l l
K i r k l a n d
B e l l e v u e
R e n t o n
AÊ
AÐ
Aí
Aô
AÌ
Aí
Aç
AÅ
Arterial Road
Freeway
Municipality
Lake
Park
M0 2
Mi le s
I-405 Project Area
BellevueNickel
Study Area

This document should be cited as: Washington State Department of Transportation. 2005. I-405 Bellevue Nickel Improvement Project. Noise and Vibration Discipline Report. November. Bellevue, WA. Prepared for the Washington State Department of Transportation, Urban Corridors Office, and the Federal Highway Administration, Olympia, WA.
Title VI WSDOT ensures full compliance with Title VI of the Civil Rights Act of 1964 by prohibiting discrimination against any person on the basis of race, color, national origin or sex in the provision of benefits and services resulting from its federally assisted programs and activities. For questions regarding WSDOT's Title VI Program, you may contact the Department's Title VI Coordinator at 360. 705.7098.
Americans with Disabilities Act (ADA) Information If you would like copies of this document in an alternative format -- large print, Braille, cassette tape, or on computer disk, please call 360.705.7097. Persons who are deaf or hard of hearing, please call the Washington State Telecommunications Relay Service, or Tele-Braille at 7-1-1, Voice 1.800.833.6384, and ask to be connected to 360.705.7097.

This page is blank for double-sided copying.
Contents i
Table of Contents Introduction ...............................................................................................1 What alternatives do we analyze in this discipline report? .................................................................3
What is the No Build Alternative? ................................................................................................3 What are the principal features of the Build Alternative? .............................................................3
Why do we consider noise as we plan this project? .........................................................................13 What are the key points of this report?.............................................................................................13
Noise Analysis Overview .......................................................................15 What are sound and noise? .............................................................................................................15 What are typical sound levels and what affects them?.....................................................................16
Sources of Sound ......................................................................................................................16 The Effect of Distance ...............................................................................................................18 The Effect of Terrain and Shielding ...........................................................................................18
How do we describe sound levels? ..................................................................................................20 What are the effects of loud noises? ................................................................................................20 What project coordination did we perform?......................................................................................20 What criteria did we use to evaluate the project’s potential effects on the acoustical environment?21 How did we perform the traffic noise study?.....................................................................................23
Traffic Noise Prediction..............................................................................................................23 Analysis of Project Effects .........................................................................................................24 Noise Mitigation Analysis...........................................................................................................24
How did we analyze construction noise? .........................................................................................25
Existing Conditions ................................................................................27 What is the study area for the noise analysis? .................................................................................27 Where are the modeled noise receptor locations? ...........................................................................28 What are the modeled noise levels? ................................................................................................28
Potential Effects......................................................................................35 How will the project affect noise levels in the study area?................................................................35 How do the existing conditions, No Build, and Build Alternatives differ? ..........................................36 How will project construction temporarily affect noise levels? ..........................................................36 What are the noise sources during construction? ............................................................................37 What is the range of noise from construction equipment? ...............................................................38
Noise and Vibration Discipline Report
WSDOT I-405 Bellevue Nickel Improvement Project
ii Contents
Does the project have other effects that could be delayed or distant from the project? ...................38 Did we consider potential cumulative effects for the Build and No Build Alternatives? ..............39
Measures to Avoid or Minimize Project Effects ...................................41 How can we minimize effects from construction noise? ...................................................................41 How can we minimize effects from traffic noise?..............................................................................41
Traffic Management Measures ..................................................................................................42 Land Acquisition for Noise Buffers or Barriers ...........................................................................42 Realigning the Roadway............................................................................................................42 Noise Insulation of Buildings......................................................................................................43 Noise Barriers............................................................................................................................43
What is the determined mitigation? ..................................................................................................46
Vibration ..................................................................................................47 What is vibration?.............................................................................................................................47 Why do we analyze vibration?..........................................................................................................48 What are the potential effects of vibration? ......................................................................................48 How can we minimize the potential effects of vibration? ..................................................................48
References...............................................................................................49
Exhibits Exhibit 1. Project Vicinity Map................................................................................................................... 2
Exhibit 2. Proposed Bellevue Nickel Project Improvements (Sheet 1 of 3) ............................................... 5
Exhibit 3. Proposed Bellevue Nickel Project Improvements (Sheet 2 of 3) ............................................... 6
Exhibit 4. Proposed Bellevue Nickel Project Improvements (Sheet 3 of 3) ............................................... 7
Exhibit 5. Proposed Wetland Mitigation Area .......................................................................................... 11
Exhibit 6. Conceptual Stream Mitigation Plan ......................................................................................... 12
Exhibit 7. Typical Noise Levels................................................................................................................ 17
Exhibit 8. Noise Wall Effectiveness ......................................................................................................... 19
Exhibit 9. FHWA Noise Abatement Criteria............................................................................................. 22
Exhibit 10. Maximum Permissible Environmental Noise Levels................................................................ 22
Exhibit 11. Modeled Receptor Noise Levels and Locations (Sheet 1 of 6) ............................................... 29
Exhibit 12. Modeled Receptor Noise Levels and Locations (Sheet 2 of 6) ............................................... 30
Noise and Vibration Discipline Report
WSDOT I-405 Bellevue Nickel Improvement Project
Contents iii
Exhibit 13. Modeled Receptor Noise Levels and Locations (Sheet 3 of 6) ............................................... 31
Exhibit 14. Modeled Receptor Noise Levels and Locations (Sheet 4 of 6) ............................................... 32
Exhibit 15. Modeled Receptor Noise Levels and Locations (Sheet 5 of 6) .............................................. 33
Exhibit 16. Modeled Receptor Noise Levels and Locations (Sheet 6 of 6) ............................................... 34
Exhibit 17. Typical Construction Noise Levels .......................................................................................... 38
Exhibit 18. Location of Noise Barrier N1 ................................................................................................... 43
Exhibit 19. Allowed Area and Cost for Noise Barrier N1 ........................................................................... 44
Exhibit 20. Location of Upgrade Barrier U1............................................................................................... 44
Exhibit 21. Allowed Barrier Area for Noise Barrier U1............................................................................... 45
Appendices Appendix A. Avoidance and Minimization Measures
Appendix B. Noise Measurement and Model Validation Data
Appendix C. Noise Barrier Analysis
Noise and Vibration Discipline Report
WSDOT I-405 Bellevue Nickel Improvement Project
iv Glossary
Glossary A-weight A standard frequency weighting that simulates how humans perceive sound.
ambient noise The all-encompassing noise associated with a given environment (usually a composite of sounds from many sources near and far).
best management practice (BMP)
BMPs are generally accepted techniques that, when used alone or in combination, prevent or reduce adverse effects of a project. Examples include erosion control measures and construction management to minimize traffic disruption. Please see Appendix A for a complete list of BMPs.
calibration Adjustment of the noise measurement system so the measured sound level agrees with a reference sound source.
decibel (dB) Sound levels are expressed on a logarithmic scale in units called decibels (dB), which is ten times the base 10 logarithm of sound pressure divided by the reference sound pressure of 20 microPascals.
duration Length of time of the noise event.
equivalent sound level (Leq) The equivalent sound level is widely used to describe environmental noise. It is a measure of the average sound energy during a specified period of time.
hertz (Hz) A unit of frequency measured in cycles per second.
Lmax Maximum sound level, in decibels. This is the maximum value of the noise level that occurs during a single event.
Lmin Minimum sound level, in decibels. This is the minimum value of the noise level that occurs during a single event.
Ln The A-weighted sound level, in decibels, that is exceeded n percent of the time in a given interval of time. For example, L10 is the A-weighted sound level exceeded 10 percent of the time over the given interval (usually 1 hour). The default Ln percentages are 10, 30, 50, 70, and 90. L00 is the same as the maximum sound level because it is the level exceeded 0 percent of the time.
logarithm Also abbreviated to “log,” the log is the exponent that indicates the power to which a number must be raised to produce a given number. For example: if B2 = N, then 2 is the logarithm of N to the base B. Typically, 10 is used as the logarithmic base in other words, 102 = 100, therefore the logarithm of 100 to the base 10 = 2. The logarithm scale gives the logarithm of a quantity instead of the quantity itself. This is used for quantities that have a huge range of values.
peak The maximum sound level during a given time interval when the normal frequency and time weighting is not used. The noise measurement instrument has a peak detector that responds rapidly to changing sound levels, unlike the normal time weighting of the instrument.
sound exposure (SE) The total sound energy of the actual sound during a given time interval. Unlike the Sound Exposure Level, it is not expressed in dB, but in units of Pascal squared-seconds.
Noise and Vibration Discipline Report
WSDOT I-405 Bellevue Nickel Improvement Project
Glossary v
Glossary sound exposure level (SEL) The level of a steady 1-second-long sound that contains the same energy as the actual
(unsteady) sound over the total measurement duration (elapsed time). It is expressed in decibels. Sound Exposure Level is related to Leq but all the energy is squeezed into a 1-second period as opposed to being spread over a stated period of time.
sound pressure level or noise level (SPL)
Sound pressure level, in decibels, is an A-weighted sound pressure level. The A-weighting characteristic modifies the frequency response of the measuring instrument to account approximately for the frequency characteristics of the human ear. The reference pressure is 20 micro-newtons/square meter (2 x 10⁻⁴ microbar).
unmet demand Additional traffic not served by the existing roadway capacity.
VdB The vibration velocity level is reported in decibels relative to a level of 1x10⁻⁶ inches per second and denoted “VdB.”
vibration An oscillatory motion, which can be described in terms of displacement, velocity, or acceleration.
Noise and Vibration Discipline Report
WSDOT I-405 Bellevue Nickel Improvement Project
vi Acronyms and Abbreviations
Acronyms and Abbreviations BMPs best management practices
BNSF Burlington Northern Santa Fe Railroad
CAD computer aided drafting
dB decibels
dBA A-weighted decibels
DOT Department of Transportation
EA environmental assessment
Ecology Washington State Department of Ecology
EDNA Environmental Designation for Noise Abatement
EIS environmental impact statement
EPA (U.S.) Environmental Protection Agency
FEIS final environmental impact statement
FHWA Federal Highway Administration
FTA Federal Transit Administration
HOV high-occupancy vehicle
Hz Hertz
I-405 Interstate 405
I-90 Interstate 90
Leq equivalent A-weighted sound level
Leq(h) equivalent A-weighted sound level averaged hourly
Lmax maximum sound level during a period of time
Lmin minimum sound level during a period of time
Ln n represents the percentage of time the sound level is exceeded
NAC noise abatement criteria
NB northbound
Noise and Vibration Discipline Report
WSDOT I-405 Bellevue Nickel Improvement Project
Acronyms and Abbreviations vii
Acronyms and Abbreviations NEPA National Environmental Policy Act
RE residential equivalency
ROD record of decision
SB southbound
SE southeast
SEL sound exposure level
SR state route
TNM traffic noise model
USDOT U.S. Department of Transportation
WAC Washington Administrative Code
WSDOT Washington State Department of Transportation

Introduction 1
Introduction In 1998, the Washington State Department of Transportation (WSDOT) joined with the Federal Highway Administration (FHWA), the Federal Transit Administration (FTA), Central Puget Sound Regional Transit Authority (Sound Transit), King County, and local governments in an effort to reduce traffic congestion and improve mobility in the Interstate 405 (I-405) corridor. In fall 2002, the combined efforts of these entities culminated in the I-405 Corridor Program Final Environmental Impact Statement (EIS) and FHWA Record of Decision (ROD).
The ROD selected a project alternative that would widen I-405 by as many as two lanes in each direction throughout its 30-mile length. The ultimate configuration of the selected alternative includes buffers separating general-purpose lanes from parallel high-occupancy vehicle (HOV) lanes (potentially used by future high-capacity transit). The design also allows for expanded “managed lane” operations along I-405 that could include use of HOV lanes by other user groups, such as trucks.
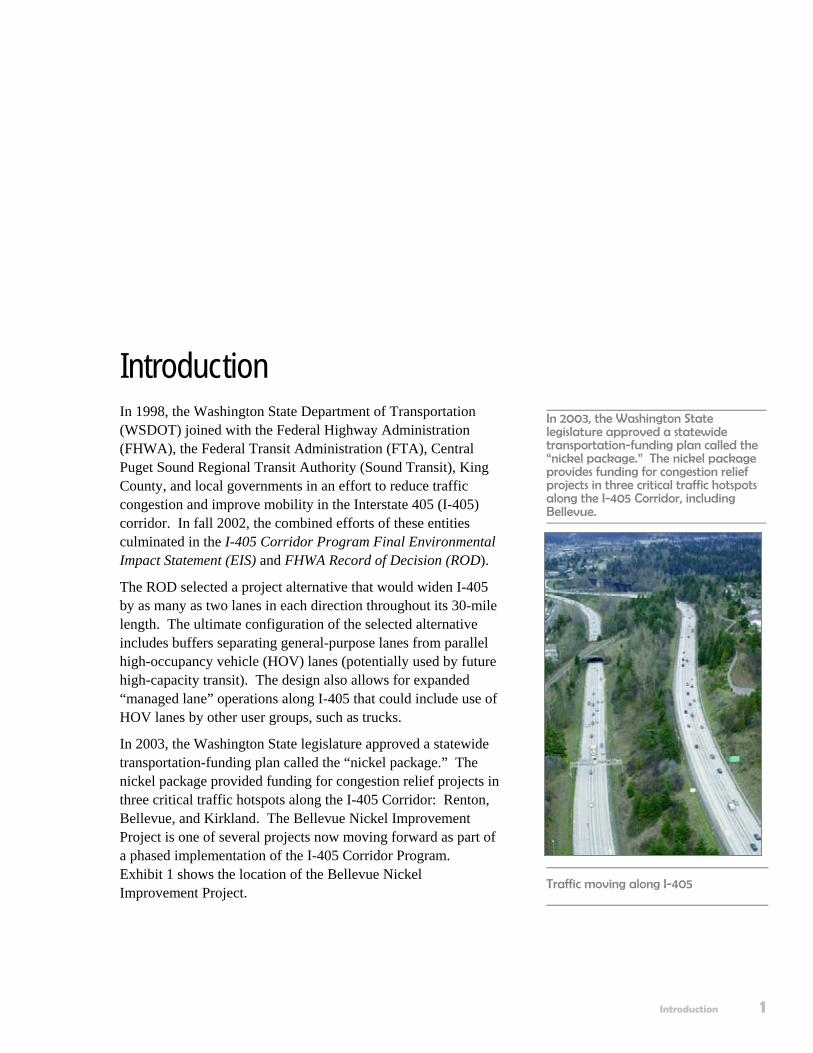
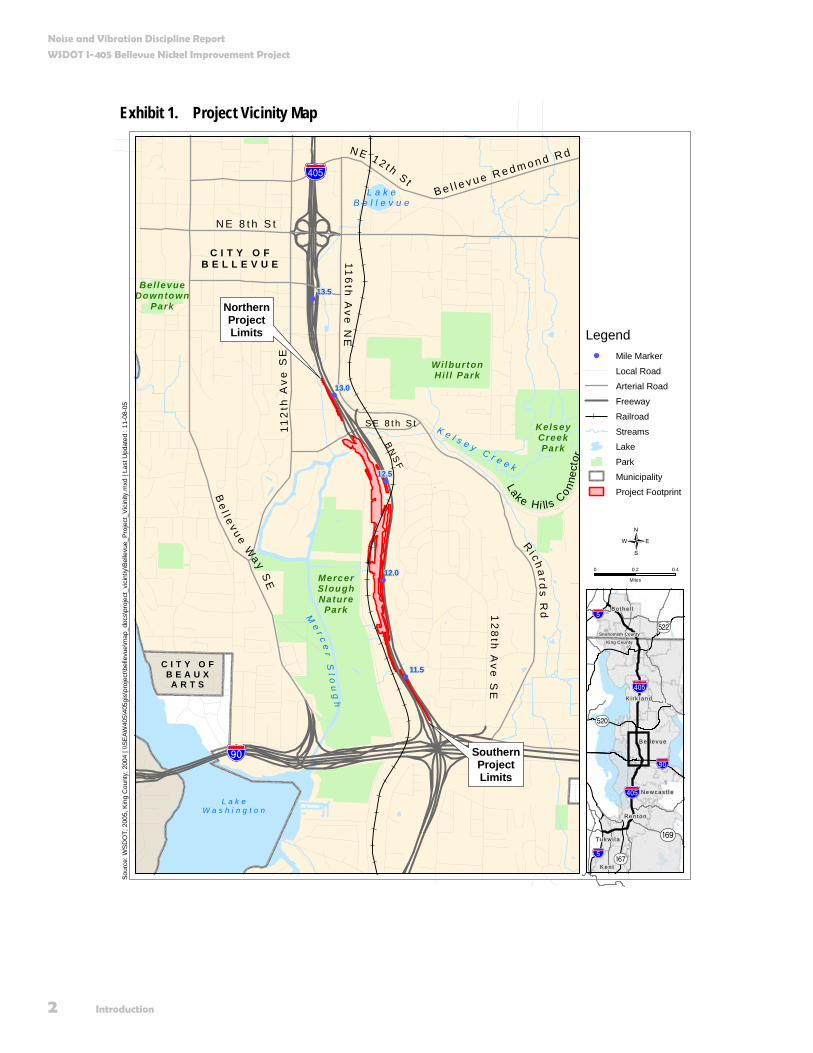
In 2003, the Washington State legislature approved a statewide transportation-funding plan called the “nickel package.” The nickel package provided funding for congestion relief projects in three critical traffic hotspots along the I-405 Corridor: Renton, Bellevue, and Kirkland. The Bellevue Nickel Improvement Project is one of several projects now moving forward as part of a phased implementation of the I-405 Corridor Program. Exhibit 1 shows the location of the Bellevue Nickel Improvement Project.
In 2003, the Washington State legislature approved a statewide transportation-funding plan called the “nickel package.” The nickel package provides funding for congestion relief projects in three critical traffic hotspots along the I-405 Corridor, including Bellevue.
Traffic moving along I-405
Noise and Vibration Discipline Report
WSDOT I-405 Bellevue Nickel Improvement Project
2 Introduction
Exhibit 1. Project Vicinity Map
!
!
!
!
!
Me
r ce
r Sl o
ug
h
L a k eB e l l e v u e
WilburtonHil l Park
KelseyCreekPark
MercerSloughNature
Park
Bel levueDowntown
Park
Be
l l e v u e Wa y S
E
Ri c h a
rds R
d12
8th
Ave
SE
112
th A
ve
SE
S E 8 t h S t
116
th A
ve N
E
N E 8 t h S t
N E 1 2 t h S t
BN
SF
K e l s e y C r e e k
13.0
12.0
13.5
12.5
11.5
!"b$
%&e(
SouthernProjectLimits
NorthernProjectLimits
Lake Hi ll s C
onnec
tor
L a k eW a s h i n g t o n
C I T Y O FB E A U X
A R T S
C I T Y O FB E L L E V U E
B e l l e v u e R e d m o n d R d
Sour
ce: W
SD
OT;
200
5, K
ing
Cou
nty;
200
4 | \
\SEA
W40
5\40
5gis
\pro
ject
\bel
levu
e\m
ap_d
ocs\
proj
ect_
vici
ntiy
\Bel
levu
e_P
roje
ct_V
icin
ity.m
xd |
Last
Upd
ated
: 11
-08-
05
Legend! Mile Marker
Local Road
Arterial Road
Freeway
Railroad
Streams
Lake
Park
Municipality
Project Footprint
0 0.2 0.4
Miles
{
AÊ
AÉ
!"b$
Aæ
%&e(
%&e(
!"̀$
!"̀$
Ne w c a s t l e
Snohomish County
King County
Aç
B e l l e v ue
Re n t o n
K e n t
B o t h e l l
K i r k l an d
T uk w i l a
Noise and Vibration Discipline Report
WSDOT I-405 Bellevue Nickel Improvement Project
Introduction 3
In keeping with the direction established in the Final EIS (FEIS) and ROD, we are preparing a National Environmental Policy Act (NEPA) Environmental Assessment (EA) that focuses on project-level effects of constructing and operating the Bellevue Nickel Improvement Project.
We will base the EA on the analysis in the I-405 Corridor Program Final EIS, and will describe any new or additional project changes, information, effects, or mitigation measures not identified and analyzed in the corridor-level FEIS. The project-level EA for the Bellevue Nickel Improvement Project will not reexamine the corridor-level alternatives, impacts, and mitigation measures presented in the corridor-level FEIS, or the decisions described in the ROD.
What alternatives do we analyze in this discipline report? This discipline report is one of 19 environmental elements WSDOT will study to analyze the effects of the Bellevue Nickel Improvement Project. All of the discipline reports will analyze one build alternative and one “no build” or “no action” alternative. This approach is consistent with FHWA’s guidelines for preparing a NEPA EA.
What is the No Build Alternative? NEPA requires us to include and evaluate the No Build Alternative in this discipline report. We use this approach to establish an existing and future baseline for comparing the effects associated with the Build Alternative. We assume the No Build Alternative will maintain the status quo: only routine activities such as road maintenance, repair, and safety improvements would occur within the corridor between now and 2030. The No Build Alternative does not include improvements that would increase roadway capacity or reduce congestion on I-405. We describe these improvements further in the Bellevue Nickel Improvement Project Traffic and Transportation Discipline Report.
What are the principal features of the Build Alternative? The Bellevue Nickel Improvement Project will add one new general-purpose lane in each direction along a 2-mile section of I–405 between I-90 and SE 8th Street. We will generally use the
We assume the No Build Alternative will maintain the status quo: only routine activities such as road maintenance, repair, and safety improvements would occur within the corridor between now and 2030.
The Environmental Assessment will describe new project changes, information, effects, or mitigation measures, but the assessment will not revisit the alternatives, impacts, and mitigation measures evaluated in the corridor-level EIS or the decisions documented in the Record of Decision.
Noise and Vibration Discipline Report
WSDOT I-405 Bellevue Nickel Improvement Project
4 Introduction
inside or “median” side of I-405 for construction. After we re-stripe the highway, the new lanes will occupy the outside of the existing roadway. The project also includes new stormwater management facilities and better drainage structures and systems.
Other project activities include developing off-site wetland mitigation as well as on-site stream mitigation areas to compensate for the loss of these resources within the project area. We expect project construction to begin in spring 2007 and the improved roadway to be open to traffic by fall 2009.
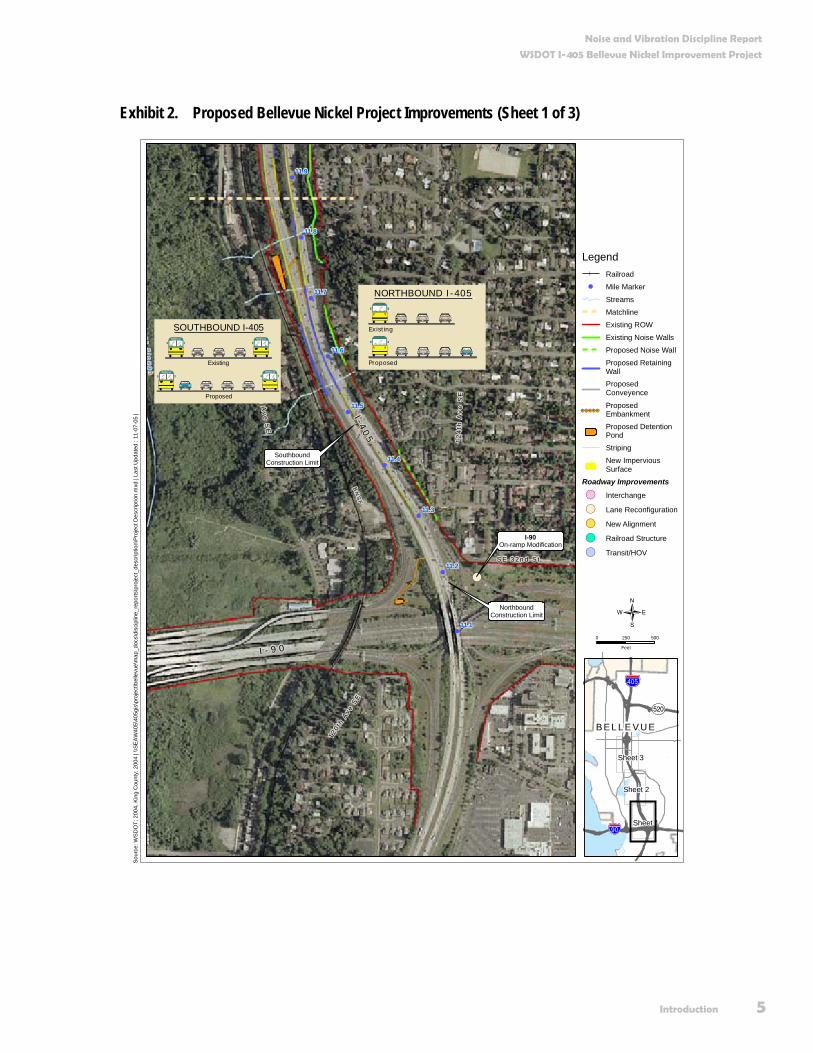
Improvements to Southbound I-405 In the southbound (SB) direction, we plan to add one new travel lane from approximately Southeast (SE) 8th Street to I-90 (Exhibits 2, 3, and 4). In addition, the existing outside HOV lane at I-90 will be extended north so that it begins at the on-ramp from SE 8th Street. In order to add these lanes and maintain traffic flow during construction, we will shift approximately 3,000 feet of the SB roadway as much as 200 feet east into the existing median. The relocated SB roadway will connect to the existing SB travel lanes just north of the I-90 interchange, and south of the existing bridge over SE 8th Street.
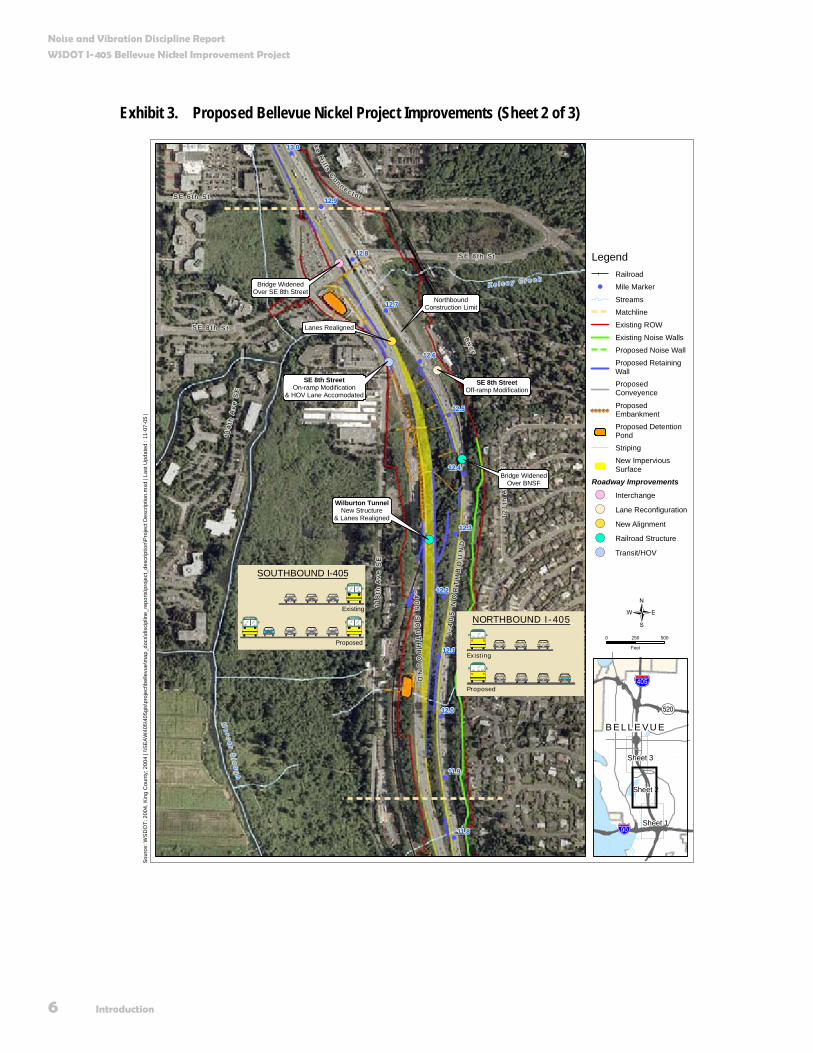
We will build a new tunnel underneath the Burlington Northern Santa Fe (BNSF) railroad, just east of the existing Wilburton Tunnel, to accommodate the relocated and widened SB roadway. The existing tunnel does not have the capacity to accommodate additional lanes of SB traffic.
The existing SB travel lanes and the Wilburton Tunnel will remain open to traffic during construction of the new tunnel and the relocated/widened SB lanes. We will also build the new tunnel wide enough to accommodate additional lanes. The existing tunnel will remain after we complete the improvements.
We will add one lane in the southbound direction of I-405 from approximately SE 8th Street to I-90.
Noise and Vibration Discipline Report
WSDOT I-405 Bellevue Nickel Improvement Project
Introduction 5
Exhibit 2. Proposed Bellevue Nickel Project Improvements (Sheet 1 of 3)
!(!
!
!
!
!
!
!
!
!
ce
rS
l ou
gh
12
4t h
Ave
SE
118
t h A
ve S
E
BN
SF
S E 3 2 n d S t
120 t
h A
ve S
E
I - 9 0
I - 40
5
I-90On-ramp Modification
NorthboundConstruction Limit
SouthboundConstruction Limit
11.9
11.8
11.7
11.6
11.5
11.4
11.3
11.1
11.2
SOUTHBOUND I-405
Existing
Proposed
Bellevue
Bellevue
Bellevue
Bellevue
NORTHBOUND I-405
Existing
Proposed
Sour
ce: W
SD
OT;
200
4, K
ing
Cou
nty;
200
4 | \
\SE
AW
405\
405g
is\p
roje
ct\b
elle
vue\
map
_doc
s\di
scip
line_
repo
rts\p
roje
ct_d
escr
iptio
n\Pr
ojec
t Des
crip
tion.
mxd
| La
st U
pdat
ed :
11-0
7-05
|
LegendRailroad
! Mile Marker
Streams
Matchline
Existing ROW
Existing Noise Walls
Proposed Noise Wall
Proposed RetainingWallProposedConveyence
ProposedEmbankmentProposed DetentionPond
Striping
New ImperviousSurface
Roadway Improvements
!( Interchange
!( Lane Reconfiguration
!( New Alignment
!( Railroad Structure
!( Transit/HOV
0 250 500
Feet
{
B E L L E V U EAÉ
!"b$
%&e(
Sheet 1
Sheet 2
Sheet 3
Noise and Vibration Discipline Report
WSDOT I-405 Bellevue Nickel Improvement Project
6 Introduction
Exhibit 3. Proposed Bellevue Nickel Project Improvements (Sheet 2 of 3)
!(
!(
!(
!(
!(!(
!
!
!
!
!
!
!
!
!
!
!
!
!
I -4
05
NO
RT
HB
OU
ND
BN
SF
I-40
5 S
OU
TH
BO
UN
D
S E 8 t h S t
118
th A
ve
SE
12
1th
Ave
SE
114
t h A
v e S
E
Me
r ce
r Sl o
ug
h
S E 8 t h S t
K e l s e y C r e e k
k e H
i l l s Co n n e c t o rS E 6 t h S t
Wilburton TunnelNew Structure
& Lanes Realigned
Bridge WidenedOver BNSF
SE 8th StreetOff-ramp Modification
SE 8th StreetOn-ramp Modification
& HOV Lane Accomodated
Lanes Realigned
Bridge WidenedOver SE 8th Street
NorthboundConstruction Limit
12.0
13.0
12.4
12.3
12.2
12.1
11.9
11.8
12.5
12.6
12.7
12.8
12.9
NORTHBOUND I-405
Existing
Proposed
SOUTHBOUND I-405
Existing
Proposed
Bellevue
BellevueBellevue
Sou
rce:
WS
DO
T; 2
004,
Kin
g C
ount
y; 2
004
| \\S
EA
W40
5\40
5gis
\pro
ject
\bel
levu
e\m
ap_d
ocs\
disc
iplin
e_re
ports
\pro
ject
_des
crip
tion\
Pro
ject
Des
crip
tion.
mxd
| La
st U
pdat
ed :
11-0
7-05
|
LegendRailroad
! Mile Marker
Streams
Matchline
Existing ROW
Existing Noise Walls
Proposed Noise Wall
Proposed RetainingWallProposedConveyence
ProposedEmbankmentProposed DetentionPond
Striping
New ImperviousSurface
Roadway Improvements
!( Interchange
!( Lane Reconfiguration
!( New Alignment
!( Railroad Structure
!( Transit/HOV
0 250 500
Feet
{
B E L L E V U EAÉ
!"b$
%&e(
Sheet 1
Sheet 2
Sheet 3
Noise and Vibration Discipline Report
WSDOT I-405 Bellevue Nickel Improvement Project
Introduction 7
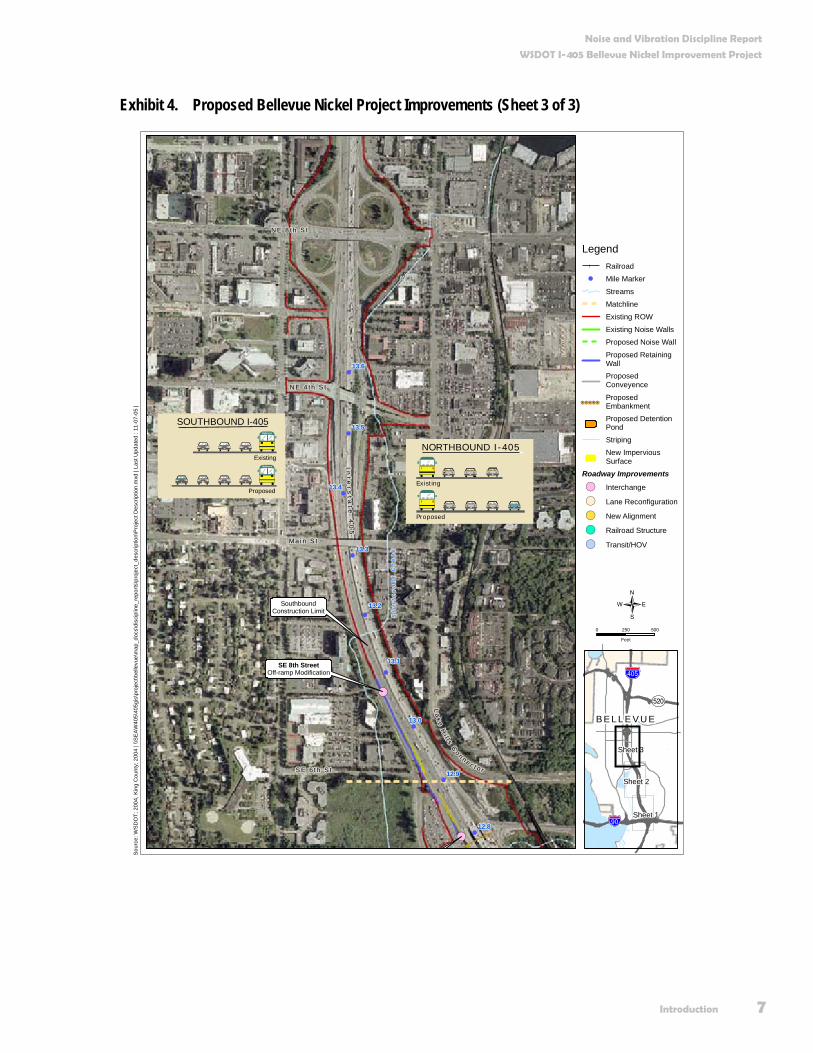
Exhibit 4. Proposed Bellevue Nickel Project Improvements (Sheet 3 of 3)
!(
!(
!
!
!
!
!
!
!
!
!
116
th A
ve
NE
N E 8 t h S t
112
th A
ve
NE
N E 4 t h S t
BN
SF
Ma i n S t
110
th A
ve
NE
La
k e Hi l l s C
o n n e c t o r
Int e
r st a
t e 4
05
Stu
rte
va
nt
Cr
ee
k
S E 6 t h S t
SE 8th StreetOff-ramp Modification
SouthboundConstruction Limit
13.0
12.8
12.9
13.3
13.4
13.5
13.6
13.2
13.1
NORTHBOUND I-405
Existing
Proposed
SOUTHBOUND I-405
Existing
Proposed
Bellevue
Bellevue
Sou
rce:
WS
DO
T; 2
004,
Kin
g C
ount
y; 2
004
| \\S
EA
W40
5\40
5gis
\pro
ject
\bel
levu
e\m
ap_d
ocs\
disc
iplin
e_re
ports
\pro
ject
_des
crip
tion\
Pro
ject
Des
crip
tion.
mxd
| La
st U
pdat
ed :
11-0
7-05
|
LegendRailroad
! Mile Marker
Streams
Matchline
Existing ROW
Existing Noise Walls
Proposed Noise Wall
Proposed RetainingWallProposedConveyence
ProposedEmbankmentProposed DetentionPond
Striping
New ImperviousSurface
Roadway Improvements
!( Interchange
!( Lane Reconfiguration
!( New Alignment
!( Railroad Structure
!( Transit/HOV
0 250 500
Feet
{
B E L L E V U EAÉ
!"b$
%&e(
Sheet 1
Sheet 2
Sheet 3
Noise and Vibration Discipline Report
WSDOT I-405 Bellevue Nickel Improvement Project
8 Introduction
We will also include the following improvements in the Build Alternative:
Modify the existing off-ramp at SE 8th Street to make room for an additional southbound lane on I-405. The off-ramp will then become a single-lane, optional off-ramp (i.e., the off-ramp will no longer be an “exit only” off-ramp).
Build a retaining wall between the SB travel lanes and the off-ramp at SE 8th Street.
Widen the existing bridge over SE 8th Street to the west to accommodate the new SB lane.
Modify the existing on-ramp at SE 8th Street to tie into the relocated SB general-purpose travel lanes.
Reconfigure the on-ramp at SE 8th Street to accommodate the extended outside HOV lane.
Temporarily shift the existing BNSF railroad track from its current alignment to allow for continuous railroad operation during construction of the new tunnel.
Construct retaining walls along the eastern edge of the relocated SB travel lanes.
Improvements to Northbound I-405 In the northbound (NB) direction, we plan to add one new travel lane from approximately I-90 to SE 8th Street (Exhibits 2, 3, and 4). We will add one new lane to the NB ramp from I-90. We will shift the NB lanes to allow all of the proposed widening to occur on the inside, or median side of the existing roadway.
Additional improvements include:
Re-stripe the westbound/eastbound I-90 on-ramp to NB I-405 resulting in one lane becoming two lanes in the NB direction.
Widen, shift, and re-stripe NB I-405 travel lanes north of I-90 to allow the westbound I-90 to NB I-405 on-ramp and the eastbound I-90 to NB I-405 on-ramp to enter I-405 without having to merge into a single lane.
Construct several retaining walls needed for road widening in locations that allow for existing and future widening of I-405.
We will add one lane in the northbound direction of I-405 from approximately I-90 to SE 8th Street. All widening of the northbound mainline will occur on the inside (median side) of the existing roadway.
Noise and Vibration Discipline Report
WSDOT I-405 Bellevue Nickel Improvement Project
Introduction 9
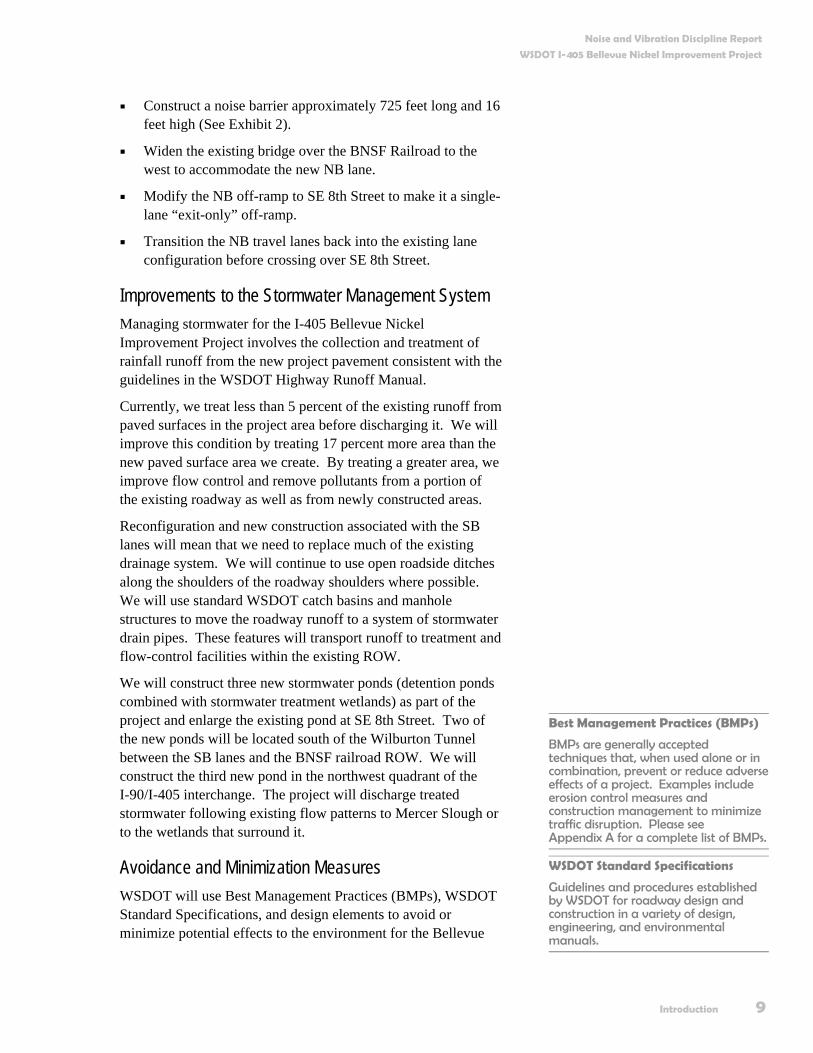
Construct a noise barrier approximately 725 feet long and 16 feet high (See Exhibit 2).
Widen the existing bridge over the BNSF Railroad to the west to accommodate the new NB lane.
Modify the NB off-ramp to SE 8th Street to make it a single-lane “exit-only” off-ramp.
Transition the NB travel lanes back into the existing lane configuration before crossing over SE 8th Street.
Improvements to the Stormwater Management System Managing stormwater for the I-405 Bellevue Nickel Improvement Project involves the collection and treatment of rainfall runoff from the new project pavement consistent with the guidelines in the WSDOT Highway Runoff Manual.
Currently, we treat less than 5 percent of the existing runoff from paved surfaces in the project area before discharging it. We will improve this condition by treating 17 percent more area than the new paved surface area we create. By treating a greater area, we improve flow control and remove pollutants from a portion of the existing roadway as well as from newly constructed areas.
Reconfiguration and new construction associated with the SB lanes will mean that we need to replace much of the existing drainage system. We will continue to use open roadside ditches along the shoulders of the roadway shoulders where possible. We will use standard WSDOT catch basins and manhole structures to move the roadway runoff to a system of stormwater drain pipes. These features will transport runoff to treatment and flow-control facilities within the existing ROW.
We will construct three new stormwater ponds (detention ponds combined with stormwater treatment wetlands) as part of the project and enlarge the existing pond at SE 8th Street. Two of the new ponds will be located south of the Wilburton Tunnel between the SB lanes and the BNSF railroad ROW. We will construct the third new pond in the northwest quadrant of the I-90/I-405 interchange. The project will discharge treated stormwater following existing flow patterns to Mercer Slough or to the wetlands that surround it.
Avoidance and Minimization Measures WSDOT will use Best Management Practices (BMPs), WSDOT Standard Specifications, and design elements to avoid or minimize potential effects to the environment for the Bellevue
Best Management Practices (BMPs)
BMPs are generally accepted techniques that, when used alone or in combination, prevent or reduce adverseeffects of a project. Examples include erosion control measures and construction management to minimize traffic disruption. Please see Appendix A for a complete list of BMPs.
WSDOT Standard Specifications
Guidelines and procedures established by WSDOT for roadway design and construction in a variety of design, engineering, and environmental manuals.
Noise and Vibration Discipline Report
WSDOT I-405 Bellevue Nickel Improvement Project
10 Introduction
Nickel Improvement Project. Collectively, these measures to avoid or minimize potential effects to the environment are known as “avoidance measures.” We describe these measures in more detail in an Appendix A. If the project has additional effects not addressed in the avoidance measures, we will address these measures through mitigation.
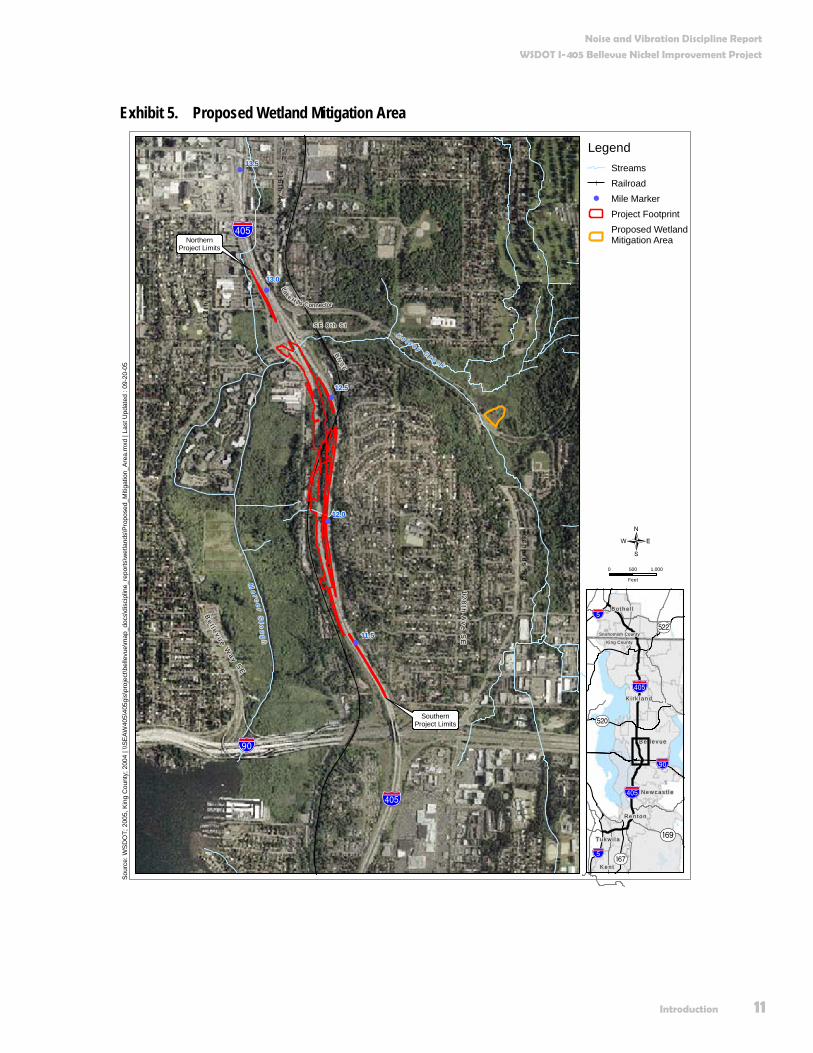
Wetland and Stream Mitigation Sites We will compensate for adverse effects to wetlands and their buffers by creating just over an acre of wetland within the boundaries of Kelsey Creek Park (Exhibit 5). The site is located north of the intersection of Richards Road and the Lake Hills Connector.
Our general concept will be to create an area that will transition from forested land beside the Lake Hills Connector to wetlands within Kelsey Creek Park. We will reshape the surface area to create favorable conditions for the necessary wetland aquatic characteristics, and we will replant and enhance habitat in the area by constructing habitats and replanting adjacent roadside areas with forest-type vegetation.
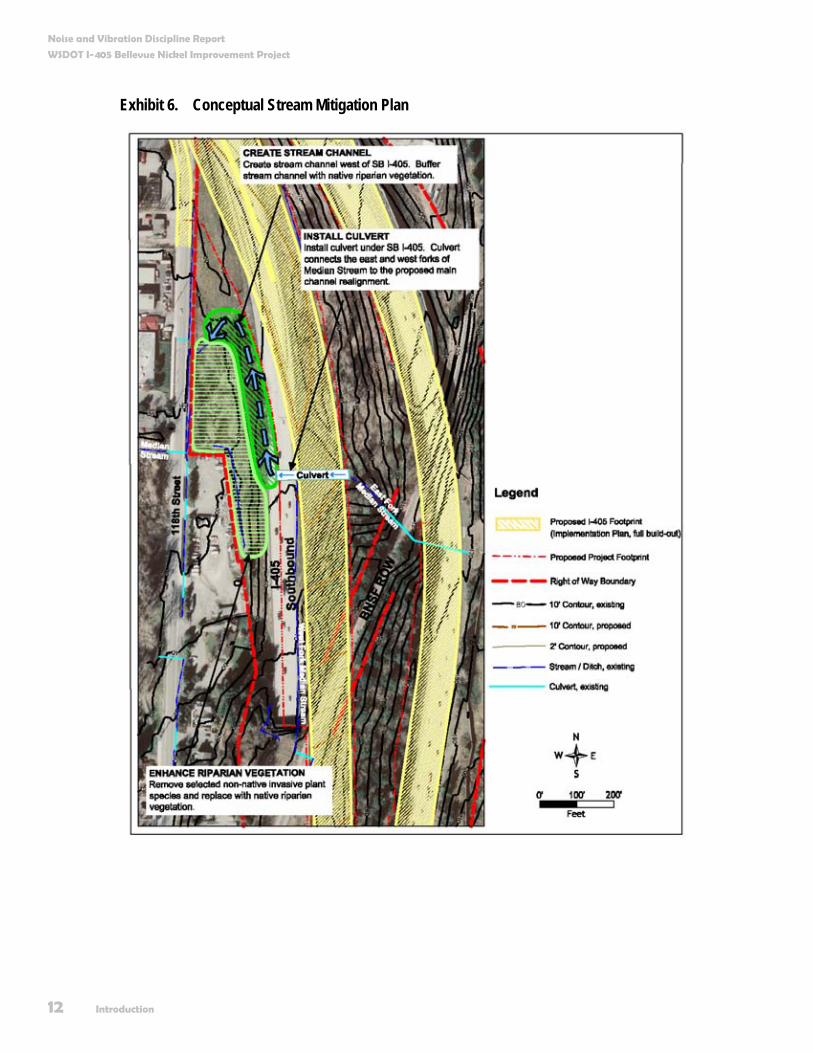
Similarly, we will compensate for unavoidable effects to “Median Stream,” the unnamed stream within the I-405 median. We have developed a conceptual stream mitigation plan that includes on-site habitat restoration and creation. The conceptual stream mitigation plan includes the following specific elements (See Exhibit 6):
Connect the new Median Stream culvert under I-90 to the existing channel and wetland located west of SB I-405.
Create approximately 500 linear feet of stream channel along the western slope of SB I-405.
Buffer the created stream channel with approximately 16,000 square feet of native streamside vegetation.
Enhance approximately 300 linear feet of riparian habitat west of SB I-405 by removing selected non-native invasive plant species and replacing with native streamside vegetation.
We provide more detailed information about mitigation efforts planned in conjunction with the Bellevue Nickel Improvement in the Surface Water, Water Quality, and Floodplains and Wetlands Discipline Reports.
Noise and Vibration Discipline Report
WSDOT I-405 Bellevue Nickel Improvement Project
Introduction 11
Exhibit 5. Proposed Wetland Mitigation Area
!
!
!
!
!
%&e(
Be l l e v u e W
ay SE
112
th A
ve S
E
S E 8 t h S t
BN
SF
!"b$
%&e(
13.5
13.0
12.5
12.0
11.5
K e l s e y C r e e k
Me
r ce
r Sl o
ug
h
12
8th
Ave
SE
Rich
ard
s Rd
116
th A
ve N
ELake H ills Connector
SouthernProject Limits
NorthernProject Limits
Sour
ce: W
SD
OT;
200
5, K
ing
Cou
nty;
200
4 | \
\SEA
W40
5\40
5gis
\pro
ject
\bel
levu
e\m
ap_d
ocs\
disc
iplin
e_re
ports
\wet
land
s\P
ropo
sed_
Miti
gatio
n_A
rea.
mxd
| La
st U
pdat
ed :
09-2
0-05
LegendStreamsRailroad
! Mile MarkerProject FootprintProposed WetlandMitigation Area
0 500 1,000
Feet
{
AÊ
AÉ
!"b$
Aæ
%&e(
%&e(
!"̀$
!"̀$
Ne w c a s t l e
Snohomish County
King County
Aç
B e l l e v ue
Re n t o n
K e n t
B o t h e l l
K i r k l an d
T uk w i l a
Noise and Vibration Discipline Report
WSDOT I-405 Bellevue Nickel Improvement Project
12 Introduction
Exhibit 6. Conceptual Stream Mitigation Plan
Noise and Vibration Discipline Report
WSDOT I-405 Bellevue Nickel Improvement Project
Introduction 13
Why do we consider noise as we plan this project? Sound is an element of daily life that is called noise when we perceive it as unpleasant, unwanted, or disturbingly loud. We consider the effects of noise to understand the potential effect of traffic and construction noise on public health and welfare.
The project entails building additional travel lanes on I-405 to reduce congestion and increase travel speeds. This noise analysis will determine if traffic noise effects would occur and if the project should include mitigation measures such as noise barriers to buffer noise-sensitive areas from the roadway.
What are the key points of this report? Approximately 20 residences located in the Bellevue Nickel Improvement Project study area currently experience noise levels that approach or exceed the traffic noise abatement criteria (NAC) of 67 dBA Leq. Of these 20 residences, four are exceeding the criteria because of noise sources other than I-405. The other noise sources include local traffic on Main Street, 112th Avenue SE, and 118th Avenue SE.
Under the No Build Alternative, we would expect noise levels to increase in 2030 by 0 to 2 dBA Leq. No new residence(s) would approach or exceed the NAC.
Under the Build Alternative, we expect noise levels to increase in 2030 by 0 to 3 dBA Leq. Without mitigation, 27 residences will approach or exceed the NAC. With the proposed mitigation, we can reduce the number of residences that will approach or exceed the NAC to 15.
Construction noise levels will result from heavy equipment including heavy trucks, excavators, and jackhammers.
Equivalent Sound Level (Leq)
The equivalent sound level (Leq) is widely used to describe environmental noise. It is a measure of the average sound energy during a specified period of time.

Noise Analysis Overview 15
Noise Analysis Overview This section discusses the definitions of sound and noise, sound level descriptors, what affects sound levels, project coordination, and the details of how we performed the traffic noise study.
What are sound and noise? Sound is created when objects vibrate, resulting in a very small variation in surrounding atmospheric pressure called sound pressure. The human response to sound depends on the magnitude of a sound as a function of its frequency and time pattern (EPA 1974). Magnitude is a measure of sound energy in the air. Noise is unwanted sound.
The range of magnitude, from the faintest to the loudest sound that the human ear can hear, is very large. For example, the sound pressure near an airport runway is approximately 1 million times greater than a soft whisper. To accommodate this range, we express sound levels on a logarithmic scale in units called decibels (dB).
Humans respond to a sound’s frequency or pitch. Frequency is measured in Hertz (Hz). The human ear can very effectively perceive sounds with a frequency between approximately 500 and 5,000 Hz. The ability of humans to perceive sounds decreases outside this range. Environmental sounds are composed of many frequencies, each occurring simultaneously at its own sound pressure level. An instrument called a sound level meter electronically applies frequency weighing, which combines the overall sound frequency into one sound level that simulates how a typical person hears sounds. The commonly
Logarithm Scale
Logarithm is the exponent that indicates the power to which a number must be raised to produce a given number. For example: if B2 = N, the 2 is the logarithm of N (to the base B), or 102 = 100 and the logarithm of 100 (to the base 10) = 2.
The logarithm scale gives the logarithm of a quantity instead of the quantity itself. This is used for quantities that have a huge range of values.
Noise and Vibration Discipline Report
WSDOT I-405 Bellevue Nickel Improvement Project
16 Noise Analysis Overview
used frequency weighting for environmental sounds is A-weighting (dBA), which is most similar to how humans perceive sounds of low to moderate magnitude.
Loudness, in contrast to sound level, refers to how people subjectively perceive a sound. This varies from person to person similarly. The human ear can barely perceive a 3-dBA increase, but a 5- or 6-dBA increase is readily noticeable and appears as if the sound is about one and one-half times as loud. A 10-dBA increase appears to be a doubling in sound level to most listeners.
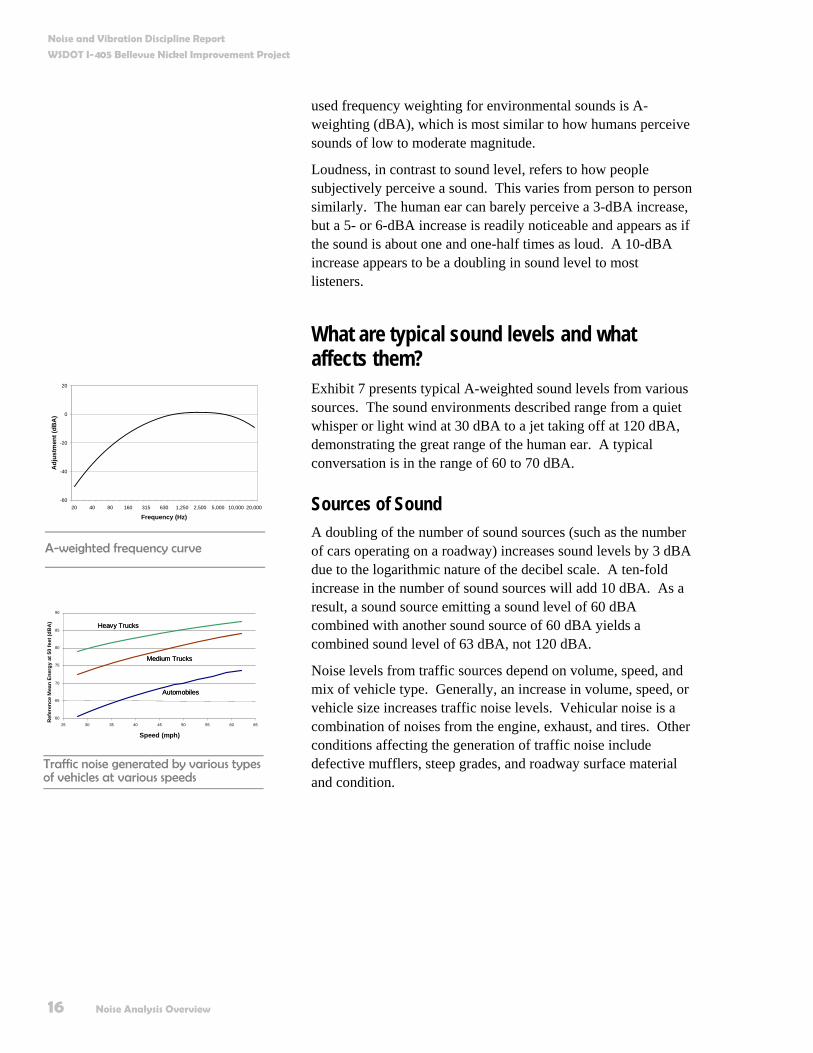
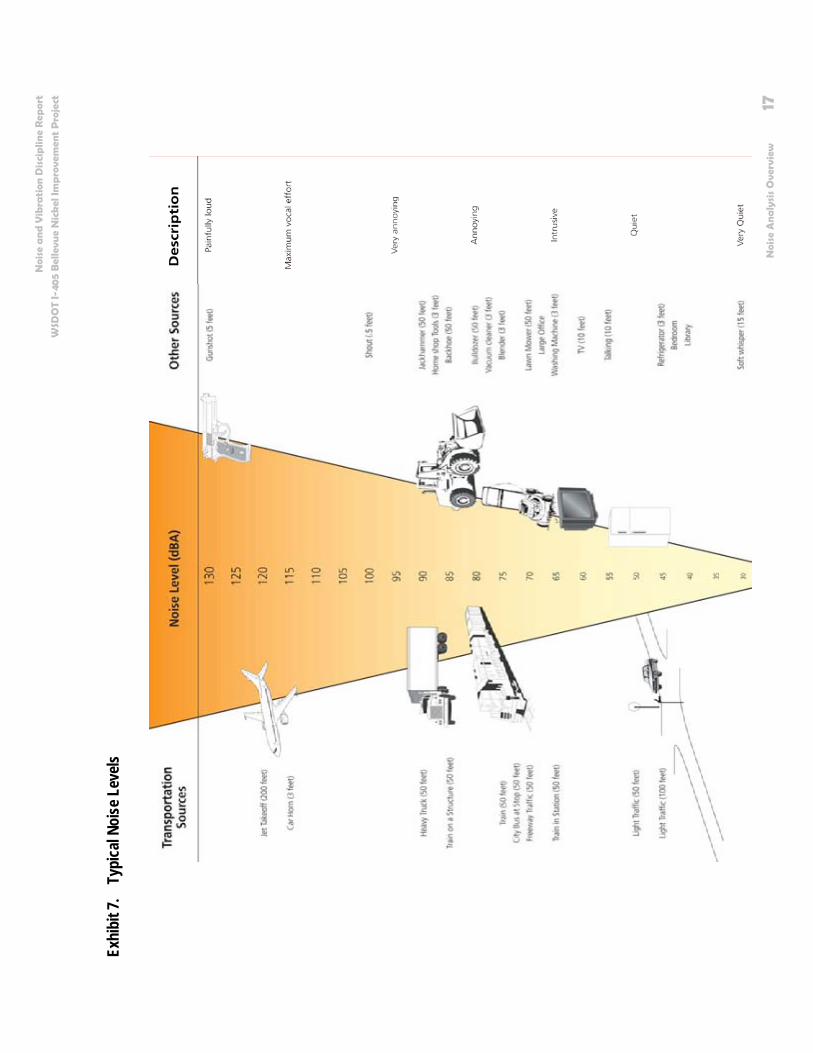
What are typical sound levels and what affects them? Exhibit 7 presents typical A-weighted sound levels from various sources. The sound environments described range from a quiet whisper or light wind at 30 dBA to a jet taking off at 120 dBA, demonstrating the great range of the human ear. A typical conversation is in the range of 60 to 70 dBA.
Sources of Sound A doubling of the number of sound sources (such as the number of cars operating on a roadway) increases sound levels by 3 dBA due to the logarithmic nature of the decibel scale. A ten-fold increase in the number of sound sources will add 10 dBA. As a result, a sound source emitting a sound level of 60 dBA combined with another sound source of 60 dBA yields a combined sound level of 63 dBA, not 120 dBA.
Noise levels from traffic sources depend on volume, speed, and mix of vehicle type. Generally, an increase in volume, speed, or vehicle size increases traffic noise levels. Vehicular noise is a combination of noises from the engine, exhaust, and tires. Other conditions affecting the generation of traffic noise include defective mufflers, steep grades, and roadway surface material and condition.
Traffic noise generated by various types of vehicles at various speeds
60 65 70 75 80 85 90
25 30 35 40 45 50 55 60 65 Speed (mph)
Ref
eren
ce M
ean
Ene
rgy
at 5
0 fe
et (d
BA
)
Automobiles
Medium Trucks
Heavy Trucks
Automobiles
Medium Trucks
Heavy Trucks
-60
-40
-20
0
20
20 40 80 160 315 630 1,250 2,500 5,000 10,000 20,000
Frequency (Hz)
Adj
ustm
ent (
dBA
)
A-weighted frequency curve
N
oise
an
d V
ibra
tion
Dis
cip
line
Rep
ort
W
SDO
T I-
405
Bel
levu
e N
ick
el Im
pro
vem
ent
Pro
ject
Noi
se A
naly
sis
Ove
rvie
w
17
Exhi
bit 7
. Ty
pica
l Noi
se L
evels
Noise and Vibration Discipline Report
WSDOT I-405 Bellevue Nickel Improvement Project
18 Noise Analysis Overview
The Effect of Distance Sound levels decrease with distance from the source. For a line source such as a roadway, sound levels decrease 3 dBA over hard ground (e.g., concrete or pavement) or 4.5 dBA over soft ground (e.g., grass) for every doubling of distance between the source and the receptor. For a point source such as construction sources, sound levels will decrease between 6 and 7.5 dBA for every doubling of distance from the source.
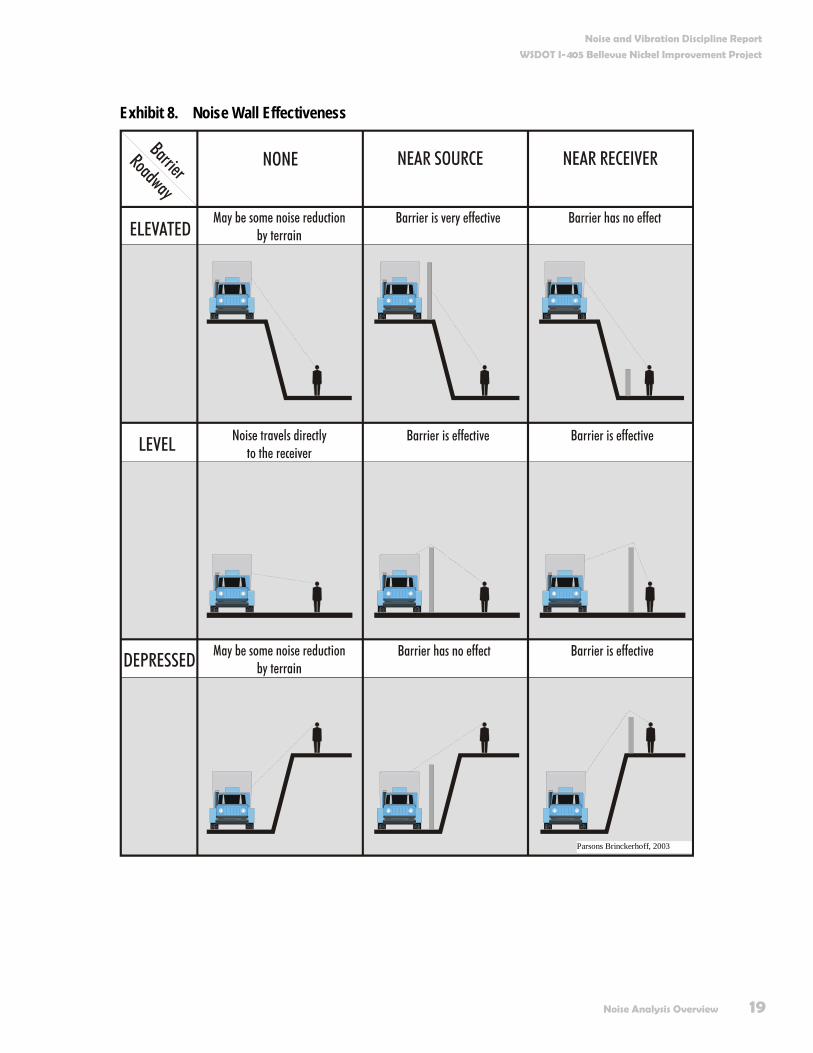
The Effect of Terrain and Shielding Terrain and the elevation of the receiver relative to the sound source can greatly affect how sound carries (Exhibit 8). Level ground is the simplest scenario: sound travels in a straight line-of-sight path between the source and receiver. As shown in the bottom row of Exhibit 8, sound levels may fall if the terrain crests between the source and receiver, resulting in a partial sound wall near the receiver; however, if the sound source is depressed or the receiver is elevated, sound will generally travel directly to the receiver.
If the sound source is elevated or the receiver is depressed, sound may be reduced at the receiver by the edge of the roadway. A wall can be effective at blocking sound transmission between the source and receiver (Exhibit 8, top row). Breaking the line-of-sight between the receiver and the highest elevation of sound source results in a noise reduction of approximately 5 dBA.
Terrain
Terrain is a term used to describe the features of the land.
Noise and Vibration Discipline Report
WSDOT I-405 Bellevue Nickel Improvement Project
Noise Analysis Overview 19
Exhibit 8. Noise Wall Effectiveness
Parsons Brinckerhoff, 2003
Noise and Vibration Discipline Report
WSDOT I-405 Bellevue Nickel Improvement Project
20 Noise Analysis Overview
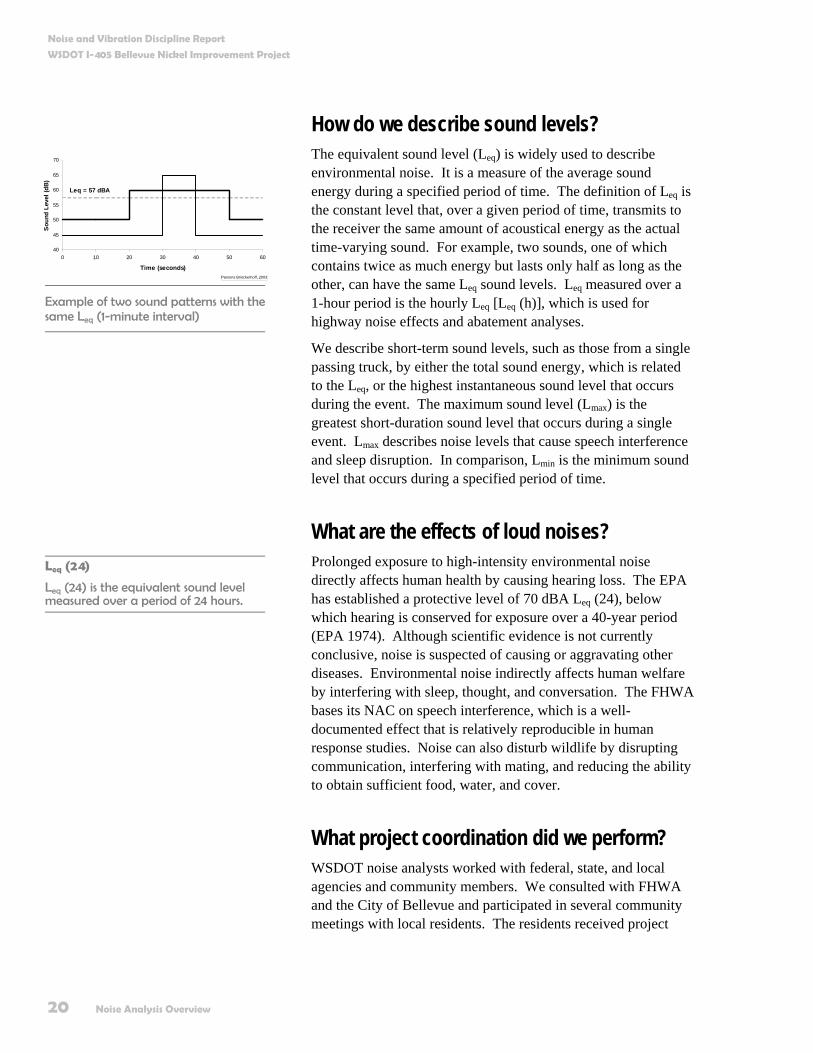
How do we describe sound levels? The equivalent sound level (Leq) is widely used to describe environmental noise. It is a measure of the average sound energy during a specified period of time. The definition of Leq is the constant level that, over a given period of time, transmits to the receiver the same amount of acoustical energy as the actual time-varying sound. For example, two sounds, one of which contains twice as much energy but lasts only half as long as the other, can have the same Leq sound levels. Leq measured over a 1-hour period is the hourly Leq [Leq (h)], which is used for highway noise effects and abatement analyses.
We describe short-term sound levels, such as those from a single passing truck, by either the total sound energy, which is related to the Leq, or the highest instantaneous sound level that occurs during the event. The maximum sound level (Lmax) is the greatest short-duration sound level that occurs during a single event. Lmax describes noise levels that cause speech interference and sleep disruption. In comparison, Lmin is the minimum sound level that occurs during a specified period of time.
What are the effects of loud noises? Prolonged exposure to high-intensity environmental noise directly affects human health by causing hearing loss. The EPA has established a protective level of 70 dBA Leq (24), below which hearing is conserved for exposure over a 40-year period (EPA 1974). Although scientific evidence is not currently conclusive, noise is suspected of causing or aggravating other diseases. Environmental noise indirectly affects human welfare by interfering with sleep, thought, and conversation. The FHWA bases its NAC on speech interference, which is a well-documented effect that is relatively reproducible in human response studies. Noise can also disturb wildlife by disrupting communication, interfering with mating, and reducing the ability to obtain sufficient food, water, and cover.
What project coordination did we perform? WSDOT noise analysts worked with federal, state, and local agencies and community members. We consulted with FHWA and the City of Bellevue and participated in several community meetings with local residents. The residents received project
Leq (24)
Leq (24) is the equivalent sound level measured over a period of 24 hours.
Example of two sound patterns with thesame Leq (1-minute interval)
40
45
50
55
60
65
70
0 10 20 30 40 50 60
Time (seconds)
Sou
nd L
evel
(dB
)
Leq = 57 dBA
Parsons Brinckerhoff, 2003

Noise and Vibration Discipline Report
WSDOT I-405 Bellevue Nickel Improvement Project
Noise Analysis Overview 21
information and provided input on the project and potential noise monitoring locations.
What criteria did we use to evaluate the project’s potential effects on the acoustical environment? Noise regulations and guidelines are the basis for evaluating potential noise effects. For state- and federally funded highway projects, traffic noise effects occur when predicted Leq (h) noise levels approach or exceed the NAC established by the FHWA, or substantially exceed existing noise levels (U.S. Department of Transportation 1982, Noise Abatement Council). Although FHWA does not define “substantially exceed,” WSDOT considers an increase of 10 dBA or more to be a substantial increase (WSDOT 1999).
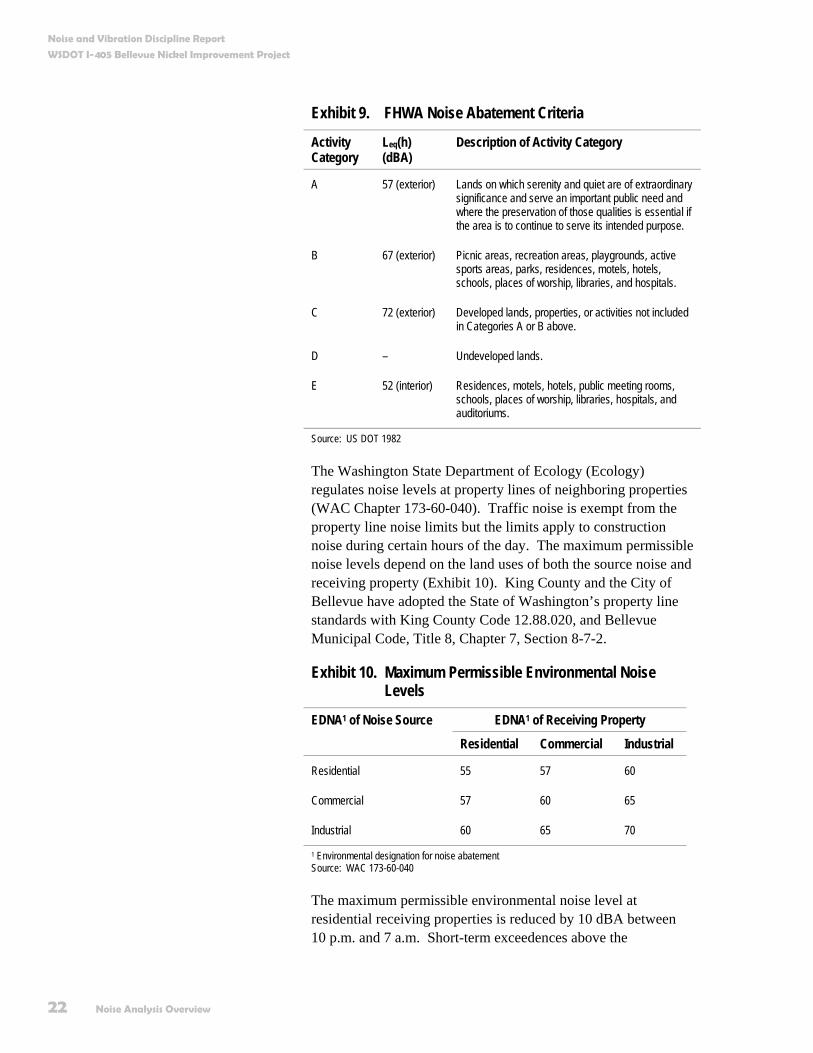
The FHWA noise abatement criteria specify exterior and interior Leq (h) noise levels for various land activity categories (Exhibit 9). WSDOT considers a noise effect to occur if predicted Leq (h) noise levels approach within 1 dBA of the NAC in Exhibit 9. Therefore, if a noise level is 66 dBA or higher, it will approach or exceed the FHWA noise abatement criterion of 67 dBA for outdoor use areas at ground level.
WSDOT defines severe traffic noise effects as levels that exceed 75 dBA outdoors in Category B areas or 60 dBA indoors at Category E uses. Severe noise effects also occur if predicted future noise levels exceed existing levels by 15 dBA or more at noise-sensitive locations as a result of the project.
Noise and Vibration Discipline Report
WSDOT I-405 Bellevue Nickel Improvement Project
22 Noise Analysis Overview
Exhibit 9. FHWA Noise Abatement Criteria
Activity Category
Leq(h) (dBA)
Description of Activity Category
A 57 (exterior) Lands on which serenity and quiet are of extraordinary significance and serve an important public need and where the preservation of those qualities is essential if the area is to continue to serve its intended purpose.
B 67 (exterior) Picnic areas, recreation areas, playgrounds, active sports areas, parks, residences, motels, hotels, schools, places of worship, libraries, and hospitals.
C 72 (exterior) Developed lands, properties, or activities not included in Categories A or B above.
D – Undeveloped lands.
E 52 (interior) Residences, motels, hotels, public meeting rooms, schools, places of worship, libraries, hospitals, and auditoriums.
Source: US DOT 1982
The Washington State Department of Ecology (Ecology) regulates noise levels at property lines of neighboring properties (WAC Chapter 173-60-040). Traffic noise is exempt from the property line noise limits but the limits apply to construction noise during certain hours of the day. The maximum permissible noise levels depend on the land uses of both the source noise and receiving property (Exhibit 10). King County and the City of Bellevue have adopted the State of Washington’s property line standards with King County Code 12.88.020, and Bellevue Municipal Code, Title 8, Chapter 7, Section 8-7-2.
Exhibit 10. Maximum Permissible Environmental Noise Levels
EDNA1 of Receiving Property EDNA1 of Noise Source
Residential Commercial Industrial
Residential 55 57 60
Commercial 57 60 65
Industrial 60 65 70
1 Environmental designation for noise abatement Source: WAC 173-60-040
The maximum permissible environmental noise level at residential receiving properties is reduced by 10 dBA between 10 p.m. and 7 a.m. Short-term exceedences above the
Noise and Vibration Discipline Report
WSDOT I-405 Bellevue Nickel Improvement Project
Noise Analysis Overview 23
permissible sound level are allowed. The maximum level may be exceeded by 5 dBA for a total of 15 minutes, by 10 dBA for a total of 5 minutes, or by 15 dBA for a total of 1.5 minutes during any 1-hour period.
Construction noise from projects within the State of Washington is exempt from Ecology property line regulations during daytime hours but must meet the regulations during nighttime hours (10 p.m. to 7 a.m. on weekdays and 10 p.m. to 8 a.m. on weekends). Construction activities during nighttime hours may require a noise variance from the City of Bellevue.
How did we perform the traffic noise study? We measured ambient noise levels for 15-minute periods at 36 locations near the study area to describe the existing noise environment, identify major noise sources in the study area, validate the noise model, and characterize the weekday background environmental noise levels. Appendix B includes results of the noise measurements. Measurement locations characterize the variety of noise conditions and represent other sensitive receptors near the proposed project. We modeled existing (year 2002) and future noise levels for the No Build Alternative (year 2030) and the Build Alternative (design year 2030) at all of the 15-minute noise measurement locations and at several additional locations that may potentially be affected by the project. The study evaluated 2002 as the existing year to be consistent with the transportation analysis for the Bellevue Nickel Improvement Project.
Traffic Noise Prediction We used the FHWA Traffic Noise Model (TNM) Version 2.5 computer model (FHWA 2005) to predict Leq (h) traffic noise levels. TNM provides precise estimates of noise levels at discrete points by considering interactions between different noise sources and topographical features. The model estimates the acoustic intensity at a receiver location calculated from a series of straight-line roadway segments. The noise emissions from each roadway segment are calculated based on the number of automobiles, medium trucks, and heavy trucks per hour; vehicular speed, and reference noise emission levels of an individual vehicle. TNM also considers effects of intervening walls, topography, trees, and atmospheric absorption.
Noise and Vibration Discipline Report
WSDOT I-405 Bellevue Nickel Improvement Project
24 Noise Analysis Overview
Analysis of Project Effects We based predicted noise levels on the loudest traffic hour of the day, when volumes are high but not congested in order to estimate worst-case noise levels. Existing peak-hour traffic analysis for the year 2002 indicates that the traffic volumes on this portion of I-405 are at capacity part of the day.
We expect that peak period congestion on I-405 in 2030 will increase substantially from existing levels and exceed the roadway’s capacity for both the Build and No Build Alternatives. The analysis indicates that the congestion increase will cause a substantial decrease in traffic speeds. Therefore, predicted peak-hour congested traffic volumes for I-405 in 2030 will likely decrease for both the Build and No Build Alternatives. For use in TNM, the No Build Alternative assumed the same traffic volume on I-405 as the existing conditions model during the loudest hour. The Build Alternative added 1,750 vehicles (the approximate capacity of a freeway lane) to existing loudest-hour traffic volumes on I-405 in areas where an extra lane will be built. For other roadways in the study area, we used predicted future traffic volumes. This approach ensures that the loudest traffic hour is represented in the model because small changes in vehicle speed have a greater effect on noise than small changes in traffic volume.
The model utilized the traffic volumes and vehicle mix (e.g., trucks, vehicles, and motorcycles) predicted in the Traffic and Transportation Discipline Report for this project. The modeled sites represented several receptors in the area, although noise levels at adjacent receptors may be different due to terrain or distance.
Noise Mitigation Analysis After analyzing the project effects, we then compared predicted noise levels to the FHWA NAC and counted the receptors affected by the Build Alternative. At receptors where modeled noise levels approached or exceeded the NAC, we evaluated mitigation measures to determine if the reduction in traffic noise will warrant the cost of barrier construction, using WSDOT reasonableness criteria. The Measures To Avoid or Minimize Project Effects section of this report provides a detailed discussion of WSDOT feasibility and reasonableness criteria. We evaluated noise barriers using TNM in areas where the analysis predicted noise effects as a result of this project.
NAC
Noise levels approach or exceed the noise abatement criteria (NAC) at 66 dBA.
Noise and Vibration Discipline Report
WSDOT I-405 Bellevue Nickel Improvement Project
Noise Analysis Overview 25
WSDOT noise specialists evaluated the effectiveness of noise barriers at the outermost boundary of the right of way to minimize the potential for future corridor roadway projects to require their removal or relocation. We compared the evaluated noise wall locations to the long-range corridor improvement implementation plan and changed the barrier locations to be consistent with the long-range plans wherever possible.
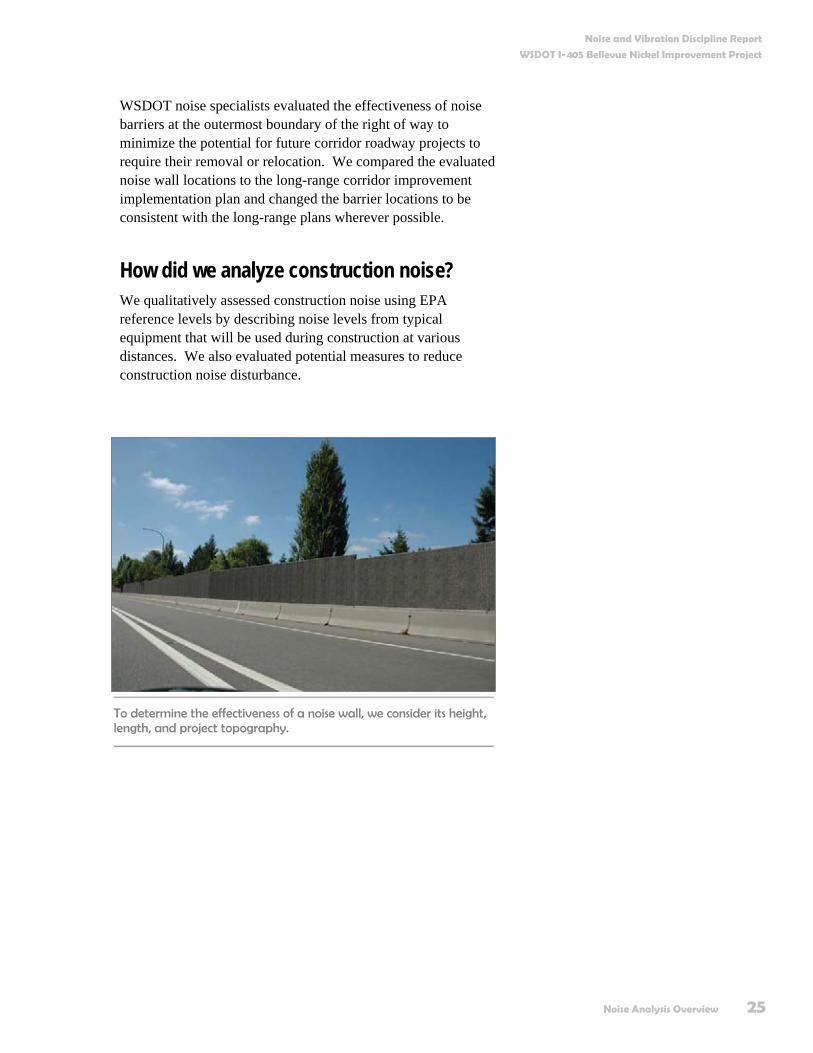
How did we analyze construction noise? We qualitatively assessed construction noise using EPA reference levels by describing noise levels from typical equipment that will be used during construction at various distances. We also evaluated potential measures to reduce construction noise disturbance.
To determine the effectiveness of a noise wall, we consider its height, length, and project topography.

Existing Conditions 27
Existing Conditions What is the study area for the noise analysis? The I-405 Bellevue Nickel Improvement Project extends from the vicinity of the I-405/I-90 interchange north to the I-405/NE 8th Street interchange. The study area for the noise analysis extends approximately 500 feet from roadway improvements associated with the project.
Land use varies in the study area and is primarily residential with pockets of multi-family, parkland, commercial, and industrial development. Terrain varies throughout the study area. Residences east and west of I-405 both fall below and rise above the elevation of I-405.
East of I-405 and north of the I-90 interchange, the Woodridge neighborhood is located well above the elevation of I-405 with a hillside shielding a portion of the I-405 traffic noise that some residences experience. Some residences receive additional shielding from existing noise barriers along the east side of I-405.
West of I-405 between I-90 and SE 8th Street, several multi-family residences have ground floor units that are below the elevation of I-405 with hillside shielding of a portion of the I-405 noise.
East of I-405, between SE 8th Street and Main Street, the closest residences are located between 500 and 1000 feet from I-405.
In the study area, existing noise barriers are located parallel to and east of I-405 between I-90 and SE 8th Street. Existing
Noise and Vibration Discipline Report
WSDOT I-405 Bellevue Nickel Improvement Project
28 Existing Conditions
retaining walls, limited jersey barriers, and topography shield some residential areas.
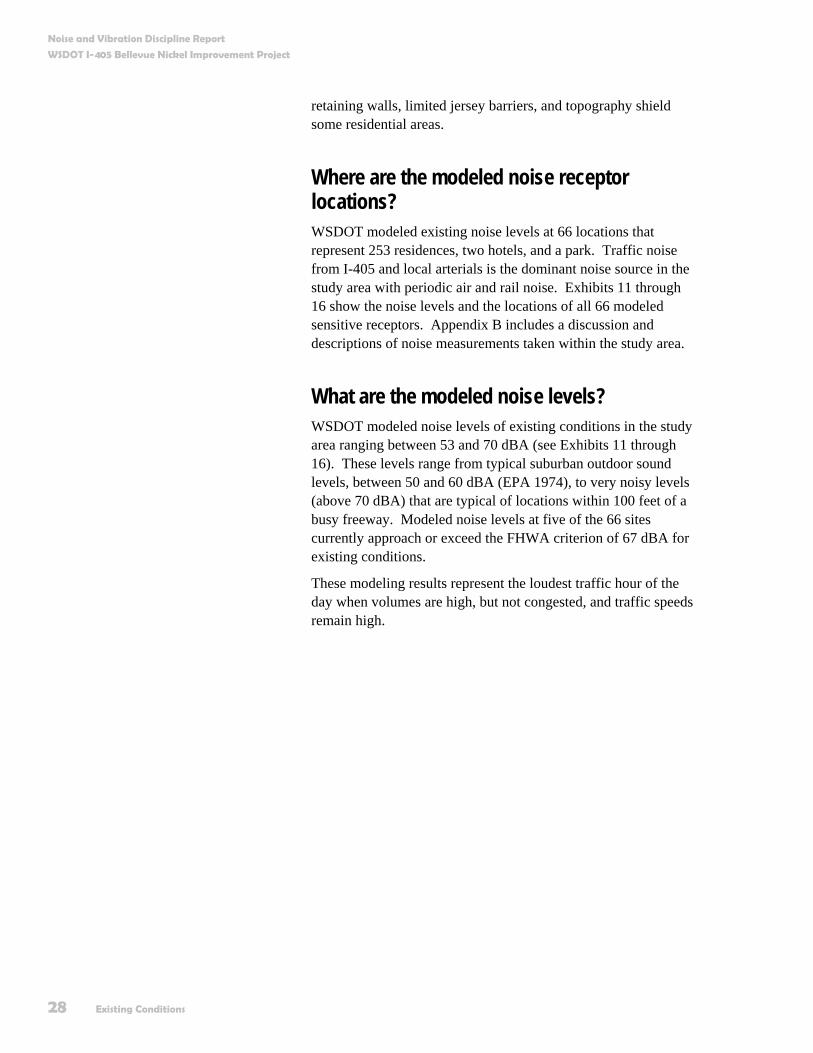
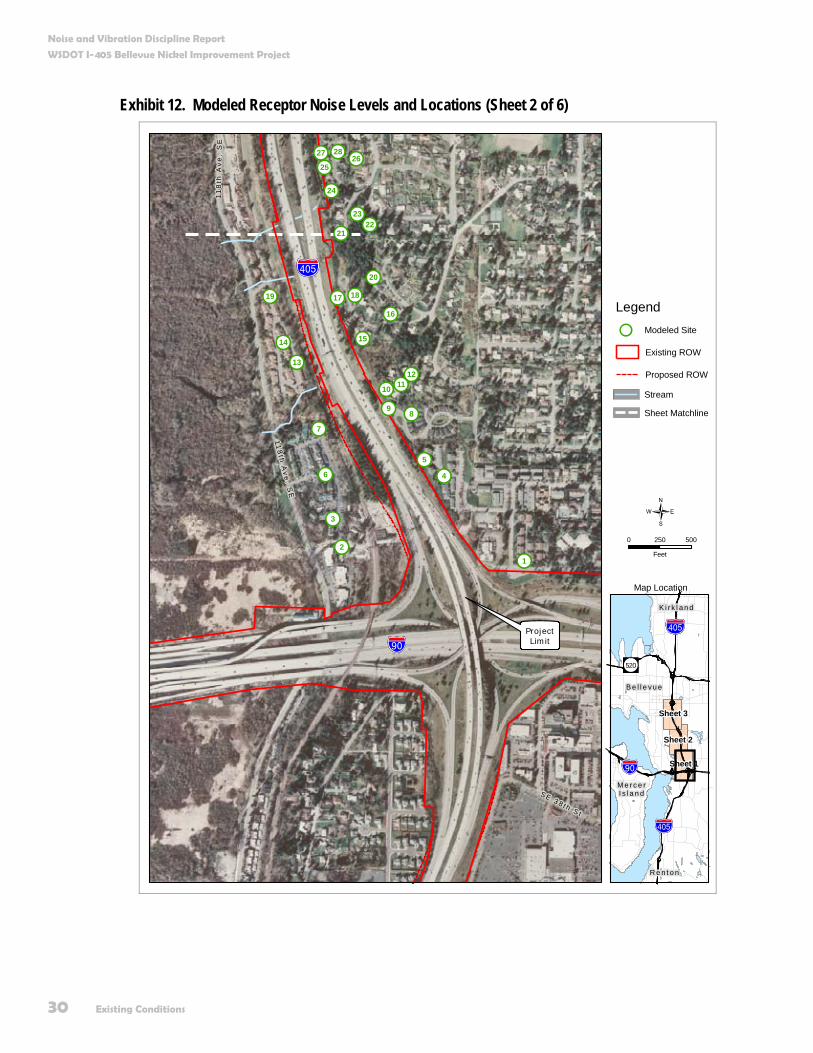
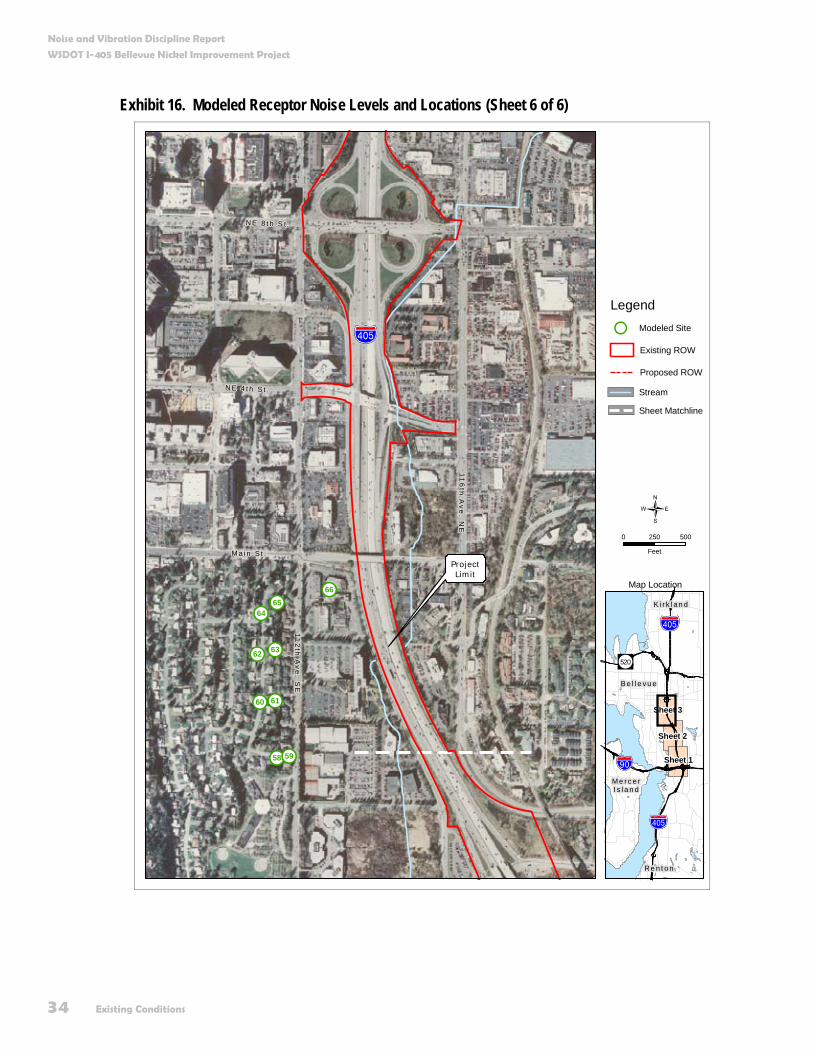
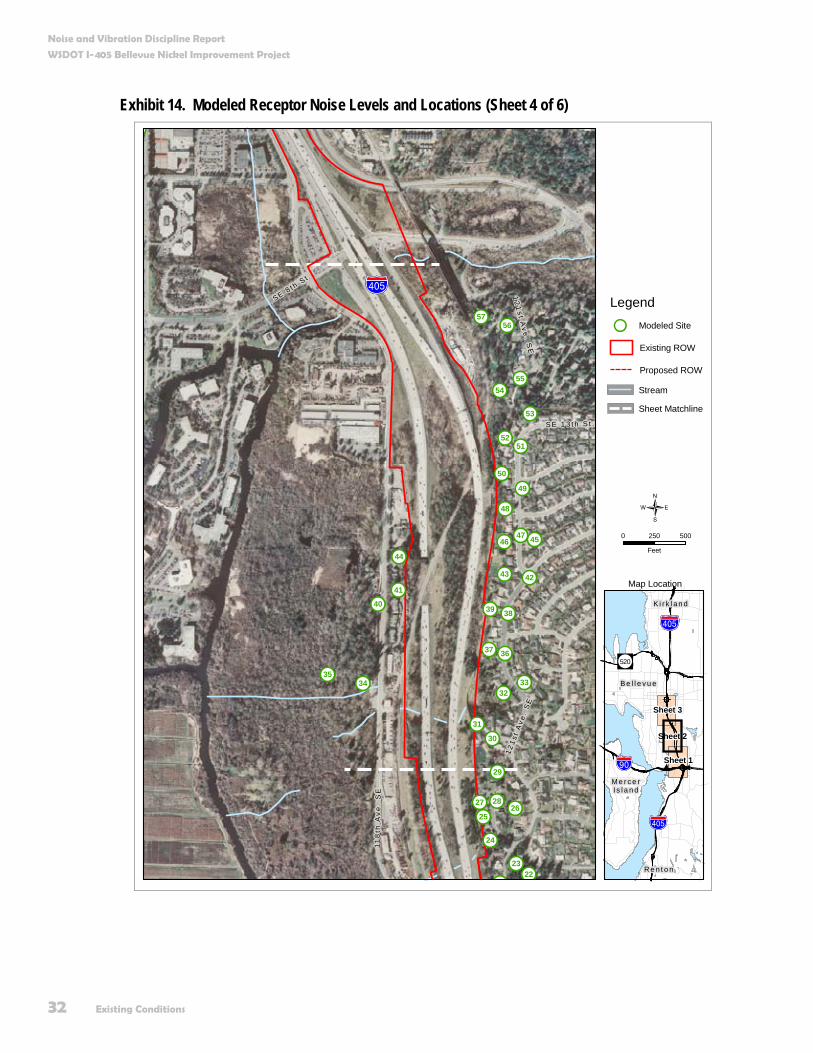
Where are the modeled noise receptor locations? WSDOT modeled existing noise levels at 66 locations that represent 253 residences, two hotels, and a park. Traffic noise from I-405 and local arterials is the dominant noise source in the study area with periodic air and rail noise. Exhibits 11 through 16 show the noise levels and the locations of all 66 modeled sensitive receptors. Appendix B includes a discussion and descriptions of noise measurements taken within the study area.
What are the modeled noise levels? WSDOT modeled noise levels of existing conditions in the study area ranging between 53 and 70 dBA (see Exhibits 11 through 16). These levels range from typical suburban outdoor sound levels, between 50 and 60 dBA (EPA 1974), to very noisy levels (above 70 dBA) that are typical of locations within 100 feet of a busy freeway. Modeled noise levels at five of the 66 sites currently approach or exceed the FHWA criterion of 67 dBA for existing conditions.
These modeling results represent the loudest traffic hour of the day when volumes are high, but not congested, and traffic speeds remain high.
Noise and Vibration Discipline Report
WSDOT I-405 Bellevue Nickel Improvement Project
Existing Conditions 29
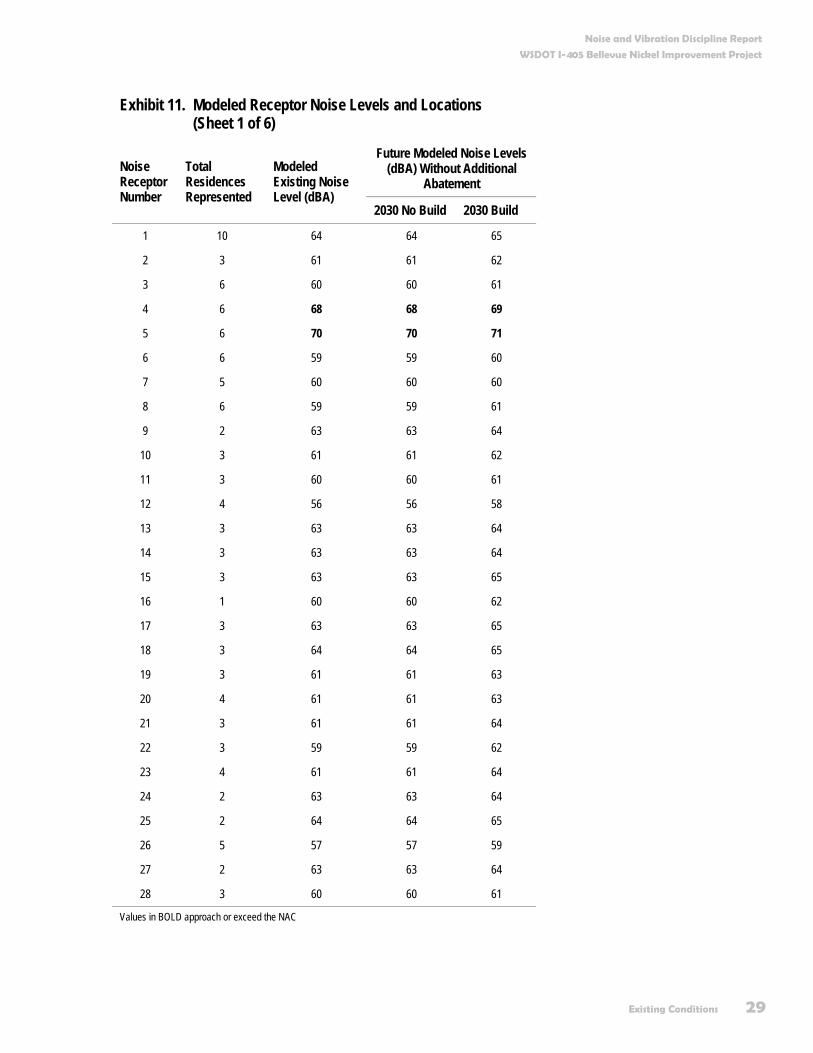
Exhibit 11. Modeled Receptor Noise Levels and Locations (Sheet 1 of 6)
Future Modeled Noise Levels (dBA) Without Additional
Abatement Noise Receptor Number
Total Residences Represented
Modeled Existing Noise Level (dBA)
2030 No Build 2030 Build
1 10 64 64 65
2 3 61 61 62
3 6 60 60 61
4 6 68 68 69
5 6 70 70 71
6 6 59 59 60
7 5 60 60 60
8 6 59 59 61
9 2 63 63 64
10 3 61 61 62
11 3 60 60 61
12 4 56 56 58
13 3 63 63 64
14 3 63 63 64
15 3 63 63 65
16 1 60 60 62
17 3 63 63 65
18 3 64 64 65
19 3 61 61 63
20 4 61 61 63
21 3 61 61 64
22 3 59 59 62
23 4 61 61 64
24 2 63 63 64
25 2 64 64 65
26 5 57 57 59
27 2 63 63 64
28 3 60 60 61
Values in BOLD approach or exceed the NAC
Noise and Vibration Discipline Report
WSDOT I-405 Bellevue Nickel Improvement Project
30 Existing Conditions
Exhibit 12. Modeled Receptor Noise Levels and Locations (Sheet 2 of 6)
!!!!
!!
!!!!
!!
!!!!!!
!!!!!!
!!!! !!
!!!!!!!!
!!
!! !!!!
!!!! !!!!!!
ProjectLimit
SE 3 8 th S t
118
t h A
ve. S
E
118
t h A
ve.
SE
!"b$
%&e(
98
7
6
5
4
3
2
1
282726
25
24
2322
21
20
19 1817
16
1514
1312
1110
0 250 500
Feet
{
B e l l e v u e
K i r k l a n d
R e n t o n
M e r c e rI s l a n d
Sheet 3
Sheet 2
Sheet 1
%&e(
!"b$
%&e(
520
Legend
!! Modeled Site
Map Location
Existing ROW
Proposed ROW
Sheet Matchline
Stream
Noise and Vibration Discipline Report
WSDOT I-405 Bellevue Nickel Improvement Project
Existing Conditions 31
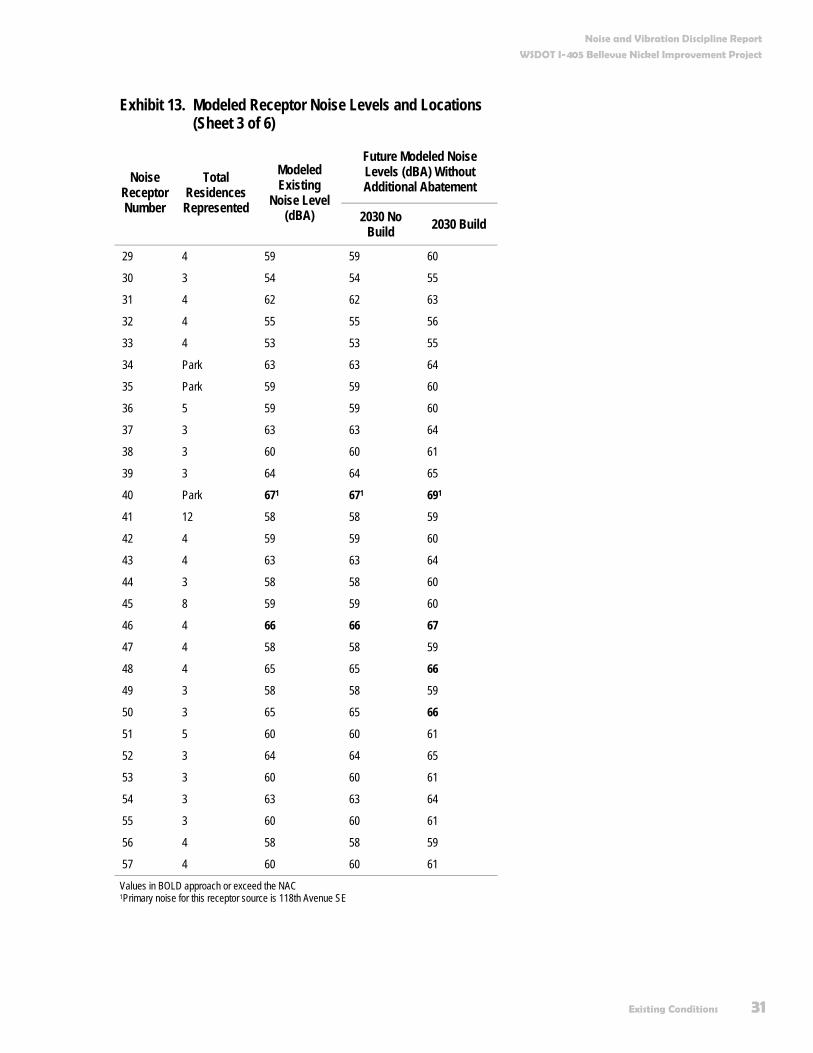
Exhibit 13. Modeled Receptor Noise Levels and Locations (Sheet 3 of 6)
Future Modeled Noise Levels (dBA) Without Additional Abatement
Noise Receptor Number
Total Residences Represented
Modeled Existing
Noise Level (dBA) 2030 No
Build 2030 Build
29 4 59 59 60
30 3 54 54 55
31 4 62 62 63
32 4 55 55 56
33 4 53 53 55
34 Park 63 63 64
35 Park 59 59 60
36 5 59 59 60
37 3 63 63 64
38 3 60 60 61
39 3 64 64 65
40 Park 671 671 691
41 12 58 58 59
42 4 59 59 60
43 4 63 63 64
44 3 58 58 60
45 8 59 59 60
46 4 66 66 67
47 4 58 58 59
48 4 65 65 66
49 3 58 58 59
50 3 65 65 66
51 5 60 60 61
52 3 64 64 65
53 3 60 60 61
54 3 63 63 64
55 3 60 60 61
56 4 58 58 59
57 4 60 60 61
Values in BOLD approach or exceed the NAC 1Primary noise for this receptor source is 118th Avenue SE
Noise and Vibration Discipline Report
WSDOT I-405 Bellevue Nickel Improvement Project
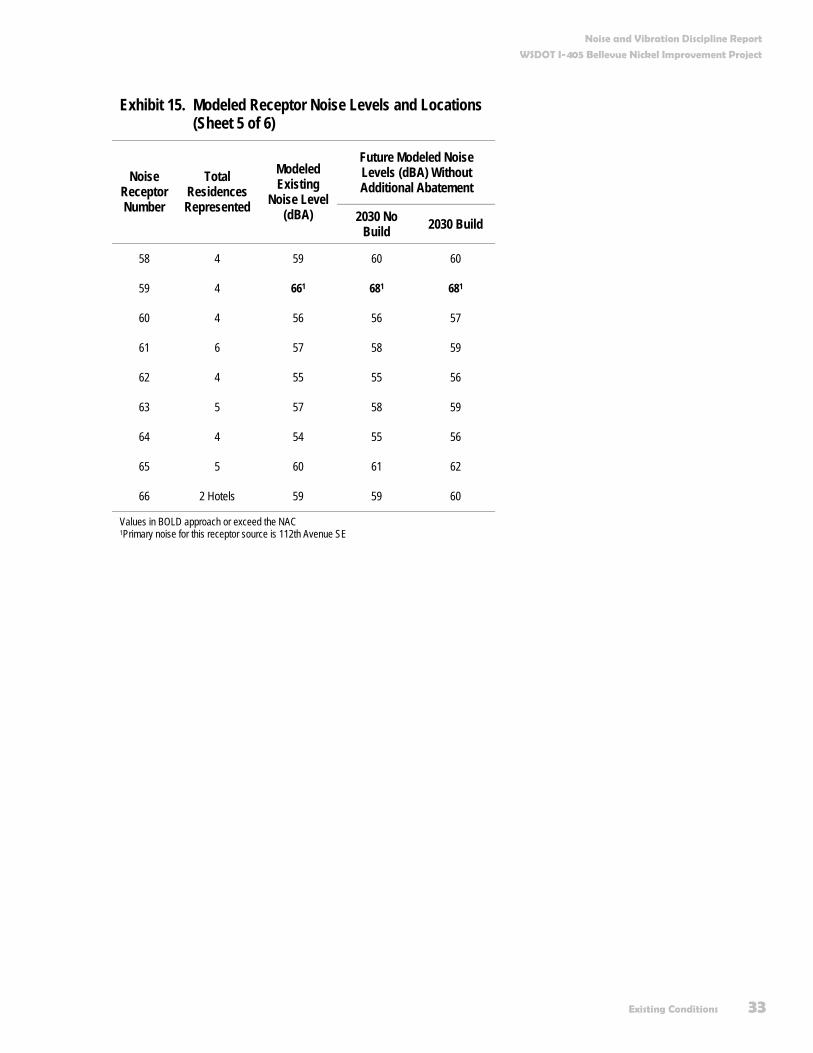
Existing Conditions 33
Exhibit 15. Modeled Receptor Noise Levels and Locations (Sheet 5 of 6)
Future Modeled Noise Levels (dBA) Without Additional Abatement
Noise Receptor Number
Total Residences Represented
Modeled Existing
Noise Level (dBA) 2030 No
Build 2030 Build
58 4 59 60 60
59 4 661 681 681
60 4 56 56 57
61 6 57 58 59
62 4 55 55 56
63 5 57 58 59
64 4 54 55 56
65 5 60 61 62
66 2 Hotels 59 59 60
Values in BOLD approach or exceed the NAC 1Primary noise for this receptor source is 112th Avenue SE
Noise and Vibration Discipline Report
WSDOT I-405 Bellevue Nickel Improvement Project
34 Existing Conditions
Exhibit 16. Modeled Receptor Noise Levels and Locations (Sheet 6 of 6)
!!!!
!!!!
!!!!
!!!!
!!
112
th A
ve
. SE
N E 4 t h S t .
M a i n S t .
N E 8 t h S t .
116
th A
ve. N
E
ProjectLimit
%&e(
6665
64
6362
6160
5958
0 250 500
Feet
{
B e l l e v u e
K i r k l an d
R e n t o n
M e r c e rI s l a n d
Sheet 3
Sheet 2
Sheet 1
%&e(
!"b$
%&e(
520
Legend
!! Modeled Site
Map Location
Existing ROW
Proposed ROW
Sheet Matchline
Stream
Potential Effects 35
Potential Effects How will the project affect noise levels in the study area? For the Build Alternative, modeling indicates that without mitigation, noise levels will approach or exceed the NAC at seven locations, representing a total of 27 residences. Noise levels at five of these seven locations currently approach or exceed the FHWA criterion. With the noise abatement measures proposed as part of the Bellevue Nickel Improvement Project, noise levels at five locations representing 15 residences will continue to approach or exceed the criterion. There will be no severe noise effects.
Noise levels adjacent to 118th Avenue SE and 112th Avenue SE (see Receptors 40 and 59, Exhibits 13 and 14) will exceed the NAC due to noise caused by local traffic on 118th Avenue SE and 112th Avenue SE respectively.
We modeled traffic noise from I-405 and 118th Avenue SE separately for Receptor 40. With the Build Alternative, I-405 will generate 56 dBA Leq(h) of traffic noise at Receptor 40. 118th Avenue SE will generate 68 dBA. Because the traffic noise predicted at Receptor 40 will be caused predominantly by local traffic on 112th Avenue SE, the effect is not related to the I-405 Bellevue Nickel Improvement Project and cannot be mitigated by reducing traffic noise from I-405.
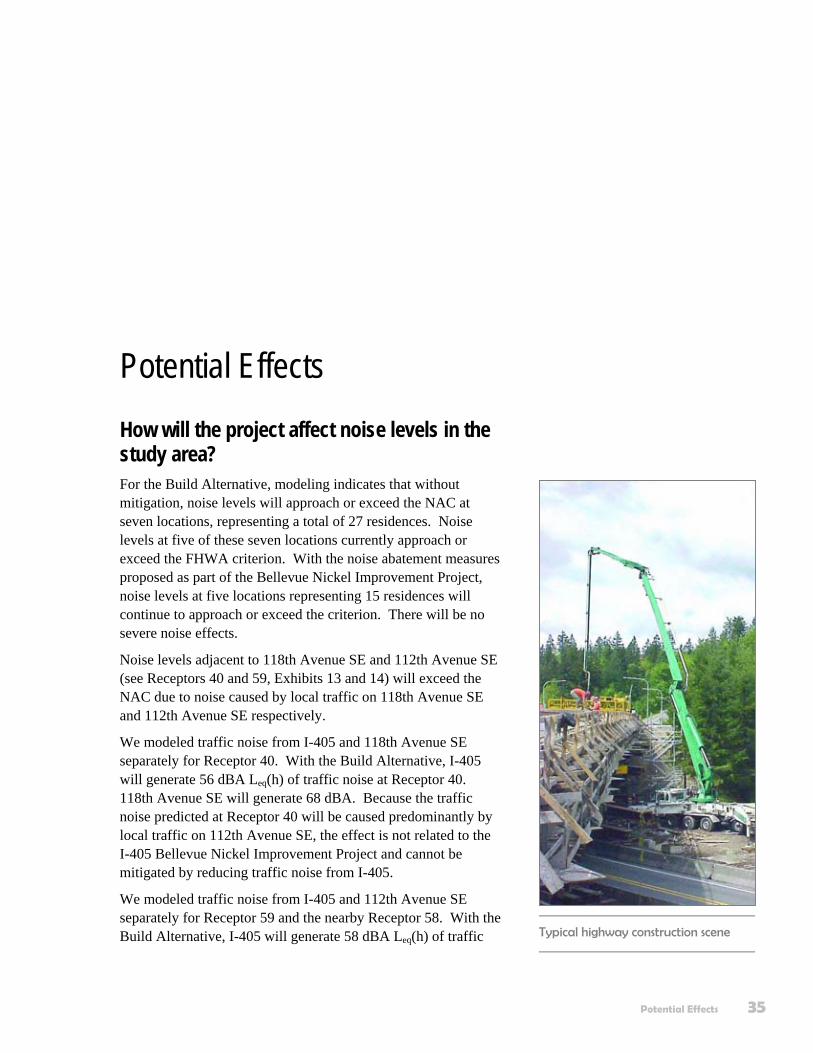
We modeled traffic noise from I-405 and 112th Avenue SE separately for Receptor 59 and the nearby Receptor 58. With the Build Alternative, I-405 will generate 58 dBA Leq(h) of traffic Typical highway construction scene
Noise and Vibration Discipline Report
WSDOT I-405 Bellevue Nickel Improvement Project
36 Potential Effects
noise at Receptor 58 and 57 dBA at Receptor 59. 112th Avenue SE will generate 57 and 68 dBA respectively, at the two receptors. Because the traffic noise predicted at Receptor 59 will be caused predominantly by local traffic on 112th Avenue SE, the effect is not related to the I-405 Bellevue Nickel Improvement Project and cannot be mitigated by reducing traffic noise from I-405.
Traffic noise from I-405 is responsible for the elevated traffic noise levels at five of the seven sites that will approach or exceed the FHWA criterion. At Receptors 40 and 59, noise comes from 118th Avenue SE and 112th Avenue SE respectively, and not from I-405. WSDOT evaluated several mitigation measures at the other five sites to determine if they could effectively and reasonably reduce traffic noise levels (see the Measures to Avoid or Minimize Project Effects section of this report).
How do the existing conditions, No Build, and Build Alternatives differ? WSDOT noise specialists predicted that noise levels for the No Build Alternative would increase by 0 to 2 dBA due to traffic volume increases. Noise levels at five locations would approach or exceed the NAC. All of these sites currently approach or exceed the NAC.
The analysis predicts that noise levels for the Build Alternative will increase by up to 3 dBA. Noise levels at seven locations will approach or exceed the NAC. Five of these sites currently approach or exceed the NAC.
How will project construction temporarily affect noise levels? Construction activities will generate noise during the construction period. Typically, contractors will carry out construction in several reasonably discrete steps, each of which has its own mix of equipment and, consequently, its own noise characteristics. Roadway construction will involve clearing, cut-and-fill (grading) activities, removing old roadways, importing fill, and paving.
Noise and Vibration Discipline Report
WSDOT I-405 Bellevue Nickel Improvement Project
Potential Effects 37
What are the noise sources during construction? The most prevalent noise source at construction sites will be the internal combustion engine. Engine-powered equipment includes earth-moving equipment, material-handling equipment, and stationary equipment. Mobile equipment operates in an episodic fashion with periods of high and low noise, while stationary equipment, such as generators and compressors, operates at sound levels that are fairly constant over time. Truck noise could affect more area residents because trucks will be present during most phases and will not be confined to the project site. Other construction noise sources will include impact equipment and tools such as pile drivers. Impact tools could be pneumatically powered, hydraulic, or electric.
Construction noise will be intermittent. Construction noise levels will depend on the type, amount, and location of construction activities. The type of construction methods will determine the maximum noise levels generated by the construction equipment used. The amount of construction activity will define how often construction noise will occur. The proximity of construction equipment to adjacent properties will affect the noise levels of the receptor. Maximum noise levels of construction equipment for the Build Alternative will be similar to typical maximum levels presented in Exhibit 17 below.
Noise and Vibration Discipline Report
WSDOT I-405 Bellevue Nickel Improvement Project
38 Potential Effects
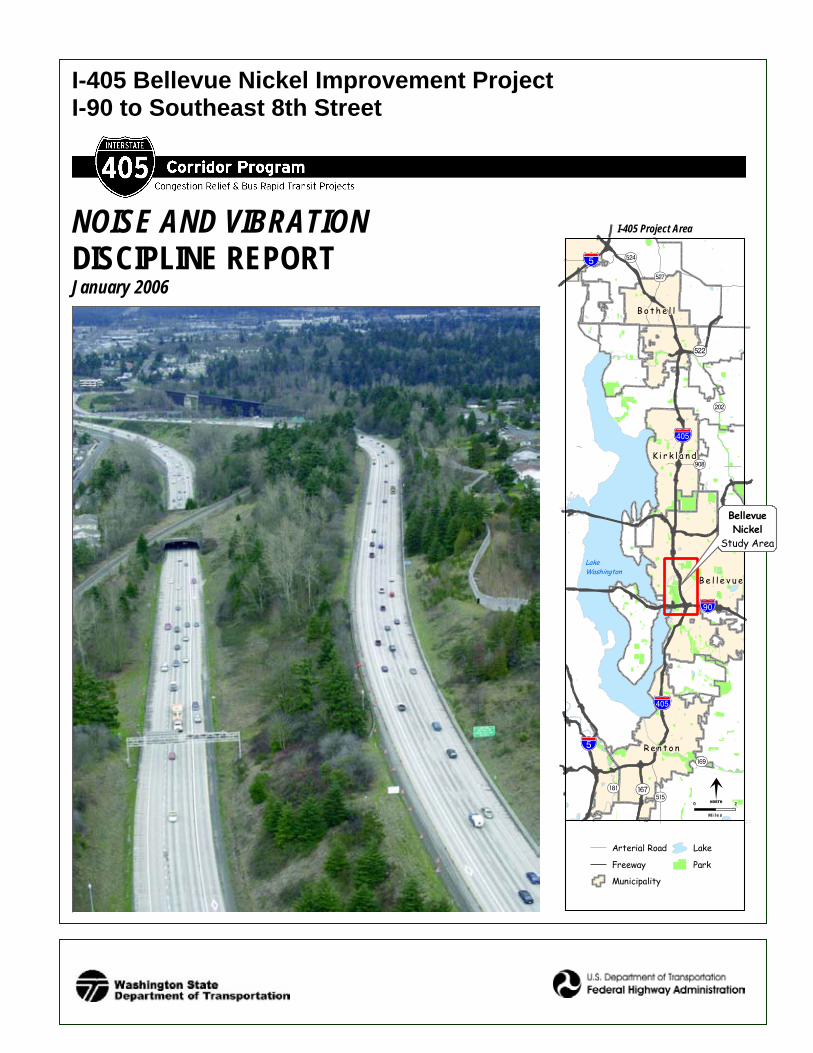
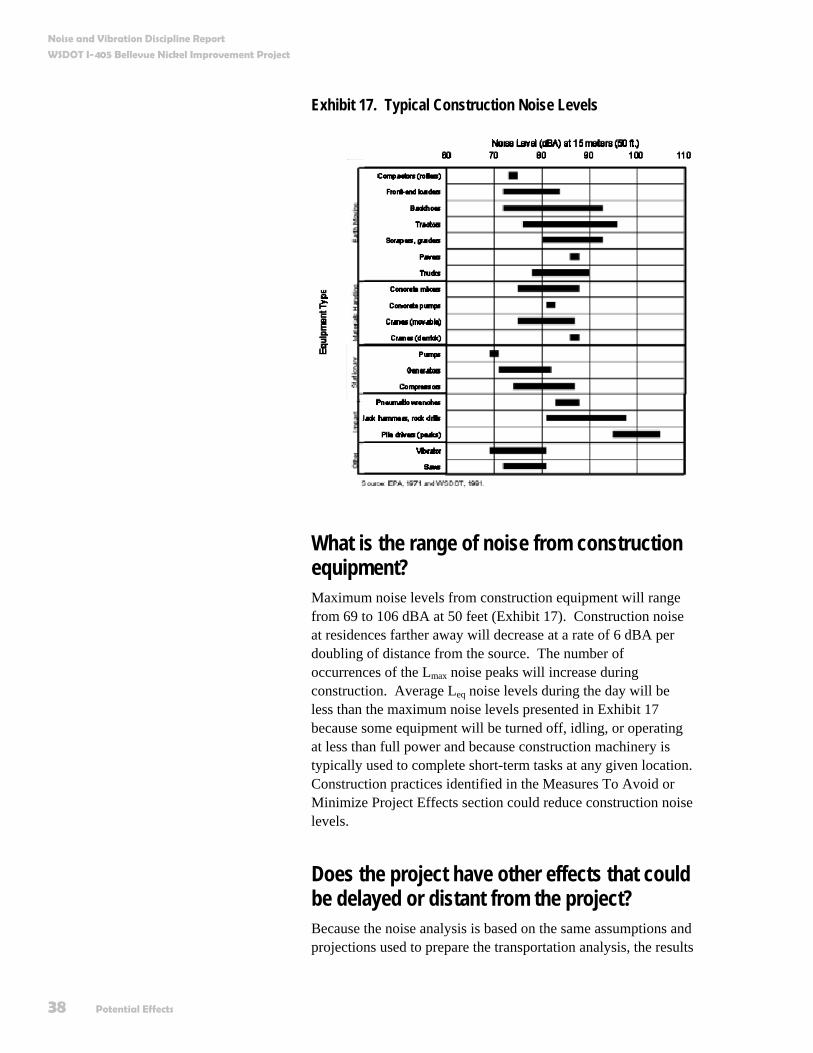
Exhibit 17. Typical Construction Noise Levels
What is the range of noise from construction equipment? Maximum noise levels from construction equipment will range from 69 to 106 dBA at 50 feet (Exhibit 17). Construction noise at residences farther away will decrease at a rate of 6 dBA per doubling of distance from the source. The number of occurrences of the Lmax noise peaks will increase during construction. Average Leq noise levels during the day will be less than the maximum noise levels presented in Exhibit 17 because some equipment will be turned off, idling, or operating at less than full power and because construction machinery is typically used to complete short-term tasks at any given location. Construction practices identified in the Measures To Avoid or Minimize Project Effects section could reduce construction noise levels.
Does the project have other effects that could be delayed or distant from the project? Because the noise analysis is based on the same assumptions and projections used to prepare the transportation analysis, the results
Noise and Vibration Discipline Report
WSDOT I-405 Bellevue Nickel Improvement Project
Potential Effects 39
of the noise analysis already reflect the potential “delayed and distant” effects of the Bellevue Nickel Improvement Project. The data presented in Exhibit 13 reflect modeled noise levels for the Build Alternative out to 2030.
Did we consider potential cumulative effects for the Build and No Build Alternatives? WSDOT did not evaluate cumulative effects for this discipline. A report of cumulative effects is not necessary for every discipline studied for NEPA and SEPA documentation. The disciplines that we studied for cumulative effects are Air Quality, Surface Water, Fish and Aquatic Habitat, and Wetlands. We present the cumulative effects for these disciplines in the Cumulative Effects Analysis Discipline Report.
Noise and Vibration Discipline Report
WSDOT I-405 Bellevue Nickel Improvement Project
32 Existing Conditions
Exhibit 14. Modeled Receptor Noise Levels and Locations (Sheet 4 of 6)
!! !!!!
!!!! !!!!!!
!!
!!!!
!!!!!!!!
!!!!
!!!!!!!!
!!!!!!
!!!!!!
!!!!
!!
!!!!!!
!!!!
!!!!
!!
121
s t A
v e.
SE
118
t h A
ve
. S
E
12
1s t A
v e. S
E
S E 1 3 t h S t .
SE 8 t h St .
%&e(57
56
5554
53
5251
50
49
48
4746 45
44
43 4241
40 39 38
37 36
3534 33
32
31
30
29
282726
25
24
2322
0 250 500
Feet
{
B e l l e v u e
K i r k l a n d
R e n t o n
M e r c e rI s l a n d
Sheet 3
Sheet 2
Sheet 1
%&e(
!"b$
%&e(
520
Legend
!! Modeled Site
Map Location
Existing ROW
Proposed ROW
Sheet Matchline
Stream


Measures to Avoid or Minimize Project Effects 41
Measures to Avoid or Minimize Project Effects How can we minimize effects from construction noise? The contractor and construction crews can control noise at three locations: (1) at the source, with mufflers and quieter engines; (2) along the noise path, with barriers; and (3) at the receptor, with insulation. Noise abatement is necessary only where frequent human use occurs and where a lower noise level would provide benefits (USDOT 1982). WSDOT will reduce construction noise by incorporating avoidance and minimization measures into the project’s construction specifications, as described in Appendix A.
How can we minimize effects from traffic noise? FHWA regulations (23 CFR 772) specify that when project proponents identify noise effects, they must evaluate abatement (mitigation) measures to reduce the effects. Project proponents must incorporate all noise abatement measures that they determine to be feasible and reasonable, including local resident support, into the project design before FHWA’s approval.
A variety of mitigation methods can effectively reduce traffic noise levels. For example, methods to reduce noise generated from long-term operation of the project can include
Workers construct a retaining wall as part of a highway improvement project
Noise and Vibration Discipline Report
WSDOT I-405 Bellevue Nickel Improvement Project
42 Measures to Avoid or Minimize Project Effects
implementing traffic management measures; acquiring land as buffer zones or for constructing noise barriers or berms; realigning the roadway; noise-insulating public use or nonprofit institutional structures; and, constructing noise barriers or berms. We evaluated these measures for their potential to reduce noise caused by the proposed project. This section includes a summary of the results of this evaluation. WSDOT will make a final determination on the size and placement of noise barriers or berms, and on whether to implement other noise-attenuating methods during the detailed project design, after WSDOT has solicited public involvement and received approval at the local, state, and federal levels.
Traffic Management Measures Traffic management measures include time restrictions or traffic control devices, and signing to prohibit certain vehicle types (e.g., motorcycles and heavy trucks), modify speed limits, and implement exclusive lane designations.
Restricting vehicle types or lowering speed limits on I-405 could worsen congestion and is contrary to the purpose of the project. Land use controls could help to reduce noise effects throughout the study area, although the area is largely built out. A transportation system management plan, combined with increased transit facilities to encourage the use of carpools and public transit, would reduce vehicle trips and subsequently traffic noise. However, a 3-dBA decrease in traffic noise would require an approximately 50 percent reduction in traffic, which probably will not occur.
Land Acquisition for Noise Buffers or Barriers Residential properties border I-405 in the study area. Acquiring land in this area would require relocating residents and would be unreasonably expensive for the purpose of noise mitigation.
Realigning the Roadway The project’s horizontal alignment is defined by available right of way. The vertical alignment is constrained by the need to provide clearance above and below crossing roadways, railroad, and utilities. Lowering the I-405 mainline to provide noise reduction to some receptors would be prohibitively expensive and provide only marginal improvement. Realigning the roadway could also increase noise levels at other receptors.
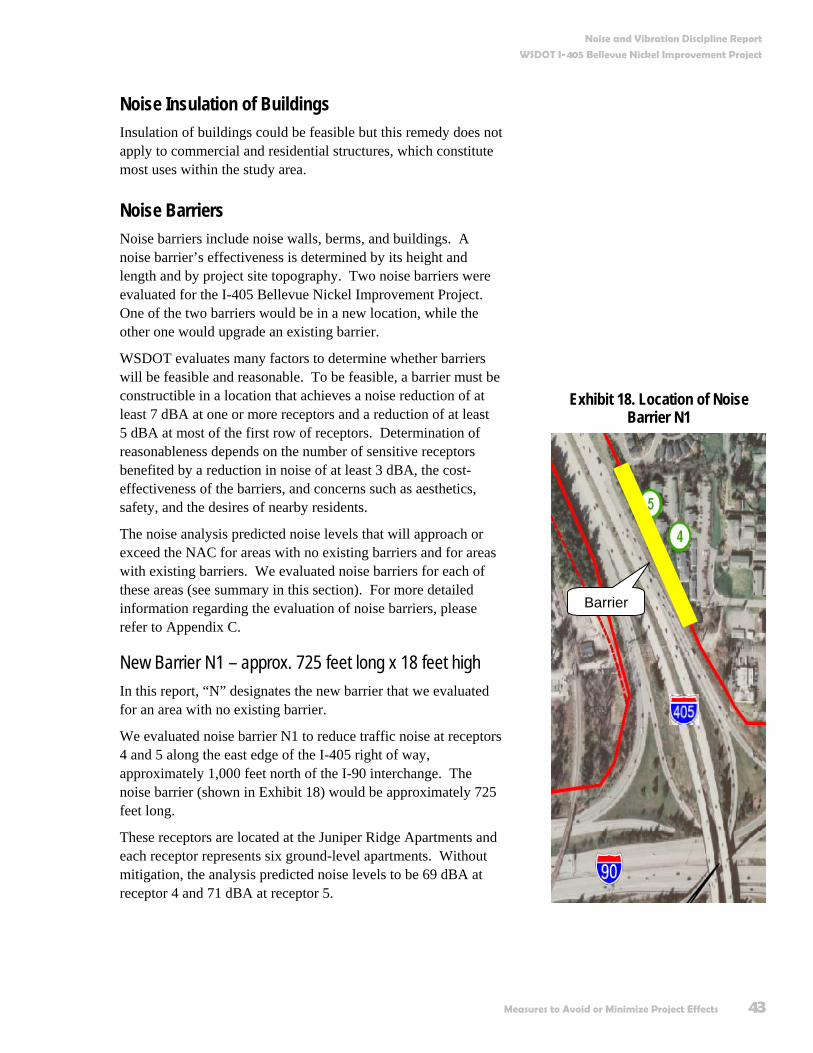
Noise and Vibration Discipline Report
WSDOT I-405 Bellevue Nickel Improvement Project
Measures to Avoid or Minimize Project Effects 43
Noise Insulation of Buildings Insulation of buildings could be feasible but this remedy does not apply to commercial and residential structures, which constitute most uses within the study area.
Noise Barriers Noise barriers include noise walls, berms, and buildings. A noise barrier’s effectiveness is determined by its height and length and by project site topography. Two noise barriers were evaluated for the I-405 Bellevue Nickel Improvement Project. One of the two barriers would be in a new location, while the other one would upgrade an existing barrier.
WSDOT evaluates many factors to determine whether barriers will be feasible and reasonable. To be feasible, a barrier must be constructible in a location that achieves a noise reduction of at least 7 dBA at one or more receptors and a reduction of at least 5 dBA at most of the first row of receptors. Determination of reasonableness depends on the number of sensitive receptors benefited by a reduction in noise of at least 3 dBA, the cost-effectiveness of the barriers, and concerns such as aesthetics, safety, and the desires of nearby residents.
The noise analysis predicted noise levels that will approach or exceed the NAC for areas with no existing barriers and for areas with existing barriers. We evaluated noise barriers for each of these areas (see summary in this section). For more detailed information regarding the evaluation of noise barriers, please refer to Appendix C.
New Barrier N1 – approx. 725 feet long x 18 feet high In this report, “N” designates the new barrier that we evaluated for an area with no existing barrier.
We evaluated noise barrier N1 to reduce traffic noise at receptors 4 and 5 along the east edge of the I-405 right of way, approximately 1,000 feet north of the I-90 interchange. The noise barrier (shown in Exhibit 18) would be approximately 725 feet long.
These receptors are located at the Juniper Ridge Apartments and each receptor represents six ground-level apartments. Without mitigation, the analysis predicted noise levels to be 69 dBA at receptor 4 and 71 dBA at receptor 5.
Exhibit 18. Location of Noise Barrier N1
Barrier
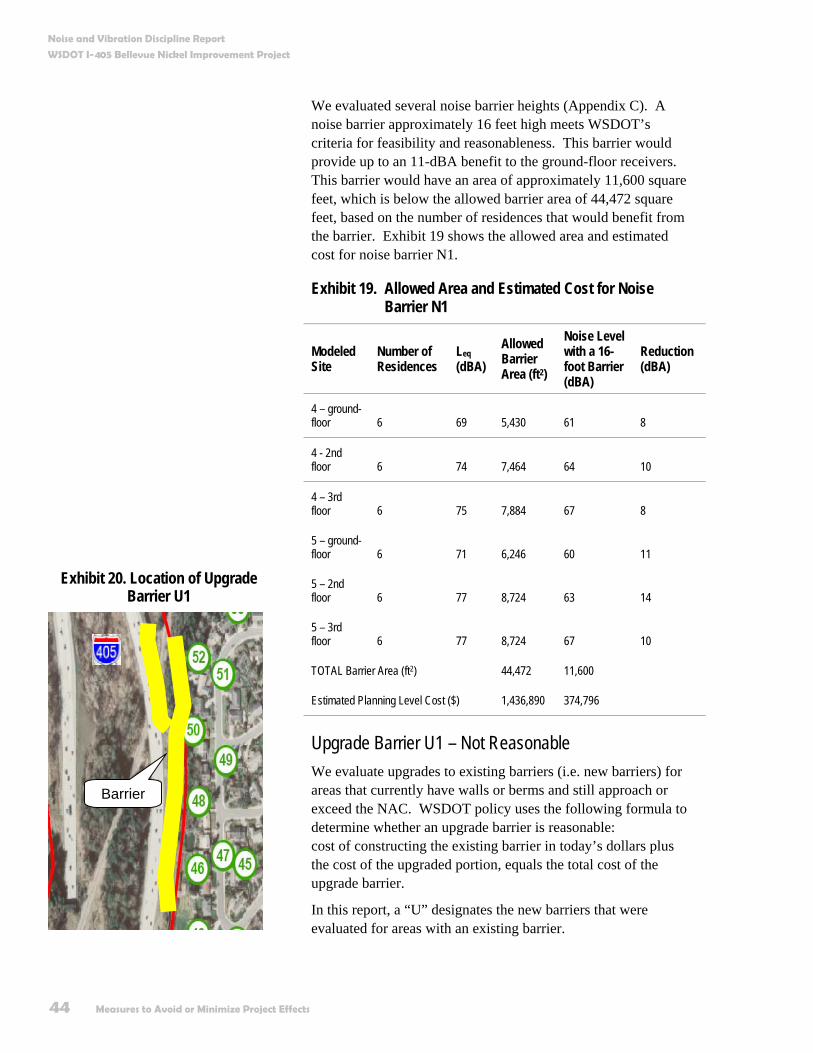
Noise and Vibration Discipline Report
WSDOT I-405 Bellevue Nickel Improvement Project
44 Measures to Avoid or Minimize Project Effects
We evaluated several noise barrier heights (Appendix C). A noise barrier approximately 16 feet high meets WSDOT’s criteria for feasibility and reasonableness. This barrier would provide up to an 11-dBA benefit to the ground-floor receivers. This barrier would have an area of approximately 11,600 square feet, which is below the allowed barrier area of 44,472 square feet, based on the number of residences that would benefit from the barrier. Exhibit 19 shows the allowed area and estimated cost for noise barrier N1.
Exhibit 19. Allowed Area and Estimated Cost for Noise Barrier N1
Modeled Site
Number of Residences
Leq (dBA)
Allowed Barrier Area (ft2)
Noise Level with a 16-foot Barrier (dBA)
Reduction (dBA)
4 – ground-floor 6 69 5,430 61 8
4 - 2nd floor 6 74 7,464 64 10
4 – 3rd floor 6 75 7,884 67 8
5 – ground-floor 6 71 6,246 60 11
5 – 2nd floor 6 77 8,724 63 14
5 – 3rd floor 6 77 8,724 67 10
TOTAL Barrier Area (ft2) 44,472 11,600
Estimated Planning Level Cost ($) 1,436,890 374,796
Upgrade Barrier U1 – Not Reasonable We evaluate upgrades to existing barriers (i.e. new barriers) for areas that currently have walls or berms and still approach or exceed the NAC. WSDOT policy uses the following formula to determine whether an upgrade barrier is reasonable: cost of constructing the existing barrier in today’s dollars plus the cost of the upgraded portion, equals the total cost of the upgrade barrier.
In this report, a “U” designates the new barriers that were evaluated for areas with an existing barrier.
Exhibit 20. Location of Upgrade Barrier U1
Barrier
Noise and Vibration Discipline Report
WSDOT I-405 Bellevue Nickel Improvement Project
Measures to Avoid or Minimize Project Effects 45
Noise barrier U1 (Exhibit 20) includes an upgrade to a portion of an existing barrier along the eastern edge of the I-405 right of way, located between SE 16th Place and SE 13th Street. The noise barrier evaluated comprises two sections of noise wall running parallel to each other. The existing barrier is approximately 1,450 feet long and averages approximately 20 feet high.
WSDOT must replace approximately 1,000 feet of the existing southeast noise barrier with a wall that is 4 feet higher (averaging 24 feet high) to reduce noise to levels that do not approach or exceed the NAC at all receptors in this area. This barrier meets WSDOT feasibility criteria because it could provide at least a 7-dBA reduction in the first row but it does not meet the reasonableness criteria because the cost of the existing barrier, in addition to the cost of the new barrier, would exceed WSDOT’s allowed cost (Exhibit 21).
Exhibit 21. Allowed Barrier Area for Noise Barrier U1
Modeled Site
Number of Residences
Noise Level without the Existing Barrier (dBA)
Allowed Barrier Area (ft2)
Noise Level with 4 foot higher Barrier (dBA)
Reduction (dBA)
45 8 65 5,600 57 8
46 4 74 4,976 65 9
47 4 62 2,800 57 5
48 4 75 5,256 63 12
49 3 61 2,100 58 3
50 3 73 3,528 62 11
51 5 61 01 61 0
52 3 68 2,511 65 3
Existing Barrier Area (ft2) - 28,810
Barrier Area to be replaced (ft2) - 24,274
TOTAL Barrier Area (ft2) 26,771 53,084
Planning Level Cost($) $864,971 $1,715,144
1Residences that do not receive at least a 3 dBA benefit have no allowed area.
Noise and Vibration Discipline Report
WSDOT I-405 Bellevue Nickel Improvement Project
46 Measures to Avoid or Minimize Project Effects
What is the determined mitigation? Project noise specialists determined Noise Barrier N1, approximately 725 feet long and 16 feet high, to be both feasible and reasonable to build. WSDOT includes this barrier in the project design. We show the location of Noise Barrier N1 within the study area in Exhibit 2, and again at closer range in Exhibit 18 above.
Vibration 47
Vibration What is vibration? Vibration is an oscillatory motion, which we can describe in terms of displacement, velocity, or acceleration. The velocity represents the instantaneous speed of the motion and acceleration is the rate of change of the speed. The human body responds to the average amplitude of the vibration velocity. A vibration decibel notation is used for vibration. The vibration velocity level is reported in decibels relative to a level of 1x10⁻⁶ inches per second and denoted “VdB.”
In contrast to airborne noise, ground-borne vibration is not a phenomenon that most people experience every day. The background vibration velocity level in residential areas is usually 50 VdB or lower, well below the threshold of perception for humans, which is around 65 VdB. Most perceptible indoor vibration is caused by sources within buildings such as the operation of mechanical equipment, movement of people, or slamming of doors. Although the perceptibility threshold is about 65 VdB, human response to vibration is not usually significant unless the vibration exceeds 70 VdB. This is a typical level for a 25-foot distance on smooth pavement from a truck or bus lane. There is potential for minor damage to fragile historic buildings at vibration levels greater than 100 VdB.
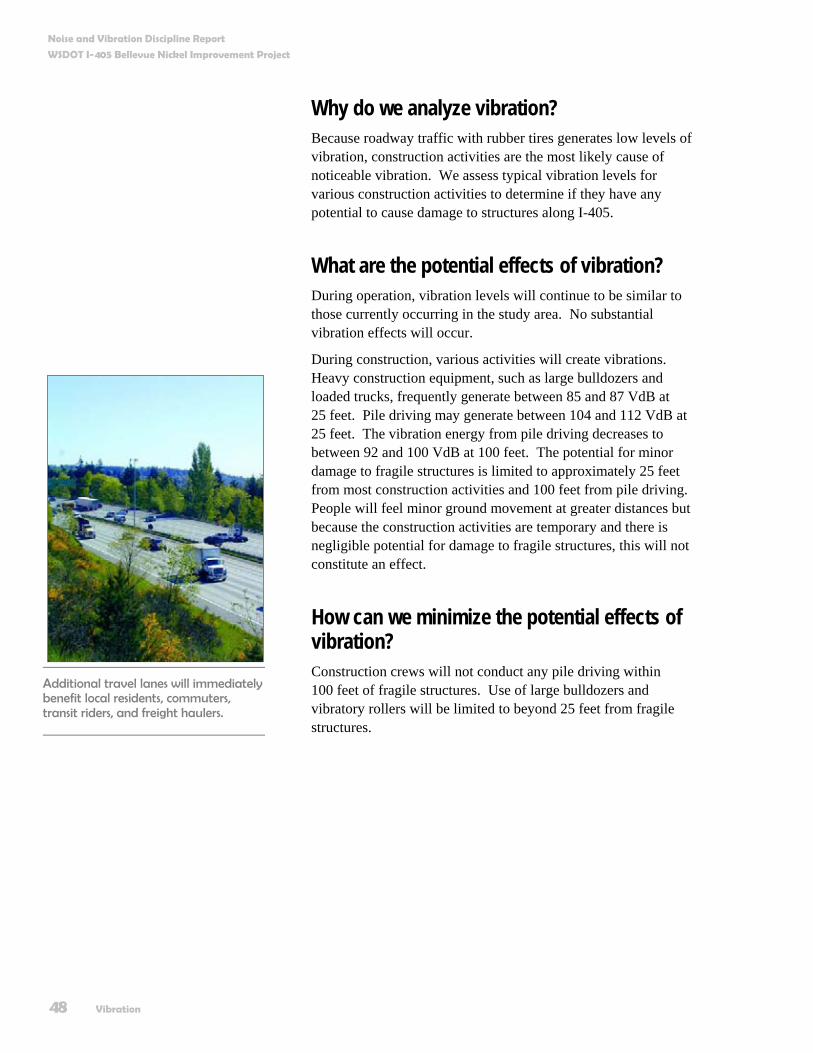
Noise and Vibration Discipline Report
WSDOT I-405 Bellevue Nickel Improvement Project
48 Vibration
Why do we analyze vibration? Because roadway traffic with rubber tires generates low levels of vibration, construction activities are the most likely cause of noticeable vibration. We assess typical vibration levels for various construction activities to determine if they have any potential to cause damage to structures along I-405.
What are the potential effects of vibration? During operation, vibration levels will continue to be similar to those currently occurring in the study area. No substantial vibration effects will occur.
During construction, various activities will create vibrations. Heavy construction equipment, such as large bulldozers and loaded trucks, frequently generate between 85 and 87 VdB at 25 feet. Pile driving may generate between 104 and 112 VdB at 25 feet. The vibration energy from pile driving decreases to between 92 and 100 VdB at 100 feet. The potential for minor damage to fragile structures is limited to approximately 25 feet from most construction activities and 100 feet from pile driving. People will feel minor ground movement at greater distances but because the construction activities are temporary and there is negligible potential for damage to fragile structures, this will not constitute an effect.
How can we minimize the potential effects of vibration? Construction crews will not conduct any pile driving within 100 feet of fragile structures. Use of large bulldozers and vibratory rollers will be limited to beyond 25 feet from fragile structures.
Additional travel lanes will immediately benefit local residents, commuters, transit riders, and freight haulers.
References 49
References King County. 1999. King County Code Title 12, Chapters 12.86-12.100. Noise. Seattle,
Washington.
U.S. Department of Transportation (USDOT) Federal Highway Administration. 1998. FHWA Traffic Noise Model User’s Guide. Washington D.C.
———. 1996. Measurement of Highway Related Noise. Washington D.C.
———. 1995. Transit Noise and Vibration Impact Assessment. Washington D.C.
———. 1982. Procedures for Abatement of Highway Traffic Noise and Construction Noise. Federal-Aid Highway Program Manual. Volume 7, Chapter 7, Section 3. Washington, D.C.
———. 1973. Fundamentals and Abatement of Highway Traffic Noise. Washington D.C.
U.S. Environmental Protection Agency (EPA). 1974. Information on Levels of Environmental Noise Requisite to Protect Public Health and Welfare with an Adequate Margin of Safety. Report Number 550/9-74-004.
———. 1971. Noise from Construction Equipment and Operations, Building Equipment, and Home Appliances. Washington, D.C.
Washington Administrative Code (WAC). 1999. Chapter 173-60. Maximum Environmental Noise Levels. Olympia, Washington.
Washington State Department of Transportation (WSDOT). 2003. Environmental Procedures Manual. Olympia, Washington.
———. 1999. Traffic Noise Analysis and Abatement Policy and Procedures. Olympia, Washington.
———. 1987. Directive D22-22. Noise Evaluation Procedures for Existing Highways. Olympia, Washington.


Appendix A Avoidance and Minimization Measures

Appendix A A-1
Avoidance and Minimization Measures The following sections describe the established design and construction practices that WSDOT will include to avoid or minimize effects to the various environmental resources during both the construction and operation phases of the project.
Project Measures to Avoid or Minimize Effects During Construction Design elements, such as modifications to boundaries of areas that can be affected, have been incorporated into the project specifications, construction plans, and procedures, to help avoid or minimize most potential construction impacts. When appropriate, monitoring will be conducted to ensure that these design and construction measures are effective.
Measures for Geology, Soils, and Groundwater WSDOT will prepare and implement a Temporary Erosion and Sedimentation Control
(TESC) plan consisting of operational and structural measures to control the transport of sediment. Operational measures include removing mud and dirt from trucks before they leave the site, covering fill stockpiles or disturbed areas, and avoiding unnecessary vegetation clearing. Structural measures are temporary features used to reduce the transport of sediment, such as silt fences and sediment traps.
WSDOT will reduce degradation of moisture-sensitive soils by limiting major earthwork to the drier, late spring through early fall construction season; by maintaining proper surface drainage to avoid ponding of surface water or groundwater; by minimizing ground disturbance through limiting the use of heavy equipment, limiting turns, and/or not tracking directly on the subgrade; and by covering the final subgrade elevation with a working mat of crushed rock and/or geotextile for protection. Mixing a soil admix such as cement into the subgrade may also add strength and stabilize the ground.
WSDOT will determine acceptable limits for off-site construction-related ground vibration before construction begins and demonstrate that off-site ground vibrations are within the limits set for the project through the use of vibration-monitoring equipment.
WSDOT will identify areas subject to shaking from a large earthquake and will mitigate risks using ground modifications or other procedures identified in the WSDOT Geotechnical Design Manual.
WSDOT will implement construction procedures identified in the geotechnical investigation to maintain or enhance slope stability in areas potentially underlain by landslide-prone soils.
WSDOT will protect the Kelsey Creek aquifer from contamination by construction-related spills by development and implementation of BMPs and a Spill Prevention Control and
A-2 Appendix A
Countermeasures plan (SPCCP). The SPCC will specifically address fuel spills from vehicles and from spills of other chemicals commonly transported over I-405. Spill response equipment will be located at regular and specified intervals within the project area for minimizing countermeasure response times.
WSDOT will ensure only clean fill is imported and placed for the project and will require documentation for fill brought onto the site from the supplier certifying that the fill does not exceed Washington State soil cleanup standards. If documentation is not available, testing of imported fill soils will be required prior to placement. Suspect soils encountered during project construction will be tested and, where necessary, removed from the site and disposed of in accordance with Washington State regulations.
WSDOT will identify and develop staging areas for equipment repair and maintenance away from all drainage courses. Washout from concrete trucks will not be dumped into storm drains or onto soil or pavement that carries stormwater runoff. A wash down area for equipment and concrete trucks will be designated and the use of thinners and solvents to wash oil, grease, or similar substances from heavy machinery or machine parts will be prohibited.
WSDOT will obtain a NPDES (National Pollutant Discharge Elimination System) permit and will conduct a regular program of testing and lab work to ensure that water encountered during construction meets the water quality standards specified in the NPDES permit.
WSDOT will to meet the NPDES water quality standards prior to the discharge of the encountered water to a surface water body, such as Kelsey Creek. If necessary, water quality will be improved, such as by using sediment ponds to allow sediment to settle out prior to discharge.
If it is necessary to install seepage drains to control seepage for retaining walls and fill embankments, WSDOT will include special provisions in the design to discharge drain flow back into affected areas, including wetlands.
Measures for Water Quality In addition to measures for geology, soils, groundwater, and for hazardous materials that are protective of water quality, the following measures would be implemented for water quality.
WSDOT will identify and develop staging areas for equipment repair and maintenance away from all drainage courses.
Washout from concrete trucks will not be dumped into storm drains or onto soil or pavement that carries stormwater runoff.
Thinners and solvents will not be used to wash oil, grease, or similar substances from heavy machinery or machine parts.
WSDOT will designate a wash down area for equipment and concrete trucks.
Appendix A A-3
Measures for Wetlands WSDOT will protect, preserve, and enhance wetlands in the project area during the planning,
construction, and operation of transportation facilities and projects consistent with USDOT Order 5660.1A, Executive Order 11990, and Governor’s Executive Orders EO 89-10 and EO 90-04.
WSDOT’s project-level design and environmental review has included avoidance, minimization, restoration, and compensation of wetlands. WSDOT will implement these measures prior to or concurrent with adverse effects on wetlands, to reduce temporal losses of wetland functions.
WSDOT will follow guidance contained in the wetlands section of the WSDOT Environmental Procedures Manual (WSDOT 2004a), which outlines the issues and actions to be addressed prior to authorizing work that could affect wetlands.
WSDOT will use high-visibility fencing to clearly mark wetlands to be avoided in the construction area.
Measures for Upland Vegetation and Wildlife WSDOT will ensure mitigation measures established in the I-405 Corridor EIS will be
implemented on the Bellevue Nickel Improvement Project.
WSDOT will prepare and implement a revegetation plan. In addition, areas with mixed forest will not be removed for temporary use (i.e., construction staging). If an area of mixed forest must be removed for roadway construction, it will be replaced with plantings of native tree and shrub species within the affected area.
WSDOT will adhere to project conditions identified in the Biological Assessment and agency concurrence letters.
WSDOT will limit construction activity to a relatively small area immediately adjacent to the existing roadway to minimize vegetation clearing and leave as many trees as possible.
Measures for Fisheries and Aquatic Resources WSDOT will implement construction BMPs (such as silt fencing or sedimentation ponds) to
avoid disturbing sensitive areas during the development and use of any staging areas, access roads, and turnouts associated with resurfacing activities.
WSDOT will not allow in-water work to occur except during seasonal work windows established to protect fish.
WSDOT will require that all stormwater treatment wetland/detention facilities are sited and constructed at a sufficient distance from named and unnamed streams so no grading or filling in the streams or the streamside zones will be required.
A-4 Appendix A
Measures for Air Quality WSDOT will require preparation and implementation of a Fugitive Dust Control Plan in
accordance with the Memorandum of Agreement between WSDOT and PSCAA Regarding Control of Fugitive Dust from Construction Projects (October 1999).
During dry weather, exposed soil will be sprayed with water to reduce emissions of and deposition of particulate matter (PM10).
WSDOT will provide aequate freeboard (space from the top of the material to the top of the truck), cover truckloads, and, in dry weather, wet materials in trucks to reduce emission of and deposition of particulate matter during transport.
WSDOT use wheel washers to remove particulate matter that would otherwise be carried offsite by vehicles to decrease deposition of particulate matter on area roadways.
WSDOT will remove particulate matter deposited on public roads to reduce mud on area roadways.
WSDOT will cover or spray with water any dirt, gravel, and debris piles during periods of high wind when the stockpiles are not in use to control dust and transmissions of particulate matter.
WSDOT will route and schedule construction trucks to reduce travel delays and unnecessary fuel consumption during peak travel times, and therefore reduce secondary air quality impacts (i.e. emissions of carbon monoxide and nitrogen oxides) that result when vehicles slow down to wait for construction trucks.
Measures for Noise Noise berms and barriers will be erected prior to other construction activities to provide noise
shielding.
The noisiest construction activities, such as pile driving, will be limited to between 7 AM and 10 PM to reduce construction noise levels during sensitive nighttime hours.
Construction equipment engines will be equipped with adequate mufflers, intake silencers, and engine enclosures.
Construction equipment will be turned off during prolonged periods of nonuse to eliminate noise.
All equipment will be maintained appropriately and equipment operators will be trained in good practices to reduce noise levels.
Stationary equipment will be stored away from receiving properties to decrease noise.
Temporary noise barriers or curtains will be constructed around stationary equipment that must be located close to residences.
Resilient bed liners will be required in dump trucks to be loaded on site during nighttime hours.
Appendix A A-5
WSDOT use Occupational Safety and Health Administration (OSHA)-approved ambient sound-sensing backup alarms that would reduce disturbances during quieter periods.
Measures for Hazardous Materials
Known or Suspected Contamination within the Build Alternative Right of Way WSDOT will prepare an SPCCP that provides specific guidance for managing contaminated
media that may be encountered within the right of way (ROW).
WSDOT may be responsible for remediation and monitoring of any contaminated properties acquired for this project. WSDOT will further evaluate the identified properties before acquisition or construction occurs. Contamination in soils will be evaluated relative to the Model Toxics Control Act (MTCA).
If WSDOT encounters an underground storage tank (UST) within the ROW, WSDOT will assume cleanup liability for the appropriate decommissioning and removal of USTs. If this occurs, WSDOT will follow all applicable rules and regulations associated with UST removal activities.
WSDOT will conduct thorough asbestos-containing material/lead paint building surveys by an Asbestos Hazard Emergency Response Act (AHERA)-certified inspector on all property structures acquired or demolished. WSDOT will properly remove and dispose of all asbestos-containing material/lead-based paint in accordance with applicable rules and regulations.
Construction waste material such as concrete or other harmful materials will be disposed of at approved sites in accordance with Sections 2-01, 2-02, and 2-03 of the WSDOT Standard Specifications.
WSDOT may acquire the responsibility for cleanup of any soil or groundwater contamination encountered during construction (that must be removed from the project limits) within WSDOT ROW. Contamination will be evaluated relative to Model Toxics Control Act (MTCA) cleanup levels.
WSDOT will consider entering into pre-purchaser agreements for purpose of indemnifying itself against acquiring the responsibility for any long-term cleanup and monitoring costs.
All regulatory conditions imposed at contaminated properties (e.g., Consent Decree) associated with construction will be met. These conditions could include ensuring that the surrounding properties and population are not exposed to the contaminants on the site: i.e., WSDOT will ensure that the site is properly contained during construction so that contaminants do not migrate offsite, thereby protecting the health and safety of all on-site personnel during work at the site.
Known or Suspected Contamination Outside of the Right of Way Contaminated groundwater originating from properties located up-gradient of the ROW could
migrate to the project area. WSDOT generally will not incur liability for groundwater contamination that has migrated into the project footprint as long as the agency does not
A-6 Appendix A
acquire the source of the contamination. However, WSDOT will manage the contaminated media in accordance with all applicable rules and regulations.
Unknown Contamination If unknown contamination is discovered during construction, WSDOT will follow the SPCCP
as well as all appropriate regulations.
Worker and Public Health and Safety and other Regulatory Requirements The WSDOT will comply with the following regulations and agreements:
State Dangerous Waste Regulations (Chapter 173-303 WAC);
Safety Standards for Construction Work (Chapter 296-155 WAC);
National Emission Standards for Hazardous Air Pollutants (CFR, Title 40, Volume 5, Parts 61 to 71);
General Occupational Health Standards (Chapter 296-62 WAC); and
Implementing Agreement between Ecology and WSDOT Concerning Hazardous Waste Management (April 1993).
Hazardous Materials Spills During Construction WSDOT will prepare and implement a SPCCP to minimize or avoid effects on human health,
soil, surface water and groundwater.
Measures for Traffic and Transportation WSDOT will coordinate with local agencies and other projects to prepare and implement a
Traffic Management Plan (TMP) prior to making any changes to the traffic flow or lane closures. WSDOT willl inform the public, school districts, emergency service providers, and transit agencies of the changes ahead of time through a public information process. Pedestrian and bicycle circulation will be maintained as much as possible during construction.
Prior to and during construction, WSDOT will implement strategies to manage the demand on transportation infrastructure. These transportation demand management strategies will form an important part of the construction management program and will be aimed at increasing public awareness and participation in HOV travel. The major focus will be on expanding vanpooling and van-share opportunities. Other elements of the transportation demand management plan may include:
increased HOV awareness and public information, and
work-based support and incentives.
Appendix A A-7
Measures for Visual Quality WSDOT will follow the I-405 Urban Design Criteria. Where the local terrain and placement
of light poles allow, the WSDOT will reduce light and glare effects by shielding roadway lighting and using downcast lighting so light sources will not be directly visible from residential areas and local streets.
WSDOT will restore (revegetate) construction areas in phases rather than waiting for the entire project to be completed.
Measures for Neighborhoods, Businesses, Public Services and Utilities WSDOT will prepare and implement a transportation management plan (TMP). If local
streets must be temporarily closed during construction, WSDOT will provide detour routes clearly marked with signs.
WSDOT will coordinate with school districts before construction.
WSDOT will implement and coordinate the TMP with all emergency services prior to any construction activity.
WSDOT will coordinate with utility providers prior to construction to identify conflicts and resolve the conflicts prior to or during construction. Potential utility conflicts within WSDOT ROW will be relocated at the utility’s expense prior to contract award.
WSDOT will prepare a consolidated utility plan consisting of key elements such as existing locations, potential temporary locations and potential new locations for utilities; sequence and coordinated schedules for utility work; and detailed descriptions of any service disruptions. This plan will be reviewed by and discussed with affected utility providers prior to the start of construction.
WSDOT will field verify the exact locations and depths of underground utilities prior to construction.
WSDOT will notify neighborhoods of utility interruptions by providing a scheduled of construction activities in those areas.
WSDOT will coordinate with utility franchise holders and provide them with project schedules to minimize the effects of utility relocations (for example, equipment procurement times, relocation ahead of construction, etc.)
WSDOT will notify and coordinate with fire departments for water line relocations that may affect water supply for fire suppression, and establish alternative supply lines prior to any breaks in service; and to ensure that fire departments can handle all calls during construction periods and to alleviate the potential for increased response times.
WSDOT will notify and coordinate with police departments to implement crime prevention principles and to ensure that they have adequate staffing to provide traffic and pedestrian control.
A-8 Appendix A
WSDOT will maintain access to businesses throughout the construction period through careful planning of construction activities and an awareness of the needs to provide adjacent properties with reasonable access during business hours. As part of construction management, WSDOT will prepare access measures. WSDOTT will make provisions for posting appropriate signs to communicate the necessary information to potential customers.
WSDOT will keep daytime street closures to a minimum to provide access for businesses during regular business hours.
Measures for Cultural Resources WSDOT will prepare an Unanticipated Discovery Plan for the project that WSDOT will
follow. This will avoid or minimize unanticipated effects to historic, cultural, and archaeological resources.
Project Measures to Avoid or Minimize Effects During Project Operation The following sections describe the measures that WSDOT will implement during project operation.
Measures for Surface Waters and Water Quality WSDOT will follow the Highway Runoff Manual for both the design and implementation of
stormwater facilities. WSDOT is not required to manage flow where drainage is directly to Mercer Slough. Where drainage is to a tributary to Mercer Slough, WSDOT will construct a stormwater management system that does provide flow control.
Measures for Fisheries and Aquatic Resources WSDOT will compensate for adverse effects to fish habitat and aquatic resources by
providing in-kind mitigation. This in-kind mitigation will take the form of on-site, off-site, or a combination of on- and off-site mitigation.
Off-site mitigation could include planting native riparian vegetation outside of the study area in areas where restoring native riparian buffers may have a greater benefit to fish and aquatic species. Mitigation could be concentrated along streams with high fish use where important stream processes and functions related to riparian buffers (for example, large woody debris [LWD] recruitment levels, litter fall, and bank stabilization) are impaired.
On-site/off-site mitigation could include installing in-stream habitat features (for example, boulders or LWD) in the streambed downstream of the project footprint to increase the habitat complexity of the affected waterbody.
Appendix A A-9
Ongoing maintenance (during and post-construction) of stormwater treatment and detention facilities by WSDOT will not include the application of any chemical weed control agents (e.g., herbicides).
Measures for Upland Vegetation and Wildlife WSDOT will replace areas of mixed forest that will be permanently removed for roadway
construction with plantings of native tree and shrub species within the affected area.

Appendix B Noise Measurement and Model Validation Data

Appendix B B-1
Noise Measurement and Model Validation Data
I Noise Measurement and Model Validation Ambient noise levels were measured for 15-minute periods at 36 locations near the project area to describe the existing noise environment, identify major noise sources in the project area, validate the noise model, and characterize the weekday background environmental noise levels. Measurement locations characterize the variety of noise conditions and represent other sensitive receptors near the proposed project.
The FHWA Traffic Noise Model (TNM) Version 2.5 computer model (FHWA, 2004) was used to predict Leq(h) traffic noise levels. TNM is used to obtain precise estimates of noise levels at discrete points by considering interactions between different noise sources and the effects of topographical features on the noise level. The model estimates the acoustic intensity at a receiver location calculated from a series of straight-line roadway segments. Noise emissions from free-flowing traffic depend on the number of automobiles, medium trucks, and heavy trucks per hour; vehicular speed; and reference noise emission levels of an individual vehicle. TNM also considers effects of intervening barriers, topography, trees, and atmospheric absorption. Noise from sources other than traffic is not included. Therefore, when non-traffic noise such as aircraft noise is considerable in an area, TNM under-predicts the actual noise level. Because project impacts only depend on traffic noise levels, under-predicting the total environmental noise level does not affect the findings of the study. Noise monitoring results were used to validate the Existing Conditions TNM model.
The project team noise specialists exported base maps and design files from Microstation as DXF files and imported them into the TNM package. Major roadways, topographical features, building rows, and sensitive receptors were digitized into the model. Elevations were added from the 2-foot contour data. Elevations for planned improvements were taken from design profiles, proposed cross sections, and proposed cut and fill limits.
38 measured sites were chosen to represent noise-sensitive sites in the project area. Fifteen-minute noise measurements were taken at each of these 38 sites to estimate the Leq (h). The measured sites represent approximately 265 single family residences, multi-family units, a park, and two hotels. Two of these measurements were taken at second and third story apartment residences that have elevations closest to I-405 which would meet WSDOT’s pending noise policy. For noise model calibration, traffic volumes were adjusted to match field counts during the time of day of the noise measurement. Additional topographical and geometrical detail was added to the TNM model until the model results at each of the 36 measurement sites were within 2 dBA of the measured levels for the validation run of the model.
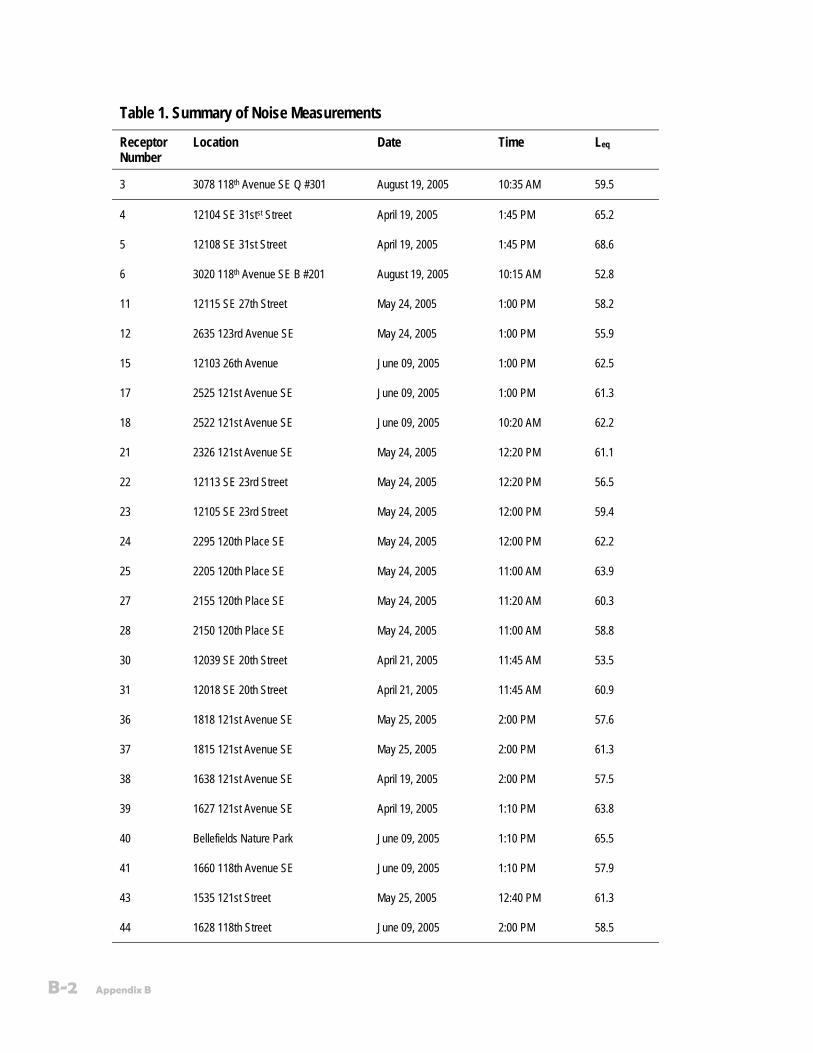
B-2 Appendix B
Table 1. Summary of Noise Measurements
Receptor Number
Location Date Time Leq
3 3078 118th Avenue SE Q #301 August 19, 2005 10:35 AM 59.5
4 12104 SE 31stst Street April 19, 2005 1:45 PM 65.2
5 12108 SE 31st Street April 19, 2005 1:45 PM 68.6
6 3020 118th Avenue SE B #201 August 19, 2005 10:15 AM 52.8
11 12115 SE 27th Street May 24, 2005 1:00 PM 58.2
12 2635 123rd Avenue SE May 24, 2005 1:00 PM 55.9
15 12103 26th Avenue June 09, 2005 1:00 PM 62.5
17 2525 121st Avenue SE June 09, 2005 1:00 PM 61.3
18 2522 121st Avenue SE June 09, 2005 10:20 AM 62.2
21 2326 121st Avenue SE May 24, 2005 12:20 PM 61.1
22 12113 SE 23rd Street May 24, 2005 12:20 PM 56.5
23 12105 SE 23rd Street May 24, 2005 12:00 PM 59.4
24 2295 120th Place SE May 24, 2005 12:00 PM 62.2
25 2205 120th Place SE May 24, 2005 11:00 AM 63.9
27 2155 120th Place SE May 24, 2005 11:20 AM 60.3
28 2150 120th Place SE May 24, 2005 11:00 AM 58.8
30 12039 SE 20th Street April 21, 2005 11:45 AM 53.5
31 12018 SE 20th Street April 21, 2005 11:45 AM 60.9
36 1818 121st Avenue SE May 25, 2005 2:00 PM 57.6
37 1815 121st Avenue SE May 25, 2005 2:00 PM 61.3
38 1638 121st Avenue SE April 19, 2005 2:00 PM 57.5
39 1627 121st Avenue SE April 19, 2005 1:10 PM 63.8
40 Bellefields Nature Park June 09, 2005 1:10 PM 65.5
41 1660 118th Avenue SE June 09, 2005 1:10 PM 57.9
43 1535 121st Street May 25, 2005 12:40 PM 61.3
44 1628 118th Street June 09, 2005 2:00 PM 58.5
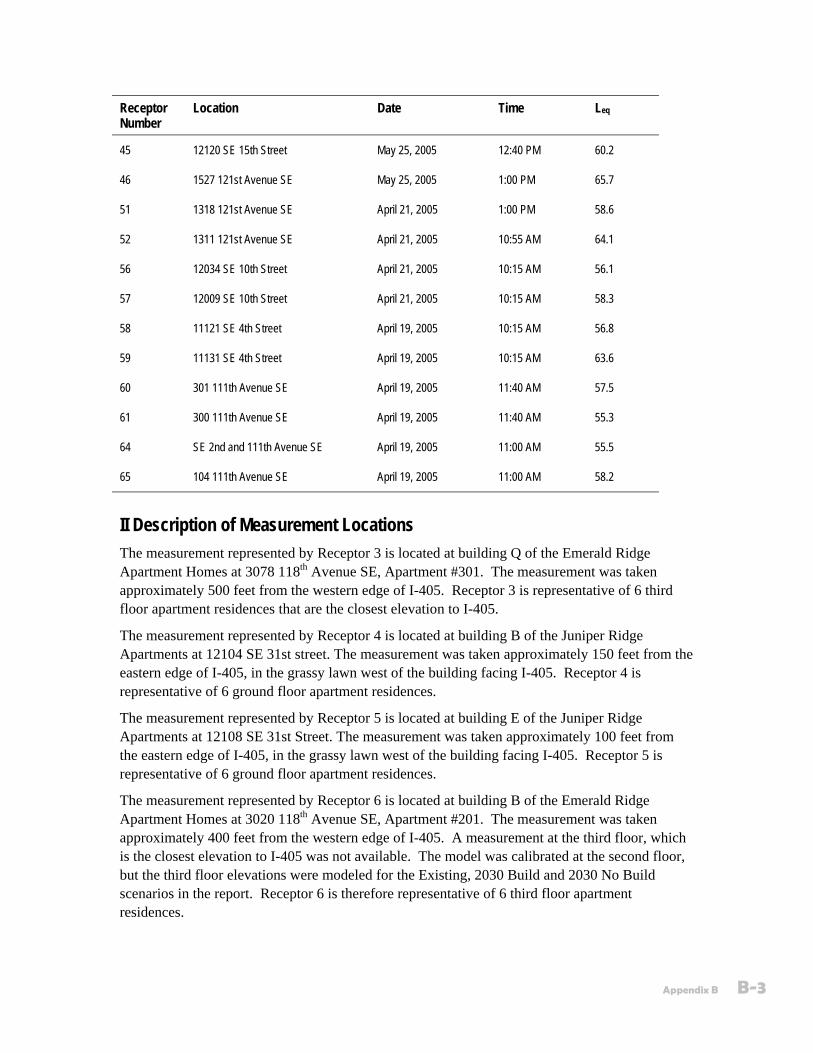
Appendix B B-3
Receptor Number
Location Date Time Leq
45 12120 SE 15th Street May 25, 2005 12:40 PM 60.2
46 1527 121st Avenue SE May 25, 2005 1:00 PM 65.7
51 1318 121st Avenue SE April 21, 2005 1:00 PM 58.6
52 1311 121st Avenue SE April 21, 2005 10:55 AM 64.1
56 12034 SE 10th Street April 21, 2005 10:15 AM 56.1
57 12009 SE 10th Street April 21, 2005 10:15 AM 58.3
58 11121 SE 4th Street April 19, 2005 10:15 AM 56.8
59 11131 SE 4th Street April 19, 2005 10:15 AM 63.6
60 301 111th Avenue SE April 19, 2005 11:40 AM 57.5
61 300 111th Avenue SE April 19, 2005 11:40 AM 55.3
64 SE 2nd and 111th Avenue SE April 19, 2005 11:00 AM 55.5
65 104 111th Avenue SE April 19, 2005 11:00 AM 58.2
II Description of Measurement Locations The measurement represented by Receptor 3 is located at building Q of the Emerald Ridge Apartment Homes at 3078 118th Avenue SE, Apartment #301. The measurement was taken approximately 500 feet from the western edge of I-405. Receptor 3 is representative of 6 third floor apartment residences that are the closest elevation to I-405.
The measurement represented by Receptor 4 is located at building B of the Juniper Ridge Apartments at 12104 SE 31st street. The measurement was taken approximately 150 feet from the eastern edge of I-405, in the grassy lawn west of the building facing I-405. Receptor 4 is representative of 6 ground floor apartment residences.
The measurement represented by Receptor 5 is located at building E of the Juniper Ridge Apartments at 12108 SE 31st Street. The measurement was taken approximately 100 feet from the eastern edge of I-405, in the grassy lawn west of the building facing I-405. Receptor 5 is representative of 6 ground floor apartment residences.
The measurement represented by Receptor 6 is located at building B of the Emerald Ridge Apartment Homes at 3020 118th Avenue SE, Apartment #201. The measurement was taken approximately 400 feet from the western edge of I-405. A measurement at the third floor, which is the closest elevation to I-405 was not available. The model was calibrated at the second floor, but the third floor elevations were modeled for the Existing, 2030 Build and 2030 No Build scenarios in the report. Receptor 6 is therefore representative of 6 third floor apartment residences.
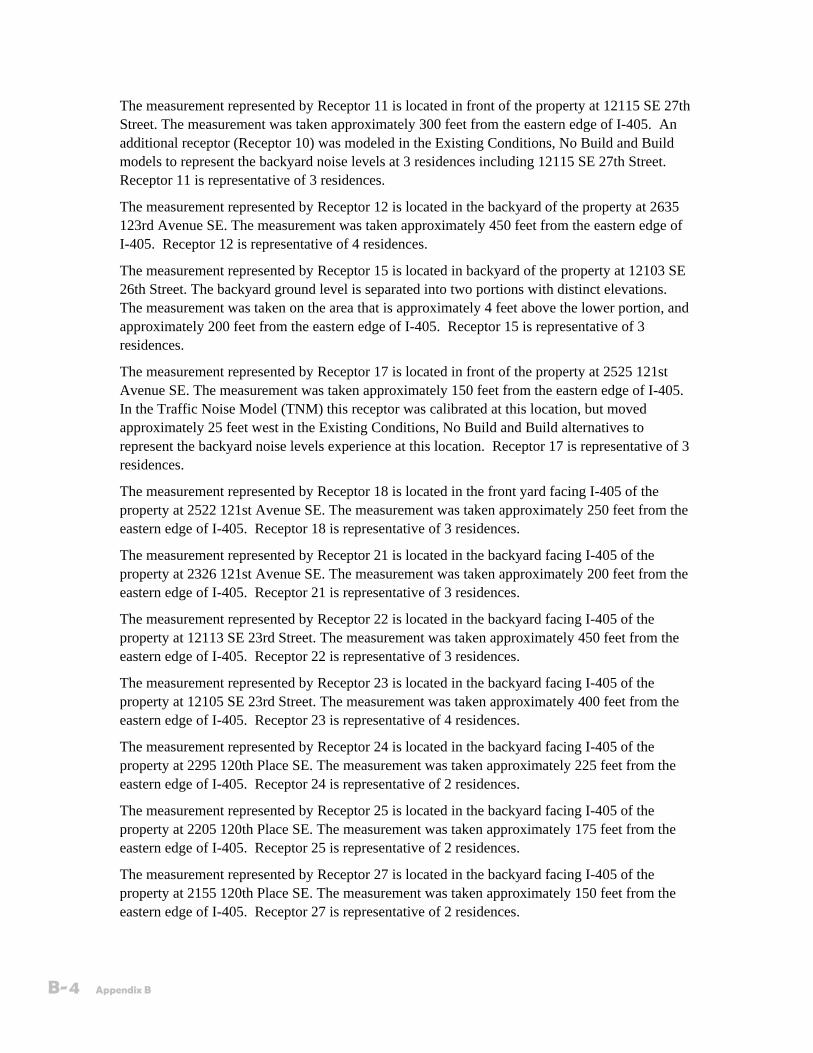
B-4 Appendix B
The measurement represented by Receptor 11 is located in front of the property at 12115 SE 27th Street. The measurement was taken approximately 300 feet from the eastern edge of I-405. An additional receptor (Receptor 10) was modeled in the Existing Conditions, No Build and Build models to represent the backyard noise levels at 3 residences including 12115 SE 27th Street. Receptor 11 is representative of 3 residences.
The measurement represented by Receptor 12 is located in the backyard of the property at 2635 123rd Avenue SE. The measurement was taken approximately 450 feet from the eastern edge of I-405. Receptor 12 is representative of 4 residences.
The measurement represented by Receptor 15 is located in backyard of the property at 12103 SE 26th Street. The backyard ground level is separated into two portions with distinct elevations. The measurement was taken on the area that is approximately 4 feet above the lower portion, and approximately 200 feet from the eastern edge of I-405. Receptor 15 is representative of 3 residences.
The measurement represented by Receptor 17 is located in front of the property at 2525 121st Avenue SE. The measurement was taken approximately 150 feet from the eastern edge of I-405. In the Traffic Noise Model (TNM) this receptor was calibrated at this location, but moved approximately 25 feet west in the Existing Conditions, No Build and Build alternatives to represent the backyard noise levels experience at this location. Receptor 17 is representative of 3 residences.
The measurement represented by Receptor 18 is located in the front yard facing I-405 of the property at 2522 121st Avenue SE. The measurement was taken approximately 250 feet from the eastern edge of I-405. Receptor 18 is representative of 3 residences.
The measurement represented by Receptor 21 is located in the backyard facing I-405 of the property at 2326 121st Avenue SE. The measurement was taken approximately 200 feet from the eastern edge of I-405. Receptor 21 is representative of 3 residences.
The measurement represented by Receptor 22 is located in the backyard facing I-405 of the property at 12113 SE 23rd Street. The measurement was taken approximately 450 feet from the eastern edge of I-405. Receptor 22 is representative of 3 residences.
The measurement represented by Receptor 23 is located in the backyard facing I-405 of the property at 12105 SE 23rd Street. The measurement was taken approximately 400 feet from the eastern edge of I-405. Receptor 23 is representative of 4 residences.
The measurement represented by Receptor 24 is located in the backyard facing I-405 of the property at 2295 120th Place SE. The measurement was taken approximately 225 feet from the eastern edge of I-405. Receptor 24 is representative of 2 residences.
The measurement represented by Receptor 25 is located in the backyard facing I-405 of the property at 2205 120th Place SE. The measurement was taken approximately 175 feet from the eastern edge of I-405. Receptor 25 is representative of 2 residences.
The measurement represented by Receptor 27 is located in the backyard facing I-405 of the property at 2155 120th Place SE. The measurement was taken approximately 150 feet from the eastern edge of I-405. Receptor 27 is representative of 2 residences.
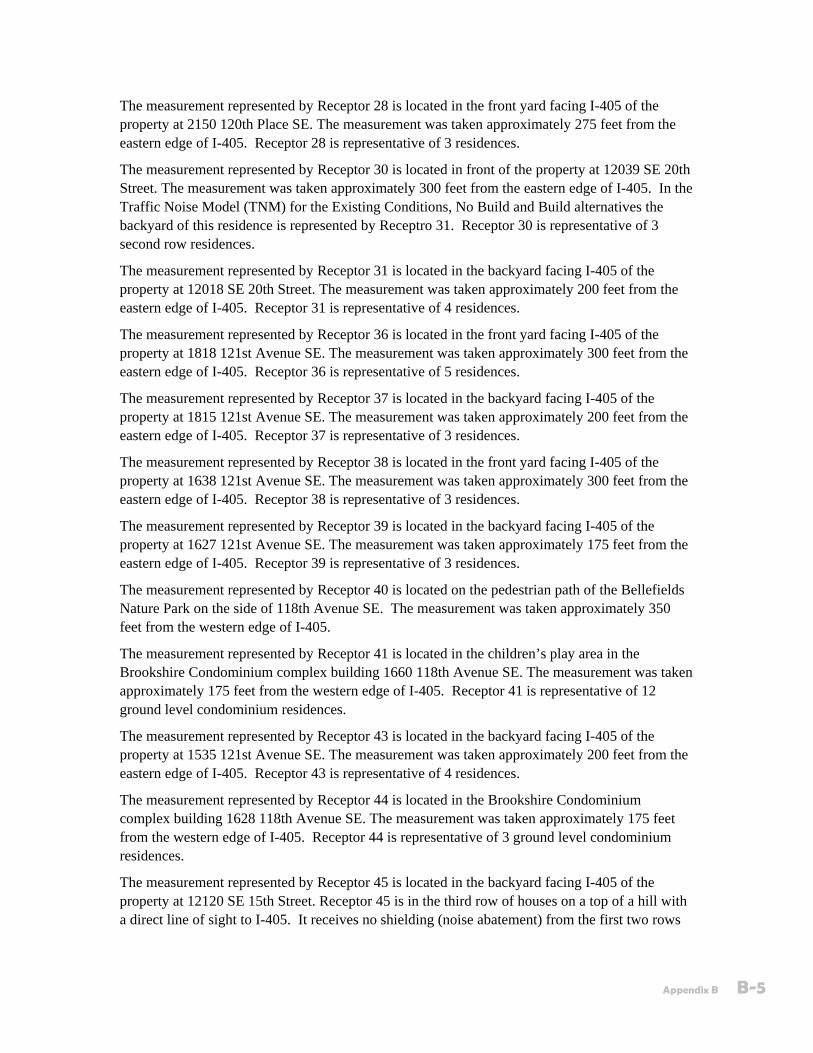
Appendix B B-5
The measurement represented by Receptor 28 is located in the front yard facing I-405 of the property at 2150 120th Place SE. The measurement was taken approximately 275 feet from the eastern edge of I-405. Receptor 28 is representative of 3 residences.
The measurement represented by Receptor 30 is located in front of the property at 12039 SE 20th Street. The measurement was taken approximately 300 feet from the eastern edge of I-405. In the Traffic Noise Model (TNM) for the Existing Conditions, No Build and Build alternatives the backyard of this residence is represented by Receptro 31. Receptor 30 is representative of 3 second row residences.
The measurement represented by Receptor 31 is located in the backyard facing I-405 of the property at 12018 SE 20th Street. The measurement was taken approximately 200 feet from the eastern edge of I-405. Receptor 31 is representative of 4 residences.
The measurement represented by Receptor 36 is located in the front yard facing I-405 of the property at 1818 121st Avenue SE. The measurement was taken approximately 300 feet from the eastern edge of I-405. Receptor 36 is representative of 5 residences.
The measurement represented by Receptor 37 is located in the backyard facing I-405 of the property at 1815 121st Avenue SE. The measurement was taken approximately 200 feet from the eastern edge of I-405. Receptor 37 is representative of 3 residences.
The measurement represented by Receptor 38 is located in the front yard facing I-405 of the property at 1638 121st Avenue SE. The measurement was taken approximately 300 feet from the eastern edge of I-405. Receptor 38 is representative of 3 residences.
The measurement represented by Receptor 39 is located in the backyard facing I-405 of the property at 1627 121st Avenue SE. The measurement was taken approximately 175 feet from the eastern edge of I-405. Receptor 39 is representative of 3 residences.
The measurement represented by Receptor 40 is located on the pedestrian path of the Bellefields Nature Park on the side of 118th Avenue SE. The measurement was taken approximately 350 feet from the western edge of I-405.
The measurement represented by Receptor 41 is located in the children’s play area in the Brookshire Condominium complex building 1660 118th Avenue SE. The measurement was taken approximately 175 feet from the western edge of I-405. Receptor 41 is representative of 12 ground level condominium residences.
The measurement represented by Receptor 43 is located in the backyard facing I-405 of the property at 1535 121st Avenue SE. The measurement was taken approximately 200 feet from the eastern edge of I-405. Receptor 43 is representative of 4 residences.
The measurement represented by Receptor 44 is located in the Brookshire Condominium complex building 1628 118th Avenue SE. The measurement was taken approximately 175 feet from the western edge of I-405. Receptor 44 is representative of 3 ground level condominium residences.
The measurement represented by Receptor 45 is located in the backyard facing I-405 of the property at 12120 SE 15th Street. Receptor 45 is in the third row of houses on a top of a hill with a direct line of sight to I-405. It receives no shielding (noise abatement) from the first two rows
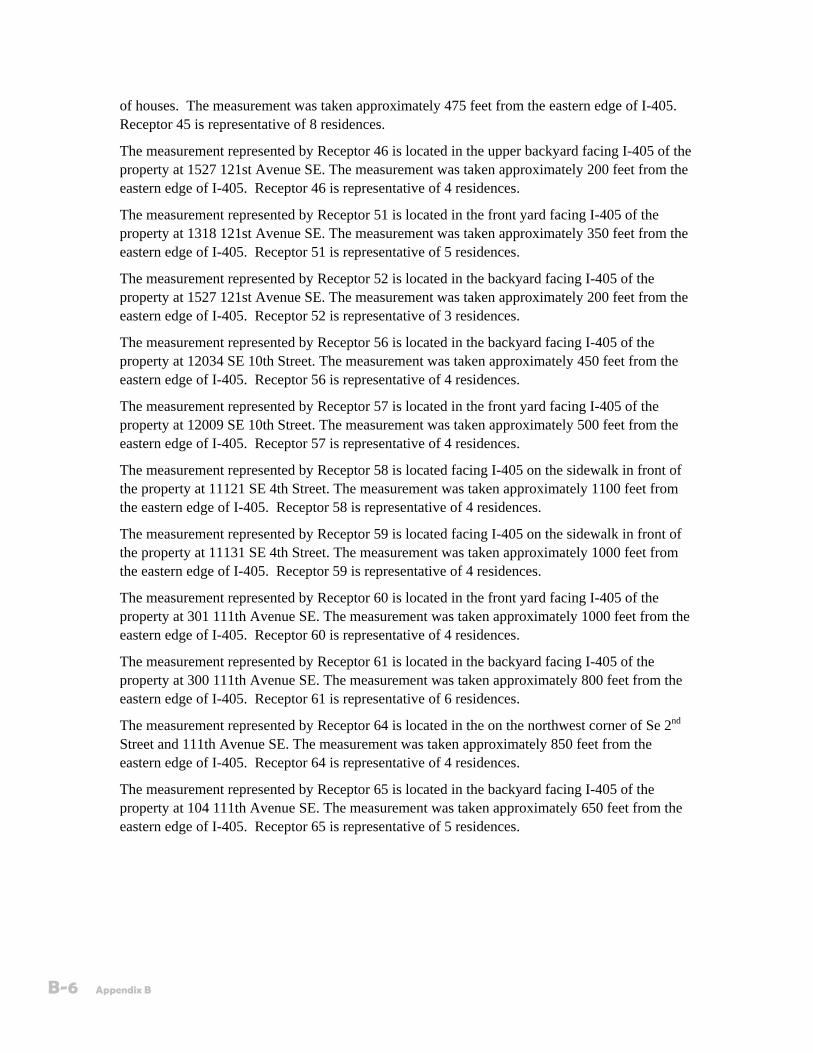
B-6 Appendix B
of houses. The measurement was taken approximately 475 feet from the eastern edge of I-405. Receptor 45 is representative of 8 residences.
The measurement represented by Receptor 46 is located in the upper backyard facing I-405 of the property at 1527 121st Avenue SE. The measurement was taken approximately 200 feet from the eastern edge of I-405. Receptor 46 is representative of 4 residences.
The measurement represented by Receptor 51 is located in the front yard facing I-405 of the property at 1318 121st Avenue SE. The measurement was taken approximately 350 feet from the eastern edge of I-405. Receptor 51 is representative of 5 residences.
The measurement represented by Receptor 52 is located in the backyard facing I-405 of the property at 1527 121st Avenue SE. The measurement was taken approximately 200 feet from the eastern edge of I-405. Receptor 52 is representative of 3 residences.
The measurement represented by Receptor 56 is located in the backyard facing I-405 of the property at 12034 SE 10th Street. The measurement was taken approximately 450 feet from the eastern edge of I-405. Receptor 56 is representative of 4 residences.
The measurement represented by Receptor 57 is located in the front yard facing I-405 of the property at 12009 SE 10th Street. The measurement was taken approximately 500 feet from the eastern edge of I-405. Receptor 57 is representative of 4 residences.
The measurement represented by Receptor 58 is located facing I-405 on the sidewalk in front of the property at 11121 SE 4th Street. The measurement was taken approximately 1100 feet from the eastern edge of I-405. Receptor 58 is representative of 4 residences.
The measurement represented by Receptor 59 is located facing I-405 on the sidewalk in front of the property at 11131 SE 4th Street. The measurement was taken approximately 1000 feet from the eastern edge of I-405. Receptor 59 is representative of 4 residences.
The measurement represented by Receptor 60 is located in the front yard facing I-405 of the property at 301 111th Avenue SE. The measurement was taken approximately 1000 feet from the eastern edge of I-405. Receptor 60 is representative of 4 residences.
The measurement represented by Receptor 61 is located in the backyard facing I-405 of the property at 300 111th Avenue SE. The measurement was taken approximately 800 feet from the eastern edge of I-405. Receptor 61 is representative of 6 residences.
The measurement represented by Receptor 64 is located in the on the northwest corner of Se 2nd Street and 111th Avenue SE. The measurement was taken approximately 850 feet from the eastern edge of I-405. Receptor 64 is representative of 4 residences.
The measurement represented by Receptor 65 is located in the backyard facing I-405 of the property at 104 111th Avenue SE. The measurement was taken approximately 650 feet from the eastern edge of I-405. Receptor 65 is representative of 5 residences.
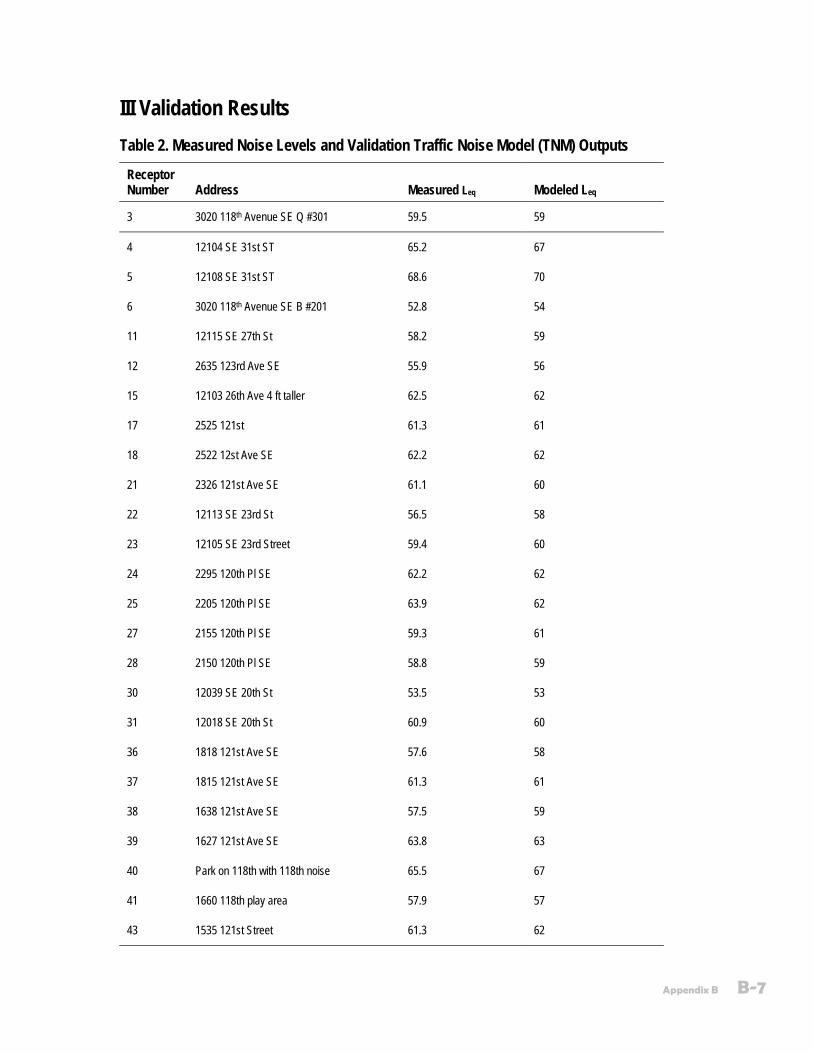
Appendix B B-7
III Validation Results Table 2. Measured Noise Levels and Validation Traffic Noise Model (TNM) Outputs
Receptor Number Address Measured Leq Modeled Leq
3 3020 118th Avenue SE Q #301 59.5 59
4 12104 SE 31st ST 65.2 67
5 12108 SE 31st ST 68.6 70
6 3020 118th Avenue SE B #201 52.8 54
11 12115 SE 27th St 58.2 59
12 2635 123rd Ave SE 55.9 56
15 12103 26th Ave 4 ft taller 62.5 62
17 2525 121st 61.3 61
18 2522 12st Ave SE 62.2 62
21 2326 121st Ave SE 61.1 60
22 12113 SE 23rd St 56.5 58
23 12105 SE 23rd Street 59.4 60
24 2295 120th Pl SE 62.2 62
25 2205 120th Pl SE 63.9 62
27 2155 120th Pl SE 59.3 61
28 2150 120th Pl SE 58.8 59
30 12039 SE 20th St 53.5 53
31 12018 SE 20th St 60.9 60
36 1818 121st Ave SE 57.6 58
37 1815 121st Ave SE 61.3 61
38 1638 121st Ave SE 57.5 59
39 1627 121st Ave SE 63.8 63
40 Park on 118th with 118th noise 65.5 67
41 1660 118th play area 57.9 57
43 1535 121st Street 61.3 62
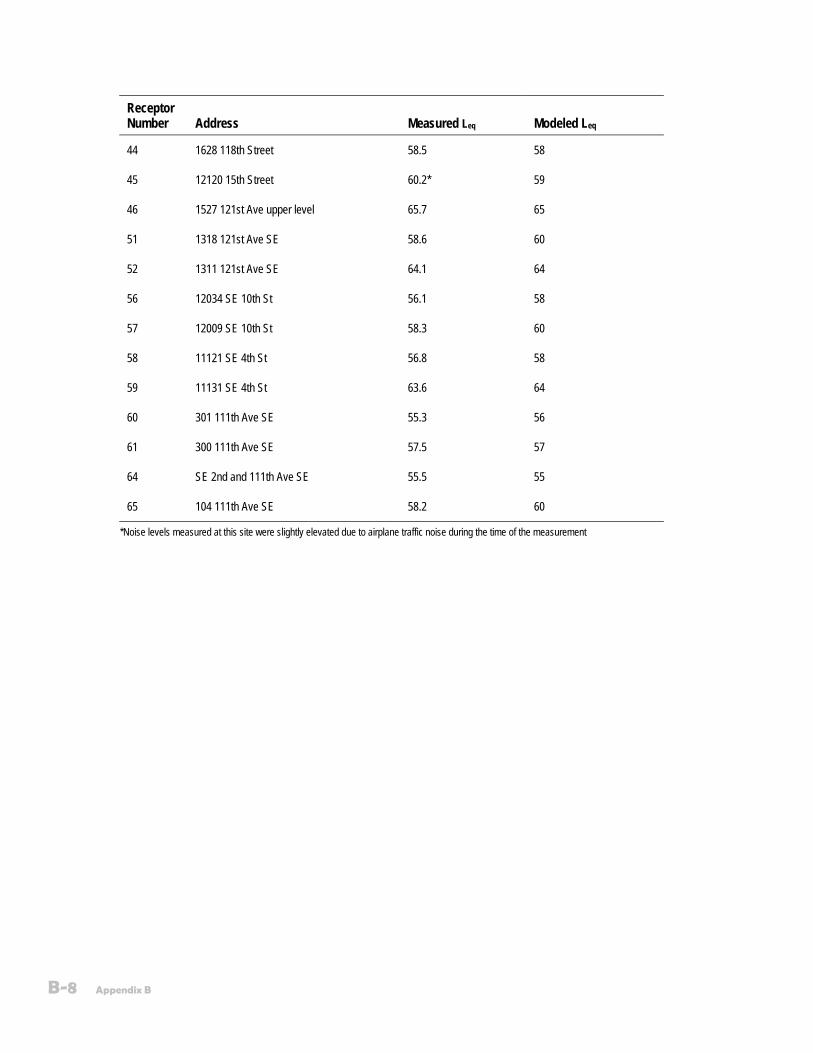
B-8 Appendix B
Receptor Number Address Measured Leq Modeled Leq
44 1628 118th Street 58.5 58
45 12120 15th Street 60.2* 59
46 1527 121st Ave upper level 65.7 65
51 1318 121st Ave SE 58.6 60
52 1311 121st Ave SE 64.1 64
56 12034 SE 10th St 56.1 58
57 12009 SE 10th St 58.3 60
58 11121 SE 4th St 56.8 58
59 11131 SE 4th St 63.6 64
60 301 111th Ave SE 55.3 56
61 300 111th Ave SE 57.5 57
64 SE 2nd and 111th Ave SE 55.5 55
65 104 111th Ave SE 58.2 60
*Noise levels measured at this site were slightly elevated due to airplane traffic noise during the time of the measurement

Appendix C Noise Barrier Analysis

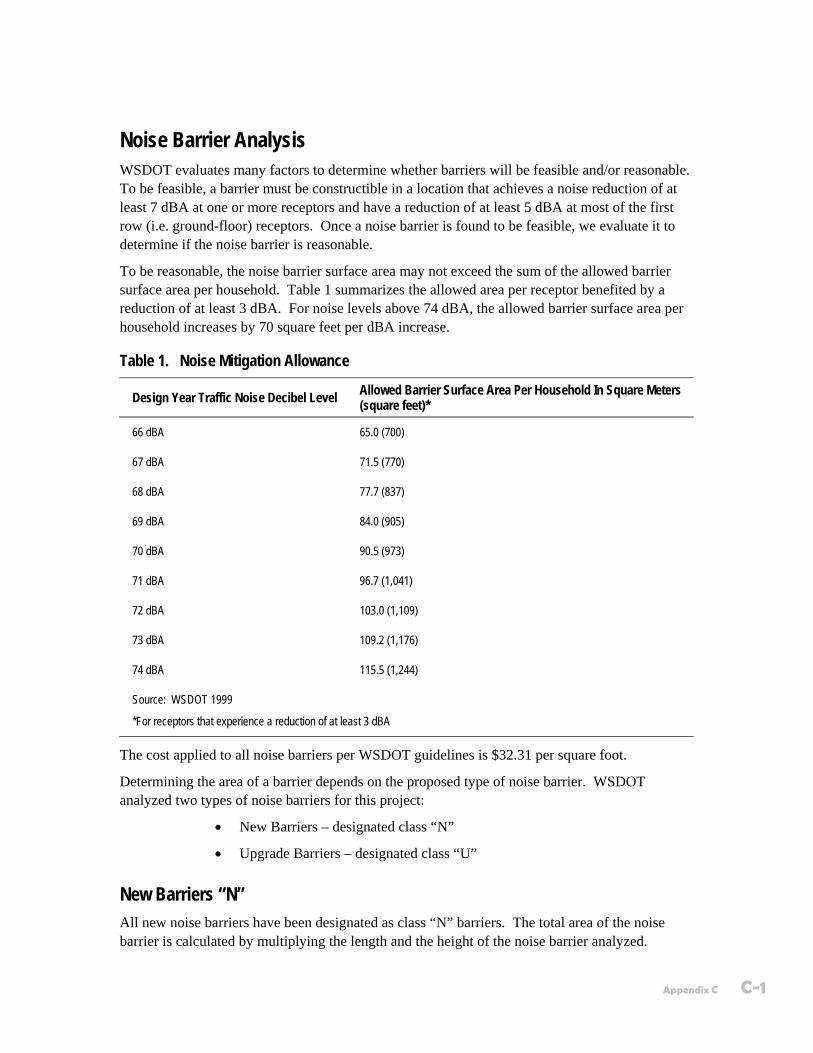
Appendix C C-1
Noise Barrier Analysis WSDOT evaluates many factors to determine whether barriers will be feasible and/or reasonable. To be feasible, a barrier must be constructible in a location that achieves a noise reduction of at least 7 dBA at one or more receptors and have a reduction of at least 5 dBA at most of the first row (i.e. ground-floor) receptors. Once a noise barrier is found to be feasible, we evaluate it to determine if the noise barrier is reasonable.
To be reasonable, the noise barrier surface area may not exceed the sum of the allowed barrier surface area per household. Table 1 summarizes the allowed area per receptor benefited by a reduction of at least 3 dBA. For noise levels above 74 dBA, the allowed barrier surface area per household increases by 70 square feet per dBA increase.
Table 1. Noise Mitigation Allowance
Design Year Traffic Noise Decibel Level Allowed Barrier Surface Area Per Household In Square Meters (square feet)*
66 dBA 65.0 (700)
67 dBA 71.5 (770)
68 dBA 77.7 (837)
69 dBA 84.0 (905)
70 dBA 90.5 (973)
71 dBA 96.7 (1,041)
72 dBA 103.0 (1,109)
73 dBA 109.2 (1,176)
74 dBA 115.5 (1,244)
Source: WSDOT 1999
*For receptors that experience a reduction of at least 3 dBA
The cost applied to all noise barriers per WSDOT guidelines is $32.31 per square foot.
Determining the area of a barrier depends on the proposed type of noise barrier. WSDOT analyzed two types of noise barriers for this project:
• New Barriers – designated class “N”
• Upgrade Barriers – designated class “U”
New Barriers “N” All new noise barriers have been designated as class “N” barriers. The total area of the noise barrier is calculated by multiplying the length and the height of the noise barrier analyzed.
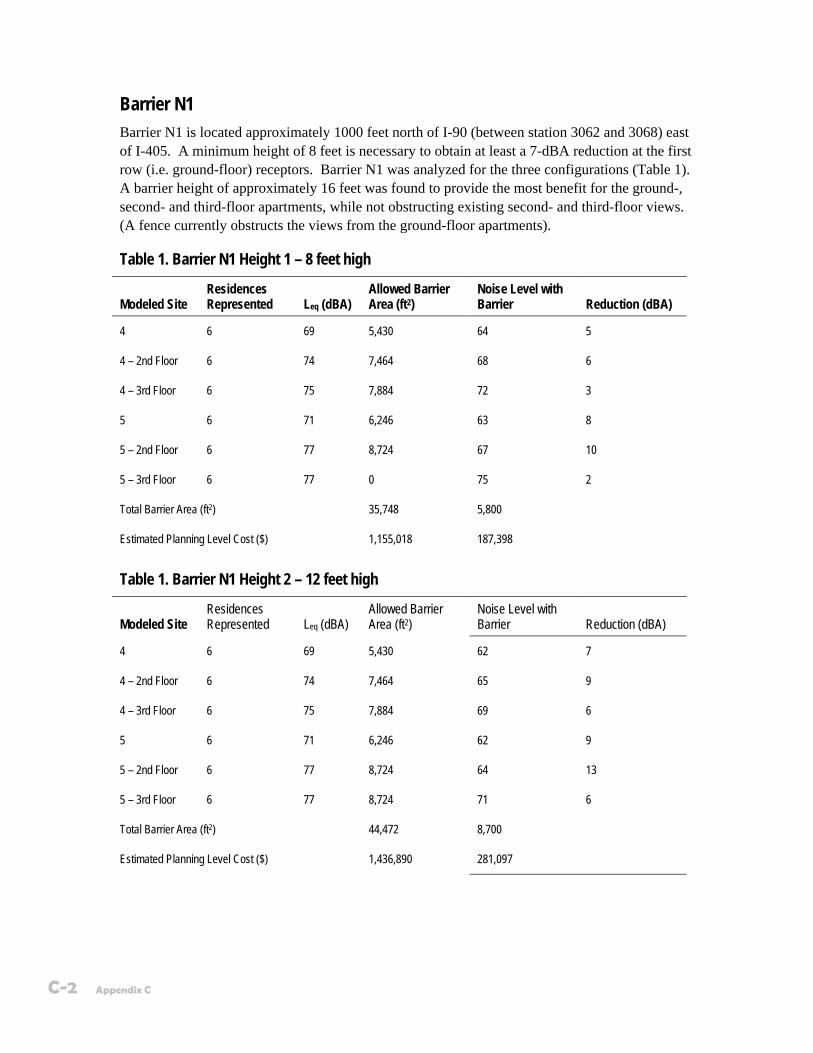
C-2 Appendix C
Barrier N1 Barrier N1 is located approximately 1000 feet north of I-90 (between station 3062 and 3068) east of I-405. A minimum height of 8 feet is necessary to obtain at least a 7-dBA reduction at the first row (i.e. ground-floor) receptors. Barrier N1 was analyzed for the three configurations (Table 1). A barrier height of approximately 16 feet was found to provide the most benefit for the ground-, second- and third-floor apartments, while not obstructing existing second- and third-floor views. (A fence currently obstructs the views from the ground-floor apartments).
Table 1. Barrier N1 Height 1 – 8 feet high
Modeled Site Residences Represented Leq (dBA)
Allowed Barrier Area (ft2)
Noise Level with Barrier Reduction (dBA)
4 6 69 5,430 64 5
4 – 2nd Floor 6 74 7,464 68 6
4 – 3rd Floor 6 75 7,884 72 3
5 6 71 6,246 63 8
5 – 2nd Floor 6 77 8,724 67 10
5 – 3rd Floor 6 77 0 75 2
Total Barrier Area (ft2) 35,748 5,800
Estimated Planning Level Cost ($) 1,155,018 187,398
Table 1. Barrier N1 Height 2 – 12 feet high
Modeled Site Residences Represented Leq (dBA)
Allowed Barrier Area (ft2)
Noise Level with Barrier Reduction (dBA)
4 6 69 5,430 62 7
4 – 2nd Floor 6 74 7,464 65 9
4 – 3rd Floor 6 75 7,884 69 6
5 6 71 6,246 62 9
5 – 2nd Floor 6 77 8,724 64 13
5 – 3rd Floor 6 77 8,724 71 6
Total Barrier Area (ft2) 44,472 8,700
Estimated Planning Level Cost ($) 1,436,890 281,097
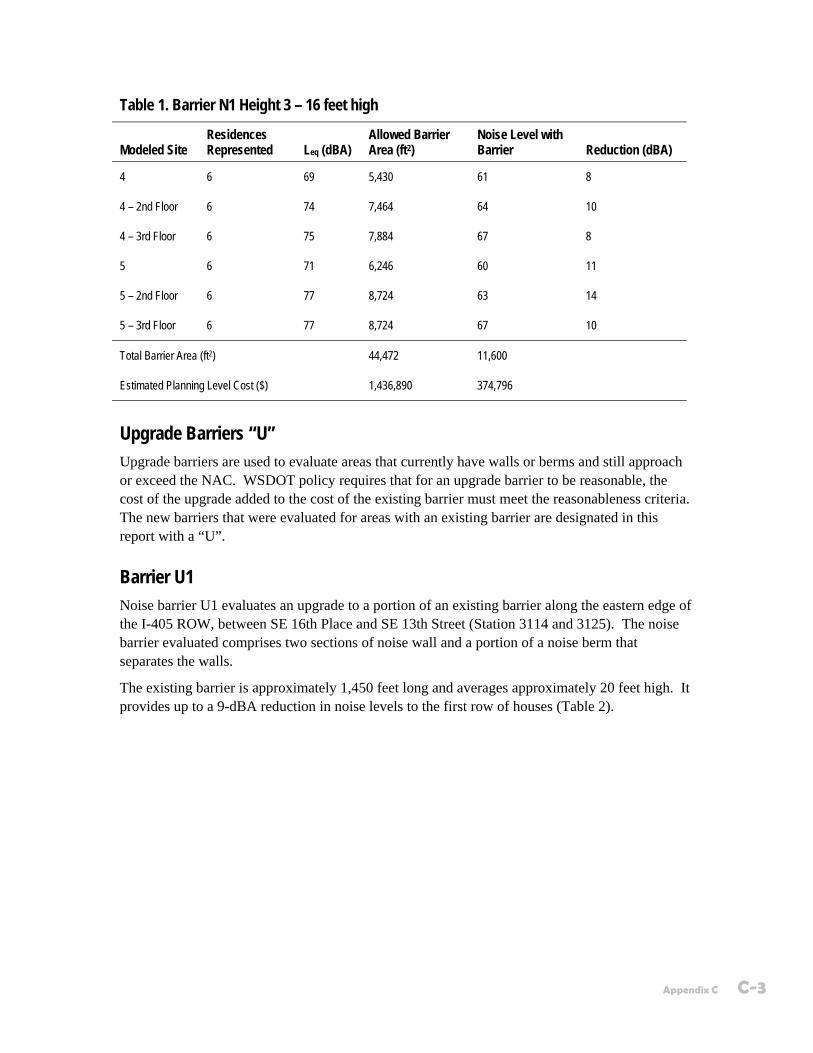
Appendix C C-3
Table 1. Barrier N1 Height 3 – 16 feet high
Modeled Site Residences Represented Leq (dBA)
Allowed Barrier Area (ft2)
Noise Level with Barrier Reduction (dBA)
4 6 69 5,430 61 8
4 – 2nd Floor 6 74 7,464 64 10
4 – 3rd Floor 6 75 7,884 67 8
5 6 71 6,246 60 11
5 – 2nd Floor 6 77 8,724 63 14
5 – 3rd Floor 6 77 8,724 67 10
Total Barrier Area (ft2) 44,472 11,600
Estimated Planning Level Cost ($) 1,436,890 374,796
Upgrade Barriers “U” Upgrade barriers are used to evaluate areas that currently have walls or berms and still approach or exceed the NAC. WSDOT policy requires that for an upgrade barrier to be reasonable, the cost of the upgrade added to the cost of the existing barrier must meet the reasonableness criteria. The new barriers that were evaluated for areas with an existing barrier are designated in this report with a “U”.
Barrier U1 Noise barrier U1 evaluates an upgrade to a portion of an existing barrier along the eastern edge of the I-405 ROW, between SE 16th Place and SE 13th Street (Station 3114 and 3125). The noise barrier evaluated comprises two sections of noise wall and a portion of a noise berm that separates the walls.
The existing barrier is approximately 1,450 feet long and averages approximately 20 feet high. It provides up to a 9-dBA reduction in noise levels to the first row of houses (Table 2).
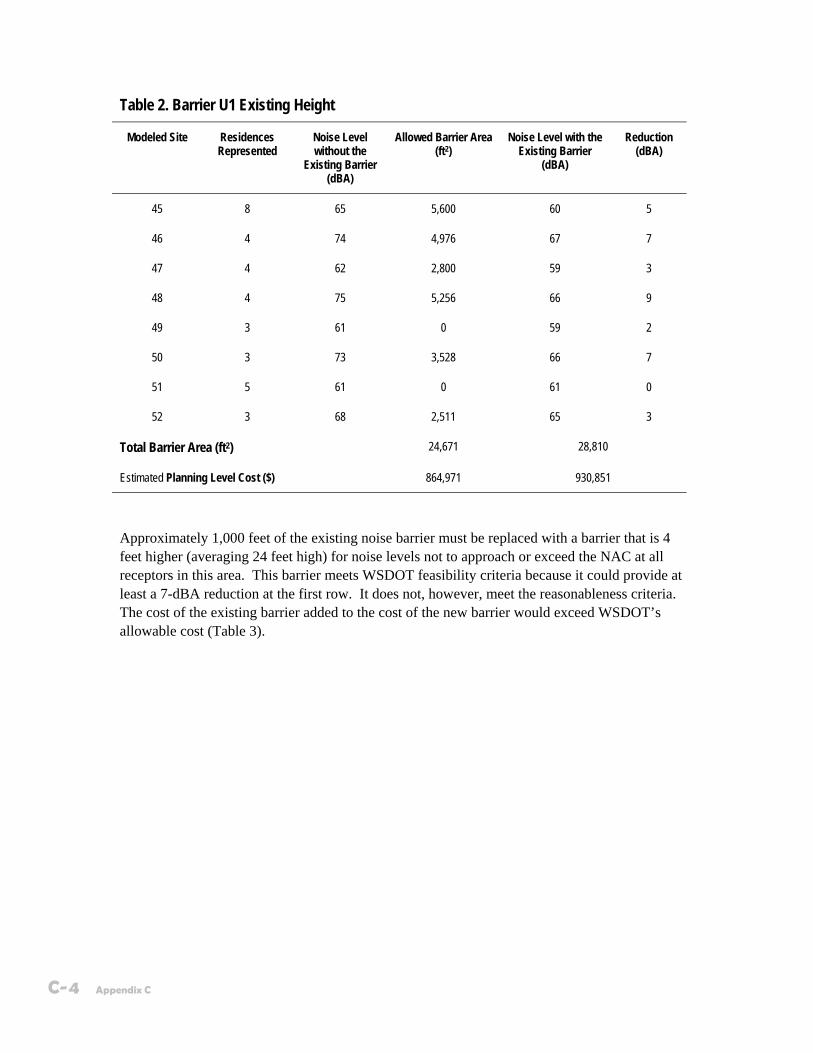
C-4 Appendix C
Table 2. Barrier U1 Existing Height
Modeled Site Residences Represented
Noise Level without the
Existing Barrier (dBA)
Allowed Barrier Area (ft2)
Noise Level with the Existing Barrier
(dBA)
Reduction (dBA)
45 8 65 5,600 60 5
46 4 74 4,976 67 7
47 4 62 2,800 59 3
48 4 75 5,256 66 9
49 3 61 0 59 2
50 3 73 3,528 66 7
51 5 61 0 61 0
52 3 68 2,511 65 3
Total Barrier Area (ft2) 24,671 28,810
Estimated Planning Level Cost ($) 864,971 930,851
Approximately 1,000 feet of the existing noise barrier must be replaced with a barrier that is 4 feet higher (averaging 24 feet high) for noise levels not to approach or exceed the NAC at all receptors in this area. This barrier meets WSDOT feasibility criteria because it could provide at least a 7-dBA reduction at the first row. It does not, however, meet the reasonableness criteria. The cost of the existing barrier added to the cost of the new barrier would exceed WSDOT’s allowable cost (Table 3).
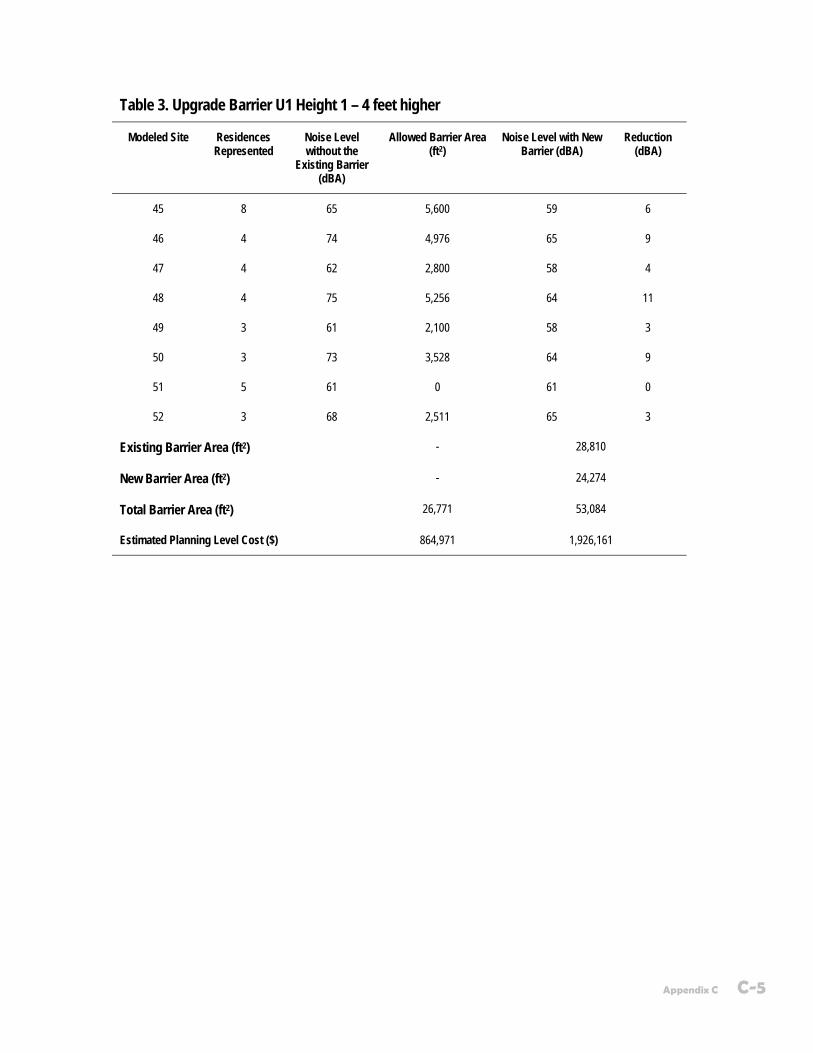
Appendix C C-5
Table 3. Upgrade Barrier U1 Height 1 – 4 feet higher
Modeled Site Residences Represented
Noise Level without the
Existing Barrier (dBA)
Allowed Barrier Area (ft2)
Noise Level with New Barrier (dBA)
Reduction (dBA)
45 8 65 5,600 59 6
46 4 74 4,976 65 9
47 4 62 2,800 58 4
48 4 75 5,256 64 11
49 3 61 2,100 58 3
50 3 73 3,528 64 9
51 5 61 0 61 0
52 3 68 2,511 65 3
Existing Barrier Area (ft2) - 28,810
New Barrier Area (ft2) - 24,274
Total Barrier Area (ft2) 26,771 53,084
Estimated Planning Level Cost ($) 864,971 1,926,161