Embed Size (px)
Citation preview

VTI s
ärtr
yck
339
• 200
0 Noise emission, frictionand rolling resistance of
car tires – Summary of anexperimental study
Paper published in the Proceedings of the 2000 NationalConference on Noise Control Engineering (NOISE-CON 2000)
2000 Dec. 3-5, Newport Beach, California, USA
Ulf Sandberg and Jerzy A. Ejsmont
Noise level distribution (CPX method) for the tested tires.
0
5
10
15
20
90 95 100 105 110
Noise level [dB(A)]
Nu
mb
ero
fte
sted
tyre
s
Speed rating S,T
Speed rating H
Speed rating V,Z,W
Winter tyres
Smooth asphalt (DAC16), 80 km/h
VTI särtryck 339 - 2000
Cover: VTI
Noise emission, friction and rolling resistance of car tires –Summary of an experimental study
PPPPPaper published in the Proceedings of the 2000 Nationalaper published in the Proceedings of the 2000 Nationalaper published in the Proceedings of the 2000 Nationalaper published in the Proceedings of the 2000 Nationalaper published in the Proceedings of the 2000 NationalConfConfConfConfConference on Noise Control Engineering (NOISE-CONerence on Noise Control Engineering (NOISE-CONerence on Noise Control Engineering (NOISE-CONerence on Noise Control Engineering (NOISE-CONerence on Noise Control Engineering (NOISE-CON2000) 2000 Dec. 3-5,2000) 2000 Dec. 3-5,2000) 2000 Dec. 3-5,2000) 2000 Dec. 3-5,2000) 2000 Dec. 3-5, Ne Ne Ne Ne Newporwporwporwporwport Beach,t Beach,t Beach,t Beach,t Beach, Califor Califor Califor Califor California,nia,nia,nia,nia, USA USA USA USA USA
Ulf Sandberg, VTI and Jerzy A. Ejsmont, TUG (TechnicalUniversity of Gdansk, Poland)
ISSN 1102-626X

Newport Beach, California
NOISE-CON 20002000 December 3-5
NOISE EMISSION, FRICTION AND ROLLING RESISTANCE OF CARTIRES - SUMMARY OF AN EXPERIMENTAL STUDY
Ulf SandbergSwedish National Road and Transport Research Institute (VTI)SE-58195 Linköping, Sweden E-mail: [email protected]
Jerzy A. EjsmontTechnical University of Gdansk (TUG)PL-80952 Gdansk, Poland E-mail: [email protected]
INTRODUCTION AND REVIEW OF EARLIER STUDIES
Car tires are supposed to be constructed for safe, economical, pleasant and environmentally friendlydriving. Three performance measures that would quite well represent the major operational characteris-tics of tires within the mentioned topics would be noise emission, wet friction and rolling resistance.Since the latter affects fuel consumption it also affects economy and exhaust emissions.
It is sometimes claimed that when trying to reduce exterior noise emission, there is a conflict withfriction and perhaps also with rolling resistance. The implication would be that one could not reducetire/road noise �any further� without sacrificing safety or economy. A European Union directive withnoise emission limits for tires is underway. It has been suggested that tires should meet certain limits alsowith regard to friction; assuming a conflict between requirements for low noise and high friction.Consequently, it is important to study this matter further.
Earlier studies have indicated that there is no consistent conflict between friction and noisecharacteristics with respect to road surfaces [1]. For 12 tires tested on 5 surfaces Denker found nosignificant noise-friction correlation, until he normalized friction values in an unusual way, in which casehe found weak conflicts between noise and friction [2]. Tests in 1992 by Nelson for 16 car and 9 trucktires indicated weak noise-safety correlations, suggesting a conflict between the parameters, but thiscould well have been biased by the inclusion of a wide range of tire widths [3]. According to Ejsmont, ageneral conflict between noise and rolling resistance properties could not be found [4]. A recent andquite comprehensive study in Germany [5], made on 48 car tires, concluded that neither was there anycorrelation between noise and rolling resistance, nor between noise and "wet braking". The same wasfound between noise and aquaplaning speed.
These authors conducted a pilot study in 1997 with the purpose to establish relations betweenexterior tire/road noise, wet friction and rolling resistance of current car tires [6]. The first conclusionssuggested that there is no significant conflict between friction and noise or between rolling resistance andnoise. This study was limited to 28 tires so it was decided to continue with testing in order to get higherconfidence of the results and to examine altogether about 100 modern car tires of similar size. The resultsof this study, which is believed to be the most comprehensive study of these relations so far, arepresented here.

2
METHODS AND EQUIPMENT
The study was conducted in co-operation between the Swedish National Road and Transport ResearchInstitute (VTI) and The Technical University of Gdansk (TUG) during the period 1997 - 1999. Table 1summarizes the methods and equipment used and the test parameters.
Exterior tire/road noise was measured by TUG on roads close to VTI with the Close ProximityMethod (CPX) according to the relevant parts of ISO/CD 11819-2, version 1997, i.e. with two micro-phones located close to the free-rolling test tire, in a trailer of the type shown in Fig. 1. The measuringdistance on each road surface was 640 m (divided into 4 sections of 160 m each), and two or more runswere made per test condition. Test speeds were 70 and 90 km/h.
The full program of tire/road noise tests was also performed in the laboratory of TUG using drumfacilities. Microphones were located as for the CPX tests. Instead of "real" road surfaces, three artificialreplicas mounted on the drum were used. The two smooth replicas were "copies" molded from actualpavements in order to get a very "realistic" texture whereas the third one was an imitation of a "chip seal"on a road. Two drums had to be used for this, since one drum could accommodate only two surfaces. SeeTable 2 for details about the surfaces. Other test conditions for the drum tests were the same as duringthe CPX measurements. The drum facilities are presented in Figs. 2, 3 and 4.
Rolling resistance was measured at 80, 100 and 120 km/h on the laboratory drum facility of TUG(Fig. 2) with a test tire rolling against a 1.7 m diameter drum. The tire was loaded against the drum sur-face by gravitational force and the rolling resistance coefficient was measured by the torque method. Therolling resistance measurements were made basically according to ISO/CD 8767 - 1997 (revision of ISO8767 from 1992) but there were deviations with respect to load and inflation: the load was fixed to4120 N and inflation was adjusted according to ISO but assuming that 300 kPa corresponds to maximumload. Temperature corrections were made to a reference temperature of 24 oC. Two surfaces were used -a very smooth surface called "Safety Walk" (similar to rough sandpaper) and a very rough-textured imi-tation of a chip seal called "APS". The latter was identical to that used for noise tests on the (same) drum.
Fig. 1 Trailer "Tiresonic Mk2" from TUG used for measurement of noise with the CPX method. The testtire is in the center of the enclosure, two microphones are located 0.2 m left of the test tire sidewall, at
± 45o in relation to the driving direction.

3
Fig. 2 (right)The drum facility for measur-ing tire/road noise and rollingresistance on the Safety Walkand APS surfaces. Drum dia-meter 1.7 m. When taking thispicture, the APS surface wasnot present on the drum.
Fig. 3 (below)The trailer "Tiresonic Mk2"mounted on the drum facility,with test tire mounted inside theenclosure
Fig. 4 (below)The same facility as in Fig. 3, but view inside theenclosure. Drum of diameter 1.5 m equipped with thereplica road surface "ISO". The picture shows thetire/drum contact area; only the "rear" microphone isvisible in this picture (position "-45o").

4
Friction was measured by VTI with the �Skiddometer� BV12 (Fig. 5) running at 70 km/h with the testtire run with a variable slip from 0 to 100 % (10 such cycles averaged). In this way, the entire friction-versus-slip curve was obtained, although in this paper only values read at the maximum friction(optimum slip - corresponding to that of an ABS system) and at locked wheel (100 % slip - correspon-ding to braking with blocked wheels) are used. The friction coefficient was calculated from the measuredlongitudinal and normal forces. Before each measurement series, the normal force was set at 4000 N andthe loaded radius of the test tire was measured. Slip was calculated from the measurements of loadedradius, rotational speed and vehicle speed. The surface was wetted, with approx. 0.5 mm average waterdepth. Since friction is a problem normally only on a wet and smooth road, no friction measurementswere made on the rough-textured road surfaces. This road had a texture reasonably similar to that of sur-faces considered for tire friction regulation and was the same as used in the huge EU project VERT run-ning simultaneously, a project aiming at exploring the dynamic properties of tires including friction [8].
Fig. 5 The BV 12 Skiddometer used for the friction measurements. The test tire, in front of which wateris injected, is braked from 0 to 100 % slip and back to 0. This cycle is run ten times.
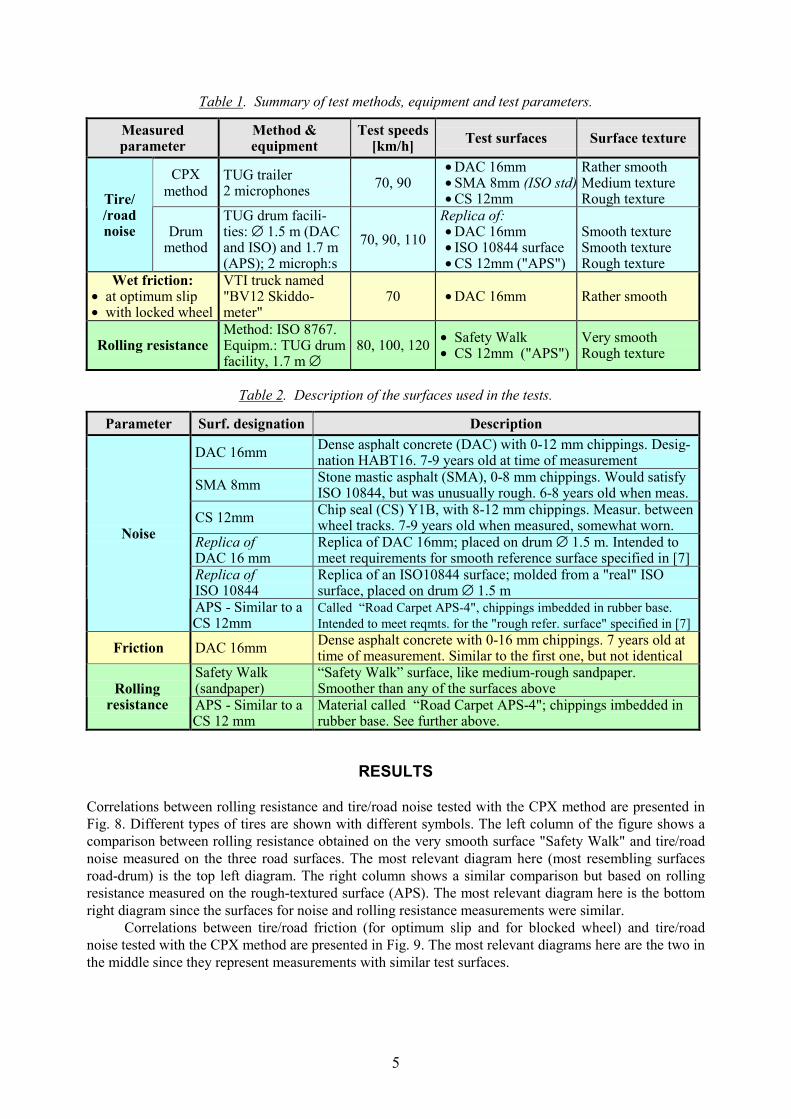
Table 1 presents a summary of the methods, equipment and test parameters. The test surfaces are furtherdescribed in Table 2; all except these used in the indoor measurements were located near VTI ontrafficked roads. The surfaces designated DAC 16mm and CS 12mm were selected to satisfy the specifi-cation for one smooth and one rough reference surface in a proposal put forward to ECE/GRB in 1990[7]. The surface designated SMA 8mm was selected because it met the requirements of the ISO 10844reference surface standard. However, it already in new condition had an unusually rough texture (for anISO surface), something which was accentuated in the worn condition when it was used for our tests. Itwas originally designated "ISO" but this term has now been dropped in order not to mislead the reader.This does not apply to the "ISO" surface on the drum, which was made from a test track surface that wasformally approved as an ISO surface. Road surface textures are illustrated in Fig. 6; drum surfaces(replicas) in Fig. 7. The tested tires are briefly described in Table 4. In total, the data set comprised 103samples of modern car tires selected to be as representative as practical, but not all tires were possible tomeasure for all parameters; thus the presented correlations comprise in general 70-90 tires.
5
Table 1. Summary of test methods, equipment and test parameters.
Measuredparameter
Method &equipment
Test speeds[km/h] Test surfaces Surface texture
CPXmethod
TUG trailer2 microphones 70, 90
• DAC 16mm• SMA 8mm (ISO std)• CS 12mm
Rather smoothMedium textureRough textureTire/
/roadnoise Drum
method
TUG drum facili-ties: ∅ 1.5 m (DACand ISO) and 1.7 m(APS); 2 microph:s
70, 90, 110Replica of:• DAC 16mm• ISO 10844 surface• CS 12mm ("APS")
Smooth textureSmooth textureRough texture
Wet friction:• at optimum slip• with locked wheel
VTI truck named"BV12 Skiddo-meter"
70 • DAC 16mm Rather smooth
Rolling resistanceMethod: ISO 8767.Equipm.: TUG drumfacility, 1.7 m ∅
80, 100, 120 • Safety Walk• CS 12mm ("APS")
Very smoothRough texture
Table 2. Description of the surfaces used in the tests.
Parameter Surf. designation Description
DAC 16mm Dense asphalt concrete (DAC) with 0-12 mm chippings. Desig-nation HABT16. 7-9 years old at time of measurement
SMA 8mm Stone mastic asphalt (SMA), 0-8 mm chippings. Would satisfyISO 10844, but was unusually rough. 6-8 years old when meas.
CS 12mm Chip seal (CS) Y1B, with 8-12 mm chippings. Measur. betweenwheel tracks. 7-9 years old when measured, somewhat worn.
Replica ofDAC 16 mm
Replica of DAC 16mm; placed on drum ∅ 1.5 m. Intended tomeet requirements for smooth reference surface specified in [7]
Replica ofISO 10844
Replica of an ISO10844 surface; molded from a "real" ISOsurface, placed on drum ∅ 1.5 m
Noise
APS - Similar to aCS 12mm
Called �Road Carpet APS-4", chippings imbedded in rubber base.Intended to meet reqmts. for the "rough refer. surface" specified in [7]
Friction DAC 16mm Dense asphalt concrete with 0-16 mm chippings. 7 years old attime of measurement. Similar to the first one, but not identical
Safety Walk(sandpaper)
�Safety Walk� surface, like medium-rough sandpaper.Smoother than any of the surfaces aboveRolling
resistance APS - Similar to aCS 12 mm
Material called �Road Carpet APS-4"; chippings imbedded inrubber base. See further above.
RESULTS
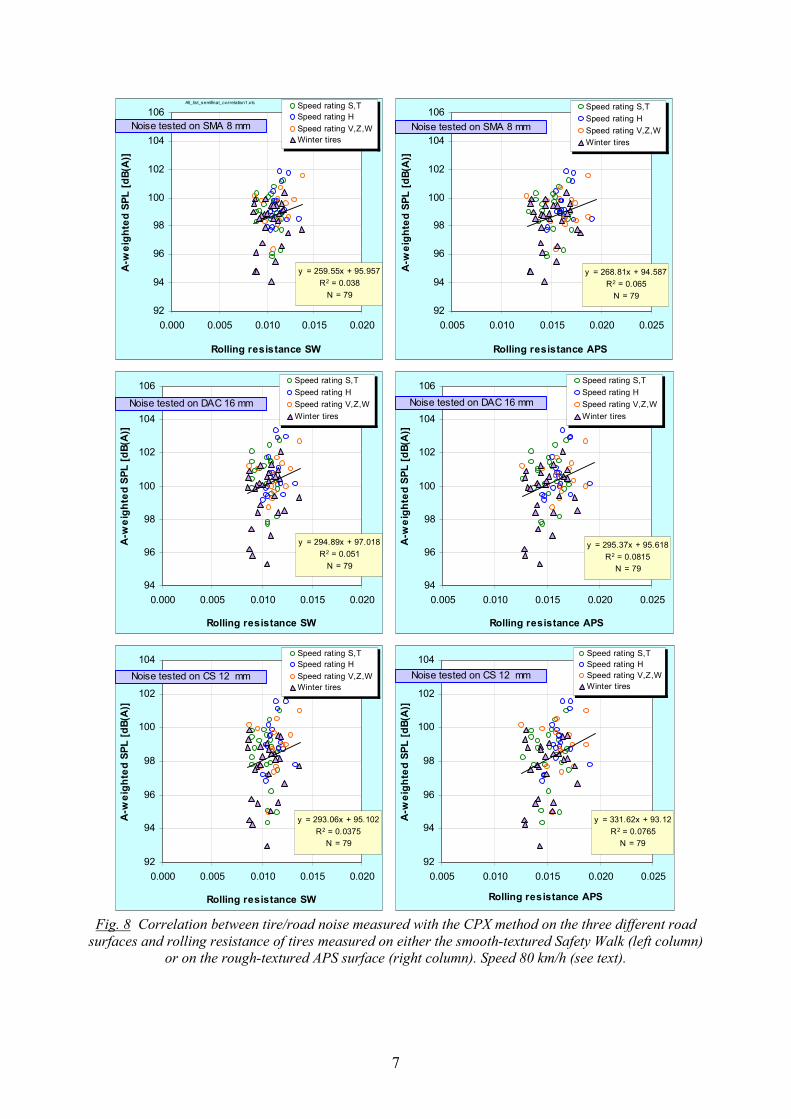
Correlations between rolling resistance and tire/road noise tested with the CPX method are presented inFig. 8. Different types of tires are shown with different symbols. The left column of the figure shows acomparison between rolling resistance obtained on the very smooth surface "Safety Walk" and tire/roadnoise measured on the three road surfaces. The most relevant diagram here (most resembling surfacesroad-drum) is the top left diagram. The right column shows a similar comparison but based on rollingresistance measured on the rough-textured surface (APS). The most relevant diagram here is the bottomright diagram since the surfaces for noise and rolling resistance measurements were similar.
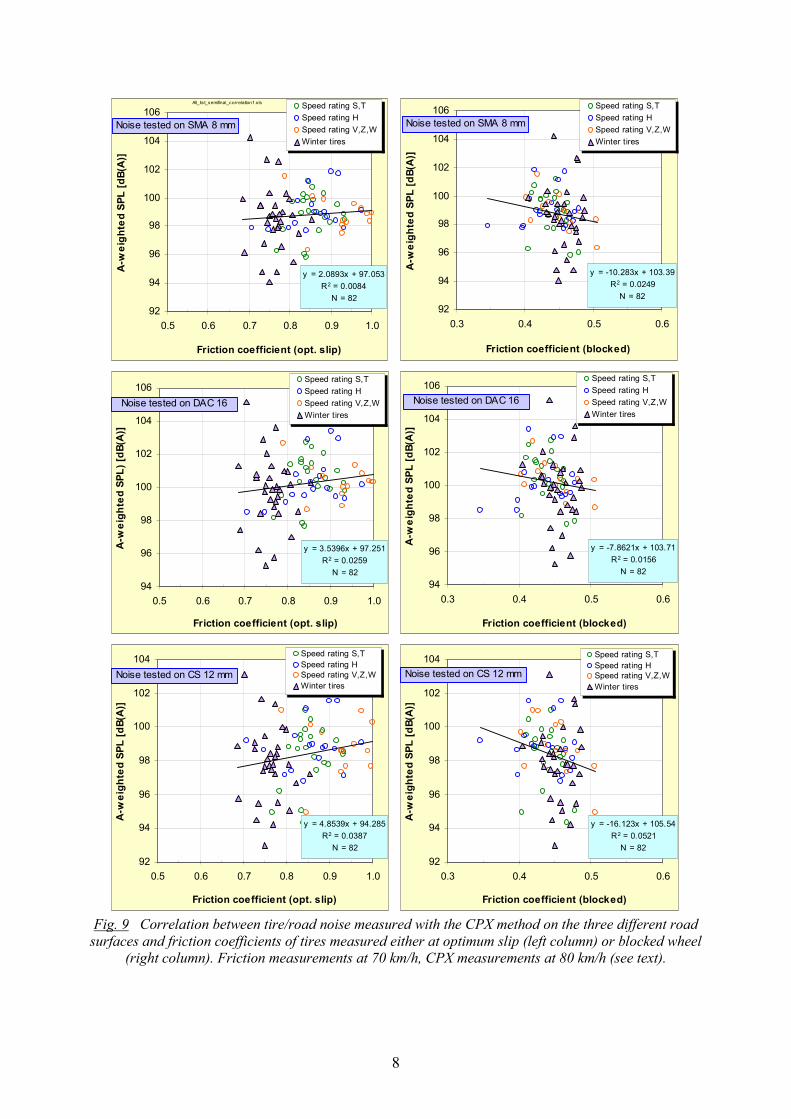
Correlations between tire/road friction (for optimum slip and for blocked wheel) and tire/roadnoise tested with the CPX method are presented in Fig. 9. The most relevant diagrams here are the two inthe middle since they represent measurements with similar test surfaces.

6
Fig. 6 (left) The three road surfaces used in the experiment, from top to bottom:DAC 16mm, SMA 8 mm,CS 12mm. Note that the scale in this figure is slightly more expanded than in Fig. 7.Fig. 7 (right) The replica road surfaces on the drums used in the experiment, from top to bottom:DAC16mm, ISO 10844, APS. Note that the scale in this figure is slightly more compressed than in Fig. 6.
Table 3. Overview of the tested tires. All tires were in new or "as new" condition.
Type of tires Number oftires Dimensions Remarks
"Summer" tires,speed class S and T 30 27 of 185/65R15,
3 of 195/65R15 Including 4 retreaded tires
"Summer" tires,speed class H 17
3 of 185/65R15,5 of 195/60R15,8 of 195/65R151 of 195/70R15
Including two retreaded tires
"Summer" tires,speed class V or Z 15
2 of 185/65R15,1 of 195/50R15,2 of 195/55R15,4 of 195/60R15,5 of 195/65R15
Including one retreaded tire
"Winter" tires (M+S) 341 of 175/70R14,2 of 185R14,25 of 185/65R15,6 of 195/65R15
15 tires classified as "Friction"tires;8 retreaded tires
"Winter" tires with studs 7 7 of 185/65R15 Including one retreaded tire
7
y = 259.55x + 95.957R2 = 0.038
N = 79
92
94
96
98
100
102
104
106
0.000 0.005 0.010 0.015 0.020
Rolling resistance SW
A-w
eigh
ted
SPL
[dB(
A)]
Speed rating S,TSpeed rating HSpeed rating V,Z,WWinter tires
All_list_semifinal_correlation1.x ls
Noise tested on SMA 8 mm
y = 268.81x + 94.587R2 = 0.065
N = 79
92
94
96
98
100
102
104
106
0.005 0.010 0.015 0.020 0.025
Rolling resistance APS
A-w
eigh
ted
SPL
[dB(
A)]
Speed rating S,TSpeed rating HSpeed rating V,Z,WWinter tires
Noise tested on SMA 8 mm
y = 294.89x + 97.018R2 = 0.051
N = 79
94
96
98
100
102
104
106
0.000 0.005 0.010 0.015 0.020
Rolling resistance SW
A-w
eigh
ted
SPL
[dB(
A)]
Speed rating S,TSpeed rating HSpeed rating V,Z,WWinter tires
Noise tested on DAC 16 mm
y = 295.37x + 95.618R2 = 0.0815
N = 79
94
96
98
100
102
104
106
0.005 0.010 0.015 0.020 0.025
Rolling resistance APS
A-w
eigh
ted
SPL
[dB(
A)]
Speed rating S,TSpeed rating HSpeed rating V,Z,WWinter tires
Noise tested on DAC 16 mm
y = 293.06x + 95.102R2 = 0.0375
N = 79
92
94
96
98
100
102
104
0.000 0.005 0.010 0.015 0.020
Rolling resistance SW
A-w
eigh
ted
SPL
[dB(
A)]
Speed rating S,TSpeed rating HSpeed rating V,Z,WWinter tires
Noise tested on CS 12 mm
y = 331.62x + 93.12R2 = 0.0765
N = 79
92
94
96
98
100
102
104
0.005 0.010 0.015 0.020 0.025
Rolling resistance APS
A-w
eigh
ted
SPL
[dB(
A)]
Speed rating S,TSpeed rating HSpeed rating V,Z,WWinter tires
Noise tested on CS 12 mm
Fig. 8 Correlation between tire/road noise measured with the CPX method on the three different roadsurfaces and rolling resistance of tires measured on either the smooth-textured Safety Walk (left column)
or on the rough-textured APS surface (right column). Speed 80 km/h (see text).
8
y = 2.0893x + 97.053R2 = 0.0084
N = 8292
94
96
98
100
102
104
106
0.5 0.6 0.7 0.8 0.9 1.0
Friction coefficient (opt. slip)
A-w
eigh
ted
SPL
[dB(
A)]
Speed rating S,TSpeed rating HSpeed rating V,Z,WWinter tires
All_lis t_semifinal_correlation1.xls
Noise tested on SMA 8 mm
y = -10.283x + 103.39R2 = 0.0249
N = 8292
94
96
98
100
102
104
106
0.3 0.4 0.5 0.6
Friction coefficient (blocked)
A-w
eigh
ted
SPL
[dB(
A)]
Speed rating S,TSpeed rating HSpeed rating V,Z,WWinter tires
Noise tested on SMA 8 mm
y = 3.5396x + 97.251R2 = 0.0259
N = 82
94
96
98
100
102
104
106
0.5 0.6 0.7 0.8 0.9 1.0
Friction coefficient (opt. slip)
A-w
eigh
ted
SPL)
[dB(
A)]
Speed rating S,TSpeed rating HSpeed rating V,Z,WWinter tires
Noise tested on DAC 16
y = -7.8621x + 103.71R2 = 0.0156
N = 8294
96
98
100
102
104
106
0.3 0.4 0.5 0.6
Friction coefficient (blocked)
A-w
eigh
ted
SPL
[dB(
A)]
Speed rating S,TSpeed rating HSpeed rating V,Z,WWinter tires
Noise tested on DAC 16
y = 4.8539x + 94.285R2 = 0.0387
N = 82
92
94
96
98
100
102
104
0.5 0.6 0.7 0.8 0.9 1.0
Friction coefficient (opt. slip)
A-w
eigh
ted
SPL
[dB(
A)]
Speed rating S,TSpeed rating HSpeed rating V,Z,WWinter tires
Noise tested on CS 12 mm
y = -16.123x + 105.54R2 = 0.0521
N = 82
92
94
96
98
100
102
104
0.3 0.4 0.5 0.6
Friction coefficient (blocked)
A-w
eigh
ted
SPL
[dB(
A)]
Speed rating S,TSpeed rating HSpeed rating V,Z,WWinter tires
Noise tested on CS 12 mm
Fig. 9 Correlation between tire/road noise measured with the CPX method on the three different roadsurfaces and friction coefficients of tires measured either at optimum slip (left column) or blocked wheel
(right column). Friction measurements at 70 km/h, CPX measurements at 80 km/h (see text).
9
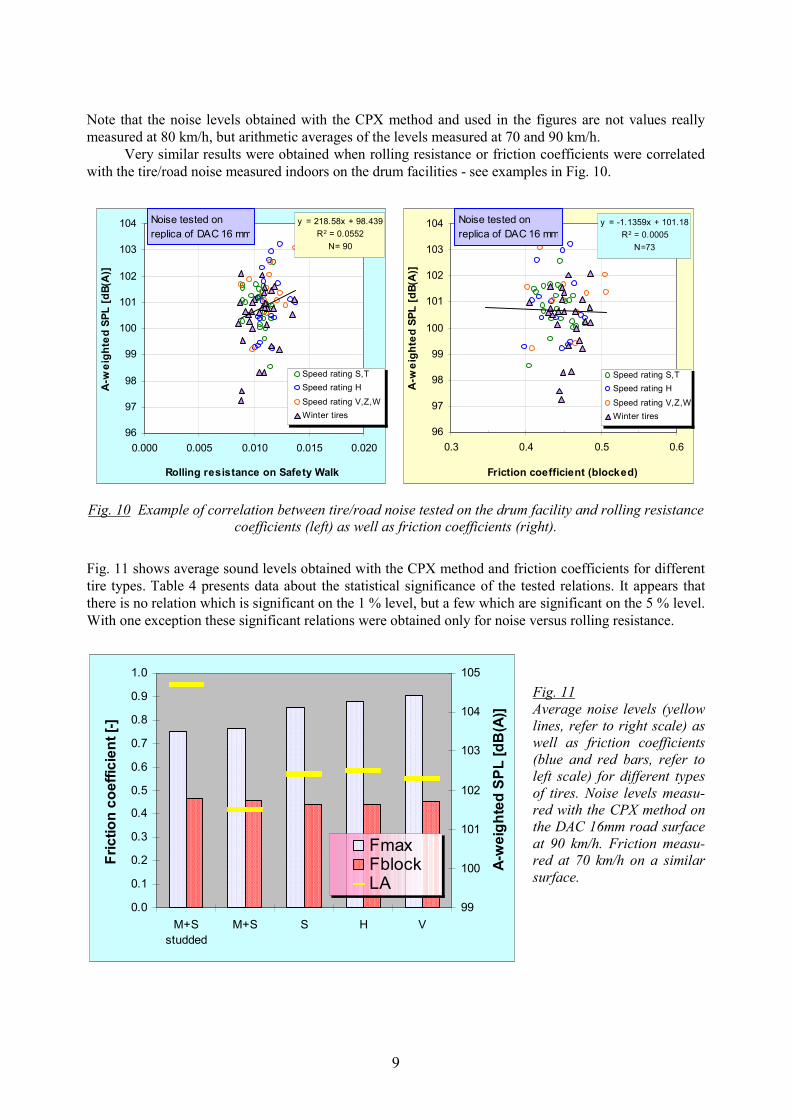
Note that the noise levels obtained with the CPX method and used in the figures are not values reallymeasured at 80 km/h, but arithmetic averages of the levels measured at 70 and 90 km/h.
Very similar results were obtained when rolling resistance or friction coefficients were correlatedwith the tire/road noise measured indoors on the drum facilities - see examples in Fig. 10.
y = 218.58x + 98.439R2 = 0.0552
N= 90
96
97
98
99
100
101
102
103
104
0.000 0.005 0.010 0.015 0.020
Rolling resistance on Safety Walk
A-w
eigh
ted
SPL
[dB(
A)]
Speed rating S,TSpeed rating HSpeed rating V,Z,WWinter tires
Noise tested on replica of DAC 16 mm
y = -1.1359x + 101.18R2 = 0.0005
N=73
96
97
98
99
100
101
102
103
104
0.3 0.4 0.5 0.6
Friction coefficient (blocked)
A-w
eigh
ted
SPL
[dB(
A)]
Speed rating S,TSpeed rating HSpeed rating V,Z,WWinter tires
Noise tested on replica of DAC 16 mm
Fig. 10 Example of correlation between tire/road noise tested on the drum facility and rolling resistancecoefficients (left) as well as friction coefficients (right).
Fig. 11 shows average sound levels obtained with the CPX method and friction coefficients for differenttire types. Table 4 presents data about the statistical significance of the tested relations. It appears thatthere is no relation which is significant on the 1 % level, but a few which are significant on the 5 % level.With one exception these significant relations were obtained only for noise versus rolling resistance.
Fig. 11Average noise levels (yellowlines, refer to right scale) aswell as friction coefficients(blue and red bars, refer toleft scale) for different typesof tires. Noise levels measu-red with the CPX method onthe DAC 16mm road surfaceat 90 km/h. Friction measu-red at 70 km/h on a similarsurface.
0.0
0.1
0.2
0.3
0.4
0.5
0.6
0.7
0.8
0.9
1.0
M+Sstudded
M+S S H V99
100
101
102
103
104
105
FmaxFblockLA
Fric
tion
coef
ficie
nt [-
]
A-w
eigh
ted
SPL
[dB
(A)]
10
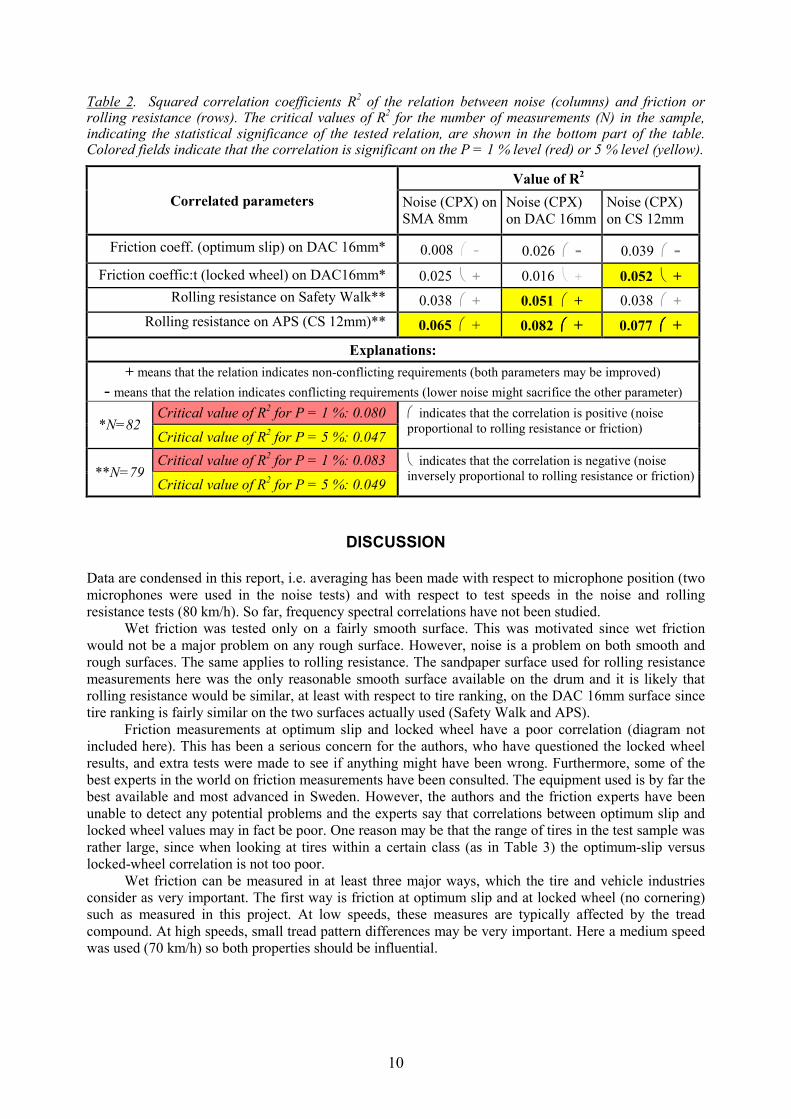
Table 2. Squared correlation coefficients R2 of the relation between noise (columns) and friction orrolling resistance (rows). The critical values of R2 for the number of measurements (N) in the sample,indicating the statistical significance of the tested relation, are shown in the bottom part of the table.Colored fields indicate that the correlation is significant on the P = 1 % level (red) or 5 % level (yellow).
Value of R2
Correlated parameters Noise (CPX) onSMA 8mm
Noise (CPX)on DAC 16mm
Noise (CPX)on CS 12mm
Friction coeff. (optimum slip) on DAC 16mm* 0.008 - 0.026 - 0.039 -Friction coeffic:t (locked wheel) on DAC16mm* 0.025 + 0.016 + 0.052 +
Rolling resistance on Safety Walk** 0.038 + 0.051 + 0.038 +Rolling resistance on APS (CS 12mm)** 0.065 + 0.082 + 0.077 +
Explanations:+ means that the relation indicates non-conflicting requirements (both parameters may be improved)
- means that the relation indicates conflicting requirements (lower noise might sacrifice the other parameter)Critical value of R2 for P = 1 %: 0.080
*N=82Critical value of R2 for P = 5 %: 0.047
indicates that the correlation is positive (noiseproportional to rolling resistance or friction)
Critical value of R2 for P = 1 %: 0.083**N=79
Critical value of R2 for P = 5 %: 0.049
indicates that the correlation is negative (noiseinversely proportional to rolling resistance or friction)
DISCUSSION
Data are condensed in this report, i.e. averaging has been made with respect to microphone position (twomicrophones were used in the noise tests) and with respect to test speeds in the noise and rollingresistance tests (80 km/h). So far, frequency spectral correlations have not been studied.
Wet friction was tested only on a fairly smooth surface. This was motivated since wet frictionwould not be a major problem on any rough surface. However, noise is a problem on both smooth andrough surfaces. The same applies to rolling resistance. The sandpaper surface used for rolling resistancemeasurements here was the only reasonable smooth surface available on the drum and it is likely thatrolling resistance would be similar, at least with respect to tire ranking, on the DAC 16mm surface sincetire ranking is fairly similar on the two surfaces actually used (Safety Walk and APS).
Friction measurements at optimum slip and locked wheel have a poor correlation (diagram notincluded here). This has been a serious concern for the authors, who have questioned the locked wheelresults, and extra tests were made to see if anything might have been wrong. Furthermore, some of thebest experts in the world on friction measurements have been consulted. The equipment used is by far thebest available and most advanced in Sweden. However, the authors and the friction experts have beenunable to detect any potential problems and the experts say that correlations between optimum slip andlocked wheel values may in fact be poor. One reason may be that the range of tires in the test sample wasrather large, since when looking at tires within a certain class (as in Table 3) the optimum-slip versuslocked-wheel correlation is not too poor.
Wet friction can be measured in at least three major ways, which the tire and vehicle industriesconsider as very important. The first way is friction at optimum slip and at locked wheel (no cornering)such as measured in this project. At low speeds, these measures are typically affected by the treadcompound. At high speeds, small tread pattern differences may be very important. Here a medium speedwas used (70 km/h) so both properties should be influential.

11
A second measure of friction performance is "wet handling". In the evaluation of wet handlingcharacteristics, the tires are driven through relatively small radius turns at speed on smooth asphaltusually with a consistent water depth of around 1 mm. This is deeper than the 0.5 mm average depthevaluated with the skiddometer in this project. Wet handling of tires is improved by pattern changes toevacuate water more efficiently. The increased void content and efficient flow channels provided in thetread pattern for this purpose are by many believed to have a negative effect on noise.
A third measure is a deep-water hydroplaning test; a consistent water depth of around 6 mm isoften used. In both the wet handling and deep-water hydroplaning tests, the ability of the tread patternvoids to evacuate the water is critical.
The friction measuring method chosen here is similar to the method put forward recently to bothECE/GRRF, ECE/GRB and to the European Commission, by English experts. They have suggested thesame type of measurement and water depth, but included more speeds and runs. This is natural since it ismeant to become a regulation, so one should have the best accuracy. The intention by the English wasthat the friction test should make sure that when introducing noise limits to tires, no sacrifice of safetyshould be made. Recognizing that also other measures of friction would be justified to use - like the wethandling and aquaplaning methods - the method chosen here was judged to be the most relevant of thethree and also the only method that the project budget allowed.
Had the methods employing deeper water been used here, it is not likely that the relations obtainedwould have been very different. Firstly, in general, wider tires mean higher noise levels. But wider tiresalso need to remove more water, i.e. it is more difficult to obtain good deep-water friction, although acounteracting effect may be better cornering stability of wider tires. Secondly, the more limited studyreported in [5] actually measured the aquaplaning characteristics of car tires, and they found nocorrelation at all between noise level and aquaplaning speed.
Statistically significant correlations between noise and friction occurred only for noise on therough-textured road surface when related to locked-wheel friction on the smooth-textured surface, i.e. inonly one of the tested six cases. This relation indicated that noise and friction had opposingcharacteristics, i.e. lower noise would give higher friction. However, this correlation was just barelysignificant and it should not be considered as important.
The relation between noise and rolling resistance was statistically significant in four out of the sixtested combinations, and in fact rather close to being significant also in the remaining two cases. Thetrends here are consistent: noise increases with rolling resistance. It may not be very surprising, sinceboth phenomena are manifestations of energy losses, partly with related mechanisms.
It can be mentioned that a statistically significant correlation between rolling resistance andfriction, albeit only for optimum slip, was obtained (significant on the 1 % level). This suggests a conflictbetween these important parameters, a conflict that is serious but fortunately not a responsibility for theacoustical designer.
The random errors in the noise measurements must be very small since the relations between thevarious noise measurements (conducted independently at different speeds) are high, with R2 = 0.94-0.96for the CPX measurements. A corresponding analysis of rolling resistance measurements at differentspeeds, conducted totally independently, also indicate a good relation, which must mean that randomerrors are rather small also in the rolling resistance measurements.
This study was made for car tires. It is difficult to say what the corresponding results would havebeen for truck tires. The limited study by Nelson [4] mentioned at the beginning did not indicate verydifferent relations. At least, there does not seem to be any obvious difference between car and truck tirecharacteristics that come to the authors' mind that would suggest that relations may be different for truckthan for car tires. But doing similar tests for truck tires could be a suitable subject for a future study; infact such work is underway in Germany and due for publishing by the end of 2000.
CONCLUSIONS
When considering such a large number of tires, the spread in noise levels is substantial: 10 dB betweenthe noisiest and the most quiet tire, irrespective of surface type. If studded tires are excluded, this range

12
reduces to 8 dB. In general, winter (M+S) tires appear to be somewhat less "noisy" than the tires forsummer use. The rolling resistance range is also substantial: the "worst" tires have 50 % higher rollingresistance than the "best" ones. Friction varies over a similar range. Despite extreme difficulties for thetire industry to match a number of requirements, there seems to be room for improvements.
This experimental study indicates that at least for car tires there is no significant conflict betweenrequirements for high friction and low tire/road noise or between requirements of low rolling resistanceand low noise. In fact, the only significant relations with noise found in this study, indicate contraryrelations, i.e. by reducing noise one may also reduce rolling resistance and possibly improve one (ofseveral) friction characteristics.
The reduction of noise emission by establishing stringent limits to tire/road noise from tires istherefore not likely to sacrifice wet friction or rolling resistance. On the contrary, rolling resistance maybe slightly improved simultaneously. The study suggests that there is substantial room for improvements.
ACKNOWLEDGMENTS
The authors are grateful for the assistance in this project by the following individuals:
• Noise and rolling resistance measurements and analyses: Dr S. Taryma and Dr P. Mioduszewski,Technical University of Gdansk.
• Friction measurements and analyses: Mr S. Berglund and Mr J. Wallh, VTI.• Data processing and analyses: Mrs M. Dong, VTI.• Discussions on friction and tire characteristics: Mr O. Nordström and Dr H. Åström, VTI.
Many of the test tires were made available for testing in this project by Mr O. Nordström who originallyused them in other projects.
It is gratefully acknowledged that the Swedish National Road Administration, the SwedishTransport and Communications Research Board (KFB) and the Technical University of Gdansk havesponsored the data collection and analyses. The Swedish National Road and Transport Research Institutealso sponsored some costs for preparation of equipment.
REFERENCES
1. Sandberg, U. (1987): �Noise and the road � Is there a conflict between requirements for safety andnoise?�. Journal Ingénieurs de l�Automobile, Jan-Feb 1987. Also in: VTI Reprint No. 120, VTI,Linkoping, Sweden.
2. Denker, D. (1989): �Tread noise and driving safety�. Doc. N52 submitted to ISO/TC43/SC1/WG27.3. Nelson, P.; et al (1993): �An examination of the relationship between tire noise and safety
performance�. Doc. III/5029/94 submitted to the ERGA-Noise group under the EU Commission.4. Ejsmont, J. (1990): �Tire/road noise and rolling resistance � Is there a trade-off?�. Proc. of INTROC
90, The International Tire/Road Noise Conference, Gothenburg 1990, Sweden (contact VTI for this).5. Stenschke, R.; Vietzke, P. (2000): �Noise and use characteristics of modern car tyres (State of the
art)�. Paper for the 7th International Congress on Sound and Vibration, 4-7 July 2000, Garmisch-Partenkirchen, Germany.
6. Sandberg, U.; Ejsmont, J.A.; Mioduszewski, P.; Taryma, S. (1998): "Relation between noiseemission, friction and rolling resistance of car tires - a pilot study", Proc. of Inter-Noise 98, 16-18Nov. 1998, Christchurch, New Zealand.
7. ECE/GRB (1990): "Draft Regulation: Tyre/Road Noise Emission". TRANS/SC1/WP29/GRB/R.100,United Nations Economic Commission for Europe, Genève.
8. VERT = Vehicle Road Tyre Interaction: Full Integrated and Physical Model for Handling BehaviourPrediction in Potentially Dangerous Situations, a project within the Brite-EuRam III programme.