Embed Size (px)
Citation preview
Frédéric Molina19/03/2019
Noise Figure measurement with Spectrum analyzerand Vector Network Analyzer
COMPANY RESTRICTED
Agenda
ı Background and theory
ı Measurement method : Spectrum analyzer
ı Measurement method : Vector Network Analyzer
ı Measurements uncertainty
ı Conclusion
19/03/2019 2Noise Figure measurement with Spectrum analyzerand Vector Network Analyzer
COMPANY RESTRICTED
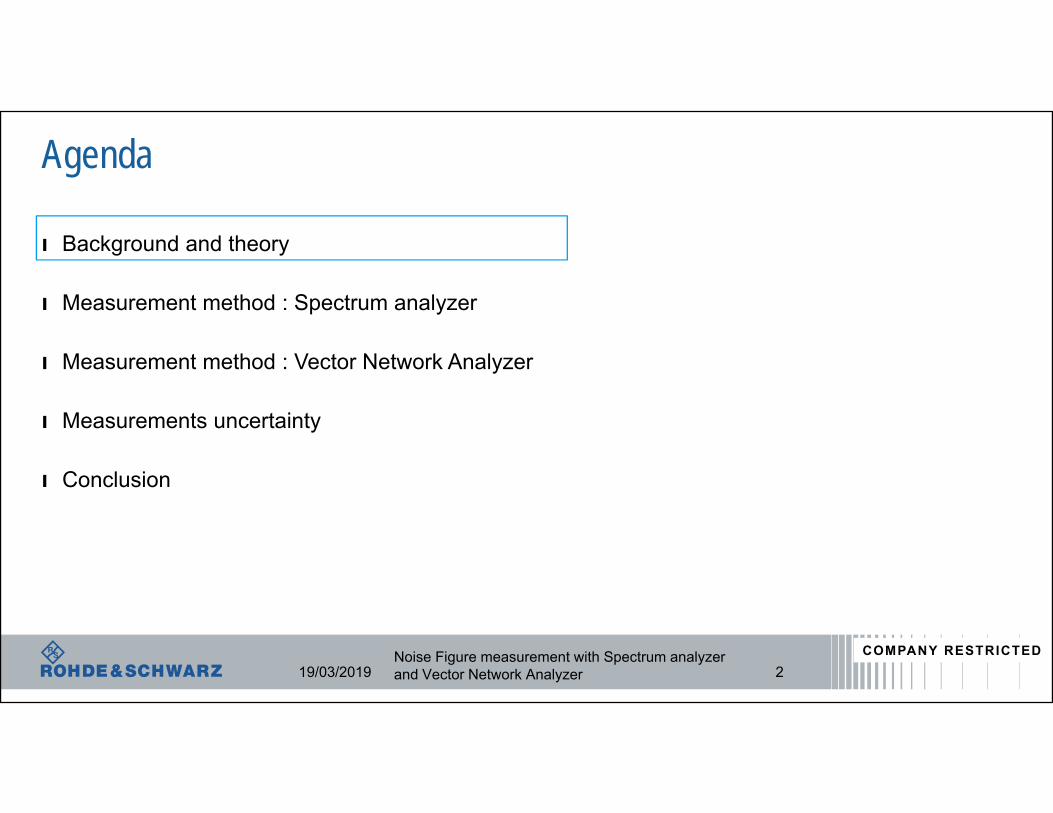
• N=k*T (Watt/Hz) k = Boltzmann’s constant=1.38 x 10⁻²³ Joules/K and T = temperature in Kelvin Special Case: kTo where To = room temperature (293 K = 20 °C) : -174 dBm/Hz
• Over a certain bandwidth, we use : kT * B
• Example: What is the thermal noise floor in a 1 MHz BW?
Thermal Noise
19/03/2019 3Noise Figure measurement with Spectrum analyzerand Vector Network Analyzer
Answer:-174 dBm/Hz + 10*LOG(1MHz/1Hz)= -174 dBm/Hz + 60 dB= -114 dBm
COMPANY RESTRICTED
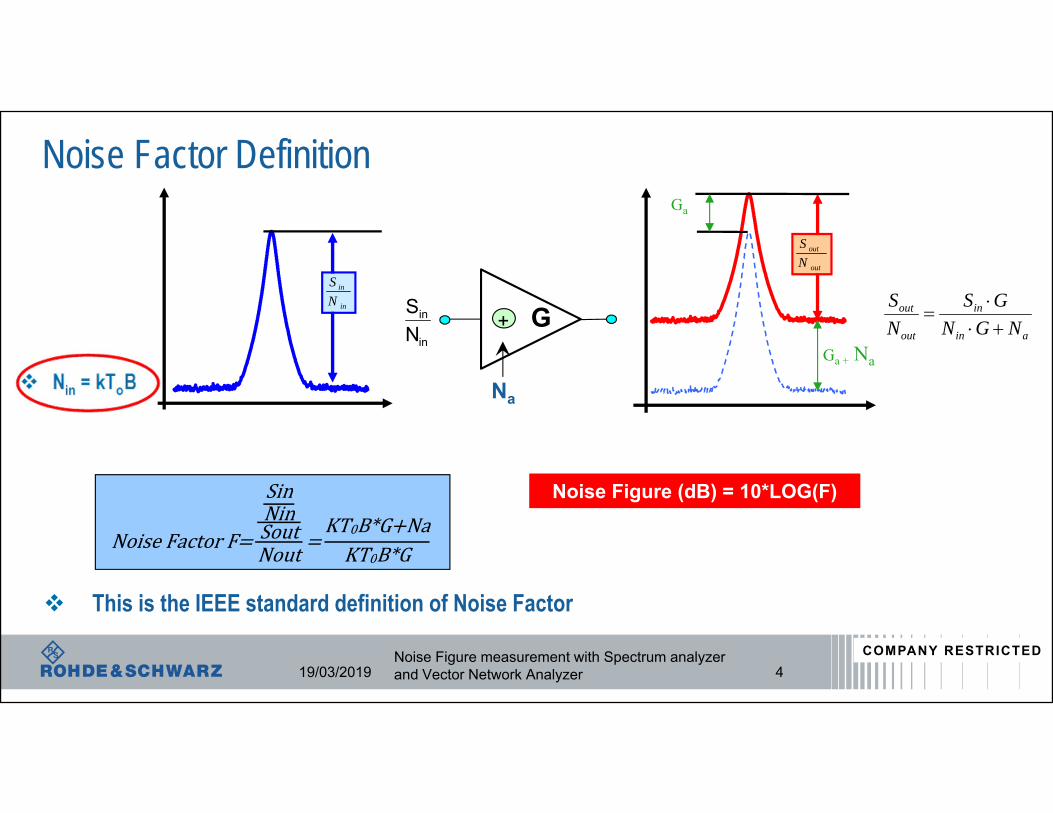
This is the IEEE standard definition of Noise Factor
Noise Factor Definition
Gin
in
NS
+
Na
Noise Figure (dB) = 10*LOG(F)
19/03/2019 4
in
in
NS
ain
in
out
out
NGNGS
NS
out
out
NS
Ga
Ga + Na
Noise Figure measurement with Spectrum analyzerand Vector Network Analyzer
NoiseFactorF
SinNinSoutNout
KT0B*G NaKT0B*G
COMPANY RESTRICTED
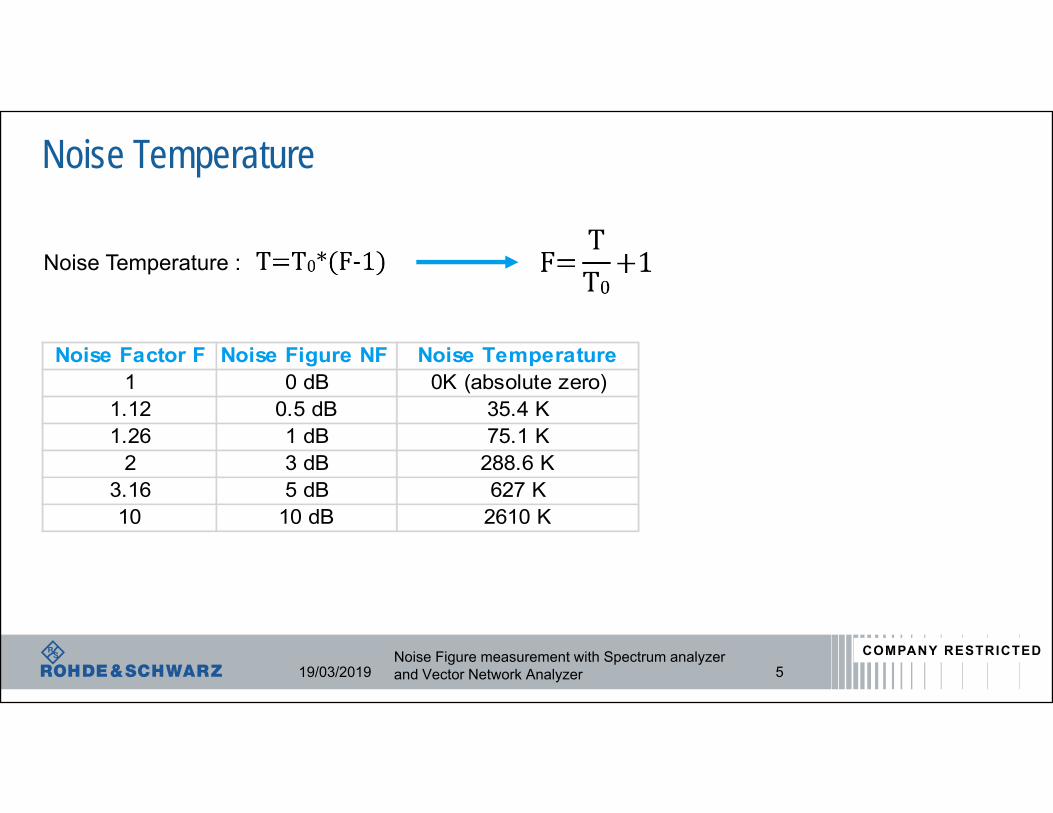
Noise Temperature
19/03/2019 5
Noise Factor F Noise Figure NF Noise Temperature1 0 dB 0K (absolute zero)
1.12 0.5 dB 35.4 K1.26 1 dB 75.1 K
2 3 dB 288.6 K3.16 5 dB 627 K10 10 dB 2610 K
Noise Temperature :
Noise Figure measurement with Spectrum analyzerand Vector Network Analyzer
COMPANY RESTRICTED
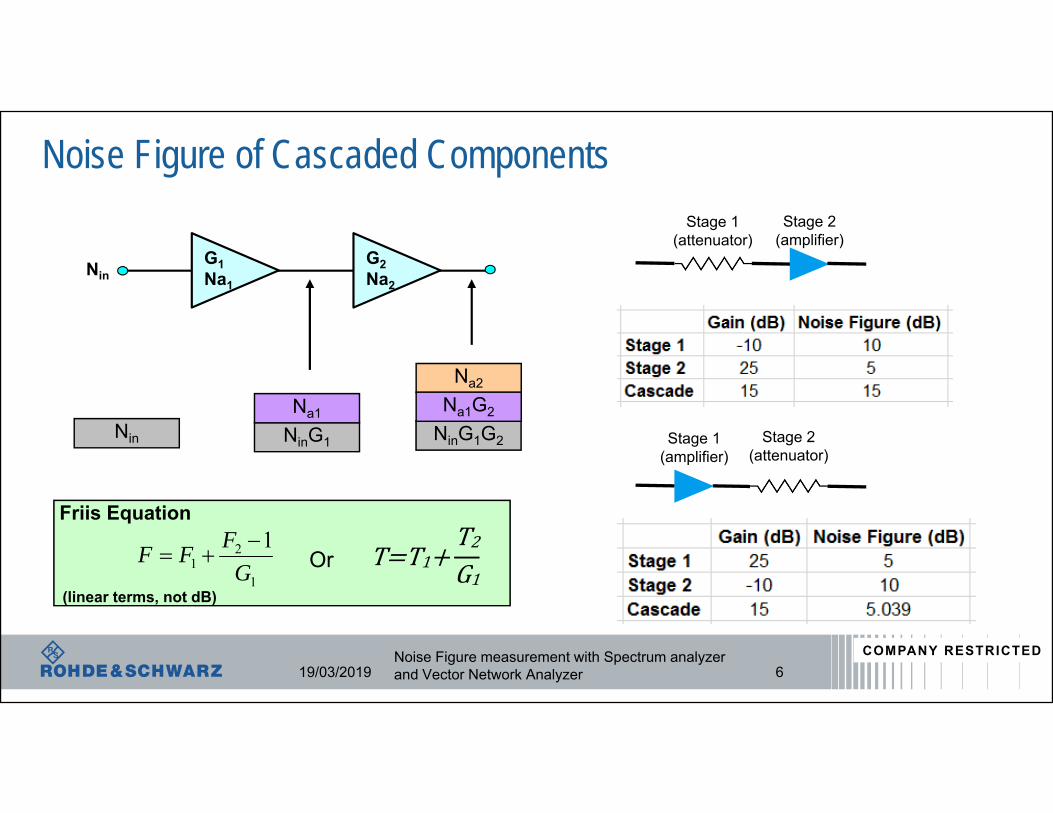
Friis Equation
(linear terms, not dB)
Noise Figure of Cascaded Components
G1Na1
G2Na2
Nin
Nin NinG1
Na1NinG1G2
Na2
Na1G2
1
21
1G
FFF
Stage 1 (attenuator)
Stage 2(amplifier)
19/03/2019 6
Stage 2(attenuator)
Stage 1(amplifier)
Or
Noise Figure measurement with Spectrum analyzerand Vector Network Analyzer
T T1T2G1
COMPANY RESTRICTED
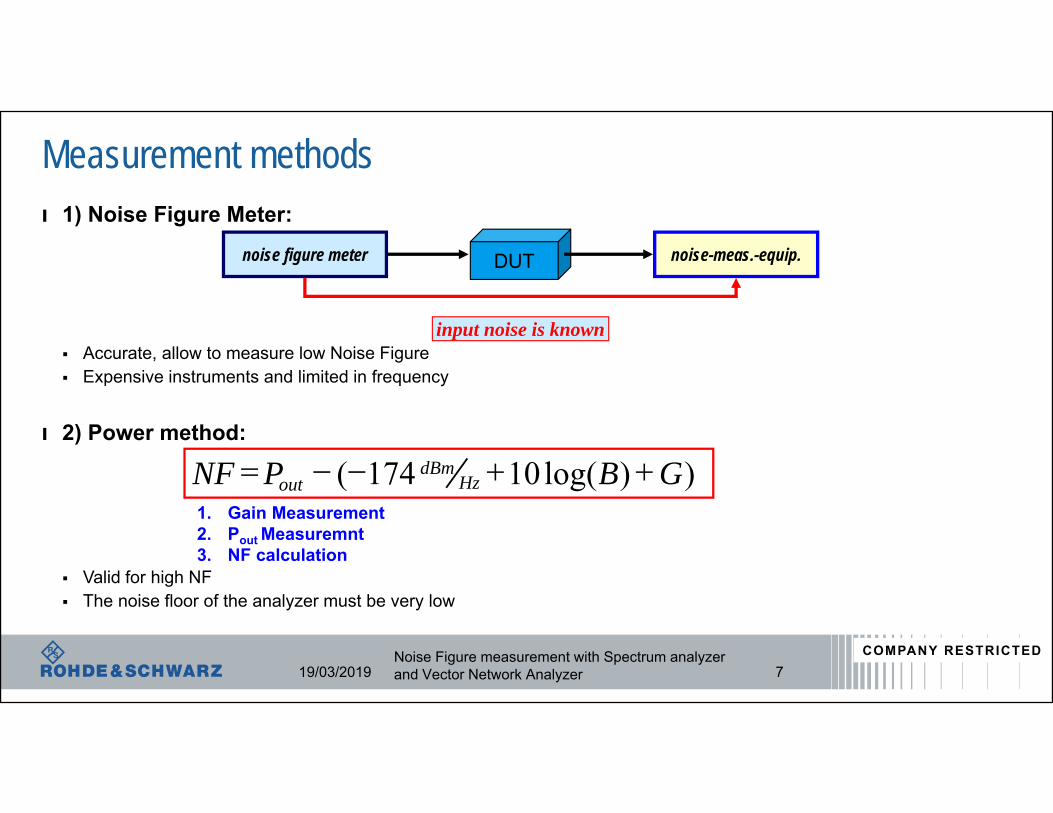
Measurement methodsı 1) Noise Figure Meter:
Accurate, allow to measure low Noise Figure Expensive instruments and limited in frequency
ı 2) Power method:
Valid for high NF The noise floor of the analyzer must be very low
1. Gain Measurement2. Pout Measuremnt3. NF calculation
noise figure meter DUT noise-meas.-equip.
input noise is known
))log(10174( GBPNF HzdBm
out
19/03/2019 7Noise Figure measurement with Spectrum analyzerand Vector Network Analyzer
COMPANY RESTRICTED
Agenda
ı Background and theory
ı Measurement method : Spectrum analyzer
ı Measurement method : Vector Network Analyzer
ı Measurements uncertainty
ı Conclusion
19/03/2019 8Noise Figure measurement with Spectrum analyzerand Vector Network Analyzer
COMPANY RESTRICTED
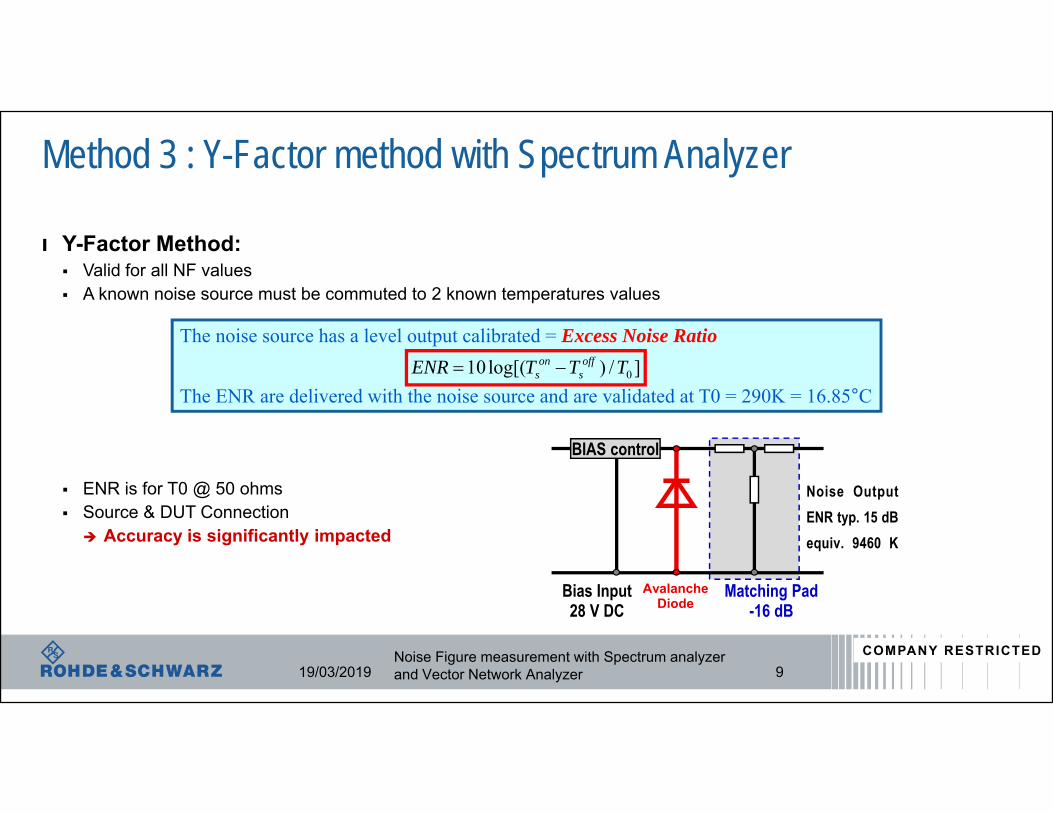
Method 3 : Y-Factor method with Spectrum Analyzer
ı Y-Factor Method: Valid for all NF values A known noise source must be commuted to 2 known temperatures values
ENR is for T0 @ 50 ohms Source & DUT Connection Accuracy is significantly impacted
Bias Input28 V DC
Matching Pad-16 dB
AvalancheDiode
BIAS control
Noise OutputENR typ. 15 dBequiv. 9460 K
The noise source has a level output calibrated = Excess Noise Ratio
The ENR are delivered with the noise source and are validated at T0 = 290K = 16.85°C]/)log[(10 0TTTENR off
son
s
19/03/2019 9Noise Figure measurement with Spectrum analyzerand Vector Network Analyzer
COMPANY RESTRICTED
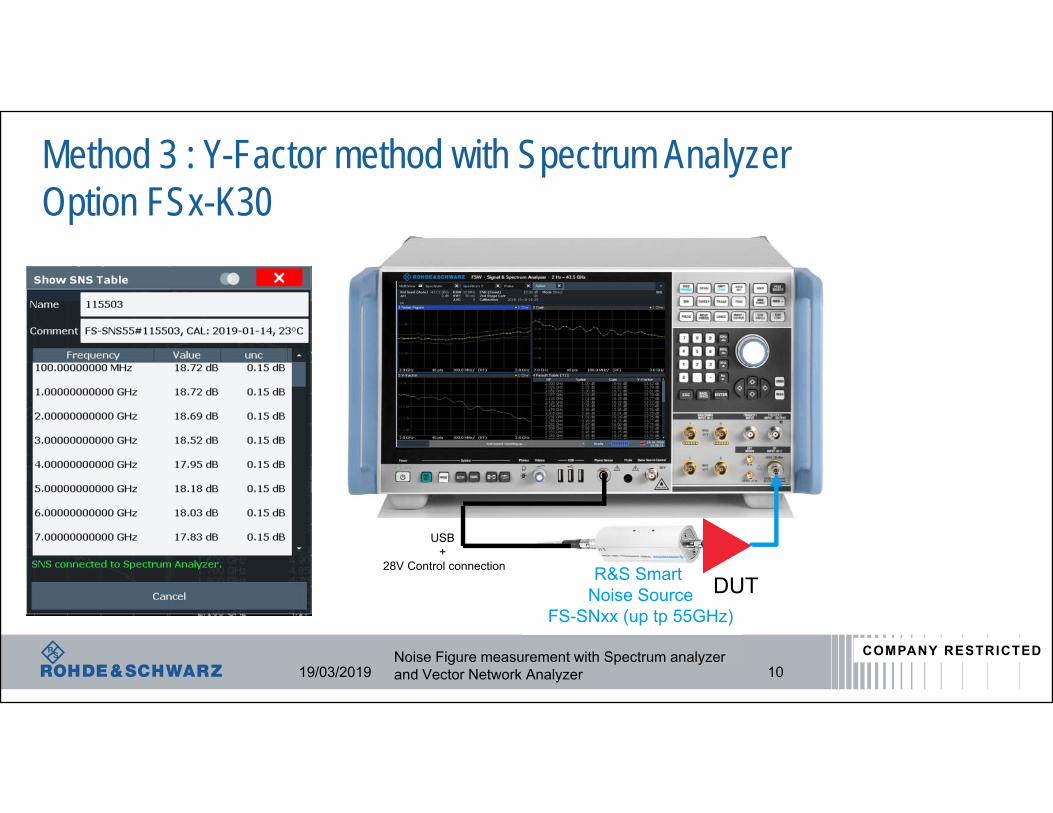
Method 3 : Y-Factor method with Spectrum AnalyzerOption FSx-K30
19/03/2019 10
DUT
USB +
28V Control connection R&S Smart Noise Source
FS-SNxx (up tp 55GHz)
Noise Figure measurement with Spectrum analyzerand Vector Network Analyzer
COMPANY RESTRICTED
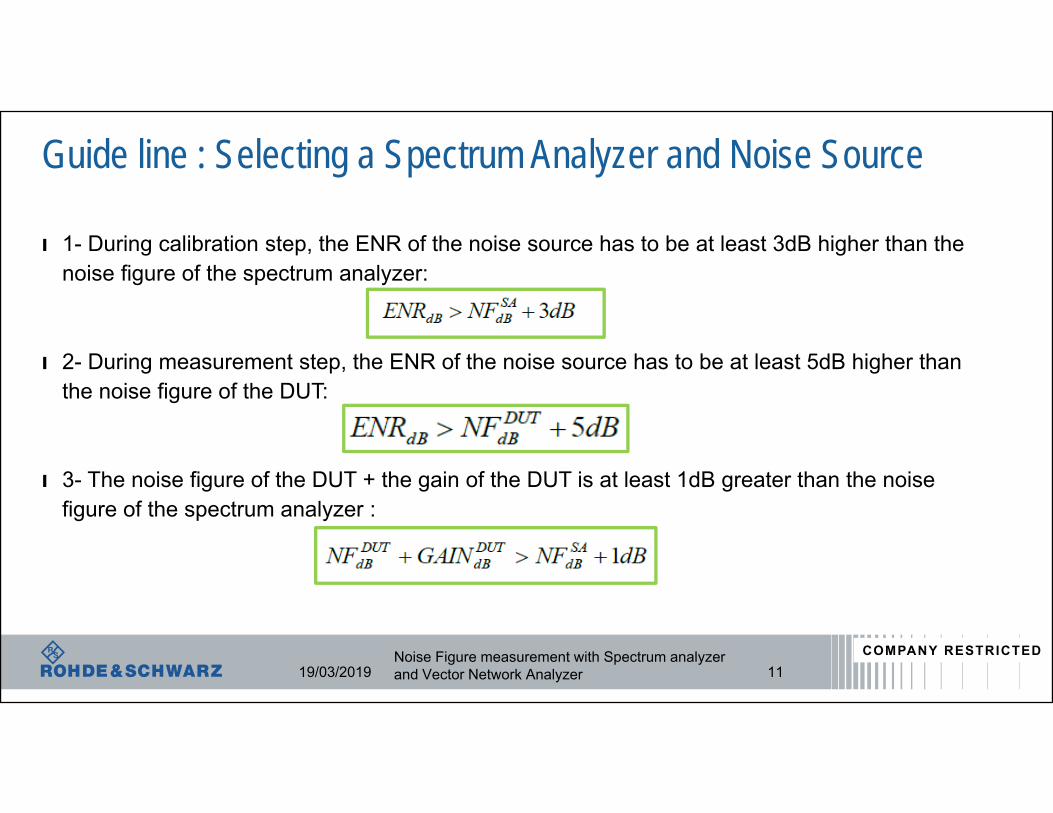
ı 1- During calibration step, the ENR of the noise source has to be at least 3dB higher than the noise figure of the spectrum analyzer:
ı 2- During measurement step, the ENR of the noise source has to be at least 5dB higher than the noise figure of the DUT:
ı 3- The noise figure of the DUT + the gain of the DUT is at least 1dB greater than the noise figure of the spectrum analyzer :
Guide line : Selecting a Spectrum Analyzer and Noise Source
19/03/2019 11Noise Figure measurement with Spectrum analyzerand Vector Network Analyzer
COMPANY RESTRICTED
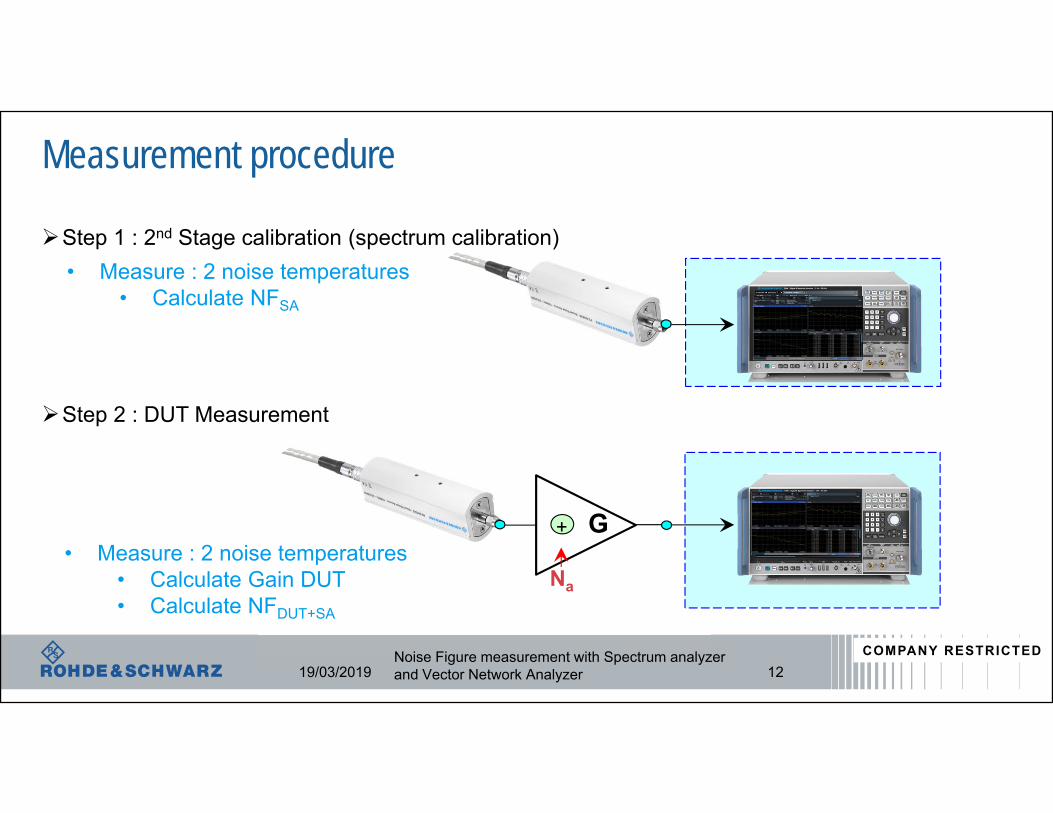
Measurement procedure
19/03/2019 12
G+
Na
Step 1 : 2nd Stage calibration (spectrum calibration)
Step 2 : DUT Measurement
Noise Figure measurement with Spectrum analyzerand Vector Network Analyzer
• Measure : 2 noise temperatures• Calculate NFSA
• Measure : 2 noise temperatures• Calculate Gain DUT• Calculate NFDUT+SA
COMPANY RESTRICTED
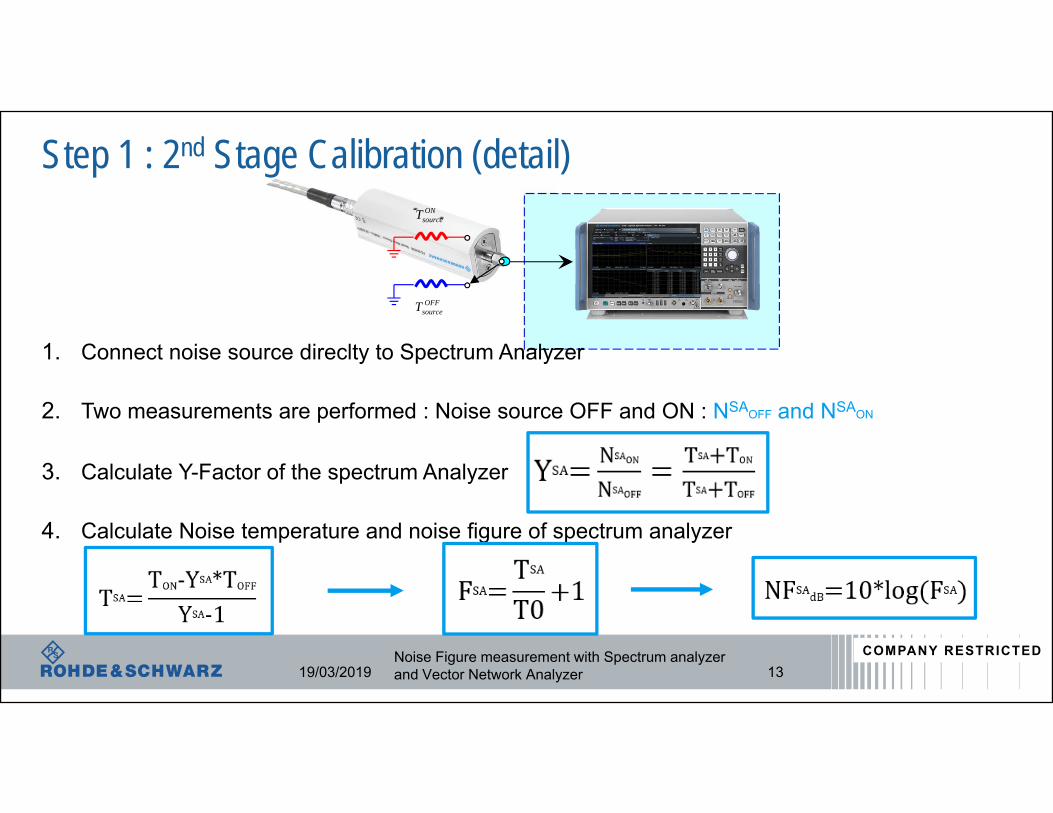
Step 1 : 2nd Stage Calibration (detail)
1. Connect noise source direclty to Spectrum Analyzer
2. Two measurements are performed : Noise source OFF and ON : NSAOFF and NSAON
3. Calculate Y-Factor of the spectrum Analyzer
4. Calculate Noise temperature and noise figure of spectrum analyzer
19/03/2019 13
OFFsourceT
ONsourceT
Noise Figure measurement with Spectrum analyzerand Vector Network Analyzer
COMPANY RESTRICTED
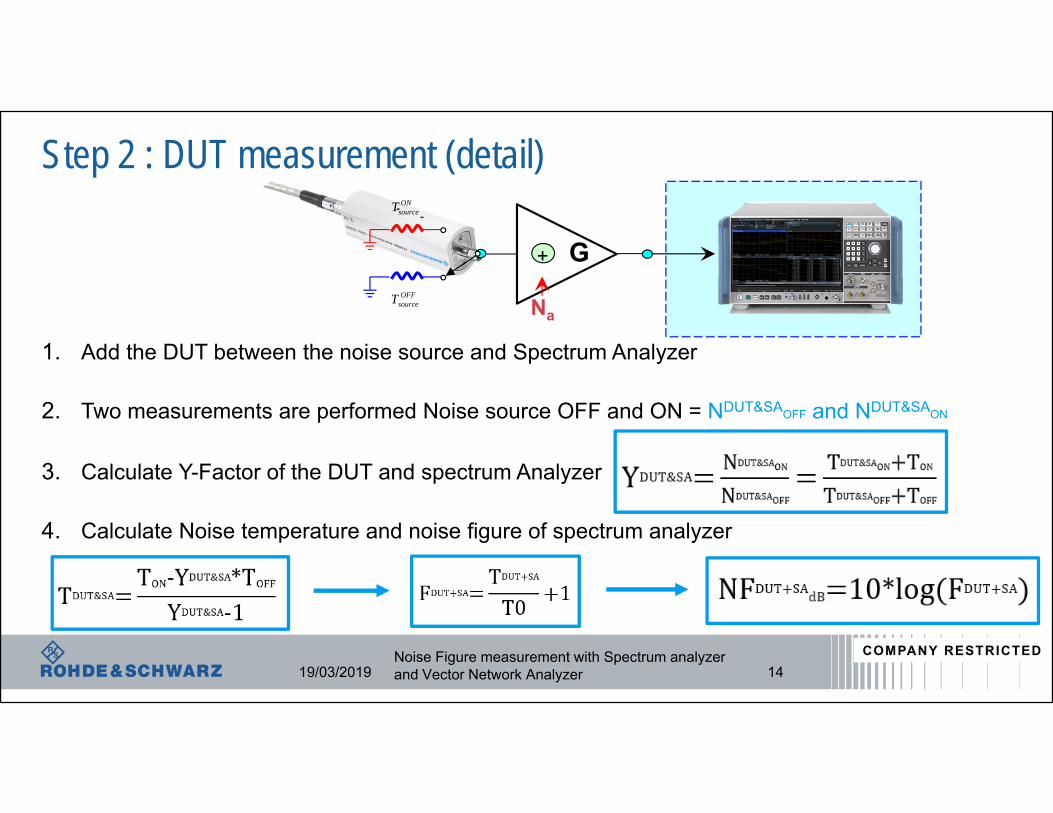
Step 2 : DUT measurement (detail)
1. Add the DUT between the noise source and Spectrum Analyzer
2. Two measurements are performed Noise source OFF and ON = NDUT&SAOFF and NDUT&SAON
3. Calculate Y-Factor of the DUT and spectrum Analyzer
4. Calculate Noise temperature and noise figure of spectrum analyzer
19/03/2019 14
G+
NaOFF
sourceT
ONsourceT
Noise Figure measurement with Spectrum analyzerand Vector Network Analyzer
COMPANY RESTRICTED
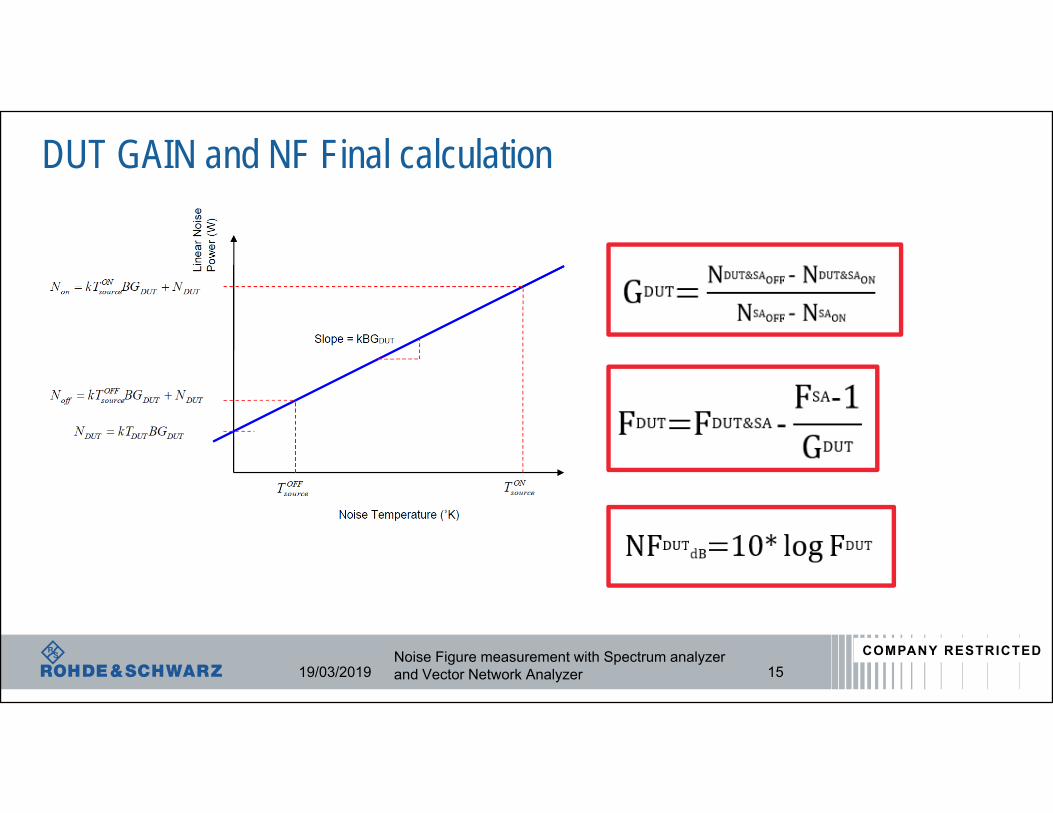
DUT GAIN and NF Final calculation
19/03/2019 15Noise Figure measurement with Spectrum analyzerand Vector Network Analyzer
COMPANY RESTRICTED
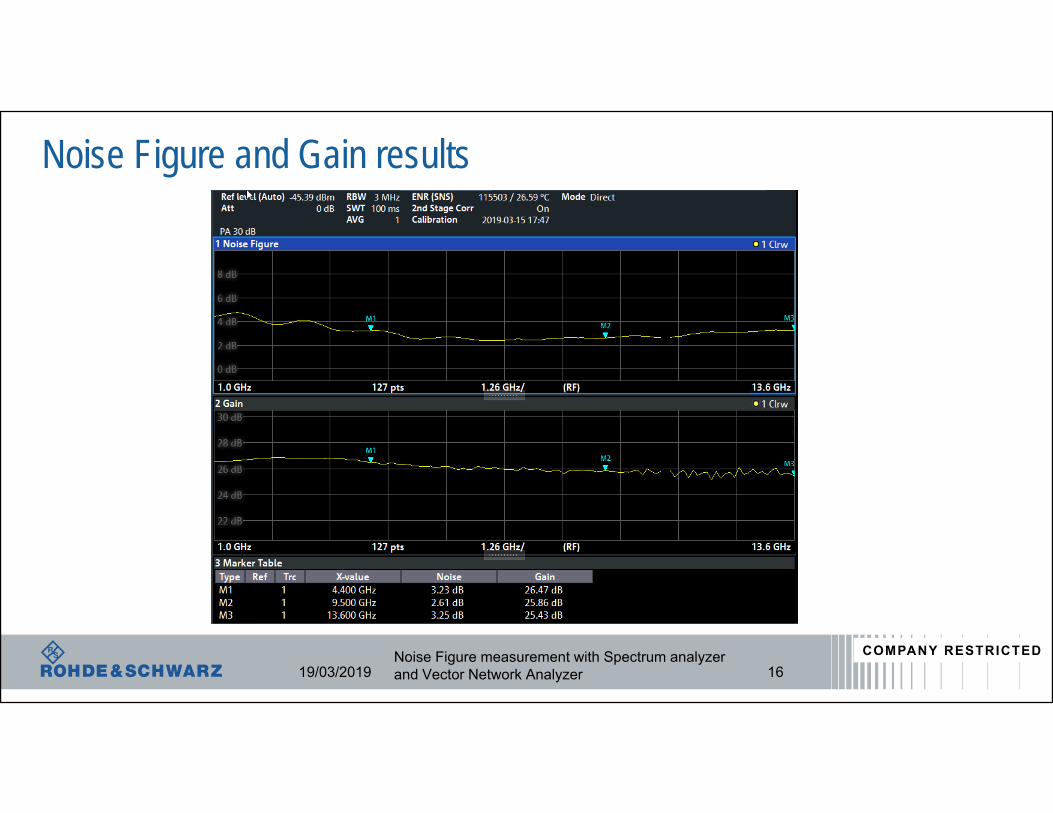
Noise Figure and Gain results
19/03/2019 16Noise Figure measurement with Spectrum analyzerand Vector Network Analyzer
COMPANY RESTRICTED
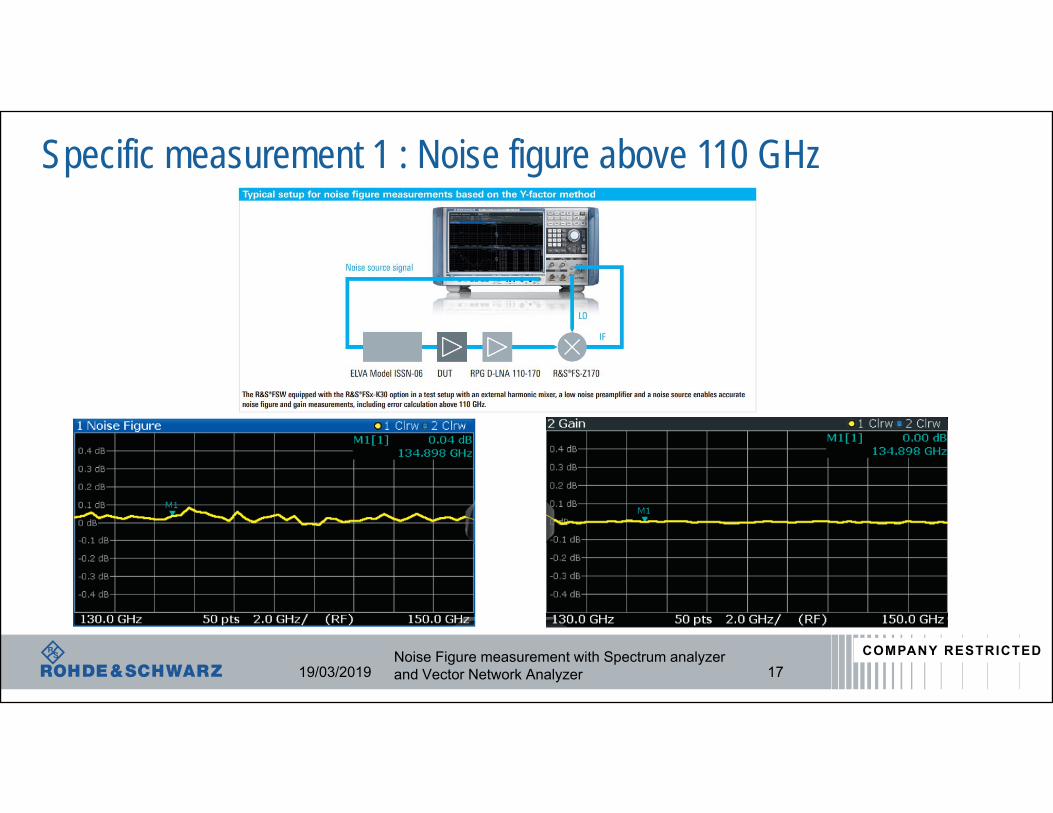
Specific measurement 1 : Noise figure above 110 GHz
19/03/2019 17Noise Figure measurement with Spectrum analyzerand Vector Network Analyzer
COMPANY RESTRICTED
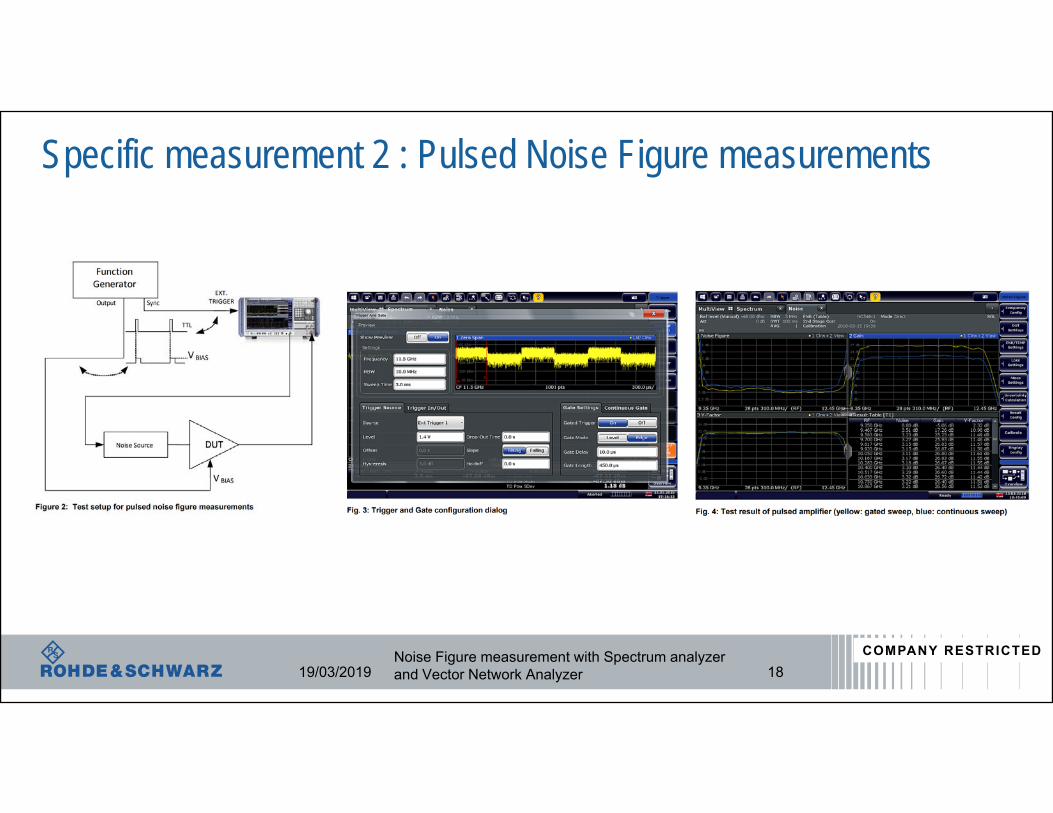
Specific measurement 2 : Pulsed Noise Figure measurements
19/03/2019 18Noise Figure measurement with Spectrum analyzerand Vector Network Analyzer
COMPANY RESTRICTED
Agenda
ı Background and theory
ı Measurement method : Spectrum analyzer
ı Measurement method : Vector Network Analyzer
ı Measurements uncertainty
ı Conclusion
19/03/2019 19Noise Figure measurement with Spectrum analyzerand Vector Network Analyzer
COMPANY RESTRICTED
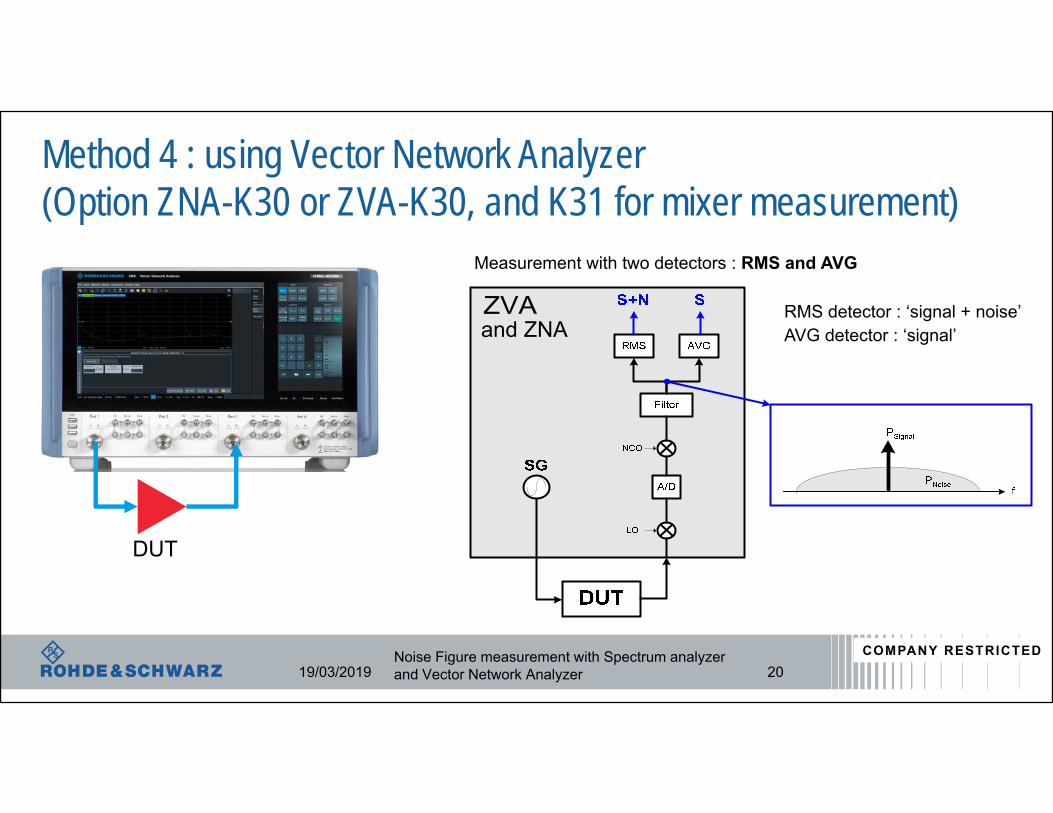
Method 4 : using Vector Network Analyzer(Option ZNA-K30 or ZVA-K30, and K31 for mixer measurement)
19/03/2019 20
DUT
Noise Figure measurement with Spectrum analyzerand Vector Network Analyzer
Measurement with two detectors : RMS and AVG
RMS detector : ‘signal + noise’AVG detector : ‘signal’ and ZNA
COMPANY RESTRICTED
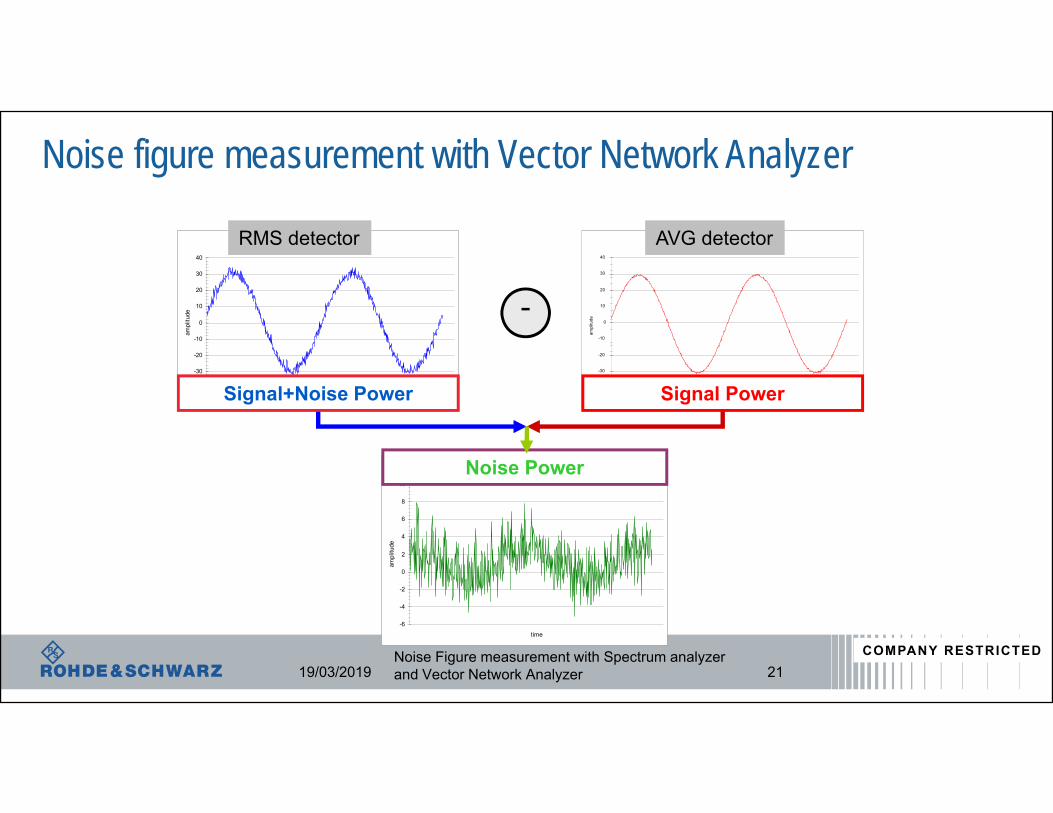
Noise = (S+N)-S
-6
-4
-2
0
2
4
6
8
10
time
ampl
itude
signalAVG PP ̂noisesignalRMS PP ̂
Signal + Noise
-40
-30
-20
-10
0
10
20
30
40
time
ampl
itude −
Signal
-40
-30
-20
-10
0
10
20
30
40
time
ampl
itude
Signal+Noise Power Signal Power
Noise Power
RMS detector AVG detector
Noise figure measurement with Vector Network Analyzer
19/03/2019 21Noise Figure measurement with Spectrum analyzerand Vector Network Analyzer
COMPANY RESTRICTED
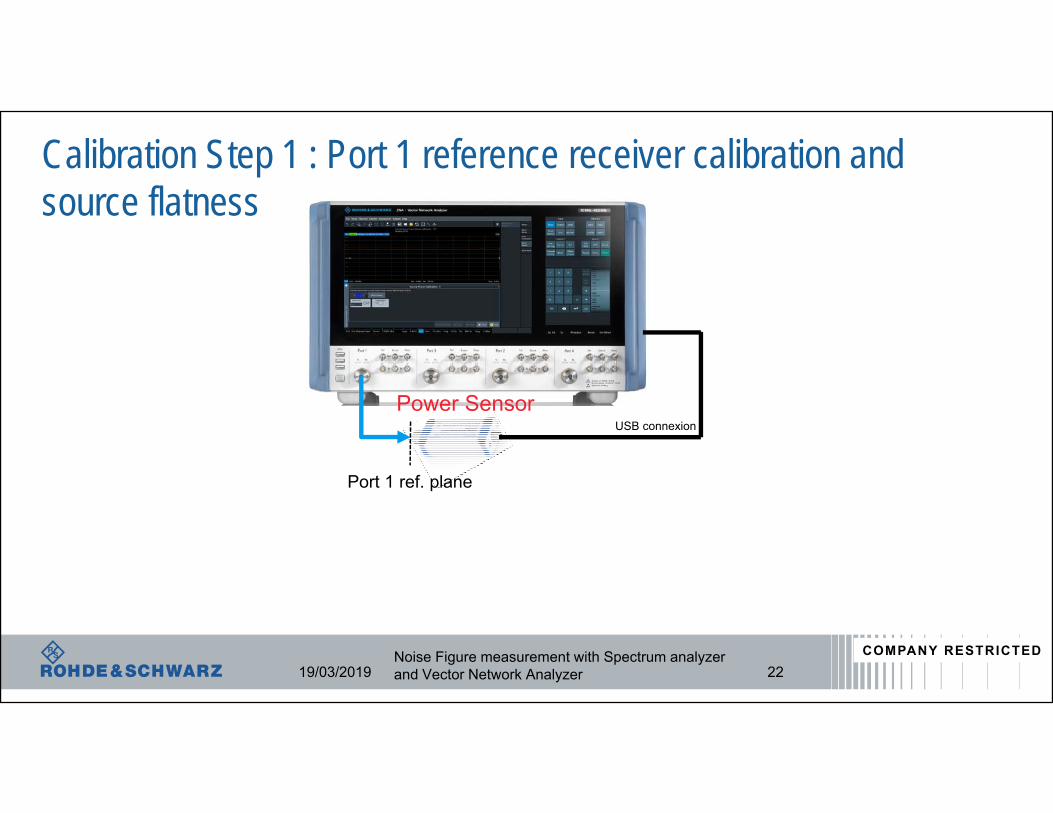
Calibration Step 1 : Port 1 reference receiver calibration and source flatness
19/03/2019
Port 1 ref. plane
USB connexionPower Sensor
22Noise Figure measurement with Spectrum analyzerand Vector Network Analyzer
COMPANY RESTRICTED
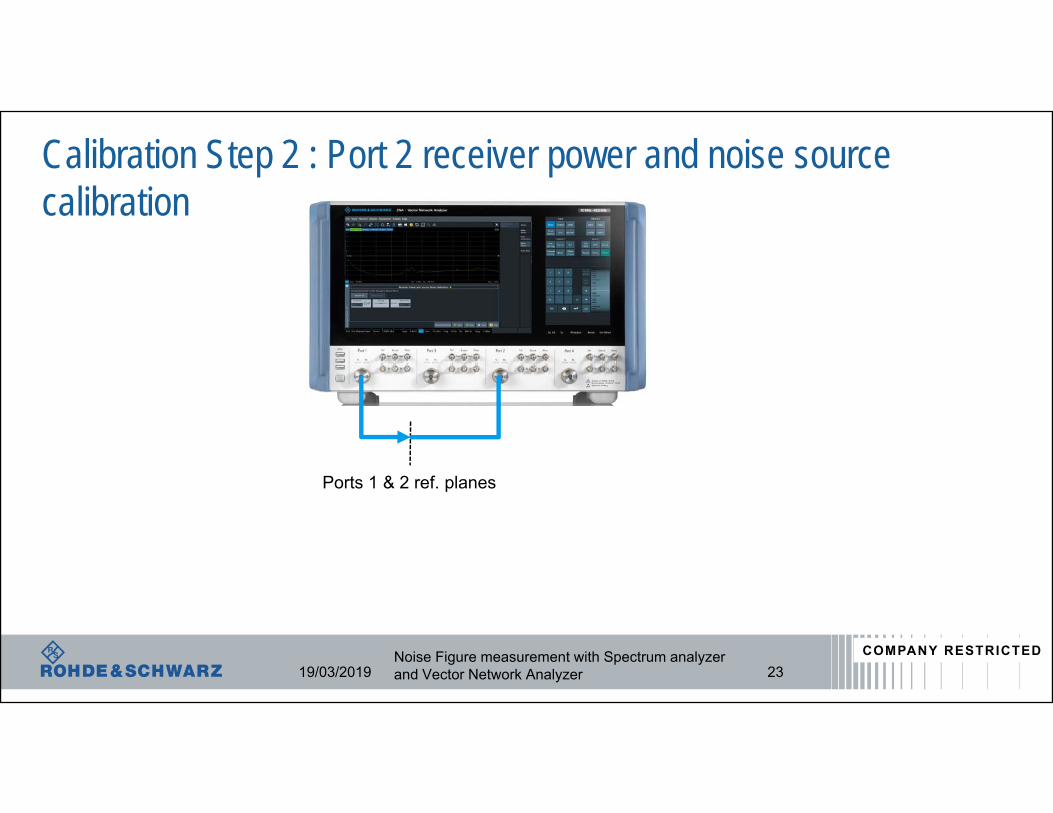
Calibration Step 2 : Port 2 receiver power and noise source calibration
19/03/2019
Ports 1 & 2 ref. planes
23Noise Figure measurement with Spectrum analyzerand Vector Network Analyzer
COMPANY RESTRICTED
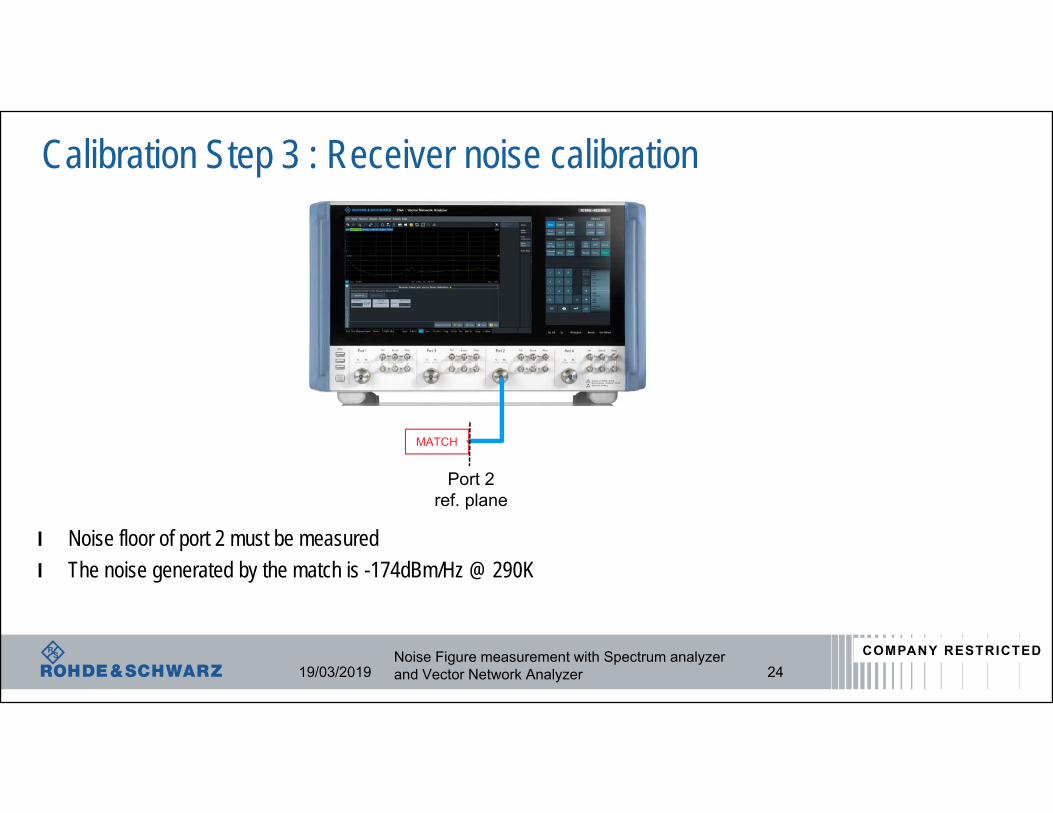
Calibration Step 3 : Receiver noise calibration
19/03/2019
MATCH
Port 2 ref. plane
l Noise floor of port 2 must be measuredl The noise generated by the match is -174dBm/Hz @ 290K
24Noise Figure measurement with Spectrum analyzerand Vector Network Analyzer
COMPANY RESTRICTED
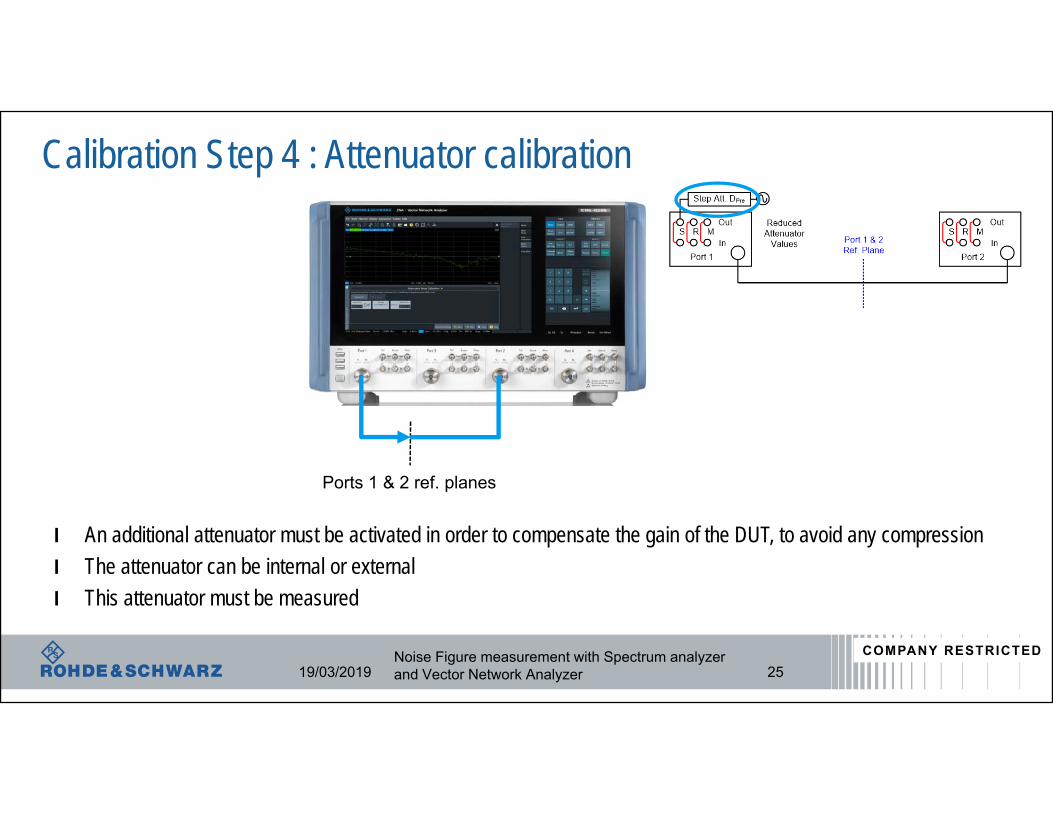
Calibration Step 4 : Attenuator calibration
19/03/2019
Ports 1 & 2 ref. planes
l An additional attenuator must be activated in order to compensate the gain of the DUT, to avoid any compressionl The attenuator can be internal or externall This attenuator must be measured
25Noise Figure measurement with Spectrum analyzerand Vector Network Analyzer
COMPANY RESTRICTED
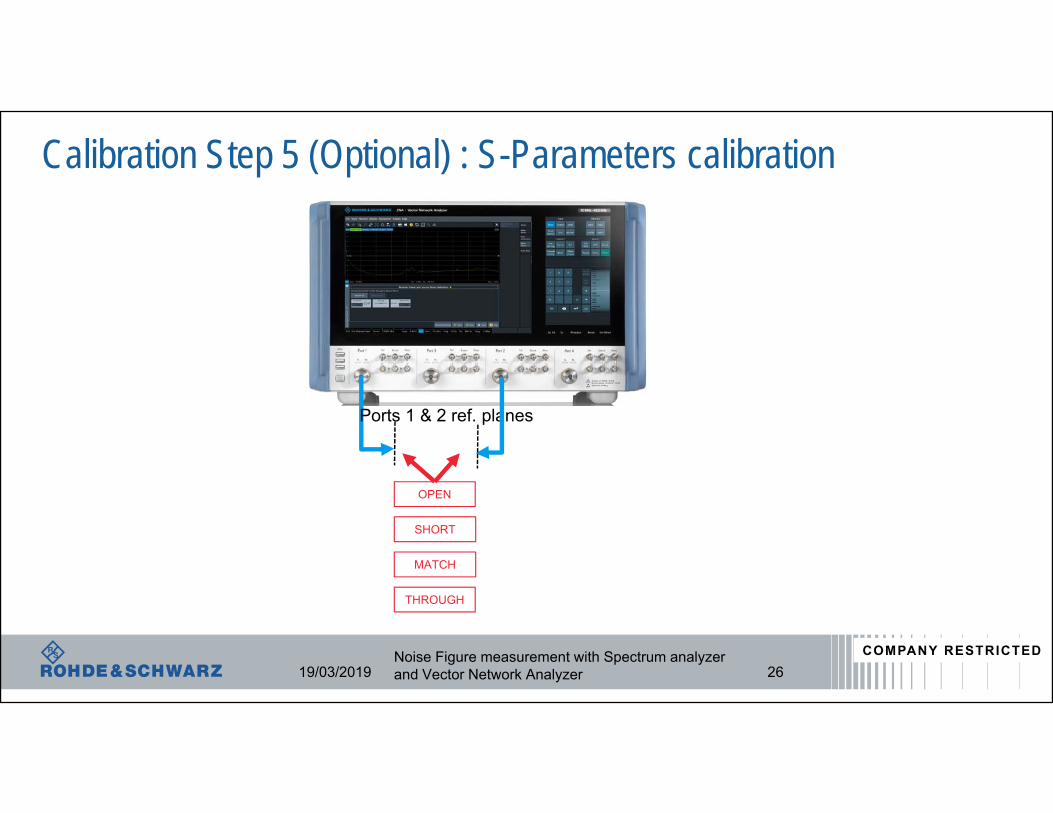
Calibration Step 5 (Optional) : S-Parameters calibration
19/03/2019
Ports 1 & 2 ref. planes
26
OPEN
SHORT
MATCH
THROUGH
Noise Figure measurement with Spectrum analyzerand Vector Network Analyzer
COMPANY RESTRICTED
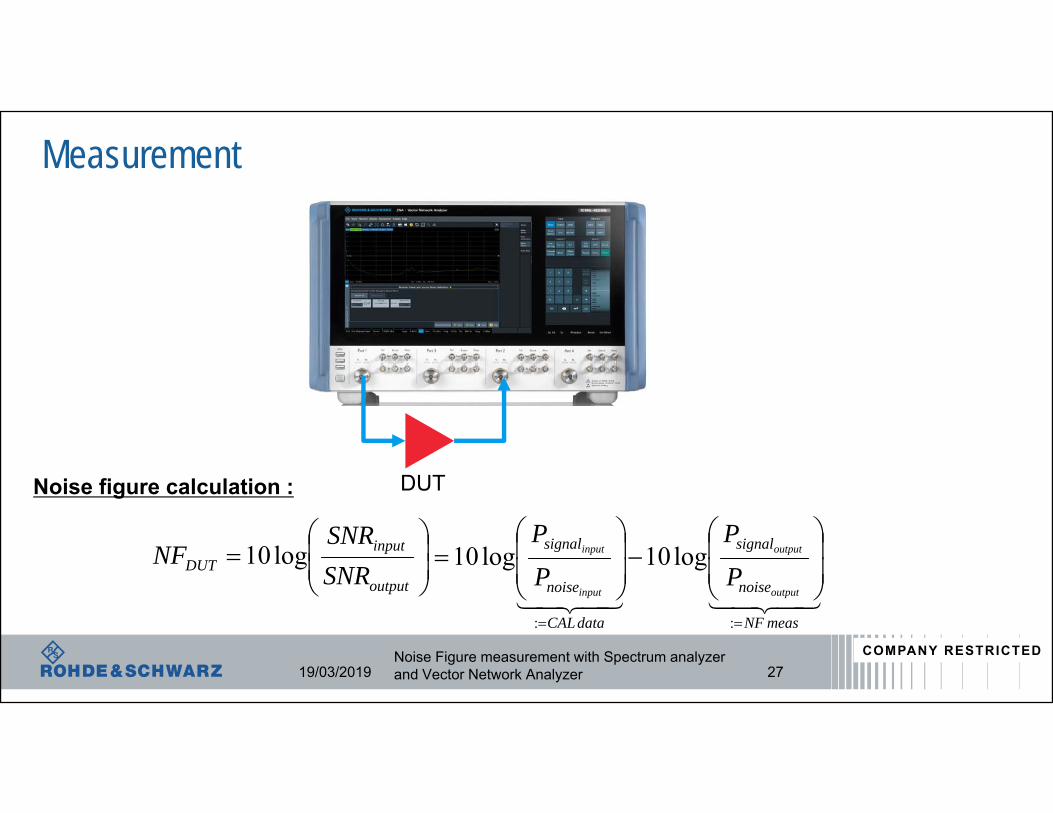
Measurement
19/03/2019
DUTNoise figure calculation :
output
inputDUT SNR
SNRNF log10
measNF
noise
signal
dataCAL
noise
signal
output
output
input
input
P
P
P
P
::
log10log10
27Noise Figure measurement with Spectrum analyzerand Vector Network Analyzer
COMPANY RESTRICTED
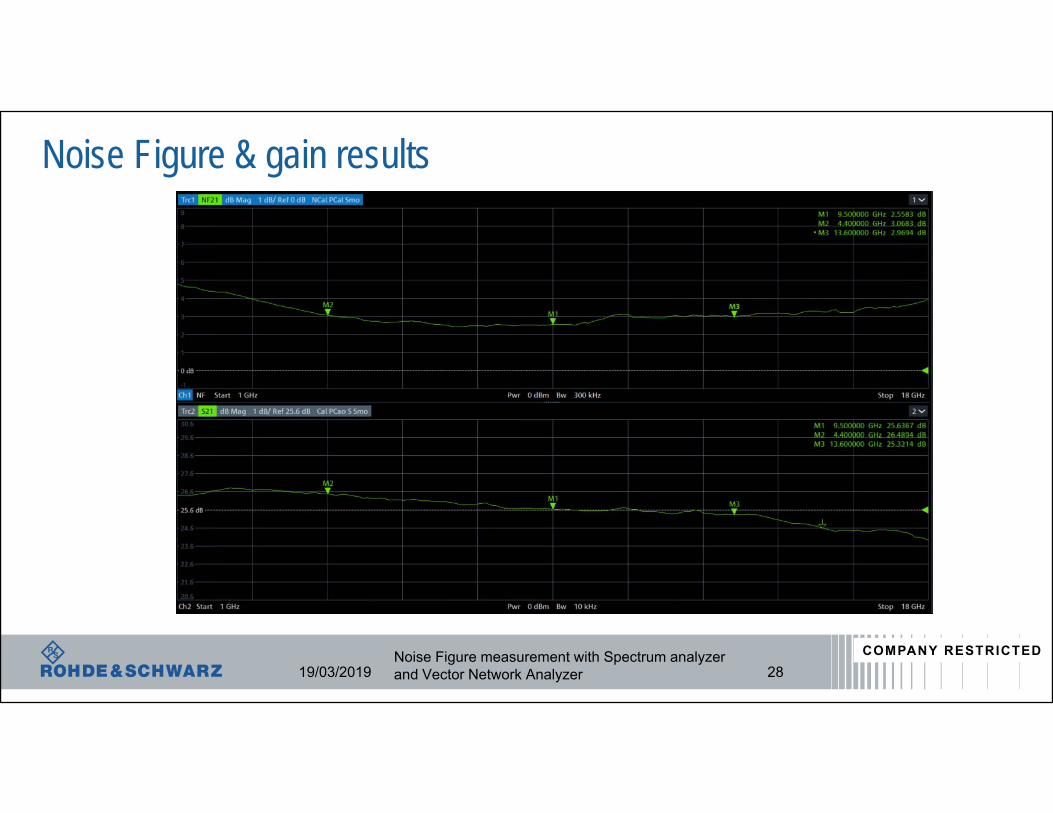
Noise Figure & gain results
19/03/2019 28Noise Figure measurement with Spectrum analyzerand Vector Network Analyzer
COMPANY RESTRICTED
Agenda
ı Background and theory
ı Measurement method : Spectrum analyzer
ı Measurement method : Vector Network Analyzer
ı Measurements uncertainty
ı Conclusion
19/03/2019 29Noise Figure measurement with Spectrum analyzerand Vector Network Analyzer
COMPANY RESTRICTED
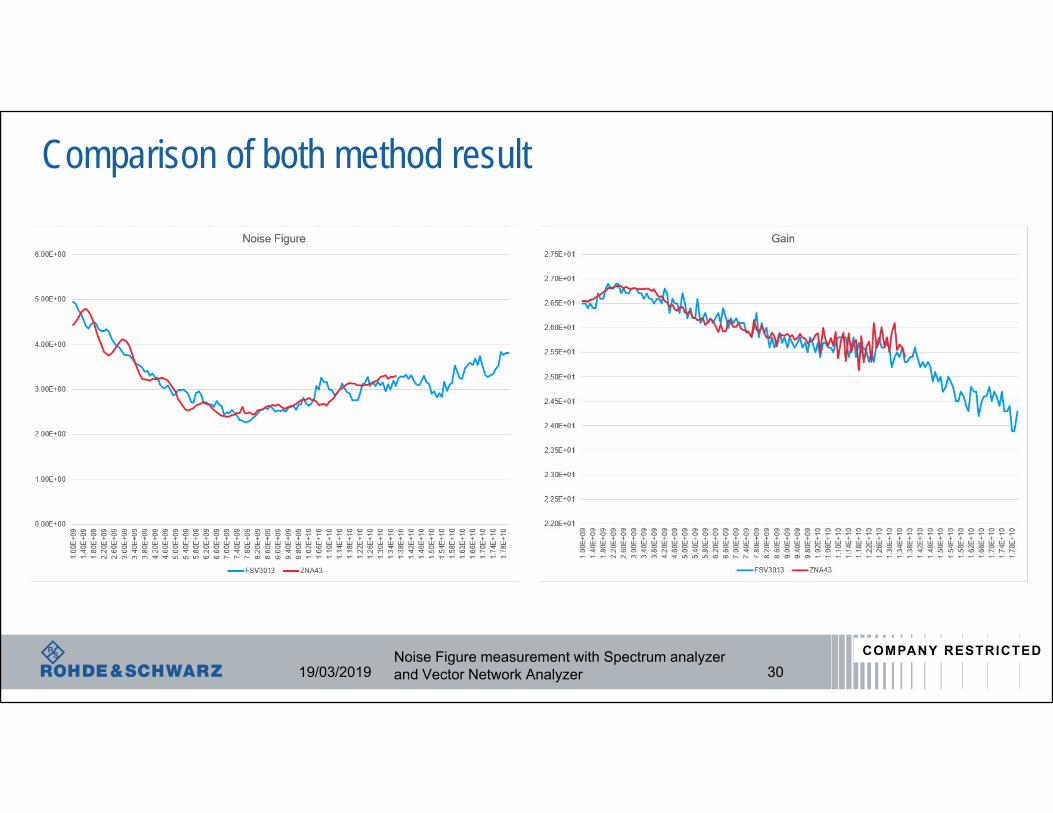
Comparison of both method result
19/03/2019 30Noise Figure measurement with Spectrum analyzerand Vector Network Analyzer
COMPANY RESTRICTED
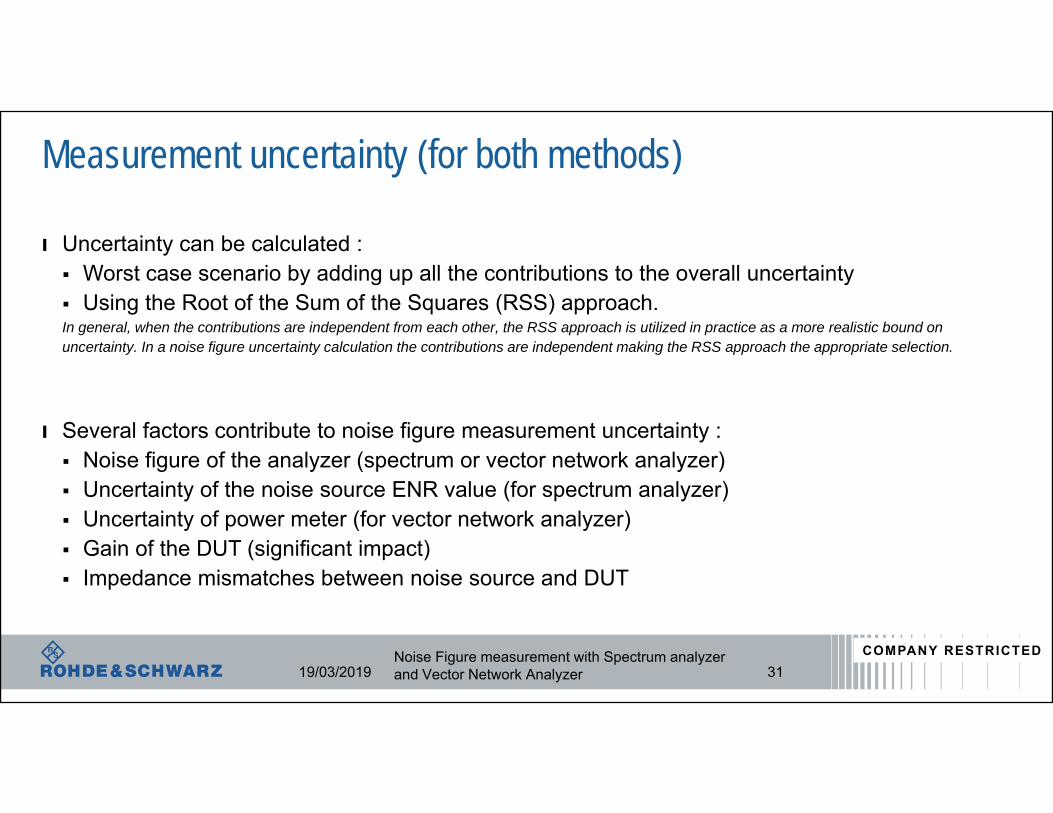
Measurement uncertainty (for both methods)
ı Uncertainty can be calculated : Worst case scenario by adding up all the contributions to the overall uncertainty Using the Root of the Sum of the Squares (RSS) approach. In general, when the contributions are independent from each other, the RSS approach is utilized in practice as a more realistic bound on uncertainty. In a noise figure uncertainty calculation the contributions are independent making the RSS approach the appropriate selection.
ı Several factors contribute to noise figure measurement uncertainty : Noise figure of the analyzer (spectrum or vector network analyzer) Uncertainty of the noise source ENR value (for spectrum analyzer) Uncertainty of power meter (for vector network analyzer) Gain of the DUT (significant impact) Impedance mismatches between noise source and DUT
19/03/2019 31Noise Figure measurement with Spectrum analyzerand Vector Network Analyzer
COMPANY RESTRICTED
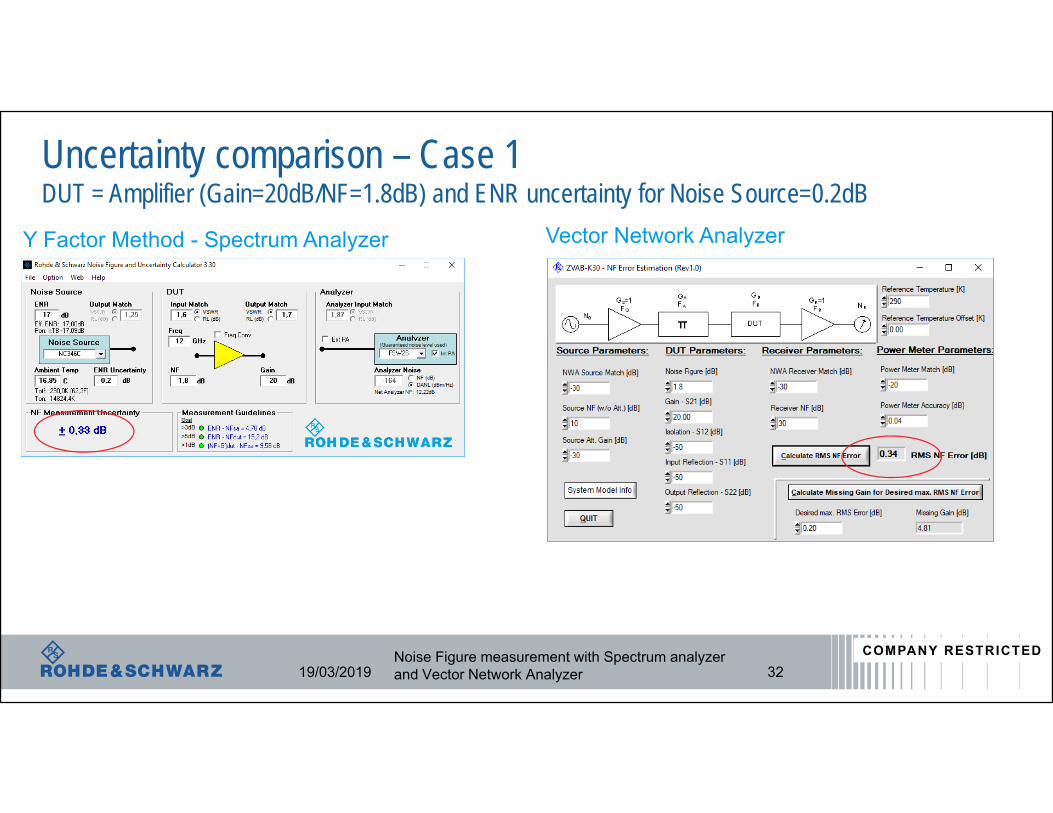
Uncertainty comparison – Case 1DUT = Amplifier (Gain=20dB/NF=1.8dB) and ENR uncertainty for Noise Source=0.2dB
19/03/2019 32
Y Factor Method - Spectrum Analyzer Vector Network Analyzer
Noise Figure measurement with Spectrum analyzerand Vector Network Analyzer
COMPANY RESTRICTED
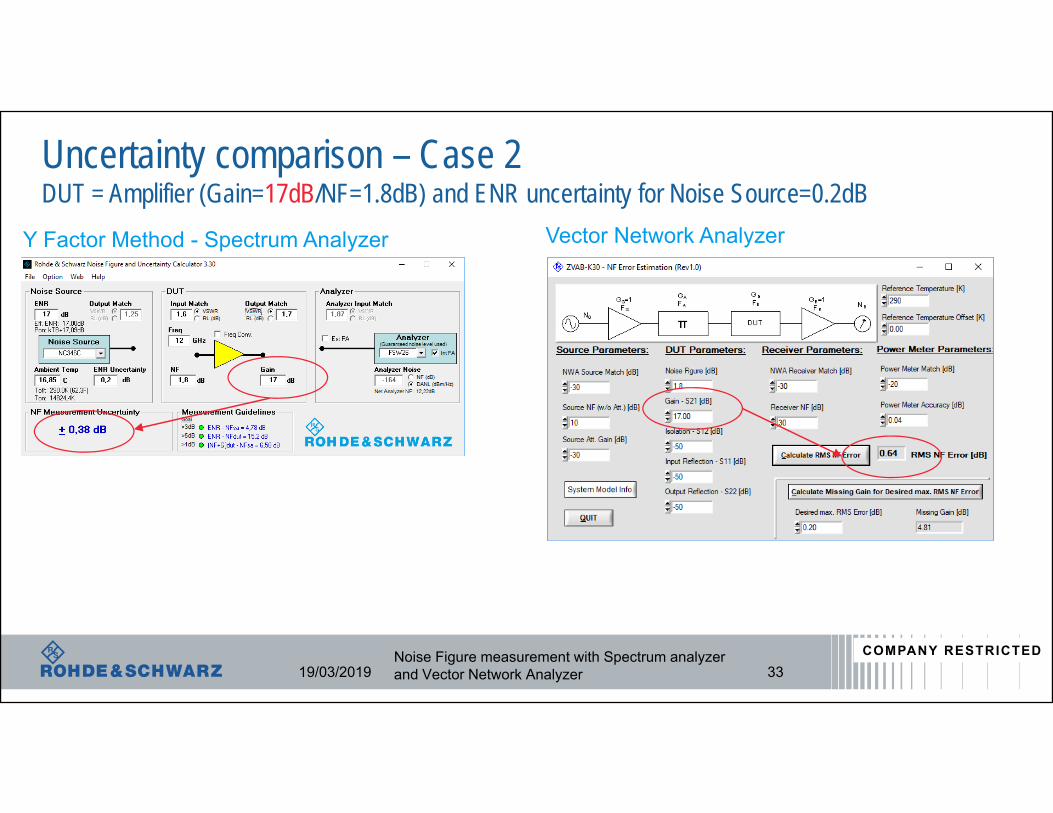
Uncertainty comparison – Case 2DUT = Amplifier (Gain=17dB/NF=1.8dB) and ENR uncertainty for Noise Source=0.2dB
19/03/2019 33
Y Factor Method - Spectrum Analyzer Vector Network Analyzer
Noise Figure measurement with Spectrum analyzerand Vector Network Analyzer
COMPANY RESTRICTED
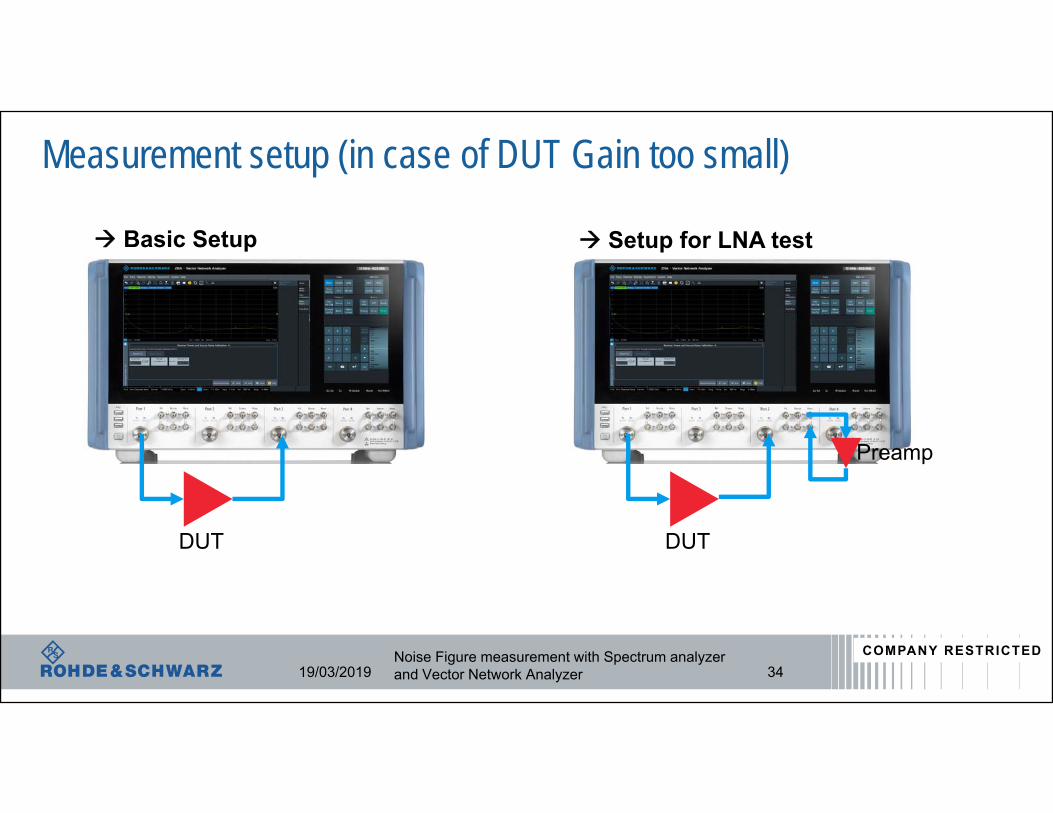
Measurement setup (in case of DUT Gain too small)
19/03/2019
DUT DUT
Basic Setup Setup for LNA test
Preamp
34Noise Figure measurement with Spectrum analyzerand Vector Network Analyzer
COMPANY RESTRICTED
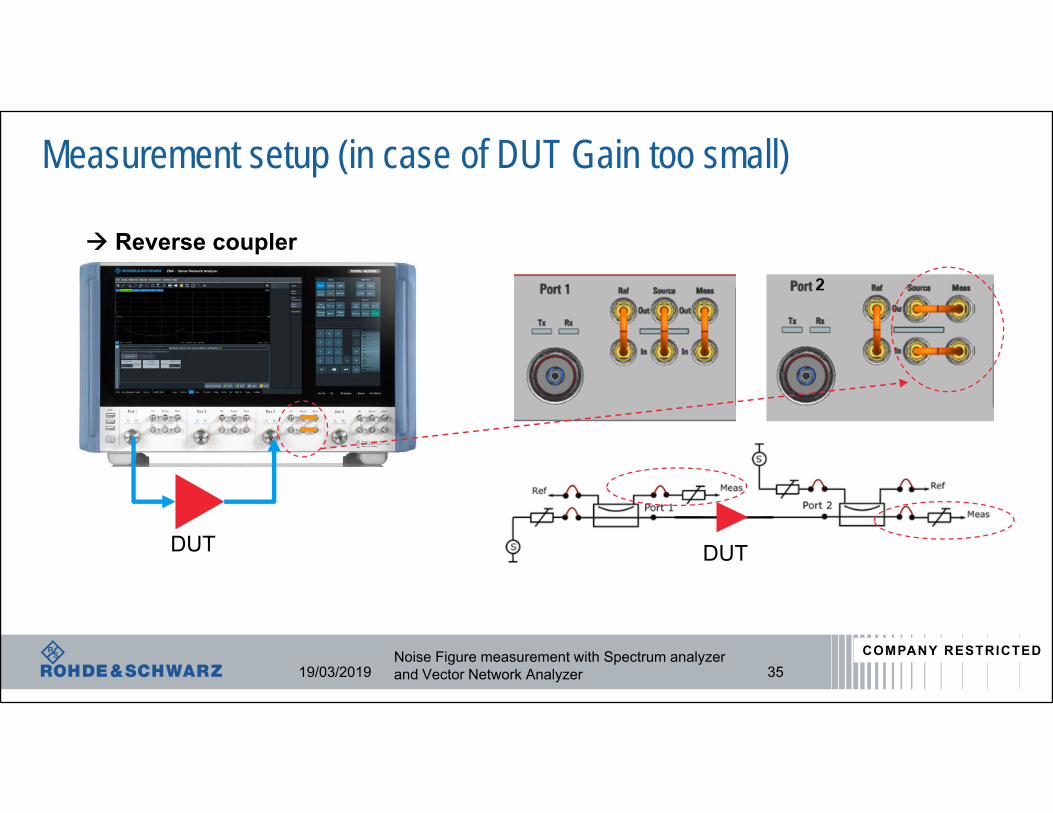
Measurement setup (in case of DUT Gain too small)
19/03/2019 35
DUT
Reverse coupler
DUT
Noise Figure measurement with Spectrum analyzerand Vector Network Analyzer
COMPANY RESTRICTED
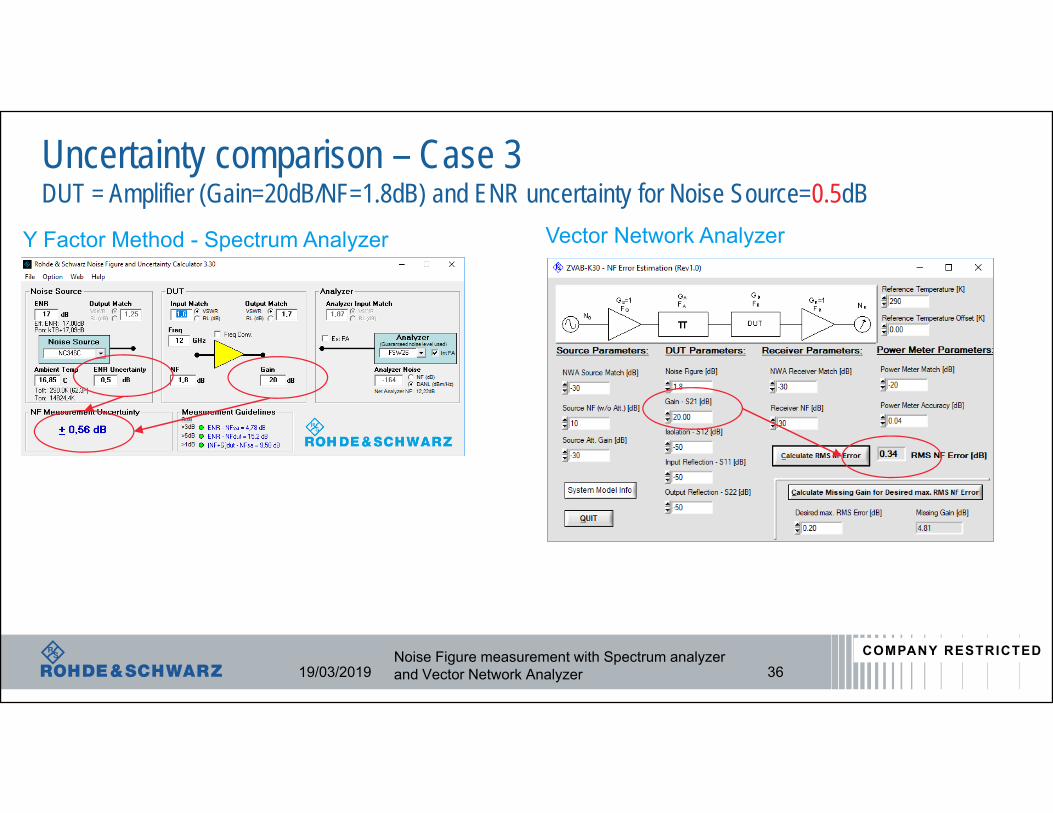
Uncertainty comparison – Case 3DUT = Amplifier (Gain=20dB/NF=1.8dB) and ENR uncertainty for Noise Source=0.5dB
19/03/2019 36
Y Factor Method - Spectrum Analyzer Vector Network Analyzer
Noise Figure measurement with Spectrum analyzerand Vector Network Analyzer
COMPANY RESTRICTED
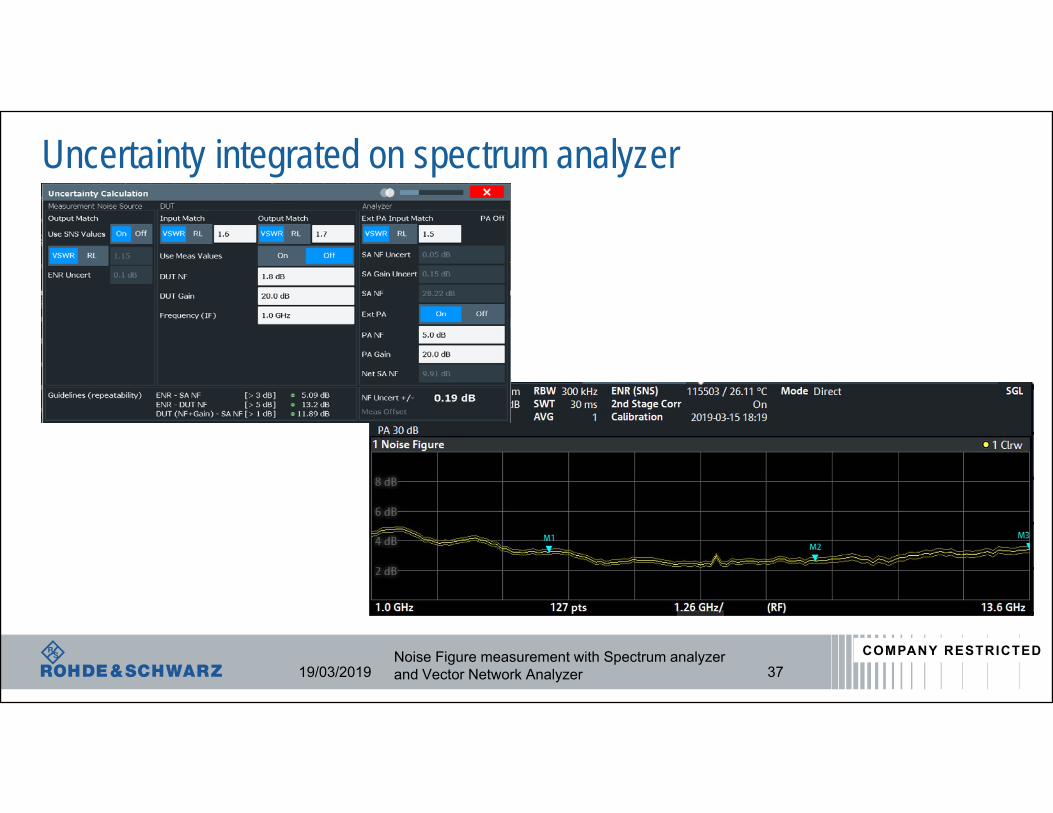
Uncertainty integrated on spectrum analyzer
19/03/2019 37Noise Figure measurement with Spectrum analyzerand Vector Network Analyzer
COMPANY RESTRICTED
Agenda
ı Background and theory
ı Measurement method : Spectrum analyzer
ı Measurement method : Vector Network Analyzer
ı Measurements uncertainty
ı Conclusion
19/03/2019 38Noise Figure measurement with Spectrum analyzerand Vector Network Analyzer
COMPANY RESTRICTED
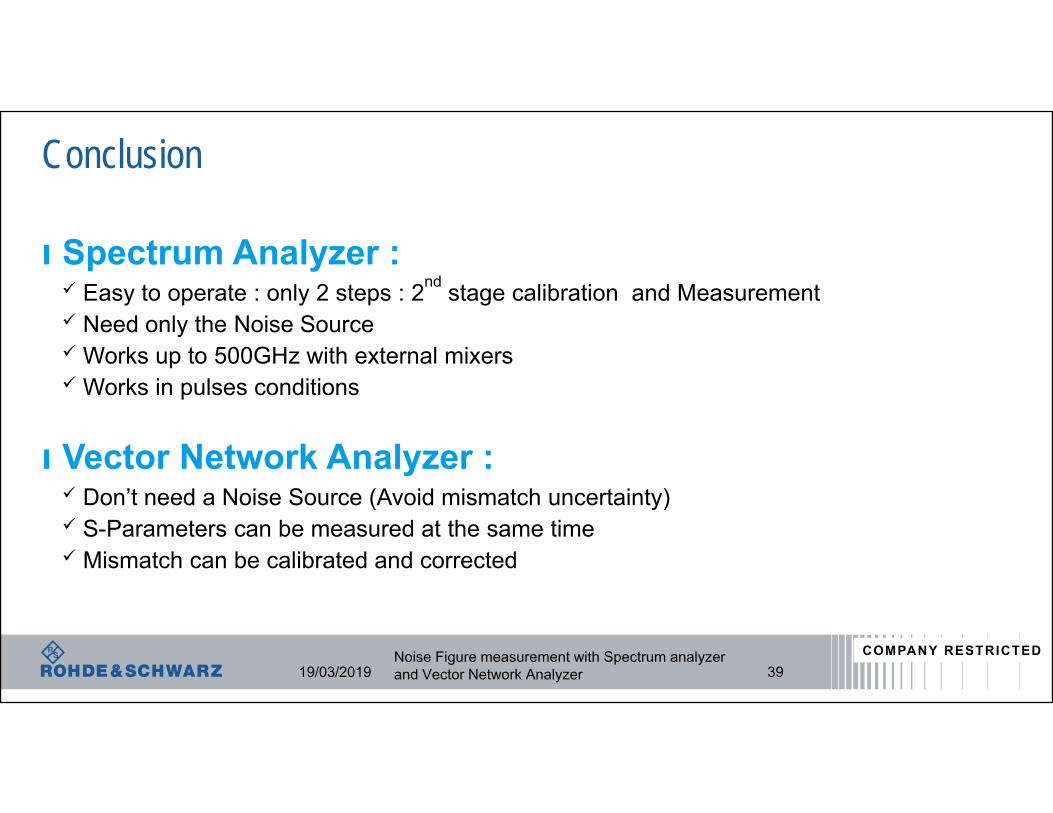
Conclusion
ı Spectrum Analyzer : Easy to operate : only 2 steps : 2nd stage calibration and Measurement Need only the Noise Source Works up to 500GHz with external mixers Works in pulses conditions
ı Vector Network Analyzer : Don’t need a Noise Source (Avoid mismatch uncertainty) S-Parameters can be measured at the same time Mismatch can be calibrated and corrected
19/03/2019 39Noise Figure measurement with Spectrum analyzerand Vector Network Analyzer
COMPANY RESTRICTED
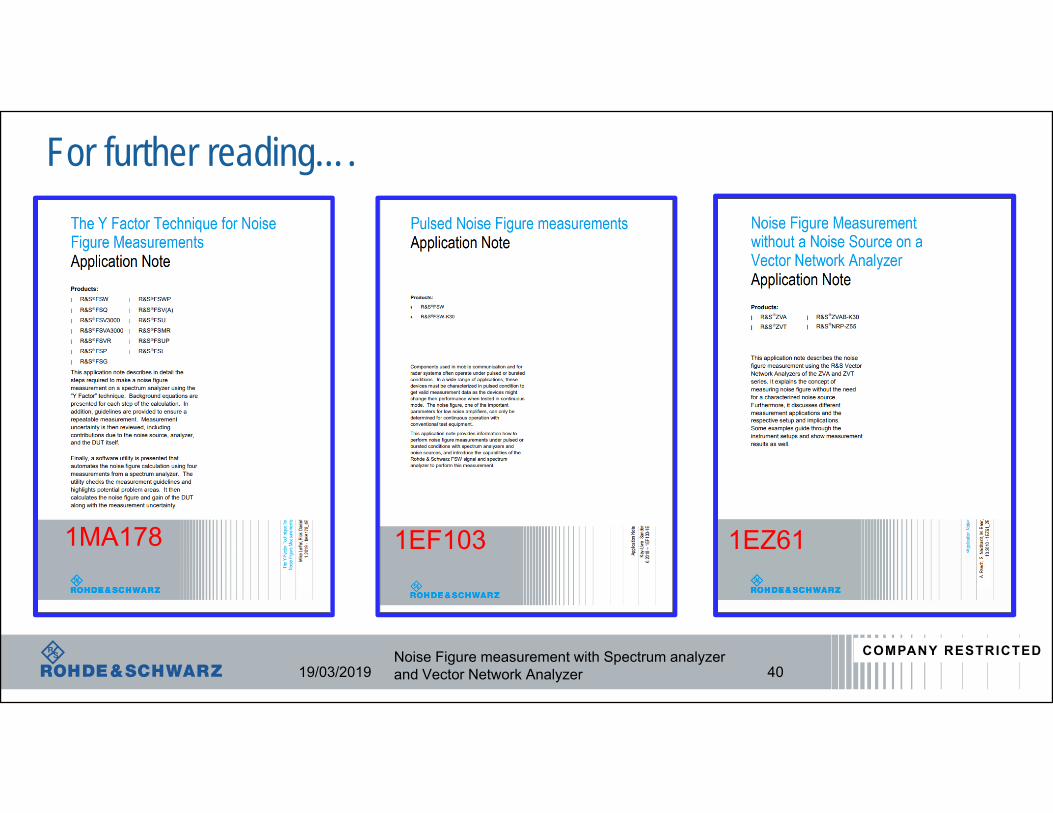
For further reading….
19/03/2019
1EF1031MA178 1EZ61
40Noise Figure measurement with Spectrum analyzerand Vector Network Analyzer
COMPANY RESTRICTED