Embed Size (px)
Citation preview
Appendix D Noise Impact Analysis Report

Elder Creek Channel Improvements NOISE IMPACT ANALYSIS CITY OF HIGHLAND PREPARED BY: Bill Lawson, PE, INCE [email protected] (949) 336-5979 Alex Wolfe, INCE [email protected] (949) 336-5977 JULY 11, 2019 11744-11 Noise Study

Elder Creek Channel Improvements Noise Impact Analysis
11744-11 Noise Study ii

Elder Creek Channel Improvements Noise Impact Analysis
11744-11 Noise Study iii
TABLE OF CONTENTS TABLE OF CONTENTS ........................................................................................................................... III APPENDICES ........................................................................................................................................ IV LIST OF EXHIBITS ................................................................................................................................. IV LIST OF TABLES ................................................................................................................................... IV LIST OF ABBREVIATED TERMS .............................................................................................................. V EXECUTIVE SUMMARY ......................................................................................................................... 1
Construction Noise Analysis .................................................................................................................... 1 Construction Vibration Analysis .............................................................................................................. 2
CONSTRUCTION MITIGATION PLAN ..................................................................................................... 5 1 INTRODUCTION ........................................................................................................................... 9
1.1 Site Location .................................................................................................................................. 9 1.2 Project Description ........................................................................................................................ 9
2 FUNDAMENTALS ....................................................................................................................... 13
2.1 Range of Noise ............................................................................................................................ 13 2.2 Noise Descriptors ........................................................................................................................ 14 2.3 Sound Propagation ...................................................................................................................... 14 2.4 Noise Control .............................................................................................................................. 15 2.5 Noise Barrier Attenuation ........................................................................................................... 15 2.6 Land Use Compatibility With Noise ............................................................................................ 16 2.7 Community Response to Noise ................................................................................................... 16 2.8 Exposure to High Noise Levels .................................................................................................... 17 2.9 Vibration ..................................................................................................................................... 17
3 REGULATORY SETTING .............................................................................................................. 21
3.1 State of California Noise Requirements ...................................................................................... 21 3.2 City of Highland General Plan Noise Element ............................................................................. 21 3.3 Construction Noise Standards..................................................................................................... 22 3.4 Construction Vibration Standards ............................................................................................... 23
4 SIGNIFICANCE CRITERIA ............................................................................................................ 25 5 EXISTING NOISE LEVEL MEASUREMENTS ................................................................................... 27
5.1 Measurement Procedure and Criteria ........................................................................................ 27 5.2 Noise Measurement Locations ................................................................................................... 27 5.3 Noise Measurement Results ....................................................................................................... 28
6 RECEIVER LOCATIONS................................................................................................................ 31 7 CONSTRUCTION IMPACTS ......................................................................................................... 33
7.1 Construction Analysis Inputs ....................................................................................................... 33 7.2 Typical Construction Activity Noise Levels .................................................................................. 35 7.3 Typical Construction Activity Noise Level Compliance ............................................................... 42 7.4 Pile Driving Construction Noise Levels ........................................................................................ 44 7.5 Pile Driving Construction Noise Level Compliance ..................................................................... 45 7.6 Construction Vibration Impacts .................................................................................................. 47
8 REFERENCES .............................................................................................................................. 53 9 CERTIFICATION .......................................................................................................................... 55
Elder Creek Channel Improvements Noise Impact Analysis
11744-11 Noise Study iv
APPENDICES APPENDIX 3.1: CITY OF HIGHLAND MUNICIPAL CODE APPENDIX 5.1: STUDY AREA PHOTOS APPENDIX 5.2: NOISE LEVEL MEASUREMENT WORKSHEETS APPENDIX 7.1: RCNM EQUIPMENT DATABASE APPENDIX 7.2: TEMPORARY NOISE BARRIER ATTENUATION CALCULATIONS APPENDIX 7.3: SAMPLE TEMPORARY CONSTRUCTION NOISE BARRIER PHOTOS
LIST OF EXHIBITS EXHIBIT 1-A: LOCATION MAP ............................................................................................................ 10 EXHIBIT 1-B: SITE PLAN...................................................................................................................... 11 EXHIBIT 2-A: TYPICAL NOISE LEVELS .................................................................................................. 13 EXHIBIT 2-B: NOISE LEVEL INCREASE PERCEPTION ............................................................................. 17 EXHIBIT 2-C: TYPICAL LEVELS OF GROUND-BORNE VIBRATION .......................................................... 19 EXHIBIT 5-A: NOISE MEASUREMENT LOCATIONS ............................................................................... 30 EXHIBIT 6-A: RECEIVER LOCATIONS ................................................................................................... 32 EXHIBIT 7-A: CONSTRUCTION ACTIVITY AND RECEIVER LOCATIONS ................................................... 34
LIST OF TABLES TABLE ES-1: CONSTRUCTION NOISE & VIBRATION MITIGATION MEASURES ........................................ 7 TABLE 4-1: SIGNIFICANCE CRITERIA SUMMARY .................................................................................. 26 TABLE 5-1: AMBIENT NOISE LEVEL MEASUREMENTS ......................................................................... 29 TABLE 7-1: CHURCH STREET MUCK OUT & ABBEY CHANNEL EQUIPMENT NOISE LEVELS .................... 35 TABLE 7-2: RCB AT ABBEY EQUIPMENT NOISE LEVELS ....................................................................... 36 TABLE 7-3: ABBEY TO MERRIS CHANNEL EQUIPMENT NOISE LEVELS .................................................. 37 TABLE 7-4: RCB AT MERRIS EQUIPMENT NOISE LEVELS ...................................................................... 38 TABLE 7-5: PAVING & CHANNEL NORTH OF MERRIS EQUIPMENT NOISE LEVELS ................................ 39 TABLE 7-6: FENCING & CLEANUP EQUIPMENT NOISE LEVELS ............................................................. 40 TABLE 7-7: UNMITIGATED EQUIPMENT NOISE LEVEL SUMMARY (DBA LEQ) ........................................ 41 TABLE 7-8: UNMITIGATED CONSTRUCTION EQUIPMENT NOISE LEVEL COMPLIANCE ......................... 42 TABLE 7-9: MITIGATED CONSTRUCTION EQUIPMENT NOISE LEVEL COMPLIANCE .............................. 43 TABLE 7-10: PILE DRIVING (IMPACT) EQUIPMENT NOISE LEVELS ........................................................ 44 TABLE 7-11: PILE DRIVING (DRILLING) EQUIPMENT NOISE LEVELS ..................................................... 45 TABLE 7-12: UNMITIGATED PILE DRIVING EQUIPMENT NOISE LEVEL COMPLIANCE ............................ 46 TABLE 7-13: MITIGATED PILE DRIVING EQUIPMENT NOISE LEVEL COMPLIANCE ................................ 47 TABLE 7-14: VIBRATION SOURCE LEVELS FOR CONSTRUCTION EQUIPMENT ...................................... 47 TABLE 7-15: UNMITIGATED CONSTRUCTION EQUIPMENT VIBRATION LEVELS ................................... 50 TABLE 7-16: ALTERNATIVE PILE DRIVING CONSTRUCTION EQUIPMENT VIBRATION LEVELS ............... 51
Elder Creek Channel Improvements Noise Impact Analysis
11744-11 Noise Study v
LIST OF ABBREVIATED TERMS (1) Reference ADT Average Daily Traffic ANSI American National Standards Institute CEQA California Environmental Quality Act CNEL Community Noise Equivalent Level dBA A-weighted decibels FHWA Federal Highway Administration FTA Federal Transit Administration INCE Institute of Noise Control Engineering Leq Equivalent continuous (average) sound level Lmax Maximum level measured over the time interval Lmin Minimum level measured over the time interval mph Miles per hour PPV Peak Particle Velocity Project Elder Creek Channel Improvements RMS Root-mean-square VdB Vibration Decibels

Elder Creek Channel Improvements Noise Impact Analysis
11744-11 Noise Study vi
This page intentionally left blank

Elder Creek Channel Improvements Noise Impact Analysis
11744-11 Noise Study 1
EXECUTIVE SUMMARY
Urban Crossroads, Inc. has prepared this noise study to determine the noise exposure and the necessary noise mitigation measures, if any, for the proposed Elder Creek Channel Improvements (“Project”). The Project site is located between Old Greenspot to approximately 650 feet southwest of Abbey Road in the City of Highland. The proposed Project includes the construction of improvements to the Elder Creek Channel beginning downstream of Old Greenspot Road, and terminating just below the confluence of Elder and Church Channel. This study has been prepared consistent with applicable City of Highland noise standards, and significance criteria based on guidance provided by Appendix G of the California Environmental Quality Act (CEQA) Guidelines. (1)
CONSTRUCTION NOISE ANALYSIS
Construction activities are expected to create temporary and intermittent high-level noise conditions at receiver locations surrounding the Project site. This analysis includes an evaluation of typical construction equipment activities in addition to providing a focused assessment of potential impacts related to pile-driving equipment. While public works projects, such as the Elder Creek Channel Improvements, are considered exempt from the noise standards of the City of Highland Municipal Code, neither the General Plan nor Municipal Code establish numeric construction source noise level thresholds at potentially affected receivers for analysis under CEQA. Therefore, this noise analysis relies on the National Institute for Occupational Safety and Health (NIOSH) threshold of 85 dBA Leq, which is consistent with and more conservative than the Federal Transit Administration (FTA) threshold of 90 dBA Leq for daytime construction activities.
TYPICAL CONSTRUCTION ACTIVITY NOISE LEVELS
The highest unmitigated construction noise levels at each receiver location are expected to range from 75 to 92 dBA Leq, and will exceed the 85 dBA Leq threshold at 6 of the 13 receiver locations: R1, R3, R5, R6, R8, and R9. Therefore, unmitigated Project construction noise levels from typical construction activities are considered potentially significant impacts at receiver locations R1, R3, R5, R6, R8, and R9, if they represent occupied, sensitive receiver locations (e.g., residential use) at the time of Project construction. As a part of the Construction Mitigation Plan for the Project, temporary construction noise mitigation measures are, therefore, required to reduce the impacts at receiver locations R1, R3, R5, R6, R8, and R9. This includes construction noise mitigation in the form of minimum 10-foot high temporary noise barriers when activities are within 25 feet of nearby, occupied receiver locations. The temporary construction noise barrier mitigation will reduce the construction noise levels at the potentially impacted receiver locations to satisfy the 85 dBA Leq threshold for noise-sensitive receiver locations. Therefore, the noise impact due to typical Project construction activities is considered a less than significant impact with mitigation for receiver locations R1, R3, R5, R6, R8, and R9. The construction noise mitigation plan further outlines the required mitigation measures to reduce construction noise impacts.
Elder Creek Channel Improvements Noise Impact Analysis
11744-11 Noise Study 2
PILE DRIVING CONSTRUCTION NOISE LEVELS
The pile driving construction noise analysis shows that the highest construction noise levels will occur if impact pile driving equipment is used at the closest point from the edge of primary construction activity to each of the nearby receiver locations. The impact pile driving equipment noise levels, ranging from 76 to 108 dBA Leq will exceed the 85 dBA Leq construction noise level threshold at 10 of the 13 receiver locations: R1 to R10. Pile driving equipment noise levels with alternative drilling equipment, instead of impact devices, are shown to range from 59 to 91 dBA Leq and will exceed the 85 dBA Leq construction noise level threshold at four of the 13 receiver locations: R1, R3, R5, and R8. Therefore, both the unmitigated impact and drilling pile driving equipment noise levels represent potentially significant noise impacts.
Construction noise mitigation measures are therefore required to reduce the impacts at the nearby, occupied sensitive receiver locations. Non-impact pile driving equipment (e.g., drilling or other non-impact methods) shall be required to reduce the pile driving equipment noise levels at adjacent receiver locations. Further, mitigation in the form of minimum 10-foot high temporary noise barriers when activities are within 25 feet of nearby receiver locations shall be required. The temporary construction noise barrier mitigation will reduce the pile driving (e.g., drilling or non-impact alternative) equipment noise levels at the potentially impacted, occupied receiver locations to satisfy the 85 dBA Leq threshold for noise-sensitive receiver locations. Therefore, the noise impact due to typical Project construction activities is considered a less than significant impact with mitigation for receiver locations R1, R3, R5, and R8 during pile driving (e.g., drilling or non-impact alternative) activities. The Construction Mitigation Plan further outlines the required mitigation measures to reduce pile driving noise impacts.
CONSTRUCTION VIBRATION ANALYSIS
Construction activities are expected to create temporary and intermittent high-level vibration conditions at receivers surrounding the Project site. This analysis includes an evaluation of typical construction equipment activities in addition to providing a focused assessment of potential impacts related to pile-driving equipment.
TYPICAL CONSTRUCTION ACTIVITY VIBRATION LEVELS
At distances ranging from 10 to 73 feet from the Project site, typical construction activity vibration velocity levels are expected to range from 0.018 to 0.352 in/sec PPV. As such, Project construction vibration levels will exceed the County of San Bernardino Development Code threshold of 0.2 in/sec PPV at receiver locations R1, R3, and R8. In addition, construction vibration levels are shown to exceed the building damage threshold of 0.3 in/sec PPV at receiver locations R3 and R8. Therefore, the unmitigated temporary construction-related vibration levels are considered a potentially significant impact.

Elder Creek Channel Improvements Noise Impact Analysis
11744-11 Noise Study 3
Temporary construction vibration mitigation measures are required to reduce the impacts at nearby sensitive receiver locations. The Construction Mitigation Plan outlined in this report identifies the measures required to satisfy the 0.3 in/sec PPV building damage vibration threshold at nearby sensitive receiver locations to less than significant impacts after mitigation. Mitigation includes ground-borne vibration monitoring of nearby residential structures, represented by receiver locations R1, and R3 to R8 adjacent to the channel between Old Greenspot Road and Merris Street, shall be required for the duration of Project construction between Old Greenspot Road and Merris Street. The monitoring shall be based on the Caltrans residential building damage threshold of 0.3 in/sec PPV. Though Caltrans identifies a residential building damage threshold of 0.3 in/sec PPV, the County of San Bernardino may require that vibration levels do not exceed a more conservative threshold (e.g., lower) at their discretion.
However, vibration levels will still exceed the human annoyance threshold of 0.2 in/sec PPV at receiver locations R1, R3, and R8, and therefore, Project typical construction vibration levels represent a potentially significant impact at occupied residential homes in relation to human annoyance with mitigation. The Construction Mitigation Plan outlined in this report identifies the measures required to satisfy the County’s 0.2 in/sec PPV threshold at nearby sensitive receiver locations to less than significant impacts after mitigation. If monitored vibration levels exceed the 0.2 in/sec PPV annoyance threshold then relocation of residents, and/or hours restrictions to day(s)/time(s) when the impacted receiver(s) are unoccupied, shall be provided for the duration of activities within 25 feet of the affected receiver location(s).
Further, vibration levels at the site of the closest sensitive receiver are unlikely to be sustained during the entire construction period, but will occur rather only during the times that heavy construction equipment is operating adjacent to the Project site perimeter. Moreover, construction at the Project site will be restricted to daytime hours consistent with City requirements thereby eliminating potential vibration impacts during the sensitive nighttime hours.
PILE DRIVING CONSTRUCTION VIBRATION LEVELS
At distances ranging from 10 to 384 feet from pile driving (impact) activities, vibration velocity levels are expected to range from 0.011 to 2.530 in/sec PPV. The Project construction vibration levels will exceed the County’s threshold of 0.2 in/sec PPV at receiver locations R1 to R8. In addition, pile driving (impact) vibration levels are shown to exceed the building damage threshold of 0.3 in/sec PPV at receiver locations R1, and R3 to R8. Therefore, the unmitigated temporary impact pile driving-related vibration levels are considered a potentially significant impact.
Temporary construction vibration mitigation measures are required to reduce the impacts at nearby sensitive receiver locations during pile driving activities. Consistent with the pile driving measures identified in this report to reduce impact pile driving noise levels, the use of alternative pile driving equipment (e.g., drilling or non-impact alternative) shall be required instead of impact devices. The mitigated pile driving vibration levels with alternative equipment (e.g., drilling or non-impact alternative) will be reduced to range from 0.001 to 0.352 in/sec PPV, and will still exceed the Caltrans 0.3 in/sec PPV building damage threshold for older residential structures at receiver locations R3 and R8. Therefore, the vibration monitoring as part of the Construction

Elder Creek Channel Improvements Noise Impact Analysis
11744-11 Noise Study 4
Mitigation Plan identified in this noise study shall be required to reduce impacts to less than significant levels.
In addition, pile driving (e.g., drilling or non-impact alternative) equipment vibration levels will potentially exceed the human annoyance threshold of 0.2 in/sec PPV at receiver locations R1, R3, and R8, and therefore, Project pile driving (e.g., drilling or non-impact alternative) vibration levels represent a potentially significant impact at occupied residential homes in relation to human annoyance with mitigation. However, the Construction Mitigation Plan outlined in this report identifies the measures required to satisfy the 0.2 in/sec PPV human annoyance vibration threshold at nearby sensitive receiver locations to less than significant impacts after mitigation.

Elder Creek Channel Improvements Noise Impact Analysis
11744-11 Noise Study 5
CONSTRUCTION MITIGATION PLAN
The following construction noise and vibration mitigation plan is required to reduce potential impacts at adjacent, sensitive residential structures, and occupied sensitive residential receiver locations. Table ES-1 outlines the mitigated measures listed below.
1. MITIGATION MEASURES REQUIRED TO REDUCE IMPACTS AT SENSITIVE STRUCTURES
• The use of impact pile driving equipment shall be prohibited. Instead, alternative pile driving methods and equipment (e.g., drilling or non-impact alternative) shall be used to reduce Project construction noise and vibration levels.
• Pre- and post-construction surveys of the nearby residential structure(s), documenting the condition of the interior and exterior of the structures, shall be provided for residential structures represented by receiver locations R1, and R3 to R8, adjacent to the channel between Old Greenspot Road and Merris Street.
• Ground-borne vibration monitoring of nearby residential structures, represented by receiver locations R1, and R3 to R8 adjacent to the channel between Old Greenspot Road and Merris Street, shall be required for the duration of Project construction between Old Greenspot Road and Merris Street. The monitoring shall be based on the Caltrans residential building damage threshold of 0.3 in/sec PPV. Though Caltrans identifies a residential building damage threshold of 0.3 in/sec PPV, the County of San Bernardino may require that vibration levels do not exceed a more conservative threshold (e.g., lower) at their discretion.
2. MITIGATION MEASURES REQUIRED TO REDUCE IMPACTS AT SENSITIVE RECEIVER LOCATIONS (IF OCCUPIED)
• If monitored vibration levels exceed the County of San Bernardino 0.2 in/sec PPV annoyance threshold then relocation of residents, and/or hours restrictions to day(s)/time(s) when the impacted receiver(s) are unoccupied, shall be provided for the duration of activities within 25 feet of the affected receiver location(s).
• Install the following temporary construction noise barriers at the minimum heights specified for each receiver location when Project construction activities are within 25 feet of occupied noise-sensitive residential homes:
o Minimum 10-foot high temporary noise barriers for occupied residential homes represented by receiver locations R1, and R3 to R9;
o The temporary noise control barriers shall be located at the edge of Project construction activities and must have a solid face from top to bottom. The noise control barrier must meet the minimum height and be constructed as follows:
The temporary noise barrier shall provide a minimum transmission loss of 20 dBA (Federal Highway Administration, Noise Barrier Design Handbook). The noise barrier shall be constructed using an acoustical blanket (e.g. vinyl acoustic curtains or quilted blankets) attached to the construction site perimeter fence or equivalent temporary fence posts. Example photos are provided in Appendix 7.3;
The noise barrier must be maintained, and any damage promptly repaired. Gaps, holes, or weaknesses in the barrier or openings between the barrier and the ground shall be promptly repaired;

Elder Creek Channel Improvements Noise Impact Analysis
11744-11 Noise Study 6
The noise control barrier and associated elements shall be completely removed, and the site appropriately restored upon the conclusion of the construction activity.
Relocation and/or Hours Restrictions
o If the above is not feasible then relocation of residents, and/or hours restrictions to day(s)/time(s) when the impacted receiver(s) are unoccupied, shall be provided for the duration of activities within 25 feet of the affected receiver location(s).
STANDARD MEASURES REQUIRED THROUGHOUT PROJECT CONSTRUCTION
• During all Project site construction, the construction contractors shall equip all construction equipment, fixed or mobile, with properly operating and maintained mufflers, consistent with manufacturers’ standards. The construction contractor shall place all stationary construction equipment so that emitted noise is directed away from the noise-sensitive receivers nearest the Project site.
• The construction contractor shall locate equipment staging in areas that will create the greatest distance between construction-related noise sources and noise-sensitive receivers nearest the Project site during all Project construction (i.e., south of Abbey Way).
• The contractor shall design delivery routes to minimize the exposure of sensitive land uses or residential dwellings to delivery truck-related noise.
• Residences and other noise-sensitive land uses within 100 feet of Project construction shall be notified of the construction in writing. The notification shall describe the activities anticipated, provide dates and hours of activity, and provide contact information with a description of a noise and/or vibration complaint and response procedure. The notification shall also advise residents to remain indoors with windows closed when construction activity is occurring outside of their homes to avoid elevated exterior noise and/or vibration levels.

Elde
r Cre
ek C
hann
el Im
prov
emen
ts N
oise
Impa
ct A
naly
sis
1174
4-11
Noi
se S
tudy
7
TABL
E ES
-1:
CON
STRU
CTIO
N N
OIS
E &
VIB
RATI
ON
MIT
IGAT
ION
MEA
SURE
S
Cons
truc
tion
Activ
ity
Vibr
atio
n Le
vel
Thre
shol
d (in
/sec
PPV
)
Tem
pora
ry
Noi
se B
arrie
r Sc
reen
ing
Dis
tanc
e (F
eet)
Noi
se L
evel
Th
resh
old
(dBA
Leq
)
Whe
n Re
quire
d?
MIT
IGAT
ION
MEA
SURE
S RE
QU
IRED
TO
RED
UCE
IMPA
CTS
AT S
ENSI
TIVE
STR
UCT
URE
S
Pile
Driv
ing
Impa
ct
The
use
of im
pact
pile
driv
ing
equi
pmen
t sha
ll be
pro
hibi
ted.
Ins
tead
, alte
rnat
ive
pile
driv
ing
met
hods
and
equ
ipm
ent (
e.g.
, dril
ling
or n
on-im
pact
al
tern
ativ
e) sh
all b
e us
ed to
redu
ce P
roje
ct c
onst
ruct
ion
noise
and
vib
ratio
n le
vels.
All C
onst
ruct
ion
Activ
ities
Be
twee
n O
ld G
reen
spot
Roa
d an
d M
erris
Str
eet
0.3
in/s
ec P
PV
Build
ing
Dam
age
at
sens
itive
stru
ctur
es
- -
Gro
und-
born
e vi
brat
ion
mon
itorin
g of
nea
rby
resid
entia
l str
uctu
res,
re
pres
ente
d by
rece
iver
loca
tions
R1,
and
R3
to R
8 ad
jace
nt to
the
chan
nel
betw
een
Old
Gre
ensp
ot R
oad
and
Mer
ris S
tree
t, sh
all b
e re
quire
d fo
r the
du
ratio
n of
Pro
ject
con
stru
ctio
n be
twee
n O
ld G
reen
spot
Roa
d an
d M
erris
St
reet
.
The
Coun
ty o
f San
Ber
nard
ino
may
requ
ire th
at v
ibra
tion
leve
ls do
not
ex
ceed
a m
ore
cons
erva
tive
thre
shol
d (e
.g.,
low
er) a
t the
ir di
scre
tion.
MIT
IGAT
ION
MEA
SURE
S RE
QU
IRED
TO
RED
UCE
IMPA
CTS
AT S
ENSI
TIVE
REC
EIVE
R LO
CATI
ON
S (IF
OCC
UPI
ED)
Activ
ities
Gen
erat
ing
Vibr
atio
n Le
vels
in E
xces
s of
0.2
in/s
ec P
PV
At O
ccup
ied
Sens
itive
Re
ceiv
er L
ocat
ions
0.2
in/s
ec P
PV
Anno
yanc
e at
occ
upie
d se
nsiti
ve
rece
iver
loca
tions
- -
If m
onito
red
vibr
atio
n le
vels
exce
ed th
e Co
unty
's 0.
2 in
/sec
ann
oyan
ce
thre
shol
d th
en re
loca
tion
of re
siden
ts, a
nd/o
r hou
rs re
stric
tions
to
day(
s)/t
ime(
s) w
hen
the
impa
cted
rece
iver
(s) a
re u
nocc
upie
d, sh
all b
e pr
ovid
ed fo
r the
dur
atio
n of
act
iviti
es w
ithin
25
feet
of t
he a
ffect
ed re
ceiv
er
loca
tion(
s).
All C
onst
ruct
ion
Activ
ities
N
oise
-spe
cific
miti
gatio
n -
25'
85 d
BA L
eq
at o
ccup
ied
sens
itive
re
ceiv
er lo
catio
ns
Tem
pora
ry 1
0-fo
ot h
igh
noise
bar
riers
requ
ired
if co
nstr
uctio
n ac
tivity
occ
urs
with
in 2
5 fe
et o
f occ
upie
d se
nsiti
ve re
ceiv
ers.
If th
e no
ise le
vel t
hres
hold
can
not b
e sa
tisfie
d, re
loca
tion
of re
siden
ts,
and/
or h
ours
rest
rictio
ns to
day
(s)/
time(
s) w
hen
the
impa
cted
rece
iver
(s) a
re
unoc
cupi
ed, s
hall
be p
rovi
ded.

Elder Creek Channel Improvements Noise Impact Analysis
11744-11 Noise Study 8
This page intentionally left blank
Elder Creek Channel Improvements Noise Impact Analysis
11744-11 Noise Study 9
1 INTRODUCTION
This noise analysis has been completed to determine the noise impacts associated with the development of the proposed Elder Creek Channel Improvements (“Project”). This noise study briefly describes the proposed Project, provides information regarding noise fundamentals, describes the local regulatory setting, and provides the study methods and procedures for construction noise analysis.
1.1 SITE LOCATION
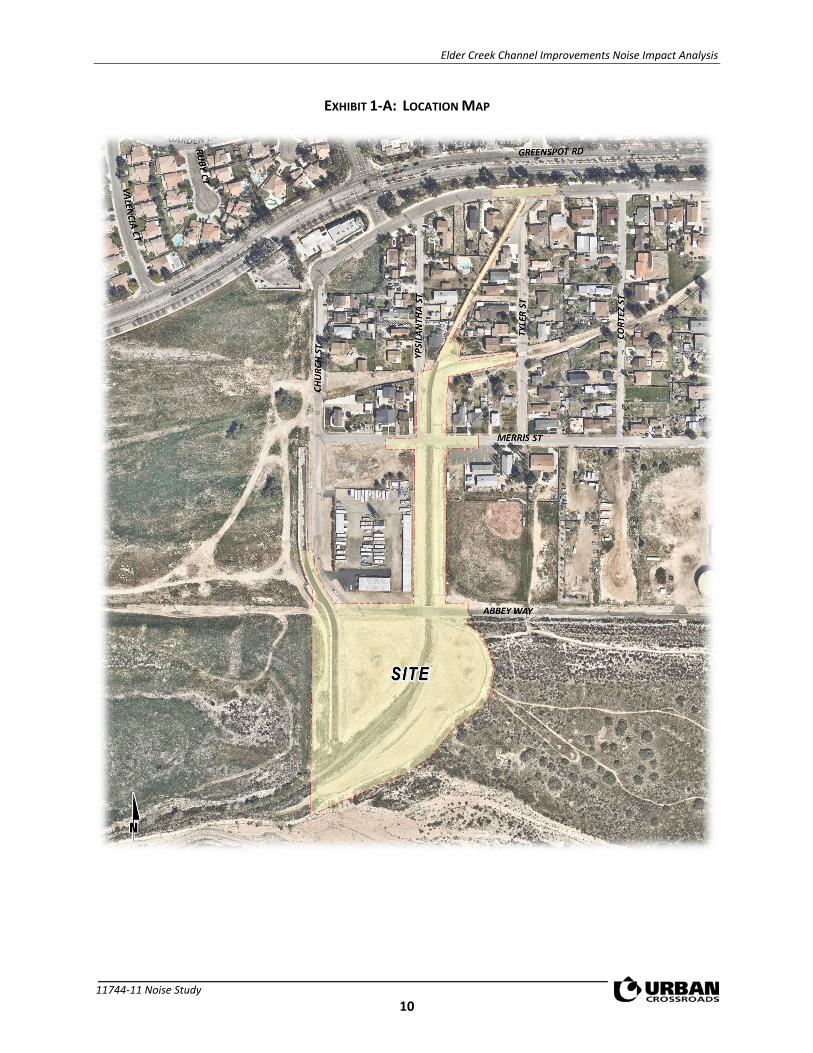
The proposed Elder Creek Channel Improvements Project is located between Old Greenspot to approximately 650 feet southwest of Abbey Road in the City of Highland, as shown on Exhibit 1-A. Existing noise-sensitive land uses in the Project study area include residential homes immediately adjacent to the Project site.
1.2 PROJECT DESCRIPTION
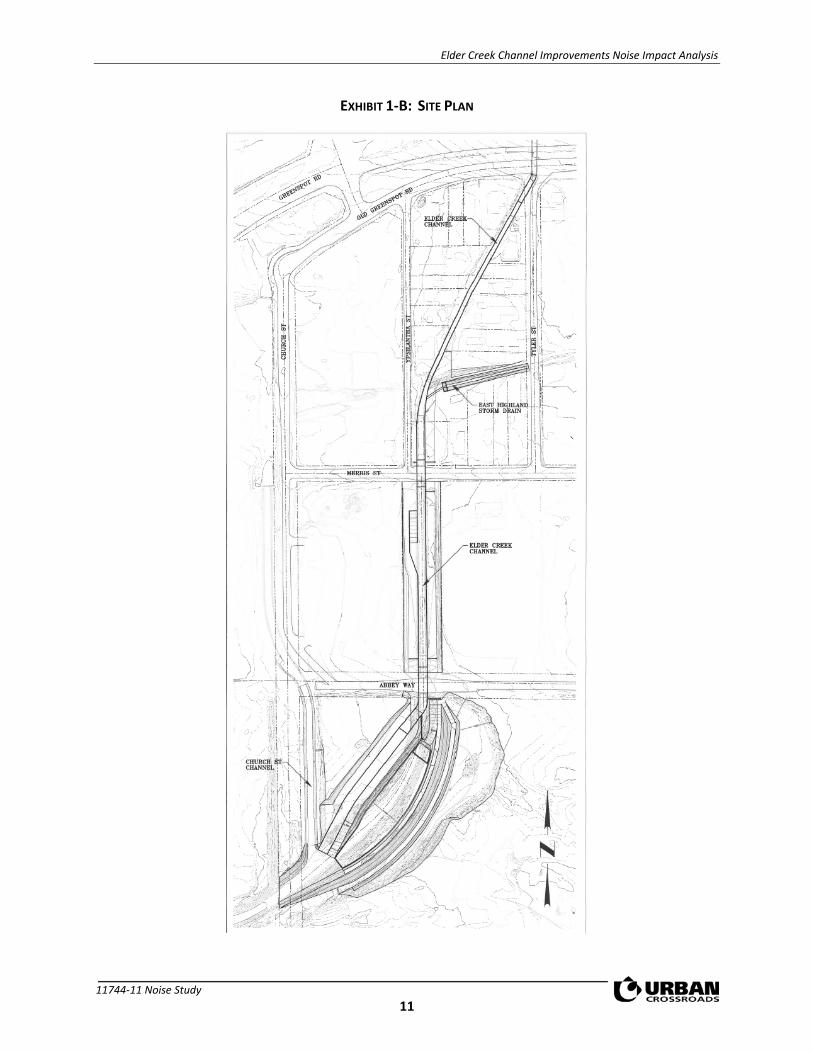
The proposed Project begins downstream of Old Greenspot Road, and terminates just below the confluence of Elder and Church Channel, as shown on Exhibit 1-B. With this Project, the Reinforced Concrete Box (RCB) between Old Greenspot Road and Merris Street will be deepened and may be redesigned as an open concrete channel. Additionally, the existing, open concrete channel just downstream of the RCB will be widened to approximately 26 feet and deepened to provide needed flow capacity. Downstream of this open concrete channel, the existing rip-rap and revetment-improved earthen channel between Merris Street and Abbey Way will be reconfigured to a 26-foot wide open horizontal concrete channel and deepened to meet the flows upstream. Dual access roads will remain at this location. Additionally, there will be two road box culverts replaced with approximately 26-foot wide culverts, one at Merris Street and one at Abbey Way. Downstream of Abbey Way, the proposed improvements consists of constructing an open concrete channel, approximately 26-foot wide, with a low flow diversion that feeds the existing earthen channel. The open concrete channel ties into existing Elder Creek approximately 600 linear feet below Abbey Way.
The system will require periodic maintenance, including the low-flow channel and possibly of the rip-rap tie-in-point of the Elder and Church Channel. The maintenance is anticipated to be minimal, occurring once a year or every few years, depending on duration and intensity of future storms. There may be a one-time maintenance of approximately 700 linear feet of Church Channel just upstream of the confluence with Elder, including sediment and vegetation and debris removal, prior to completion of the Project.
Elder Creek Channel Improvements Noise Impact Analysis
11744-11 Noise Study 10
EXHIBIT 1-A: LOCATION MAP
Elder Creek Channel Improvements Noise Impact Analysis
11744-11 Noise Study 11
EXHIBIT 1-B: SITE PLAN

Elder Creek Channel Improvements Noise Impact Analysis
11744-11 Noise Study 12
This page intentionally left blank
Elder Creek Channel Improvements Noise Impact Analysis
11744-11 Noise Study 13
2 FUNDAMENTALS
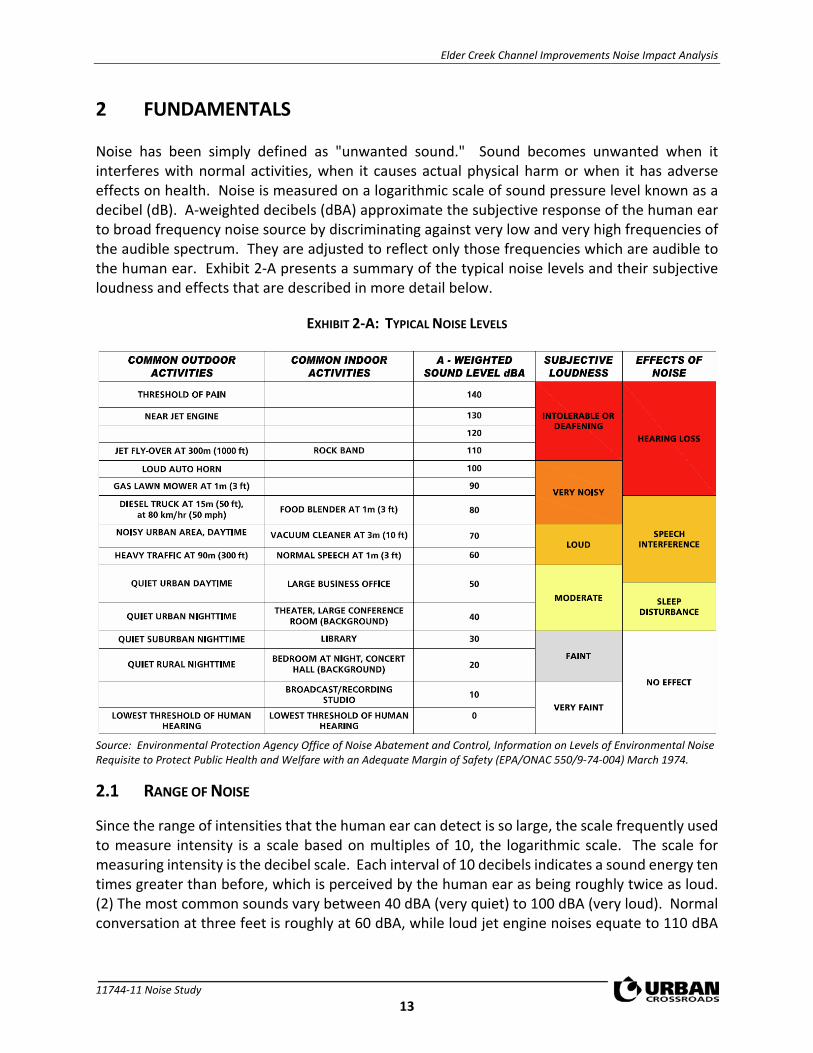
Noise has been simply defined as "unwanted sound." Sound becomes unwanted when it interferes with normal activities, when it causes actual physical harm or when it has adverse effects on health. Noise is measured on a logarithmic scale of sound pressure level known as a decibel (dB). A-weighted decibels (dBA) approximate the subjective response of the human ear to broad frequency noise source by discriminating against very low and very high frequencies of the audible spectrum. They are adjusted to reflect only those frequencies which are audible to the human ear. Exhibit 2-A presents a summary of the typical noise levels and their subjective loudness and effects that are described in more detail below.
EXHIBIT 2-A: TYPICAL NOISE LEVELS
Source: Environmental Protection Agency Office of Noise Abatement and Control, Information on Levels of Environmental Noise Requisite to Protect Public Health and Welfare with an Adequate Margin of Safety (EPA/ONAC 550/9-74-004) March 1974.
2.1 RANGE OF NOISE
Since the range of intensities that the human ear can detect is so large, the scale frequently used to measure intensity is a scale based on multiples of 10, the logarithmic scale. The scale for measuring intensity is the decibel scale. Each interval of 10 decibels indicates a sound energy ten times greater than before, which is perceived by the human ear as being roughly twice as loud. (2) The most common sounds vary between 40 dBA (very quiet) to 100 dBA (very loud). Normal conversation at three feet is roughly at 60 dBA, while loud jet engine noises equate to 110 dBA
Elder Creek Channel Improvements Noise Impact Analysis
11744-11 Noise Study 14
at approximately 100 feet, which can cause serious discomfort. (3) Another important aspect of noise is the duration of the sound and the way it is described and distributed in time.
2.2 NOISE DESCRIPTORS
Environmental noise descriptors are generally based on averages, rather than instantaneous, noise levels. The most commonly used figure is the equivalent level (Leq). Equivalent sound levels are not measured directly but are calculated from sound pressure levels typically measured in A-weighted decibels (dBA). The equivalent sound level (Leq) represents a steady state sound level containing the same total energy as a time varying signal over a given sample period and is commonly used to describe the “average” noise levels within the environment.
Peak hour or average noise levels, while useful, do not completely describe a given noise environment. Noise levels lower than peak hour may be disturbing if they occur during times when quiet is most desirable, namely evening and nighttime (sleeping) hours. To account for this, the Community Noise Equivalent Level (CNEL), representing a composite 24-hour noise level is utilized. The CNEL is the weighted average of the intensity of a sound, with corrections for time of day, and averaged over 24 hours. The time of day corrections require the addition of 5 decibels to dBA Leq sound levels in the evening from 7:00 p.m. to 10:00 p.m., and the addition of 10 decibels to dBA Leq sound levels at night between 10:00 p.m. and 7:00 a.m. These additions are made to account for the noise sensitive time periods during the evening and night hours when sound appears louder. CNEL does not represent the actual sound level heard at any time, but rather represents the total sound exposure. The City of Highland relies on the 24-hour CNEL level to assess land use compatibility with transportation related noise sources.
2.3 SOUND PROPAGATION
When sound propagates over a distance, it changes in level and frequency content. The way noise reduces with distance depends on the following factors.
2.3.1 GEOMETRIC SPREADING
Sound from a localized source (i.e., a stationary point source) propagates uniformly outward in a spherical pattern. The sound level attenuates (or decreases) at a rate of 6 dB for each doubling of distance from a point source. Highways consist of several localized noise sources on a defined path and hence can be treated as a line source, which approximates the effect of several point sources. Noise from a line source propagates outward in a cylindrical pattern, often referred to as cylindrical spreading. Sound levels attenuate at a rate of 3 dB for each doubling of distance from a line source. (2)
2.3.2 GROUND ABSORPTION
The propagation path of noise from a highway to a receptor is usually very close to the ground. Noise attenuation from ground absorption and reflective wave canceling adds to the attenuation associated with geometric spreading. Traditionally, the excess attenuation has also been expressed in terms of attenuation per doubling of distance. This approximation is usually

Elder Creek Channel Improvements Noise Impact Analysis
11744-11 Noise Study 15
sufficiently accurate for distances of less than 200 ft. For acoustically hard sites (i.e., sites with a reflective surface between the source and the receptor, such as a parking lot or body of water), no excess ground attenuation is assumed. For acoustically absorptive or soft sites (i.e., those sites with an absorptive ground surface between the source and the receptor such as soft dirt, grass, or scattered bushes and trees), an excess ground attenuation value of 1.5 dB per doubling of distance is normally assumed. When added to the cylindrical spreading, the excess ground attenuation results in an overall drop-off rate of 4.5 dB per doubling of distance from a line source. (4)
2.3.3 ATMOSPHERIC EFFECTS
Receptors located downwind from a source can be exposed to increased noise levels relative to calm conditions, whereas locations upwind can have lowered noise levels. Sound levels can be increased at large distances (e.g., more than 500 feet) due to atmospheric temperature inversion (i.e., increasing temperature with elevation). Other factors such as air temperature, humidity, and turbulence can also have significant effects. (2)
2.3.4 SHIELDING
A large object or barrier in the path between a noise source and a receptor can substantially attenuate noise levels at the receptor. The amount of attenuation provided by shielding depends on the size of the object and the frequency content of the noise source. Shielding by trees and other such vegetation typically only has an “out of sight, out of mind” effect. That is, the perception of noise impact tends to decrease when vegetation blocks the line-of-sight to nearby resident. However, for vegetation to provide a substantial, or even noticeable, noise reduction, the vegetation area must be at least 15 feet in height, 100 feet wide and dense enough to completely obstruct the line-of sight between the source and the receiver. This size of vegetation may provide up to 5 dBA of noise reduction. The FHWA does not consider the planting of vegetation to be a noise abatement measure. (4)
2.4 NOISE CONTROL
Noise control is the process of obtaining an acceptable noise environment for an observation point or receptor by controlling the noise source, transmission path, receptor, or all three. This concept is known as the source-path-receptor concept. In general, noise control measures can be applied to these three elements.
2.5 NOISE BARRIER ATTENUATION
Effective noise barriers can reduce noise levels by 10 to 15 dBA, cutting the loudness of traffic noise in half. A noise barrier is most effective when placed close to the noise source or receptor. Noise barriers, however, do have limitations. For a noise barrier to work, it must be high enough and long enough to block the path of the noise source. (4)
Elder Creek Channel Improvements Noise Impact Analysis
11744-11 Noise Study 16
2.6 LAND USE COMPATIBILITY WITH NOISE
Some land uses are more tolerant of noise than others. For example, schools, hospitals, churches, and residences are more sensitive to noise intrusion than are commercial or industrial developments and related activities. As ambient noise levels affect the perceived amenity or livability of a development, so too can the mismanagement of noise impacts impair the economic health and growth potential of a community by reducing the area’s desirability as a place to live, shop and work. For this reason, land use compatibility with the noise environment is an important consideration in the planning and design process. The FHWA encourages State and Local government to regulate land development in such a way that noise-sensitive land uses are either prohibited from being located adjacent to a highway, or that the developments are planned, designed, and constructed in such a way that noise impacts are minimized. (5)
2.7 COMMUNITY RESPONSE TO NOISE
Community responses to noise may range from registering a complaint by telephone or letter, to initiating court action, depending upon everyone’s susceptibility to noise and personal attitudes about noise. Several factors are related to the level of community annoyance including:
• Fear associated with noise producing activities; • Socio-economic status and educational level; • Perception that those affected are being unfairly treated; • Attitudes regarding the usefulness of the noise-producing activity; • Belief that the noise source can be controlled.
Approximately ten percent of the population has a very low tolerance for noise and will object to any noise not of their making. Consequently, even in the quietest environment, some complaints will occur. Another twenty-five percent of the population will not complain even in very severe noise environments. Thus, a variety of reactions can be expected from people exposed to any given noise environment. (6) Surveys have shown that about ten percent of the people exposed to traffic noise of 60 dBA will report being highly annoyed with the noise, and each increase of one dBA is associated with approximately two percent more people being highly annoyed. When traffic noise exceeds 60 dBA or aircraft noise exceeds 55 dBA, people may begin to complain. (6) Despite this variability in behavior on an individual level, the population can be expected to exhibit the following responses to changes in noise levels as shown on Exhibit 2-B. An increase or decrease of 1 dBA cannot be perceived except in carefully controlled laboratory experiments, a change of 3 dBA are considered barely perceptible, and changes of 5 dBA are considered readily perceptible. (4)

Elder Creek Channel Improvements Noise Impact Analysis
11744-11 Noise Study 17
EXHIBIT 2-B: NOISE LEVEL INCREASE PERCEPTION
2.8 EXPOSURE TO HIGH NOISE LEVELS
The Occupational Safety and Health Administration (OSHA) sets legal limits on noise exposure in the workplace. The permissible exposure limit (PEL) for a worker over an eight-hour day is 90 dBA. The OSHA standard uses a 5 dBA exchange rate. This means that when the noise level is increased by 5 dBA, the amount of time a person can be exposed to a certain noise level to receive the same dose is cut in half. The National Institute for Occupational Safety and Health (NIOSH) has recommended that all worker exposures to noise should be controlled below a level equivalent to 85 dBA for eight hours to minimize occupational noise induced hearing loss. NIOSH also recommends a 3 dBA exchange rate so that every increase by 3 dBA doubles the amount of the noise and halves the recommended amount of exposure time. (7)
OSHA has implemented requirements to protect all workers in general industry (e.g. the manufacturing and the service sectors) for employers to implement a Hearing Conservation Program where workers are exposed to a time weighted average noise level of 85 dBA or higher over an eight-hour work shift. Hearing Conservation Programs require employers to measure noise levels, provide free annual hearing exams and free hearing protection, provide training, and conduct evaluations of the adequacy of the hearing protectors in use unless changes to tools, equipment and schedules are made so that they are less noisy and worker exposure to noise is less than the 85 dBA. This noise study does not evaluate the noise exposure of workers within a project or construction site based on CEQA requirements, and instead, evaluates Project-related operational and construction noise levels at the nearby sensitive receiver locations in the Project study area. Further, periodic exposure to high noise levels in short duration, such as Project construction, is typically considered an annoyance and not impactful to human health. It would take several years of exposure to high noise levels to result in hearing impairment. (8)
2.9 VIBRATION
Per the Federal Transit Administration (FTA) Transit Noise Impact and Vibration Assessment (9), vibration is the periodic oscillation of a medium or object. The rumbling sound caused by the vibration of room surfaces is called structure-borne noise. Sources of ground-borne vibrations include natural phenomena (e.g., earthquakes, volcanic eruptions, sea waves, landslides) or human-made causes (e.g., explosions, machinery, traffic, trains, construction equipment). Vibration sources may be continuous, such as factory machinery, or transient, such as explosions.
0 1 2 3 4 5 6 7 8 9 10
Just PerceptibleBarely Perceptible
Readily PerceptibleTwice as Loud
Noise Level Increase (dBA)
Elder Creek Channel Improvements Noise Impact Analysis
11744-11 Noise Study 18
As is the case with airborne sound, ground-borne vibrations may be described by amplitude and frequency.
There are several different methods that are used to quantify vibration. The peak particle velocity (PPV) is defined as the maximum instantaneous peak of the vibration signal. The PPV is most frequently used to describe vibration impacts to buildings but is not always suitable for evaluating human response (annoyance) because it takes some time for the human body to respond to vibration signals. Instead, the human body responds to average vibration amplitude often described as the root mean square (RMS). The RMS amplitude is defined as the average of the squared amplitude of the signal and is most frequently used to describe the effect of vibration on the human body. Decibel notation (VdB) is commonly used to measure RMS. Decibel notation (VdB) serves to reduce the range of numbers used to describe human response to vibration. Typically, ground-borne vibration generated by man-made activities attenuates rapidly with distance from the source of the vibration. Sensitive receivers for vibration include structures (especially older masonry structures), people (especially residents, the elderly, and sick), and vibration-sensitive equipment.
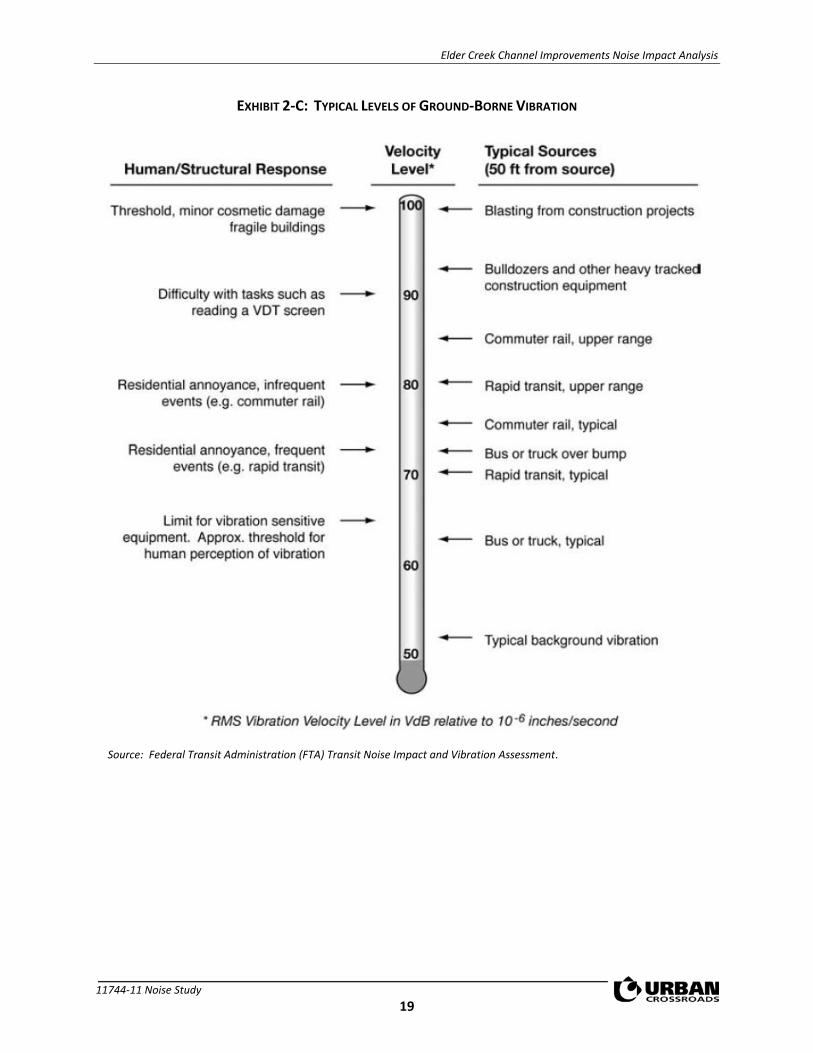
The background vibration-velocity level in residential areas is generally 50 VdB. Ground-borne vibration is normally perceptible to humans at approximately 65 VdB. For most people, a vibration-velocity level of 75 VdB is the approximate dividing line between barely perceptible and distinctly perceptible levels. Typical outdoor sources of perceptible ground-borne vibration are construction equipment, steel-wheeled trains, and traffic on rough roads. If a roadway is smooth, the ground-borne vibration is rarely perceptible. The range of interest is from approximately 50 VdB, which is the typical background vibration-velocity level, to 100 VdB, which is the general threshold where minor damage can occur in fragile buildings. Exhibit 2-C illustrates common vibration sources and the human and structural response to ground-borne vibration.
Elder Creek Channel Improvements Noise Impact Analysis
11744-11 Noise Study 19
EXHIBIT 2-C: TYPICAL LEVELS OF GROUND-BORNE VIBRATION
Source: Federal Transit Administration (FTA) Transit Noise Impact and Vibration Assessment.

Elder Creek Channel Improvements Noise Impact Analysis
11744-11 Noise Study 20
This page intentionally left blank
Elder Creek Channel Improvements Noise Impact Analysis
11744-11 Noise Study 21
3 REGULATORY SETTING
To limit population exposure to physically and/or psychologically damaging as well as intrusive noise levels, the federal government, the State of California, various county governments, and most municipalities in the state have established standards and ordinances to control noise. In most areas, automobile and truck traffic is the major source of environmental noise. Traffic activity generally produces an average sound level that remains constant with time. Air and rail traffic, and commercial and industrial activities are also major sources of noise in some areas. Federal, state, and local agencies regulate different aspects of environmental noise. Federal and state agencies generally set noise standards for mobile sources such as aircraft and motor vehicles, while regulation of stationary sources is left to local agencies.
3.1 STATE OF CALIFORNIA NOISE REQUIREMENTS
The State of California regulates freeway noise, sets standards for sound transmission, provides occupational noise control criteria, identifies noise standards, and provides guidance for local land use compatibility. State law requires that each county and city adopt a General Plan that includes a Noise Element which is to be prepared per guidelines adopted by the Governor’s Office of Planning and Research. (10) The purpose of the Noise Element is to limit the exposure of the community to excessive noise levels. In addition, the California Environmental Quality Act (CEQA) requires that all known environmental effects of a project be analyzed, including environmental noise impacts.
3.2 CITY OF HIGHLAND GENERAL PLAN NOISE ELEMENT
The City of Highland has adopted a Noise Element of the General Plan to provide goals and strategies to ensure a quiet noise environment for residents, employees, and visitors to Highland. (11) To ensure a quiet noise environment, the City of Highland General Plan Noise Element contains the following goals:
7.1 Protect sensitive land uses and the citizens of Highland from annoying and excessive noise through diligent planning and regulation.
7.2 Encourage the reduction of noise from transportation-related noise sources such as automobile and truck traffic.
7.3 Protect residents from the effects of “spill over” or nuisance noise.
The Policies and Actions specified in the City of Highland Noise Element provide the guidelines necessary to satisfy these goals. For example, Goal 7.3, Action 1 indicates that construction, as a condition of approval, shall be limited to daytime hours between 7:00 a.m. to 6:00 p.m. on weekdays. (11)
Elder Creek Channel Improvements Noise Impact Analysis
11744-11 Noise Study 22
3.3 CONSTRUCTION NOISE STANDARDS
To control noise impacts associated with the construction of the proposed Project, the City of Highland has established limits to the hours of operation. The City of Highland General Plan Noise Element, Goal 7.3, Action 1 indicates that construction, as a condition of approval, shall be limited to daytime hours between 7:00 a.m. to 6:00 p.m. on weekdays. (11) Further, Section 8.50.060(K) of the City of Highland Municipal Code indicates that construction activities for public works projects, such as the Elder Creek Channel Improvements are considered exempt from the noise standards of the Municipal Code. However, the City’s General Plan and Municipal Code do not establish numeric maximum acceptable construction source noise levels at potentially affected receivers, which would allow for a quantified determination of what CEQA constitutes as the generation of noise levels in excess of standards or as a substantial temporary or periodic noise increase, the following construction noise level thresholds are used in this noise study.
To evaluate whether the Project will generate potentially significant construction noise levels at off-site sensitive receiver locations, a construction-related noise level threshold is adopted from the Criteria for Recommended Standard: Occupational Noise Exposure prepared by the National Institute for Occupational Safety and Health (NIOSH). (12) A division of the U.S. Department of Health and Human Services, NIOSH identifies a noise level threshold based on the duration of exposure to the source. The construction related noise level threshold starts at 85 dBA for more than eight hours per day, and for every 3 dBA increase, the exposure time is cut in half. This results in noise level thresholds of 88 dBA for more than four hours per day, 92 dBA for more than one hour per day, 96 dBA for more than 30 minutes per day, and up to 100 dBA for more than 15 minutes per day. (12) For the purposes of this analysis, the lowest, more conservative construction noise level threshold of 85 dBA Leq is used as an acceptable threshold for construction noise at the nearby sensitive receiver locations. Since this construction-related noise level threshold represents the energy average of the noise source over a given time, they are expressed as Leq noise levels. Therefore, the noise level threshold of 85 dBA Leq over a period of eight hours or more is used to evaluate the potential Project-related construction noise level impacts at the nearby sensitive receiver locations.
The 85 dBA Leq threshold is also consistent with the FTA Transit Noise and Vibration Impact Assessment criteria for construction noise which identifies an hourly construction noise level threshold of 90 dBA Leq during daytime hours, and 80 dBA Leq during nighttime hours for construction for general assessment at noise-sensitive uses (e.g., residential, medical/hospital, school, etc.). (9) Therefore, the Noise Study relies on the NIOSH 85 dBA Leq threshold, which is more conservative than the 90 dBA Leq FTA general assessment criteria, for noise-sensitive uses and represents an appropriate threshold for construction noise analysis.

Elder Creek Channel Improvements Noise Impact Analysis
11744-11 Noise Study 23
3.4 CONSTRUCTION VIBRATION STANDARDS
The City of Highland General Plan and Municipal Code do not identify specific vibration level standards. Therefore, applicable vibration standards identified by the California Department of Transportation (“Caltrans”) Transportation and Construction Vibration Guidance Manual are used in this noise study to assess potential building damage impacts. (13) According to the Caltrans vibration manual, large mobile equipment, and large loaded trucks (e.g., haul trucks) used during construction activities can produce vibration which can potentially cause annoyance at sensitive land uses within the Project study area, or damage to adjacent structures. The Caltrans vibration manual establishes thresholds for determining potential vibration impacts resulting in building damage for older residential structures of 0.3 in/sec PPV.
In addition, the County of San Bernardino Development Code, Section 83.01.090 identifies vibration standards of 0.2 in/sec PPV which are used in this noise study to evaluate potential impacts related to human annoyance at nearby sensitive receiver locations. (14)

Elder Creek Channel Improvements Noise Impact Analysis
11744-11 Noise Study 24
This page intentionally left blank

Elder Creek Channel Improvements Noise Impact Analysis
11744-11 Noise Study 25
4 SIGNIFICANCE CRITERIA
The following significance criteria are based on currently adopted guidance provided by Appendix G of the California Environmental Quality Act (CEQA) Guidelines. (1) For the purposes of this report, impacts would be potentially significant if the Project results in or causes:
A. Generation of a substantial temporary or permanent increase in ambient noise levels in the vicinity of the project in excess of standards established in the local general plan or noise ordinance, or applicable standards of other agencies?
B. Generation of excessive ground-borne vibration or ground-borne noise levels?
C. For a project located within the vicinity of a private airstrip or an airport land use plan or, where such a plan has not been adopted, within two miles of a public airport or public use airport, would the project expose people residing or working in the project area to excessive noise levels?
While the City of Highland General Plan Guidelines provide direction on noise compatibility and establish noise standards by land use type that are sufficient to assess the significance of noise impacts, they do not define the levels at which increases are considered substantial for use under Guideline A. CEQA Appendix G Guideline C applies to nearby public and private airports, if any, and the Project’s land use compatibility. The Project site is not located within two miles of a public airport; nor is the Project within the vicinity of a private airstrip. As such, the Project site would not be exposed to excessive noise levels from airport operations, and therefore, impacts are considered less than significant, and no further noise analysis is conducted in relation to Guidelines E and F.
Noise impacts shall be considered significant if any of the following occur as a direct result of the proposed development. Table 4-1 shows the significance criteria summary matrix.
CONSTRUCTION NOISE
• If temporary Project-related construction activities create noise levels which exceed the 85 dBA Leq acceptable noise level threshold at the nearby noise-sensitive receiver locations (NIOSH, Criteria for Recommended Standard: Occupational Noise Exposure).
CONSTRUCTION VIBRATION
• If temporary Project-related construction activities generate vibration levels which:
o exceed the Caltrans building damage vibration level threshold for older residential structures of 0.3 in/sec PPV (Caltrans Transportation and Construction Vibration Guidance Manual, Tables 19 & 20); or
o the human annoyance vibration level threshold of 0.2 in/sec PPV at nearby sensitive receiver locations (County of San Bernardino Development Code, Section 83.01.090).

Elder Creek Channel Improvements Noise Impact Analysis
11744-11 Noise Study 26
TABLE 4-1: SIGNIFICANCE CRITERIA SUMMARY
Analysis Receiving Land Use Condition(s)
Significance Criteria
Daytime Nighttime
Construction Noise- Sensitive
Noise Level Threshold1 85 dBA Leq n/a
Vibration Level Threshold (Building Damage)2 0.3 in/sec PPV n/a
Vibration Level Threshold (Human Annoyance)3 0.2 in/sec PPV n/a
1 Source: NIOSH, Criteria for Recommended Standard: Occupational Noise Exposure, June 1998. 2 Source: Caltrans Transportation and Construction Vibration Guidance Manual, September 2013, Tables 19 & 20. 3 Source: County of San Bernardino Development Code, Section 83.01.090 . "Daytime" = 7:00 a.m. to 10:00 p.m.; "Nighttime" = 10:00 p.m. to 7:00 a.m.; "PPV" = peak particle velocity; "n/a" = No nighttime construction activity is permitted or planned, so no nighttime construction noise level limits are identified.

Elder Creek Channel Improvements Noise Impact Analysis
11744-11 Noise Study 27
5 EXISTING NOISE LEVEL MEASUREMENTS
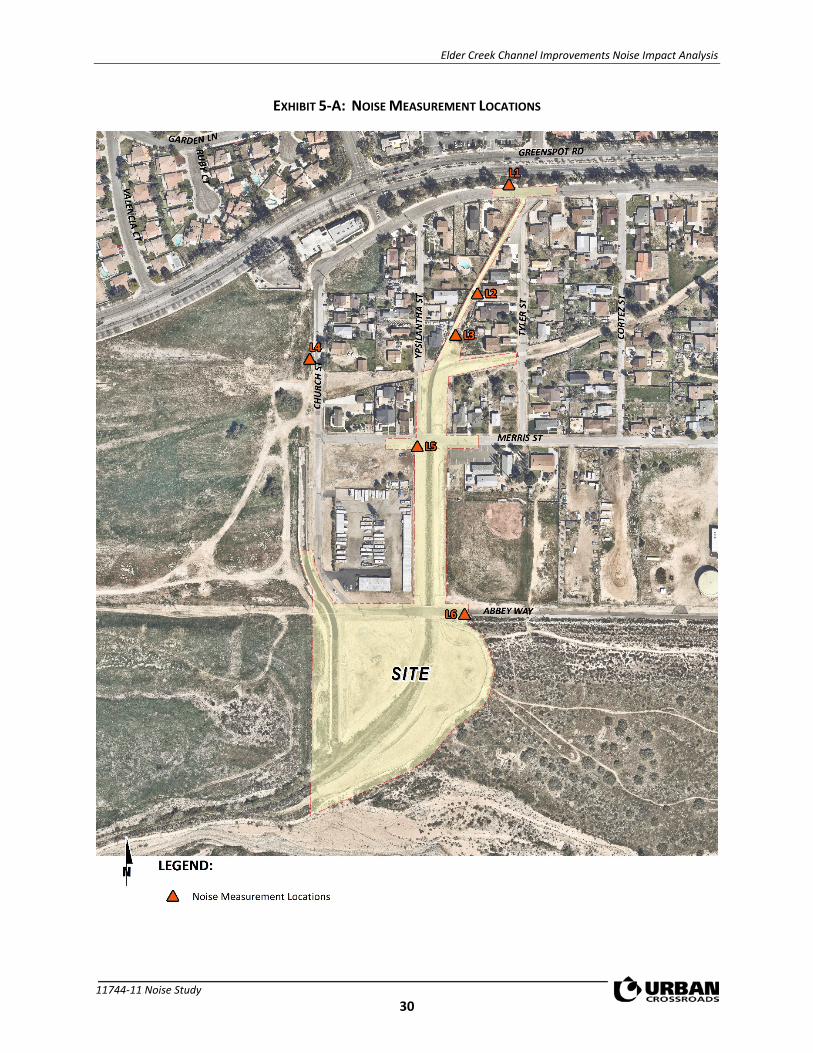
To assess the existing noise level environment, five 24-hour noise level measurements were taken at receiver locations in the Project study area. The receiver locations were selected to describe and document the existing noise environment within the Project study area. Exhibit 5-A provides the boundaries of the Project study area and the noise level measurement locations. To fully describe the existing noise conditions, noise level measurements were collected by Urban Crossroads, Inc. on Friday, June 22nd, 2018. Appendix 5.1 includes study area photos.
5.1 MEASUREMENT PROCEDURE AND CRITERIA
To describe the existing noise environment, the hourly noise levels were measured during typical weekday conditions over a 24-hour period. By collecting individual hourly noise level measurements, it is possible to describe the daytime and nighttime hourly noise levels and calculate the 24-hour CNEL. The long-term noise readings were recorded using Piccolo Type 2 integrating sound level meter and dataloggers. The Piccolo sound level meters were calibrated using a Larson-Davis calibrator, Model CAL 150. All noise meters were programmed in "slow" mode to record noise levels in "A" weighted form. The sound level meters and microphones were equipped with a windscreen during all measurements. All noise level measurement equipment satisfies the American National Standards Institute (ANSI) standard specifications for sound level meters ANSI S1.4-2014/IEC 61672-1:2013. (15)
5.2 NOISE MEASUREMENT LOCATIONS
The long-term noise level measurements were positioned as close to the nearest sensitive receiver locations as possible to assess the existing ambient hourly noise levels surrounding the Project site. Both Caltrans and the FTA recognize that it is not reasonable to collect noise level measurements that can fully represent any part of a private yard, patio, deck, or balcony normally used for human activity when estimating impacts for new development projects. This is demonstrated in the Caltrans general site location guidelines which indicate that, sites must be free of noise contamination by sources other than sources of interest. Avoid sites located near sources such as barking dogs, lawnmowers, pool pumps, and air conditioners unless it is the express intent of the analyst to measure these sources. (2) Further, FTA guidance states, that it is not necessary nor recommended that existing noise exposure be determined by measuring at every noise-sensitive location in the project area. Rather, the recommended approach is to characterize the noise environment for clusters of sites based on measurements or estimates at representative locations in the community. (9)
Based on recommendations of Caltrans and the FTA, it is not necessary to collect measurements at each individual building or residence, because each receiver measurement represents a group of buildings that share acoustical equivalence. (9) In other words, the area represented by the receiver shares similar shielding, terrain, and geometric relationship to the reference noise source. Receivers represent a location of noise sensitive areas and are used to estimate the future noise level impacts. Collecting reference ambient noise level measurements at the nearby sensitive receiver locations allows for a comparison of the before and after Project noise levels

Elder Creek Channel Improvements Noise Impact Analysis
11744-11 Noise Study 28
and is necessary to assess potential noise impacts due to the Project’s contribution to the ambient noise levels.
5.3 NOISE MEASUREMENT RESULTS
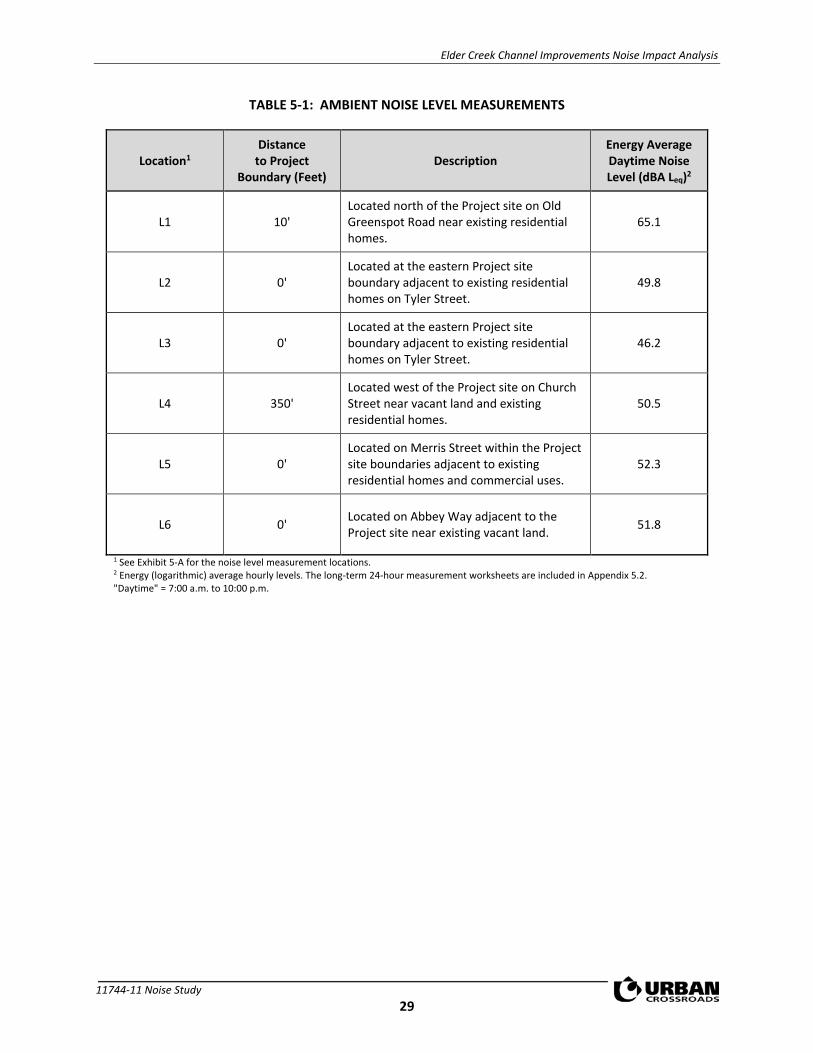
The noise measurements presented below focus on the average or equivalent sound levels (Leq). The equivalent sound level (Leq) represents a steady state sound level containing the same total energy as a time varying signal over a given sample period. Further, only the daytime noise levels are presented below based on the daytime-only Project construction activity analyzed in this noise study, however, the full 24-hour noise level measurement data is provided in Appendix 5.2. Table 5-1 identifies the hourly daytime (7:00 a.m. to 10:00 p.m.) noise levels at each noise level measurement location. Appendix 5.2 provides a summary of the existing hourly ambient noise levels described below:
• Location L1 represents the noise levels north of the Project site on Old Greenspot Road near existing residential homes. The energy (logarithmic) average daytime noise level was calculated at 65.1 dBA Leq.
• Location L2 represents the noise levels at the eastern Project site boundary adjacent to existing residential homes on Tyler Street. The energy (logarithmic) average daytime noise level was calculated at 49.8 dBA Leq.
• Location L3 represents the noise levels at the eastern Project site boundary adjacent to existing residential homes on Tyler Street. The energy (logarithmic) average daytime noise level was calculated at 46.2 dBA Leq.
• Location L4 represents the noise levels west of the Project site on Church Street near vacant land and existing residential homes. The energy (logarithmic) average daytime noise level was calculated at 50.5 dBA Leq.
• Location L5 represents the noise levels on Merris Street within the Project site boundaries adjacent to existing residential homes and commercial uses. The energy (logarithmic) average daytime noise level was calculated at 52.3 dBA Leq.
• Location L6 represents the noise levels on Abbey Way adjacent to the Project site near existing vacant land. The energy (logarithmic) average daytime noise level was calculated at 51.8 dBA Leq.
Table 5-1 provides the (energy average) noise levels used to describe the daytime ambient conditions. These daytime energy average noise levels represent the average of all hourly noise levels observed during this time period expressed as a single number. Appendix 5.2 provides summary worksheets of the noise levels for each hour as well as the minimum, maximum, L1, L2, L5, L8, L25, L50, L90, L95, and L99 percentile noise levels observed during the daytime and nighttime periods.
Elder Creek Channel Improvements Noise Impact Analysis
11744-11 Noise Study 29
TABLE 5-1: AMBIENT NOISE LEVEL MEASUREMENTS
Location1 Distance
to Project Boundary (Feet)
Description Energy Average Daytime Noise Level (dBA Leq)2
L1 10' Located north of the Project site on Old Greenspot Road near existing residential homes.
65.1
L2 0' Located at the eastern Project site boundary adjacent to existing residential homes on Tyler Street.
49.8
L3 0' Located at the eastern Project site boundary adjacent to existing residential homes on Tyler Street.
46.2
L4 350' Located west of the Project site on Church Street near vacant land and existing residential homes.
50.5
L5 0' Located on Merris Street within the Project site boundaries adjacent to existing residential homes and commercial uses.
52.3
L6 0' Located on Abbey Way adjacent to the Project site near existing vacant land. 51.8
1 See Exhibit 5-A for the noise level measurement locations. 2 Energy (logarithmic) average hourly levels. The long-term 24-hour measurement worksheets are included in Appendix 5.2. "Daytime" = 7:00 a.m. to 10:00 p.m.
Elder Creek Channel Improvements Noise Impact Analysis
11744-11 Noise Study 30
EXHIBIT 5-A: NOISE MEASUREMENT LOCATIONS

Elder Creek Channel Improvements Noise Impact Analysis
11744-11 Noise Study 31
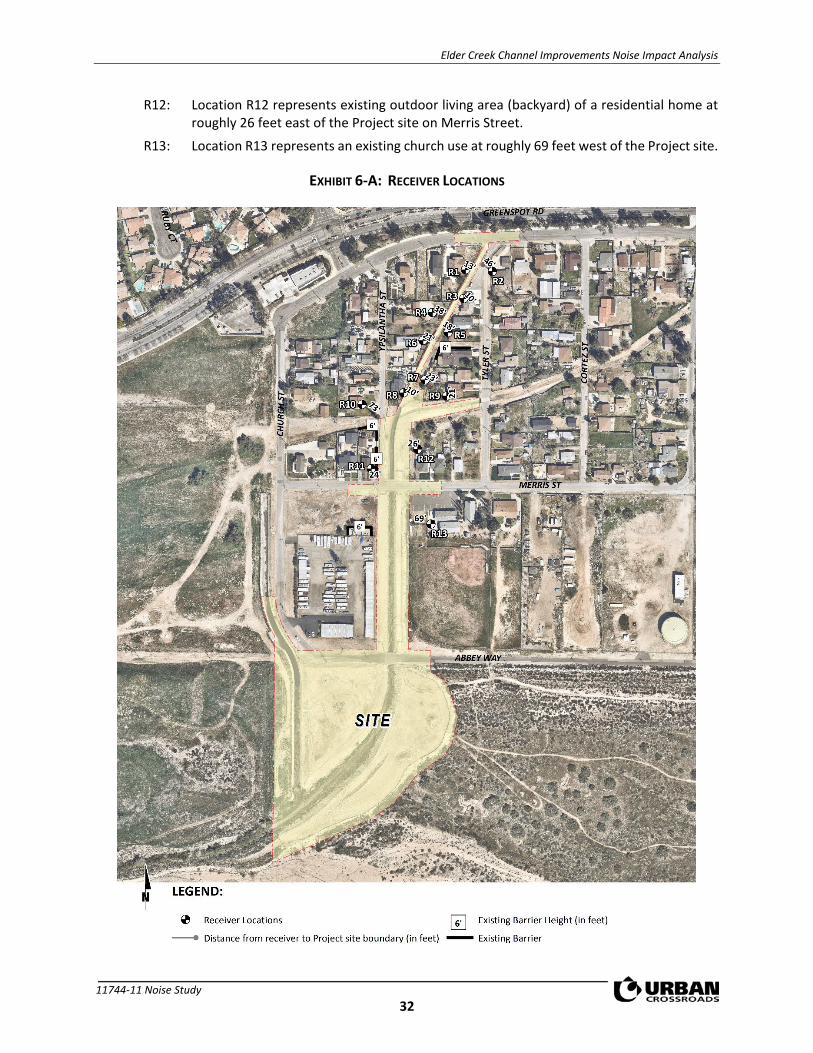
6 RECEIVER LOCATIONS
To assess the potential for short-term construction noise impacts, the following receiver locations as shown on Exhibit 6-A were identified as representative locations for focused analysis. Sensitive receivers are generally defined as locations where people reside or where the presence of unwanted sound could otherwise adversely affect the use of the land. Noise-sensitive land uses are generally considered to include: schools, hospitals, single-family dwellings, mobile home parks, churches, libraries, and recreation areas. Moderately noise-sensitive land uses typically include: multi-family dwellings, hotels, motels, dormitories, out-patient clinics, cemeteries, golf courses, country clubs, athletic/tennis clubs, and equestrian clubs. Land uses that are considered relatively insensitive to noise include business, commercial, and professional developments. Land uses that are typically not affected by noise include: industrial, manufacturing, utilities, agriculture, natural open space, undeveloped land, parking lots, warehousing, liquid and solid waste facilities, salvage yards, and transit terminals.
Noise-sensitive receivers near the Project site include existing residential homes, as described below. Other sensitive land uses in the Project study area that are located at greater distances than those identified in this noise study will experience lower noise levels than those presented in this report due to the additional attenuation from distance and the shielding of intervening structures.
R1: Located approximately 13 feet west of the Project site, R1 represents an existing residential home south of Old Greenspot Road.
R2: Location R2 represents the existing residential home located approximately 46 feet southeast of the Project site on Tyler Street.
R3: Location R3 represents an existing residential home east of the Project site on Tyler Street at roughly 10 feet.
R4: Location R4 represents the outdoor living area (backyard) and pool of an existing residential property on Ypsilantha Street located roughly 38 feet west of the Project site.
R5: Location R5 represents the existing residential home located roughly 18 feet east of the Project site on Tyler Street.
R6: Location R6 represents existing outdoor area living area (backyard) of a residential property on Ypsilantha Street at roughly 21 feet west of the Project site.
R7: Located approximately 23 feet east of the Project site, R7 represents an existing outdoor living area (backyard) of a residential home on Tyler Street.
R8: Location R8 represents an existing residential home on Ypsilantha Street which is located approximately 10 feet west of the Project site.
R9: Location R9 represents an existing residential home north of the Project site on Tyler Street at an approximate distance of 21 feet.
R10: Location R10 represents the residential homes located roughly 73 feet northwest of the Project site on Ypsilantha Street.
R11: Location R11 represents the existing residential home located roughly 24 feet west of the Project site on Merris Street.
Elder Creek Channel Improvements Noise Impact Analysis
11744-11 Noise Study 32
R12: Location R12 represents existing outdoor living area (backyard) of a residential home at roughly 26 feet east of the Project site on Merris Street.
R13: Location R13 represents an existing church use at roughly 69 feet west of the Project site.
EXHIBIT 6-A: RECEIVER LOCATIONS
Elder Creek Channel Improvements Noise Impact Analysis
11744-11 Noise Study 33
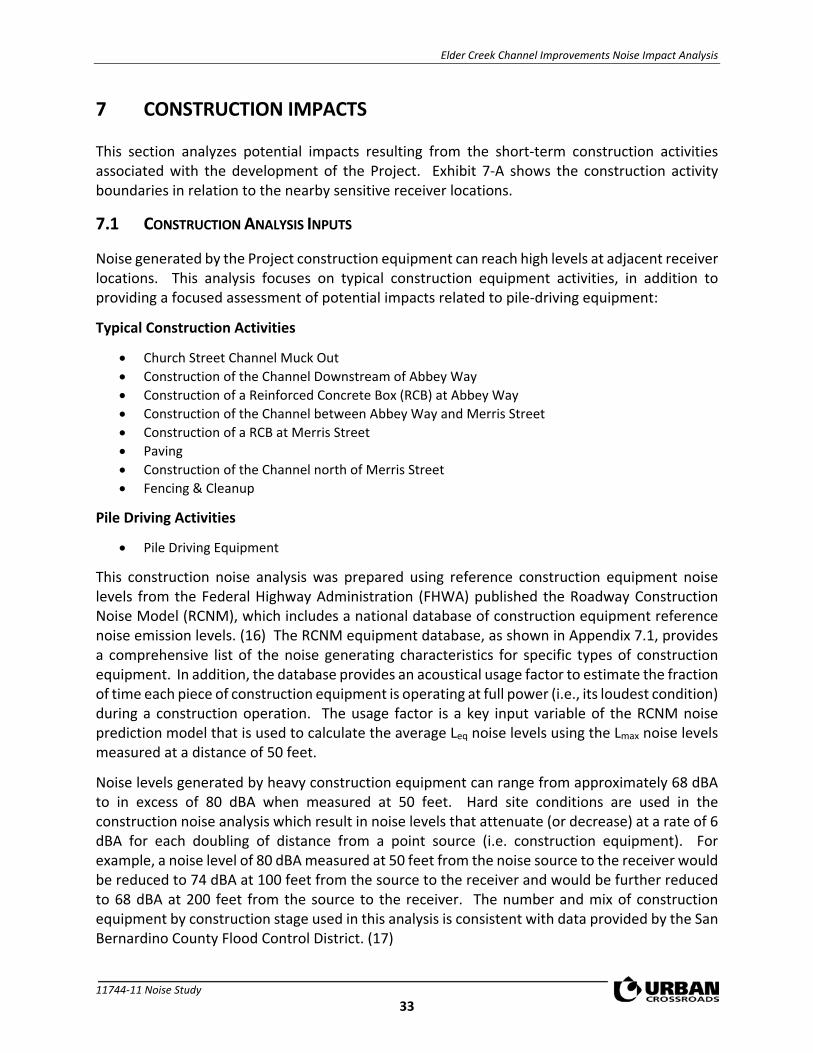
7 CONSTRUCTION IMPACTS
This section analyzes potential impacts resulting from the short-term construction activities associated with the development of the Project. Exhibit 7-A shows the construction activity boundaries in relation to the nearby sensitive receiver locations.
7.1 CONSTRUCTION ANALYSIS INPUTS
Noise generated by the Project construction equipment can reach high levels at adjacent receiver locations. This analysis focuses on typical construction equipment activities, in addition to providing a focused assessment of potential impacts related to pile-driving equipment:
Typical Construction Activities
• Church Street Channel Muck Out • Construction of the Channel Downstream of Abbey Way • Construction of a Reinforced Concrete Box (RCB) at Abbey Way • Construction of the Channel between Abbey Way and Merris Street • Construction of a RCB at Merris Street • Paving • Construction of the Channel north of Merris Street • Fencing & Cleanup
Pile Driving Activities
• Pile Driving Equipment
This construction noise analysis was prepared using reference construction equipment noise levels from the Federal Highway Administration (FHWA) published the Roadway Construction Noise Model (RCNM), which includes a national database of construction equipment reference noise emission levels. (16) The RCNM equipment database, as shown in Appendix 7.1, provides a comprehensive list of the noise generating characteristics for specific types of construction equipment. In addition, the database provides an acoustical usage factor to estimate the fraction of time each piece of construction equipment is operating at full power (i.e., its loudest condition) during a construction operation. The usage factor is a key input variable of the RCNM noise prediction model that is used to calculate the average Leq noise levels using the Lmax noise levels measured at a distance of 50 feet.
Noise levels generated by heavy construction equipment can range from approximately 68 dBA to in excess of 80 dBA when measured at 50 feet. Hard site conditions are used in the construction noise analysis which result in noise levels that attenuate (or decrease) at a rate of 6 dBA for each doubling of distance from a point source (i.e. construction equipment). For example, a noise level of 80 dBA measured at 50 feet from the noise source to the receiver would be reduced to 74 dBA at 100 feet from the source to the receiver and would be further reduced to 68 dBA at 200 feet from the source to the receiver. The number and mix of construction equipment by construction stage used in this analysis is consistent with data provided by the San Bernardino County Flood Control District. (17)
Elder Creek Channel Improvements Noise Impact Analysis
11744-11 Noise Study 34
EXHIBIT 7-A: CONSTRUCTION ACTIVITY AND RECEIVER LOCATIONS
Elder Creek Channel Improvements Noise Impact Analysis
11744-11 Noise Study 35
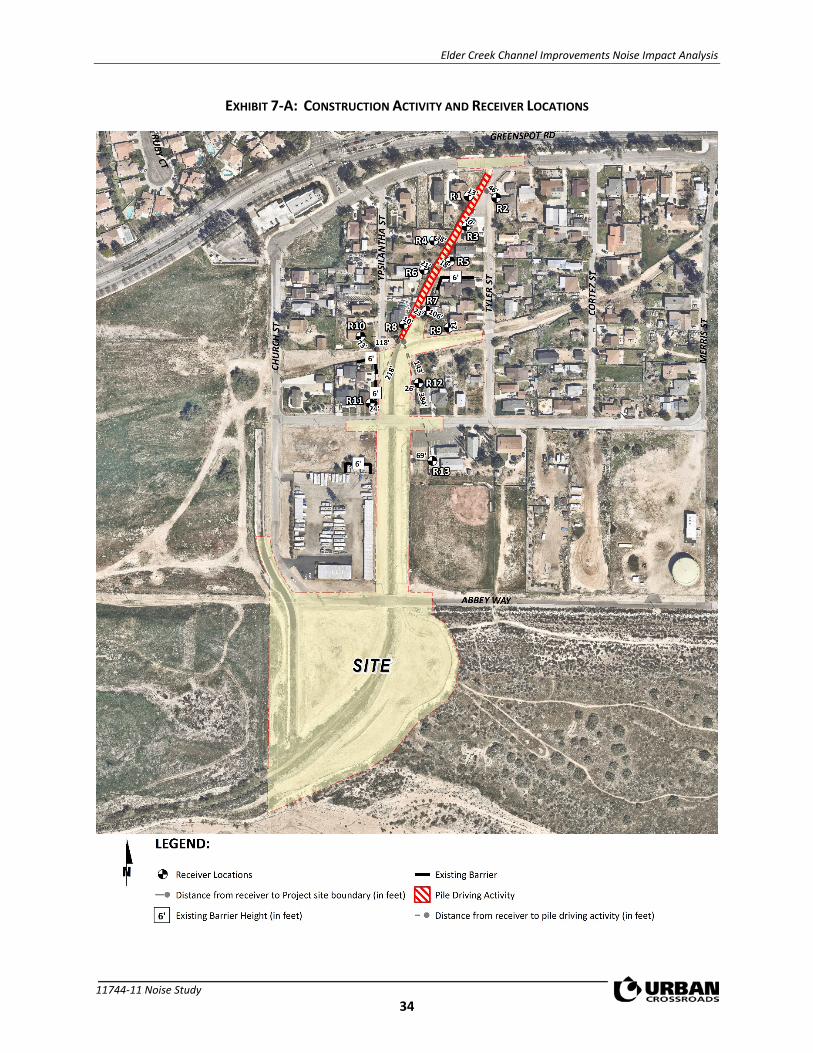
7.2 TYPICAL CONSTRUCTION ACTIVITY NOISE LEVELS
Tables 7-1 to 7-6 show the typical Project construction stages and the reference construction noise levels used for each stage at 50 feet. Table 7-7 provides a summary of the noise levels from each stage of construction at each of the sensitive receiver locations based on the distance to the Project site boundary. Based on the reference construction noise levels, the Project-related typical construction activity noise levels when the highest reference noise level is operating at the edge of primary construction activity nearest each sensitive receiver location will range from 71 to 92 dBA Leq at the sensitive receiver locations, as shown on Table 7-7.
TABLE 7-1: CHURCH STREET MUCK OUT & ABBEY CHANNEL EQUIPMENT NOISE LEVELS
Equipment Type1 Quantity Usage Factor2
Hours of Operation3
Reference Noise Level @ 50 Feet
(dBA Lmax)
Combined Level @ 50 Feet (dBA Leq)
Church Street Channel Muck Out Tractor/Loader/Backhoes 1 40% 3.2 78.0 74.0 Dump Truck 2 40% 3.2 76.0 75.0 Water Trucks 1 40% 3.2 76.0 72.0 Grade Downstream Abbey Tractor/Loader/Backhoes 1 40% 3.2 78.0 74.0 Excavators 1 40% 3.2 81.0 77.0 Dump Truck 1 40% 3.2 76.0 72.0 Water Trucks 1 40% 3.2 76.0 72.0 Steel for Channel Invert Tractor/Loader/Backhoes 1 40% 3.2 78.0 74.0 Concrete for Invert Concrete Mixer Truck 2 40% 3.2 79.0 78.0 Concrete Pump Trucks 1 20% 1.6 81.0 74.0 Generator Sets 1 50% 4.0 81.0 78.0 Steel for Walls Tractor/Loader/Backhoes 1 40% 3.2 78.0 74.0 Concrete for Walls Concrete Mixer Truck 2 40% 3.2 79.0 78.0 Concrete Pump Trucks 1 20% 1.6 81.0 74.0 Generator Sets 1 50% 4.0 81.0 78.0 1 Source: FHWA's Roadway Construction Noise Model, January 2006. 2 Estimates the fraction of time each piece of equipment is operating at full power during a construction operation. 3 Represents the actual hours of peak construction equipment activity out of a typical 8 hour workday.
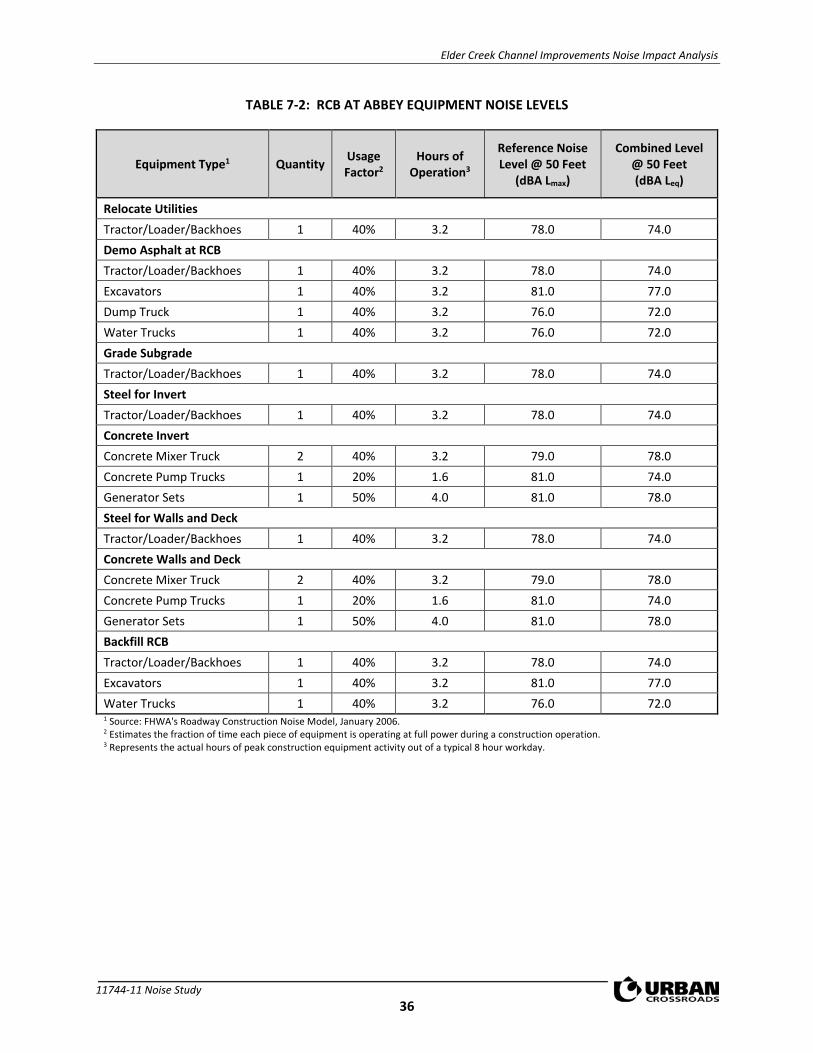
Elder Creek Channel Improvements Noise Impact Analysis
11744-11 Noise Study 36
TABLE 7-2: RCB AT ABBEY EQUIPMENT NOISE LEVELS
Equipment Type1 Quantity Usage Factor2
Hours of Operation3
Reference Noise Level @ 50 Feet
(dBA Lmax)
Combined Level @ 50 Feet (dBA Leq)
Relocate Utilities Tractor/Loader/Backhoes 1 40% 3.2 78.0 74.0 Demo Asphalt at RCB Tractor/Loader/Backhoes 1 40% 3.2 78.0 74.0 Excavators 1 40% 3.2 81.0 77.0 Dump Truck 1 40% 3.2 76.0 72.0 Water Trucks 1 40% 3.2 76.0 72.0 Grade Subgrade Tractor/Loader/Backhoes 1 40% 3.2 78.0 74.0 Steel for Invert Tractor/Loader/Backhoes 1 40% 3.2 78.0 74.0 Concrete Invert Concrete Mixer Truck 2 40% 3.2 79.0 78.0 Concrete Pump Trucks 1 20% 1.6 81.0 74.0 Generator Sets 1 50% 4.0 81.0 78.0 Steel for Walls and Deck Tractor/Loader/Backhoes 1 40% 3.2 78.0 74.0 Concrete Walls and Deck Concrete Mixer Truck 2 40% 3.2 79.0 78.0 Concrete Pump Trucks 1 20% 1.6 81.0 74.0 Generator Sets 1 50% 4.0 81.0 78.0 Backfill RCB Tractor/Loader/Backhoes 1 40% 3.2 78.0 74.0 Excavators 1 40% 3.2 81.0 77.0 Water Trucks 1 40% 3.2 76.0 72.0 1 Source: FHWA's Roadway Construction Noise Model, January 2006. 2 Estimates the fraction of time each piece of equipment is operating at full power during a construction operation. 3 Represents the actual hours of peak construction equipment activity out of a typical 8 hour workday.
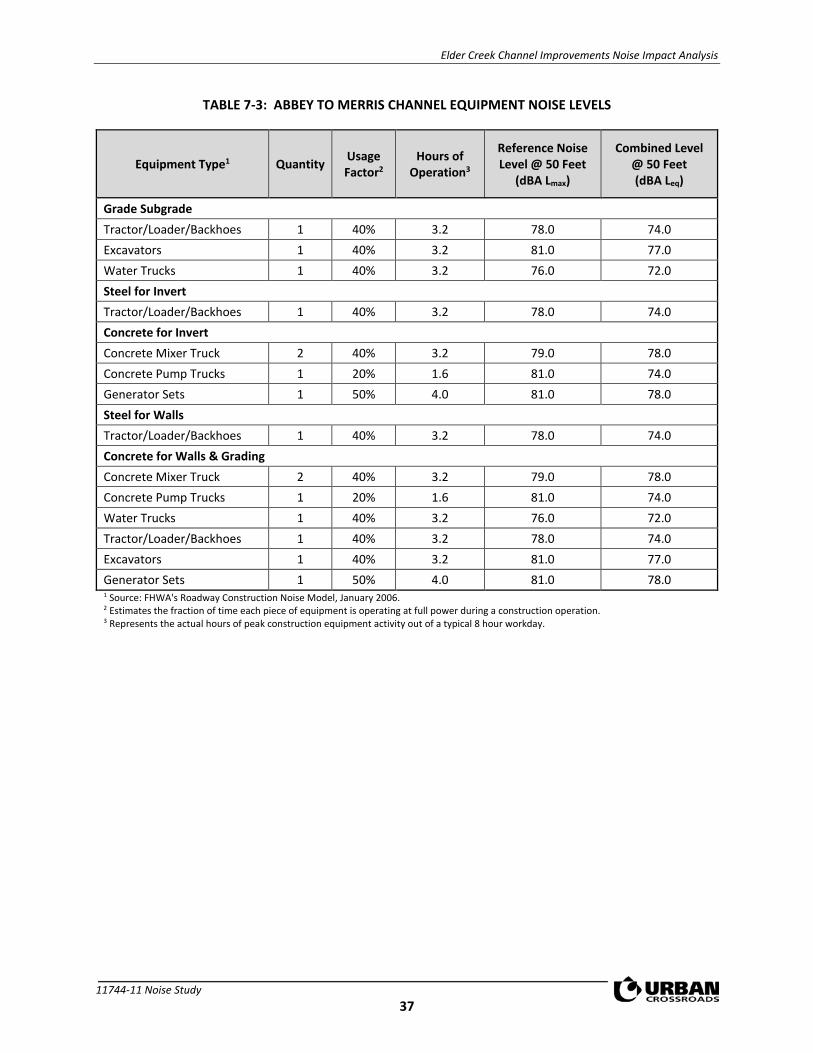
Elder Creek Channel Improvements Noise Impact Analysis
11744-11 Noise Study 37
TABLE 7-3: ABBEY TO MERRIS CHANNEL EQUIPMENT NOISE LEVELS
Equipment Type1 Quantity Usage Factor2
Hours of Operation3
Reference Noise Level @ 50 Feet
(dBA Lmax)
Combined Level @ 50 Feet (dBA Leq)
Grade Subgrade Tractor/Loader/Backhoes 1 40% 3.2 78.0 74.0 Excavators 1 40% 3.2 81.0 77.0 Water Trucks 1 40% 3.2 76.0 72.0 Steel for Invert Tractor/Loader/Backhoes 1 40% 3.2 78.0 74.0 Concrete for Invert Concrete Mixer Truck 2 40% 3.2 79.0 78.0 Concrete Pump Trucks 1 20% 1.6 81.0 74.0 Generator Sets 1 50% 4.0 81.0 78.0 Steel for Walls Tractor/Loader/Backhoes 1 40% 3.2 78.0 74.0 Concrete for Walls & Grading Concrete Mixer Truck 2 40% 3.2 79.0 78.0 Concrete Pump Trucks 1 20% 1.6 81.0 74.0 Water Trucks 1 40% 3.2 76.0 72.0 Tractor/Loader/Backhoes 1 40% 3.2 78.0 74.0 Excavators 1 40% 3.2 81.0 77.0 Generator Sets 1 50% 4.0 81.0 78.0 1 Source: FHWA's Roadway Construction Noise Model, January 2006. 2 Estimates the fraction of time each piece of equipment is operating at full power during a construction operation. 3 Represents the actual hours of peak construction equipment activity out of a typical 8 hour workday.

Elder Creek Channel Improvements Noise Impact Analysis
11744-11 Noise Study 38
TABLE 7-4: RCB AT MERRIS EQUIPMENT NOISE LEVELS
Equipment Type1 Quantity Usage Factor2
Hours of Operation3
Reference Noise Level @ 50 Feet
(dBA Lmax)
Combined Level @ 50 Feet (dBA Leq)
Relocate Utilities Tractor/Loader/Backhoes 1 40% 3.2 78.0 74.0 Demo Asphalt at RCB Tractor/Loader/Backhoes 2 40% 3.2 78.0 77.0 Dump Truck 1 40% 3.2 76.0 72.0 Excavators 1 40% 3.2 81.0 77.0 Water Trucks 1 40% 3.2 76.0 72.0 Grade Subgrade Tractor/Loader/Backhoes 1 40% 3.2 78.0 74.0 Steel for Invert Tractor/Loader/Backhoes 1 40% 3.2 78.0 74.0 Concrete for Invert Concrete Mixer Truck 2 40% 3.2 79.0 78.0 Concrete Pump Trucks 1 20% 1.6 81.0 74.0 Generator Sets 1 50% 4.0 81.0 78.0 Steel for Walls and Deck Tractor/Loader/Backhoes 1 40% 3.2 78.0 74.0 Concrete for Walls and Deck Concrete Mixer Truck 2 40% 3.2 79.0 78.0 Concrete Pump Trucks 1 20% 1.6 81.0 74.0 Generator Sets 1 50% 4.0 81.0 78.0 Backfill RCB Tractor/Loader/Backhoes 1 40% 3.2 78.0 74.0 Excavators 1 40% 3.2 81.0 77.0 Water Trucks 1 40% 3.2 76.0 72.0 1 Source: FHWA's Roadway Construction Noise Model, January 2006. 2 Estimates the fraction of time each piece of equipment is operating at full power during a construction operation. 3 Represents the actual hours of peak construction equipment activity out of a typical 8 hour workday.

Elder Creek Channel Improvements Noise Impact Analysis
11744-11 Noise Study 39
TABLE 7-5: PAVING & CHANNEL NORTH OF MERRIS EQUIPMENT NOISE LEVELS
Equipment Type1 Quantity Usage Factor2
Hours of Operation3
Reference Noise Level @ 50 Feet
(dBA Lmax)
Combined Level @ 50 Feet (dBA Leq)
Paving Pickup Trucks 2 40% 3.2 75.0 74.0 Water Trucks 1 40% 3.2 76.0 72.0 Pavers 1 50% 4.0 77.0 74.0 Rollers 3 20% 1.6 80.0 77.8 Tractor/Loader/Backhoes 1 40% 3.2 78.0 74.0 Demo Channel and RCB Tractor/Loader/Backhoes 2 40% 3.2 78.0 77.0 Excavators 1 40% 3.2 81.0 77.0 Dump Truck 1 40% 3.2 76.0 72.0 Water Trucks 1 40% 3.2 76.0 72.0 Grade Subgrade Tractor/Loader/Backhoes 1 40% 3.2 78.0 74.0 Steel for Invert Tractor/Loader/Backhoes 1 40% 3.2 78.0 74.0 Concrete for Invert Concrete Mixer Truck 2 40% 3.2 79.0 78.0 Concrete Pump Trucks 1 20% 1.6 81.0 74.0 Generator Sets 1 50% 4.0 81.0 78.0 Steel for Walls Tractor/Loader/Backhoes 1 40% 3.2 78.0 74.0 Concrete for Walls Concrete Mixer Truck 2 40% 3.2 79.0 78.0 Concrete Pump Trucks 1 20% 1.6 81.0 74.0 Generator Sets 1 50% 4.0 81.0 78.0 1 Source: FHWA's Roadway Construction Noise Model, January 2006. 2 Estimates the fraction of time each piece of equipment is operating at full power during a construction operation. 3 Represents the actual hours of peak construction equipment activity out of a typical 8 hour workday.

Elder Creek Channel Improvements Noise Impact Analysis
11744-11 Noise Study 40
TABLE 7-6: FENCING & CLEANUP EQUIPMENT NOISE LEVELS
Equipment Type1 Quantity Usage Factor2
Hours of Operation3
Reference Noise Level @ 50 Feet
(dBA Lmax)
Combined Level @ 50 Feet (dBA Leq)
Fencing Tractor/Loader/Backhoes 1 40% 3.2 78.0 74.0 Generator Sets 1 50% 4.0 81.0 78.0 Remove Stockpile Excavators 1 40% 3.2 81.0 77.0 Tractor/Loader/Backhoes 1 40% 3.2 78.0 74.0 Dump Truck 1 40% 3.2 76.0 72.0 Grade Earthen Channel Tractor/Loader/Backhoes 1 40% 3.2 78.0 74.0 Excavators 1 40% 3.2 81.0 77.0 Water Trucks 1 40% 3.2 76.0 72.0 Rock Slope Protection Excavators 1 40% 3.2 81.0 77.0 Dump Truck 1 40% 3.2 76.0 72.0 Final Grading/Cleanup Tractor/Loader/Backhoes 2 40% 3.2 78.0 77.0 Dump Truck 1 40% 3.2 76.0 72.0 1 Source: FHWA's Roadway Construction Noise Model, January 2006. 2 Estimates the fraction of time each piece of equipment is operating at full power during a construction operation. 3 Represents the actual hours of peak construction equipment activity out of a typical 8 hour workday.

Elder Creek Channel Improvements Noise Impact Analysis
11744-11 Noise Study 41
TABLE 7-7: UNMITIGATED EQUIPMENT NOISE LEVEL SUMMARY (DBA LEQ)
R1 R2 R3 R4 R5 R6 R7 R8 R9 R10 R11 R12 R13
13' 46' 10' 38' 18' 21' 23' 10' 21' 73' 24' 26' 69'
Church Street Channel Muck Out 75 87 76 89 77 84 83 82 89 83 72 81 81 72
Grade Downstream Abbey 77 89 78 91 79 86 85 84 91 85 74 83 83 74Steel for Channel Invert 74 86 75 88 76 83 82 81 88 82 71 80 80 71
Concrete for Invert 78 90 79 92 80 87 86 85 92 86 75 84 84 75Steel for Walls 74 86 75 88 76 83 82 81 88 82 71 80 80 71
Concrete for Walls 78 90 79 92 80 87 86 85 92 86 75 84 84 75
Relocate Util ities 74 86 75 88 76 83 82 81 88 82 71 80 80 71Demo Asphalt at RCB 77 89 78 91 79 86 85 84 91 85 74 83 83 74
Grade Subgrade 74 86 75 88 76 83 82 81 88 82 71 80 80 71Steel for Invert 74 86 75 88 76 83 82 81 88 82 71 80 80 71Concrete Invert 78 90 79 92 80 87 86 85 92 86 75 84 84 75
Steel for Walls and Deck 74 86 75 88 76 83 82 81 88 82 71 80 80 71Concrete Walls and Deck 78 90 79 92 80 87 86 85 92 86 75 84 84 75
Backfil l RCB 77 89 78 91 79 86 85 84 91 85 74 83 83 74
Grade Subgrade 77 89 78 91 79 86 85 84 91 85 74 83 83 74Steel for Invert 74 86 75 88 76 83 82 81 88 82 71 80 80 71
Concrete for Invert 78 90 79 92 80 87 86 85 92 86 75 84 84 75Steel for Walls 74 86 75 88 76 83 82 81 88 82 71 80 80 71
Concrete for Walls & Grading 78 90 79 92 80 87 86 85 92 86 75 84 84 75
Relocate Util ities 74 86 75 88 76 83 82 81 88 82 71 80 80 71Demo Asphalt at RCB 77 89 78 91 79 86 85 84 91 85 74 83 83 74
Grade Subgrade 74 86 75 88 76 83 82 81 88 82 71 80 80 71Steel for Invert 74 86 75 88 76 83 82 81 88 82 71 80 80 71
Concrete for Invert 78 90 79 92 80 87 86 85 92 86 75 84 84 75Steel for Walls and Deck 74 86 75 88 76 83 82 81 88 82 71 80 80 71
Concrete for Walls and Deck 78 90 79 92 80 87 86 85 92 86 75 84 84 75Backfil l RCB 77 89 78 91 79 86 85 84 91 85 74 83 83 74
Paving 78 89 79 92 80 87 85 85 92 85 74 84 83 75Demo Channel and RCB 77 89 78 91 79 86 85 84 91 85 74 83 83 74
Grade Subgrade 74 86 75 88 76 83 82 81 88 82 71 80 80 71Steel for Invert 74 86 75 88 76 83 82 81 88 82 71 80 80 71
Concrete for Invert 78 90 79 92 80 87 86 85 92 86 75 84 84 75Steel for Walls 74 86 75 88 76 83 82 81 88 82 71 80 80 71
Concrete for Walls 78 90 79 92 80 87 86 85 92 86 75 84 84 75
Fencing 74 86 75 88 76 83 82 81 88 82 71 80 80 71Remove Stockpile 77 89 78 91 79 86 85 84 91 85 74 83 83 74
Grade Earthen Channel 74 86 75 88 76 83 82 81 88 82 71 80 80 71Rock Slope Protection 77 89 78 91 79 86 85 84 91 85 74 83 83 74
Final Grading/Cleanup 77 89 78 91 79 86 85 84 91 85 74 83 83 74
Channel Between Abbey & Merris
RCB at Abbey
Distance to Edge of Construction Activity (Feet)Construction
Stage & Activities
Highest EquipmentNoise Level
@ 50 Feet (dBA Leq)
Church Street Channel Muck Out
Channel Downstream of Abbey
Paving & Channel North of Merris
RCB at Merris
Fencing & Cleanup
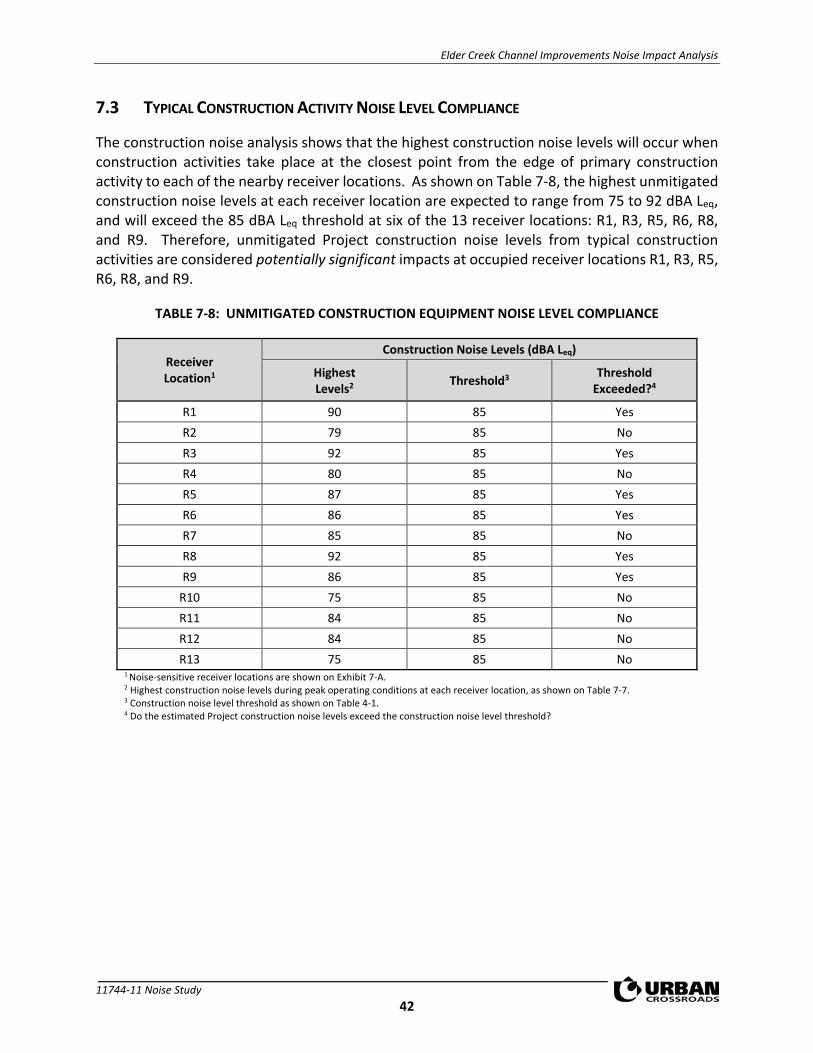
Elder Creek Channel Improvements Noise Impact Analysis
11744-11 Noise Study 42
7.3 TYPICAL CONSTRUCTION ACTIVITY NOISE LEVEL COMPLIANCE
The construction noise analysis shows that the highest construction noise levels will occur when construction activities take place at the closest point from the edge of primary construction activity to each of the nearby receiver locations. As shown on Table 7-8, the highest unmitigated construction noise levels at each receiver location are expected to range from 75 to 92 dBA Leq, and will exceed the 85 dBA Leq threshold at six of the 13 receiver locations: R1, R3, R5, R6, R8, and R9. Therefore, unmitigated Project construction noise levels from typical construction activities are considered potentially significant impacts at occupied receiver locations R1, R3, R5, R6, R8, and R9.
TABLE 7-8: UNMITIGATED CONSTRUCTION EQUIPMENT NOISE LEVEL COMPLIANCE
Receiver Location1
Construction Noise Levels (dBA Leq)
Highest Levels2 Threshold3 Threshold
Exceeded?4
R1 90 85 Yes R2 79 85 No R3 92 85 Yes R4 80 85 No R5 87 85 Yes R6 86 85 Yes R7 85 85 No R8 92 85 Yes R9 86 85 Yes
R10 75 85 No R11 84 85 No R12 84 85 No R13 75 85 No
1 Noise-sensitive receiver locations are shown on Exhibit 7-A. 2 Highest construction noise levels during peak operating conditions at each receiver location, as shown on Table 7-7. 3 Construction noise level threshold as shown on Table 4-1. 4 Do the estimated Project construction noise levels exceed the construction noise level threshold?
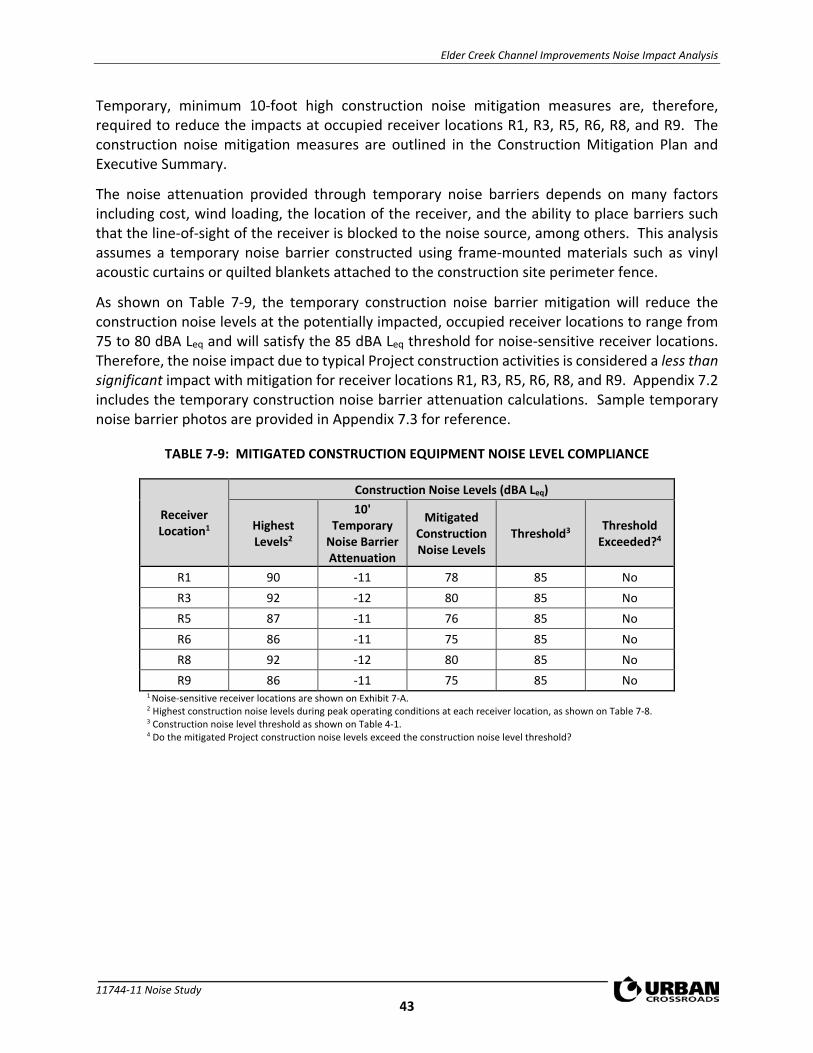
Elder Creek Channel Improvements Noise Impact Analysis
11744-11 Noise Study 43
Temporary, minimum 10-foot high construction noise mitigation measures are, therefore, required to reduce the impacts at occupied receiver locations R1, R3, R5, R6, R8, and R9. The construction noise mitigation measures are outlined in the Construction Mitigation Plan and Executive Summary.
The noise attenuation provided through temporary noise barriers depends on many factors including cost, wind loading, the location of the receiver, and the ability to place barriers such that the line-of-sight of the receiver is blocked to the noise source, among others. This analysis assumes a temporary noise barrier constructed using frame-mounted materials such as vinyl acoustic curtains or quilted blankets attached to the construction site perimeter fence.
As shown on Table 7-9, the temporary construction noise barrier mitigation will reduce the construction noise levels at the potentially impacted, occupied receiver locations to range from 75 to 80 dBA Leq and will satisfy the 85 dBA Leq threshold for noise-sensitive receiver locations. Therefore, the noise impact due to typical Project construction activities is considered a less than significant impact with mitigation for receiver locations R1, R3, R5, R6, R8, and R9. Appendix 7.2 includes the temporary construction noise barrier attenuation calculations. Sample temporary noise barrier photos are provided in Appendix 7.3 for reference.
TABLE 7-9: MITIGATED CONSTRUCTION EQUIPMENT NOISE LEVEL COMPLIANCE
Receiver Location1
Construction Noise Levels (dBA Leq)
Highest Levels2
10' Temporary
Noise Barrier Attenuation
Mitigated Construction Noise Levels
Threshold3 Threshold Exceeded?4
R1 90 -11 78 85 No R3 92 -12 80 85 No R5 87 -11 76 85 No R6 86 -11 75 85 No R8 92 -12 80 85 No R9 86 -11 75 85 No
1 Noise-sensitive receiver locations are shown on Exhibit 7-A. 2 Highest construction noise levels during peak operating conditions at each receiver location, as shown on Table 7-8. 3 Construction noise level threshold as shown on Table 4-1. 4 Do the mitigated Project construction noise levels exceed the construction noise level threshold?
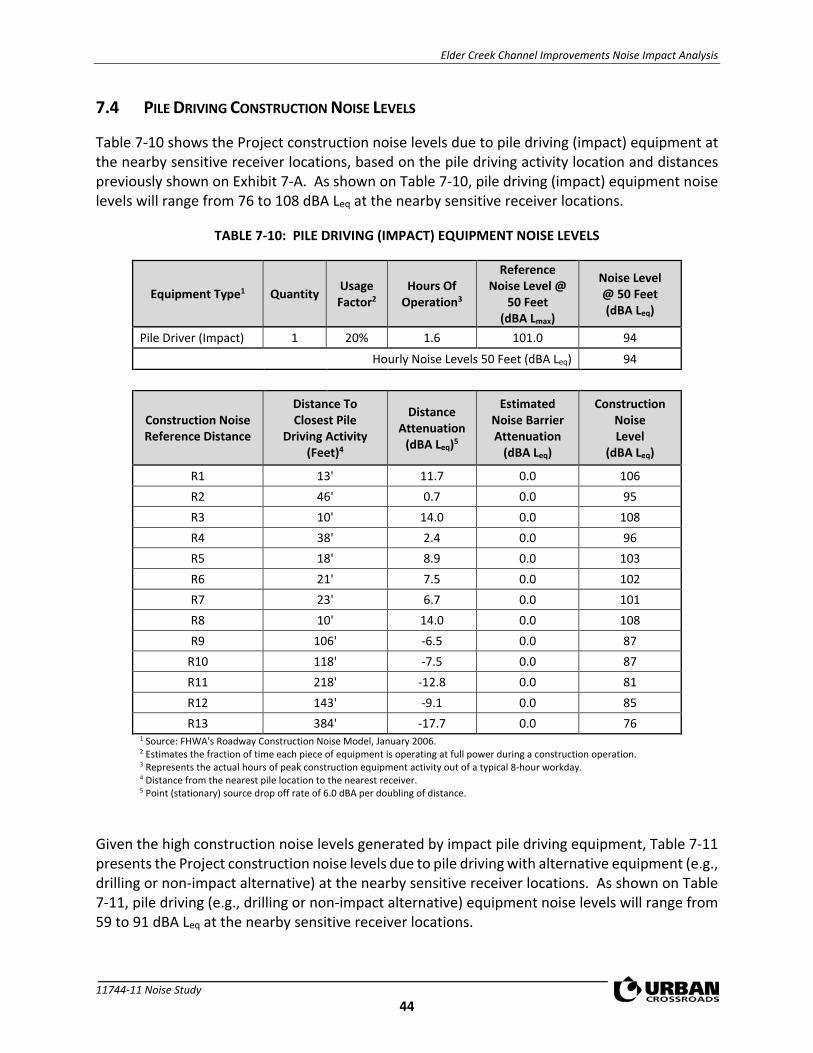
Elder Creek Channel Improvements Noise Impact Analysis
11744-11 Noise Study 44
7.4 PILE DRIVING CONSTRUCTION NOISE LEVELS
Table 7-10 shows the Project construction noise levels due to pile driving (impact) equipment at the nearby sensitive receiver locations, based on the pile driving activity location and distances previously shown on Exhibit 7-A. As shown on Table 7-10, pile driving (impact) equipment noise levels will range from 76 to 108 dBA Leq at the nearby sensitive receiver locations.
TABLE 7-10: PILE DRIVING (IMPACT) EQUIPMENT NOISE LEVELS
Equipment Type1 Quantity Usage Factor2
Hours Of Operation3
Reference Noise Level @
50 Feet (dBA Lmax)
Noise Level @ 50 Feet (dBA Leq)
Pile Driver (Impact) 1 20% 1.6 101.0 94
Hourly Noise Levels 50 Feet (dBA Leq) 94
Construction Noise Reference Distance
Distance To Closest Pile
Driving Activity (Feet)4
Distance Attenuation
(dBA Leq)5
Estimated Noise Barrier Attenuation
(dBA Leq)
Construction Noise Level
(dBA Leq)
R1 13' 11.7 0.0 106 R2 46' 0.7 0.0 95 R3 10' 14.0 0.0 108 R4 38' 2.4 0.0 96 R5 18' 8.9 0.0 103 R6 21' 7.5 0.0 102 R7 23' 6.7 0.0 101 R8 10' 14.0 0.0 108 R9 106' -6.5 0.0 87
R10 118' -7.5 0.0 87 R11 218' -12.8 0.0 81 R12 143' -9.1 0.0 85 R13 384' -17.7 0.0 76
1 Source: FHWA's Roadway Construction Noise Model, January 2006. 2 Estimates the fraction of time each piece of equipment is operating at full power during a construction operation. 3 Represents the actual hours of peak construction equipment activity out of a typical 8-hour workday. 4 Distance from the nearest pile location to the nearest receiver. 5 Point (stationary) source drop off rate of 6.0 dBA per doubling of distance.
Given the high construction noise levels generated by impact pile driving equipment, Table 7-11 presents the Project construction noise levels due to pile driving with alternative equipment (e.g., drilling or non-impact alternative) at the nearby sensitive receiver locations. As shown on Table 7-11, pile driving (e.g., drilling or non-impact alternative) equipment noise levels will range from 59 to 91 dBA Leq at the nearby sensitive receiver locations.
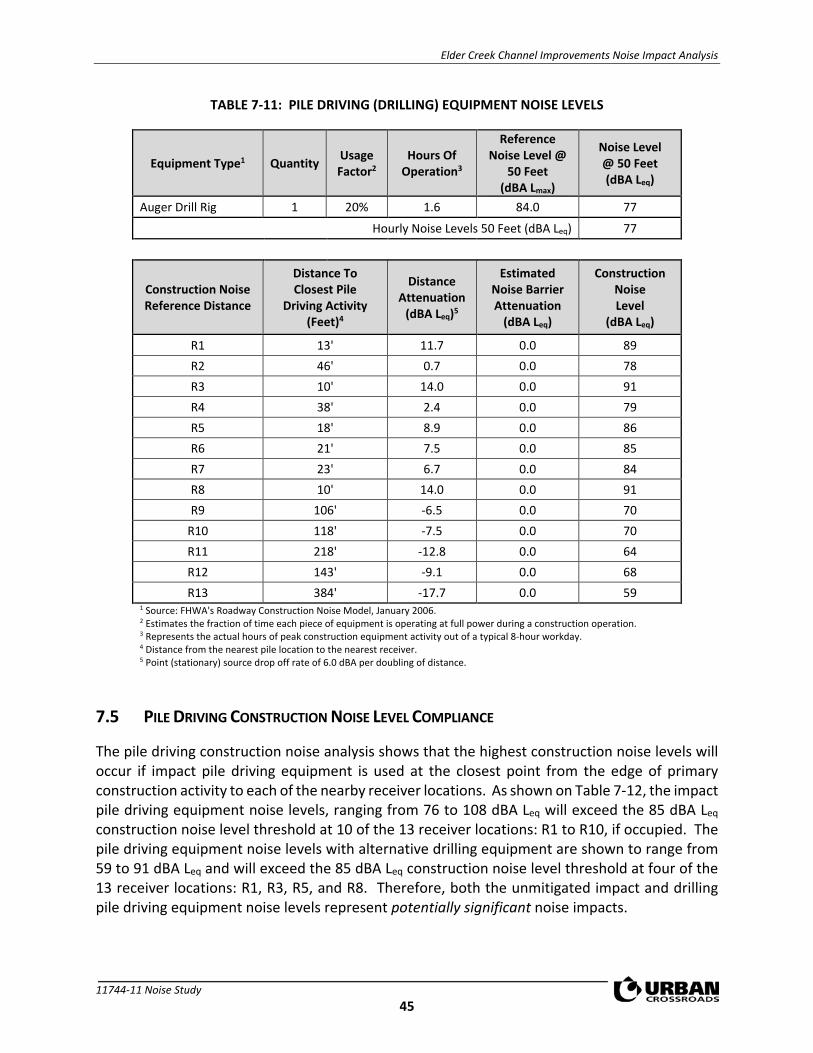
Elder Creek Channel Improvements Noise Impact Analysis
11744-11 Noise Study 45
TABLE 7-11: PILE DRIVING (DRILLING) EQUIPMENT NOISE LEVELS
Equipment Type1 Quantity Usage Factor2
Hours Of Operation3
Reference Noise Level @
50 Feet (dBA Lmax)
Noise Level @ 50 Feet (dBA Leq)
Auger Drill Rig 1 20% 1.6 84.0 77
Hourly Noise Levels 50 Feet (dBA Leq) 77
Construction Noise Reference Distance
Distance To Closest Pile
Driving Activity (Feet)4
Distance Attenuation
(dBA Leq)5
Estimated Noise Barrier Attenuation
(dBA Leq)
Construction Noise Level
(dBA Leq)
R1 13' 11.7 0.0 89 R2 46' 0.7 0.0 78 R3 10' 14.0 0.0 91 R4 38' 2.4 0.0 79 R5 18' 8.9 0.0 86 R6 21' 7.5 0.0 85 R7 23' 6.7 0.0 84 R8 10' 14.0 0.0 91 R9 106' -6.5 0.0 70
R10 118' -7.5 0.0 70 R11 218' -12.8 0.0 64 R12 143' -9.1 0.0 68 R13 384' -17.7 0.0 59
1 Source: FHWA's Roadway Construction Noise Model, January 2006. 2 Estimates the fraction of time each piece of equipment is operating at full power during a construction operation. 3 Represents the actual hours of peak construction equipment activity out of a typical 8-hour workday. 4 Distance from the nearest pile location to the nearest receiver. 5 Point (stationary) source drop off rate of 6.0 dBA per doubling of distance.
7.5 PILE DRIVING CONSTRUCTION NOISE LEVEL COMPLIANCE
The pile driving construction noise analysis shows that the highest construction noise levels will occur if impact pile driving equipment is used at the closest point from the edge of primary construction activity to each of the nearby receiver locations. As shown on Table 7-12, the impact pile driving equipment noise levels, ranging from 76 to 108 dBA Leq will exceed the 85 dBA Leq construction noise level threshold at 10 of the 13 receiver locations: R1 to R10, if occupied. The pile driving equipment noise levels with alternative drilling equipment are shown to range from 59 to 91 dBA Leq and will exceed the 85 dBA Leq construction noise level threshold at four of the 13 receiver locations: R1, R3, R5, and R8. Therefore, both the unmitigated impact and drilling pile driving equipment noise levels represent potentially significant noise impacts.
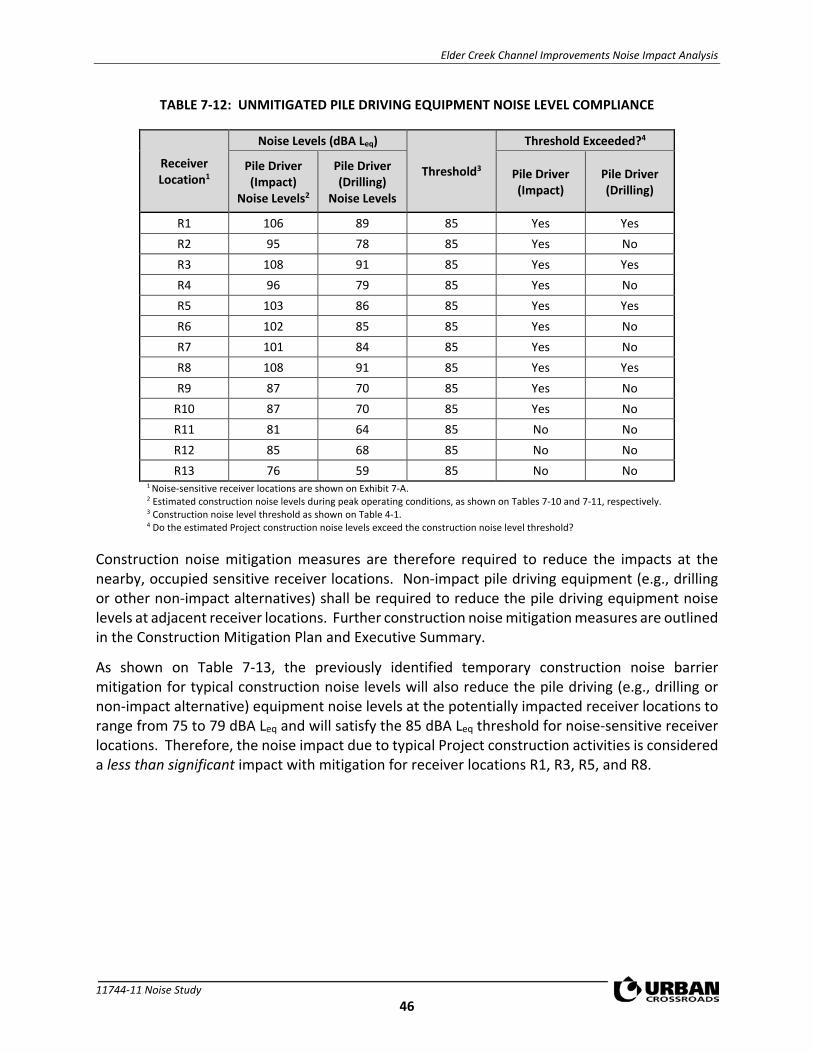
Elder Creek Channel Improvements Noise Impact Analysis
11744-11 Noise Study 46
TABLE 7-12: UNMITIGATED PILE DRIVING EQUIPMENT NOISE LEVEL COMPLIANCE
Receiver Location1
Noise Levels (dBA Leq)
Threshold3
Threshold Exceeded?4
Pile Driver (Impact)
Noise Levels2
Pile Driver (Drilling)
Noise Levels
Pile Driver (Impact)
Pile Driver (Drilling)
R1 106 89 85 Yes Yes R2 95 78 85 Yes No R3 108 91 85 Yes Yes R4 96 79 85 Yes No R5 103 86 85 Yes Yes R6 102 85 85 Yes No R7 101 84 85 Yes No R8 108 91 85 Yes Yes R9 87 70 85 Yes No
R10 87 70 85 Yes No R11 81 64 85 No No R12 85 68 85 No No R13 76 59 85 No No
1 Noise-sensitive receiver locations are shown on Exhibit 7-A. 2 Estimated construction noise levels during peak operating conditions, as shown on Tables 7-10 and 7-11, respectively. 3 Construction noise level threshold as shown on Table 4-1. 4 Do the estimated Project construction noise levels exceed the construction noise level threshold?
Construction noise mitigation measures are therefore required to reduce the impacts at the nearby, occupied sensitive receiver locations. Non-impact pile driving equipment (e.g., drilling or other non-impact alternatives) shall be required to reduce the pile driving equipment noise levels at adjacent receiver locations. Further construction noise mitigation measures are outlined in the Construction Mitigation Plan and Executive Summary.
As shown on Table 7-13, the previously identified temporary construction noise barrier mitigation for typical construction noise levels will also reduce the pile driving (e.g., drilling or non-impact alternative) equipment noise levels at the potentially impacted receiver locations to range from 75 to 79 dBA Leq and will satisfy the 85 dBA Leq threshold for noise-sensitive receiver locations. Therefore, the noise impact due to typical Project construction activities is considered a less than significant impact with mitigation for receiver locations R1, R3, R5, and R8.
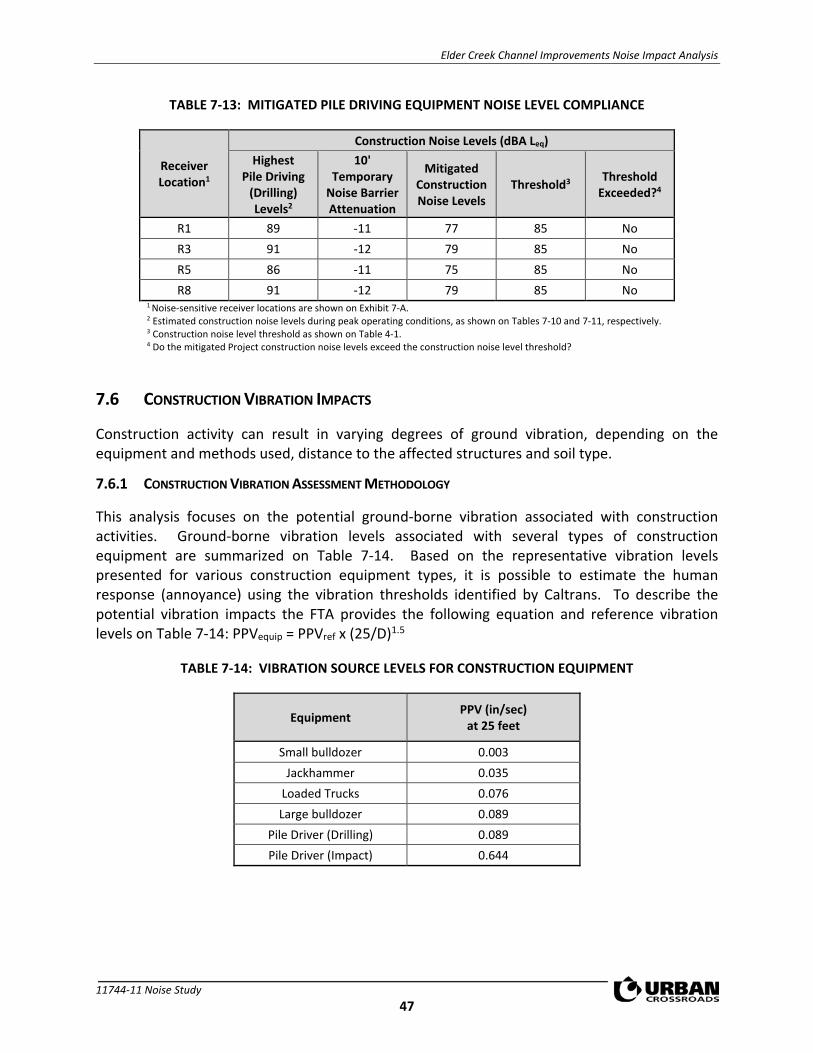
Elder Creek Channel Improvements Noise Impact Analysis
11744-11 Noise Study 47
TABLE 7-13: MITIGATED PILE DRIVING EQUIPMENT NOISE LEVEL COMPLIANCE
Receiver Location1
Construction Noise Levels (dBA Leq) Highest
Pile Driving (Drilling) Levels2
10' Temporary
Noise Barrier Attenuation
Mitigated Construction Noise Levels
Threshold3 Threshold Exceeded?4
R1 89 -11 77 85 No R3 91 -12 79 85 No R5 86 -11 75 85 No R8 91 -12 79 85 No
1 Noise-sensitive receiver locations are shown on Exhibit 7-A. 2 Estimated construction noise levels during peak operating conditions, as shown on Tables 7-10 and 7-11, respectively. 3 Construction noise level threshold as shown on Table 4-1. 4 Do the mitigated Project construction noise levels exceed the construction noise level threshold?
7.6 CONSTRUCTION VIBRATION IMPACTS
Construction activity can result in varying degrees of ground vibration, depending on the equipment and methods used, distance to the affected structures and soil type.
7.6.1 CONSTRUCTION VIBRATION ASSESSMENT METHODOLOGY
This analysis focuses on the potential ground-borne vibration associated with construction activities. Ground-borne vibration levels associated with several types of construction equipment are summarized on Table 7-14. Based on the representative vibration levels presented for various construction equipment types, it is possible to estimate the human response (annoyance) using the vibration thresholds identified by Caltrans. To describe the potential vibration impacts the FTA provides the following equation and reference vibration levels on Table 7-14: PPVequip = PPVref x (25/D)1.5
TABLE 7-14: VIBRATION SOURCE LEVELS FOR CONSTRUCTION EQUIPMENT
Equipment PPV (in/sec) at 25 feet
Small bulldozer 0.003 Jackhammer 0.035
Loaded Trucks 0.076 Large bulldozer 0.089
Pile Driver (Drilling) 0.089 Pile Driver (Impact) 0.644
Elder Creek Channel Improvements Noise Impact Analysis
11744-11 Noise Study 48
7.6.2 CONSTRUCTION VIBRATION LEVELS
Ground-borne vibration levels resulting from construction activities occurring within the Project site were estimated by data published by the Federal Transit Administration (FTA). Using the vibration source level of construction equipment provided on Table 7-14 and the construction vibration assessment methodology published by the FTA, it is possible to estimate the Project vibration impacts. Table 7-15 presents the expected Project related vibration levels at distances ranging from 10 to 73 feet from construction activity.
Typical Construction Activity Vibration Levels
At distances ranging from 10 to 73 feet from the Project site, typical construction activity vibration velocity levels are expected to range from 0.018 to 0.352 in/sec PPV, as shown on Table 7-15. Table 7-15 shows that the Project construction vibration levels will exceed the human annoyance threshold of 0.2 in/sec PPV at receiver locations R1, R3 and R8. In addition, construction vibration levels are shown to exceed the building damage threshold of 0.3 in/sec PPV at receiver locations R3 and R8. Therefore, the unmitigated temporary construction-related vibration levels are considered a potentially significant impact.
Temporary construction vibration mitigation measures are required to reduce the impacts at nearby sensitive receiver locations. The Construction Mitigation Plan outlined in this report identifies the measures required to satisfy the 0.3 in/sec PPV building damage vibration threshold at nearby sensitive receiver locations to less than significant impacts after mitigation. Mitigation includes ground-borne vibration monitoring of nearby residential structures, represented by receiver locations R1, and R3 to R8 adjacent to the channel between Old Greenspot Road and Merris Street, shall be required for the duration of Project construction between Old Greenspot Road and Merris Street. The monitoring shall be based on the Caltrans residential building damage threshold of 0.3 in/sec PPV. Though Caltrans identifies a residential building damage threshold of 0.3 in/sec PPV, the County of San Bernardino may require that vibration levels do not exceed a more conservative threshold (e.g., lower) at their discretion.
However, vibration levels will still exceed the human annoyance threshold of 0.2 in/sec PPV at receiver locations R1, R3, and R8, and therefore, Project typical construction vibration levels represent a potentially significant impact at occupied residential homes in relation to human annoyance with mitigation. The Construction Mitigation Plan outlined in this report identifies the measures required to satisfy the 0.2 in/sec PPV human annoyance vibration threshold at nearby sensitive receiver locations to less than significant impacts after mitigation. If monitored vibration levels exceed the 0.2 in/sec PPV annoyance threshold then relocation of residents, and/or hours restrictions to day(s)/time(s) when the impacted receiver(s) are unoccupied, shall be provided for the duration of activities within 25 feet of the affected receiver location(s).
Further, vibration levels at the site of the closest sensitive receiver are unlikely to be sustained during the entire construction period, but will occur rather only during the times that heavy construction equipment is operating adjacent to the Project site perimeter. Moreover, construction at the Project site will be restricted to daytime hours consistent with City
Elder Creek Channel Improvements Noise Impact Analysis
11744-11 Noise Study 49
requirements thereby eliminating potential vibration impacts during the sensitive nighttime hours.
Pile Driving Construction Vibration Levels
At distances ranging from 10 to 384 feet from pile driving (impact) activities, vibration velocity levels are expected to range from 0.011 to 2.530 in/sec PPV, as shown on Table 7-15. Table 7-15 shows that the Project construction vibration levels will exceed the County’s human annoyance threshold of 0.2 in/sec PPV at receiver locations R1 to R8. In addition, pile driving (impact) vibration levels are shown to exceed the building damage threshold of 0.3 in/sec PPV at receiver locations R1, and R3 to R8. Therefore, the unmitigated temporary impact pile driving-related vibration levels are considered a potentially significant impact.
Temporary construction vibration mitigation measures are required to reduce the impacts at nearby sensitive receiver locations during pile driving activities. Consistent with the pile driving measures identified in this report to reduce impact pile driving noise levels, the use of alternative pile driving equipment (e.g., drilling or non-impact alternative) shall be required instead of impact devices. The mitigated pile driving vibration levels with alternative equipment (e.g., drilling or non-impact alternative) will be reduced to range from 0.001 to 0.352 in/sec PPV, and will still exceed the Caltrans 0.3 in/sec PPV building damage threshold for older residential structures at receiver locations R3 and R8, as shown on Table 7-16. Therefore, the vibration monitoring as part of the Construction Mitigation Plan identified in this noise study shall be required to reduce impacts to less than significant levels.
In addition, pile driving (e.g., drilling or non-impact alternative) equipment vibration levels will potentially exceed the human annoyance threshold of 0.2 in/sec PPV at receiver locations R1, R3, and R8, and therefore, Project pile driving (e.g., drilling or non-impact alternative) vibration levels represent a potentially significant impact at occupied residential homes in relation to human annoyance with mitigation. However, the Construction Mitigation Plan outlined in this report identifies the measures required to satisfy the 0.2 in/sec PPV human annoyance vibration threshold at nearby sensitive receiver locations to less than significant impacts after mitigation.

Elde
r Cre
ek C
hann
el Im
prov
emen
ts N
oise
Impa
ct A
naly
sis
1174
4-11
Noi
se S
tudy
50
TABL
E 7-
15:
UN
MIT
IGAT
ED C
ON
STRU
CTIO
N E
QU
IPM
ENT
VIBR
ATIO
N L
EVEL
S
Rece
iver
1
Dist
ance
to
Co
nst.
Activ
ity
(Fee
t)
Typi
cal C
onst
ruct
ion
PPV
Leve
ls (i
n/se
c)2
Pile
Driv
ing
(PPV
)2 Th
resh
olds
(in
/sec
PPV
)
Thre
shol
d Ex
ceed
ed?3
Typi
cal
Cons
truc
tion
Pile
Driv
ing
Impa
ct
Smal
l Bu
lldoz
er
(< 8
0k lb
s)
Jack
- ha
mm
er
Load
ed
Truc
ks
Larg
e Bu
lldoz
er
(> 8
0k lb
s)
High
est
Vibr
atio
n Le
vel
Dis
tanc
e to
Pi
le D
rivin
g (F
eet)
Pile
D
river
(Im
pact
)
Hum
an
Anno
yanc
e Bu
ildin
g Da
mag
e Hu
man
An
noya
nce
Build
ing
Dam
age
Hum
an
Anno
yanc
e Bu
ildin
g Da
mag
e
R1
13'
0.00
8 0.
093
0.20
3 0.
237
0.23
7 13
' 1.
707
0.2
0.3
Yes
No
Yes
Yes
R2
46'
0.00
1 0.
014
0.03
0 0.
036
0.03
6 46
' 0.
256
0.2
0.3
No
No
Yes
No
R3
10'
0.01
2 0.
138
0.30
0 0.
352
0.35
2 10
' 2.
530
0.2
0.3
Yes
Yes
Yes
Yes
R4
38'
0.00
2 0.
019
0.04
1 0.
047
0.04
7 38
' 0.
342
0.2
0.3
No
No
Yes
Yes
R5
18'
0.00
5 0.
057
0.12
4 0.
146
0.14
6 18
' 1.
048
0.2
0.3
No
No
Yes
Yes
R6
21'
0.00
4 0.
045
0.09
9 0.
116
0.11
6 21
' 0.
831
0.2
0.3
No
No
Yes
Yes
R7
23'
0.00
3 0.
040
0.08
6 0.
101
0.10
1 23
' 0.
725
0.2
0.3
No
No
Yes
Yes
R8
10'
0.01
2 0.
138
0.30
0 0.
352
0.35
2 10
' 2.
530
0.2
0.3
Yes
Yes
Yes
Yes
R9
21'
0.00
4 0.
045
0.09
9 0.
116
0.11
6 10
6'
0.07
3 0.
2 0.
3 N
o N
o N
o N
o R1
0 73
' 0.
001
0.00
7 0.
015
0.01
8 0.
018
118'
0.
062
0.2
0.3
No
No
No
No
R11
24'
0.00
3 0.
037
0.08
1 0.
095
0.09
5 21
8'
0.02
5 0.
2 0.
3 N
o N
o N
o N
o R1
2 26
' 0.
003
0.03
3 0.
072
0.08
4 0.
084
143'
0.
047
0.2
0.3
No
No
No
No
R13
69'
0.00
1 0.
008
0.01
7 0.
019
0.01
9 38
4'
0.01
1 0.
2 0.
3 N
o N
o N
o N
o 1
Rece
iver
loca
tions
are
show
n on
Exh
ibit
7-A.
2 B
ased
on
the
Vibr
atio
n So
urce
Lev
els o
f Con
stru
ctio
n Eq
uipm
ent i
nclu
ded
on T
able
7-1
4.
3 Doe
s the
pea
k vi
brat
ion
exce
ed th
e ac
cept
able
vib
ratio
n th
resh
olds
? "P
PV" =
Pea
k Pa
rtic
le V
eloc
ity

Elde
r Cre
ek C
hann
el Im
prov
emen
ts N
oise
Impa
ct A
naly
sis
1174
4-11
Noi
se S
tudy
51
TABL
E 7-
16:
ALTE
RNAT
IVE
PILE
DRI
VIN
G C
ON
STRU
CTIO
N E
QU
IPM
ENT
VIBR
ATIO
N L
EVEL
S
Rece
iver
1
Dist
ance
to
Con
st.
Activ
ity
(Fee
t)
Pile
Dril
ling
(PPV
) Th
resh
olds
(in
/sec
PPV
) Th
resh
old
Exce
eded
?
Dis
tanc
e to
Pi
le D
rivin
g (F
eet)
Pile
Driv
er
(Dril
l) Hu
man
An
noya
nce
Build
ing
Dam
age
Hum
an
Anno
yanc
e Bu
ildin
g Da
mag
e
R1
13'
13'
0.23
7 0.
2 0.
3 Ye
s N
o R2
46
' 46
' 0.
036
0.2
0.3
No
No
R3
10'
10'
0.35
2 0.
2 0.
3 Ye
s Ye
s R4
38
' 38
' 0.
047
0.2
0.3
No
No
R5
18'
18'
0.14
6 0.
2 0.
3 N
o N
o R6
21
' 21
' 0.
116
0.2
0.3
No
No
R7
23'
23'
0.10
1 0.
2 0.
3 N
o N
o R8
10
' 10
' 0.
352
0.2
0.3
Yes
Yes
R9
21'
106'
0.
010
0.2
0.3
No
No
R10
73'
118'
0.
009
0.2
0.3
No
No
R11
24'
218'
0.
003
0.2
0.3
No
No
R12
26'
143'
0.
007
0.2
0.3
No
No
R13
69'
384'
0.
001
0.2
0.3
No
No
1 Re
ceiv
er lo
catio
ns a
re sh
own
on E
xhib
it 7-
A.
2 Bas
ed o
n th
e Vi
brat
ion
Sour
ce L
evel
s of C
onst
ruct
ion
Equi
pmen
t inc
lude
d on
Tab
le 7
-14.
3 D
oes t
he m
itiga
ted
vibr
atio
n ex
ceed
the
acce
ptab
le v
ibra
tion
thre
shol
ds?
"PPV
" = P
eak
Part
icle
Vel
ocity

Elder Creek Channel Improvements Noise Impact Analysis
11744-11 Noise Study 52
This page intentionally left blank
Elder Creek Channel Improvements Noise Impact Analysis
11744-11 Noise Study 53
8 REFERENCES
1. State of California. California Environmental Quality Act, Appendix G. 2018. 2. California Department of Transportation Environmental Program. Technical Noise Supplement - A
Technical Supplement to the Traffic Noise Analysis Protocol. Sacramento, CA : s.n., September 2013.
3. Environmental Protection Agency Office of Noise Abatement and Control. Information on Levels of Environmental Noise Requisite to Protect Public Health and Welfare with an Adequate Margin of Safety. March 1974. EPA/ONAC 550/9/74-004.
4. U.S. Department of Transportation, Federal Highway Administration, Office of Environment and Planning, Noise and Air Quality Branch. Highway Traffic Noise Analysis and Abatement Policy and Guidance. June, 1995.
5. U.S. Department of Transportation, Federal Highway Administration. Highway Traffic Noise in the United States, Problem and Response. April 2000. p. 3.
6. U.S. Environmental Protection Agency Office of Noise Abatement and Control. Noise Effects Handbook-A Desk Reference to Health and Welfare Effects of Noise. October 1979 (revised July 1981). EPA 550/9/82/106.
7. Occupational Safety and Health Administration. Standard 29 CRF, Part 1910.
8. Center for Disease Control and Prevention. About Hearing Loss. [Online] [Cited: 04 15, 2016.] http://www.cdc.gov/healthyschools/noise/signs.htm.
9. U.S. Department of Transportation, Federal Transit Administration. Transit Noise and Vibration Impact Assessment. September 2018.
10. Office of Planning and Research. State of California General Plan Guidlines 2003. October 2003.
11. City of Highland. General Plan, Noise Element. March 2006.
12. National Institute for Occupational Safety and Health. Criteria for Recommended Standard: Occupational Noise Exposure. June 1998.
13. California Department of Transportation. Transportation and Construction Vibration Guidance Manual. September 2013.
14. County of San Bernardino. Development Code, Chapter 83.01.
15. American National Standards Institute (ANSI). Specification for Sound Level Meters ANSI S1.4-2014/IEC 61672-1:2013.
16. U.S. Department of Transportation, Federal Highway Administration, Office of Environment and Planning. FHWA Roadway Construction Noise Model. January, 2006.
17. San Bernardino County Flood Control District. Elder Creek Construction Schedule. May 2018.

Elder Creek Channel Improvements Noise Impact Analysis
11744-11 Noise Study 54
This page intentionally left blank

Elder Creek Channel Improvements Noise Impact Analysis
11744-11 Noise Study 55
9 CERTIFICATION
The contents of this noise study report represent an accurate depiction of the noise environment and impacts associated with the proposed Elder Creek Channel Improvements Project. The information contained in this noise study report is based on the best available data at the time of preparation. If you have any questions, please contact me directly at (949) 336-5979.
Bill Lawson, P.E., INCE Principal URBAN CROSSROADS, INC. 260 E. Baker Street, Suite 200 Costa Mesa, CA 92626 (949) 336-5979 [email protected]
EDUCATION
Master of Science in Civil and Environmental Engineering California Polytechnic State University, San Luis Obispo • December, 1993
Bachelor of Science in City and Regional Planning California Polytechnic State University, San Luis Obispo • June, 1992
PROFESSIONAL REGISTRATIONS
PE – Registered Professional Traffic Engineer – TR 2537 • January, 2009 AICP – American Institute of Certified Planners – 013011 • June, 1997–January 1, 2012 PTP – Professional Transportation Planner • May, 2007 – May, 2013 INCE – Institute of Noise Control Engineering • March, 2004
PROFESSIONAL AFFILIATIONS
ASA – Acoustical Society of America ITE – Institute of Transportation Engineers
PROFESSIONAL CERTIFICATIONS
Certified Acoustical Consultant – County of Orange • February, 2011 FHWA-NHI-142051 Highway Traffic Noise Certificate of Training • February, 2013

Elder Creek Channel Improvements Noise Impact Analysis
11744-11 Noise Study 56
This page intentionally left blank

Elder Creek Channel Improvements Noise Impact Analysis
11744-11 Noise Study
APPENDIX 3.1:
CITY OF HIGHLAND MUNICIPAL CODE
57

Elder Creek Channel Improvements Noise Impact Analysis
11744-11 Noise Study
This page intentionally left blank
58
Chapter 8.50 NOISE CONTROL
Sections:8.50.010 Findings and purpose.8.50.020 Definitions.8.50.030 Prohibited acts.8.50.040 Excessive noise and vibration emanating from a motor vehicle.8.50.050 Controlled hours of operation.8.50.060 Exemptions.8.50.070 Enforcement and administration.8.50.080 Enforcement – Interference.8.50.090 Violations – Notices – Abatement.8.50.100 Repealed.8.50.110 Violations – Notices – Service – Effect.8.50.120 Immediate threats to health and welfare.8.50.130 Administrative citations and costs of second and subsequent responses.8.50.140 Modification, suspension and/or revocation of validly issued city permit and/or city license.
8.50.010 Findings and purpose.
A. It is the purpose of these regulations to implement the goals and objectives of the noise element of the city’sgeneral plan, to establish community-wide noise standards and to serve as a reference for locating other cityregulations relating to noise in the community. It is further the purpose of these regulations to recognize that theexistence of excessive noise within the city is a condition which is detrimental to the health, safety, welfare andquality of life of the citizens which should be regulated in the public interest.
B. In furtherance of the foregoing purpose, the city council finds and declares as follows:
1. The making, creation or maintenance of such loud, unnecessary, unnatural or unusual noises or vibrationsthat are prolonged, unusual, annoying, disturbing and unnatural in their time, place and use are a detrimentto the public health, comfort, convenience, safety, general welfare and the peace and quiet of the city and itsinhabitants; and
2. The public interest necessity for the provisions and prohibitions hereinafter contained and enacted isdeclared as a matter of legislative determination and public policy, and it is further declared that theprovisions and prohibitions hereinafter contained and enacted are in pursuit of and for the purpose ofsecuring and promoting the public health, comfort, convenience, safety, general welfare and property andthe peace and quiet of the city and its inhabitants. (Ord. 324 § 2, 2008)
8.50.020 Definitions.
For the purposes of this chapter, the following terms shall have the meanings given:
“Construction equipment” means tools, machinery or equipment used in connection with construction operations,including all types of “special construction” equipment as defined in the pertinent sections of the California VehicleCode when used in the construction process on any construction site, home improvement site or propertymaintenance site, regardless of whether such site be located on highway or off highway.
“Enforcement officer” means a city code enforcement officer or peace officer authorized to enforce the provisionsand prohibitions of this chapter pursuant to HMC 8.50.070.
59
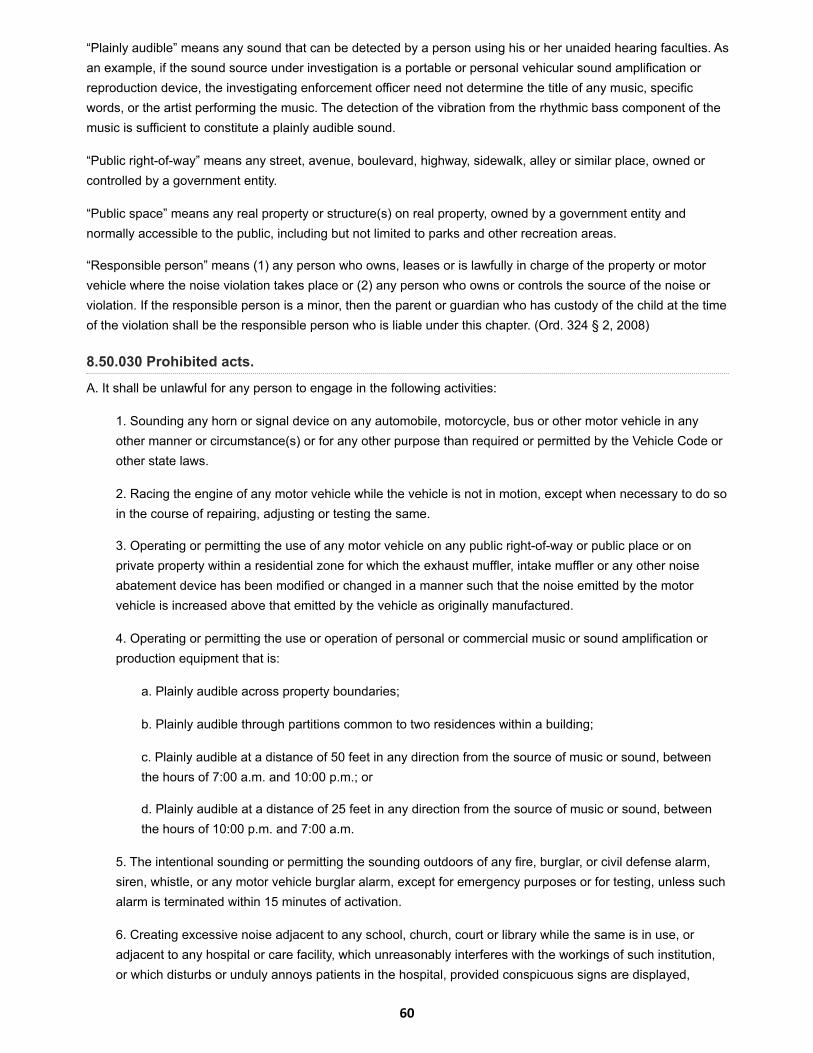
“Plainly audible” means any sound that can be detected by a person using his or her unaided hearing faculties. Asan example, if the sound source under investigation is a portable or personal vehicular sound amplification orreproduction device, the investigating enforcement officer need not determine the title of any music, specificwords, or the artist performing the music. The detection of the vibration from the rhythmic bass component of themusic is sufficient to constitute a plainly audible sound.
“Public right-of-way” means any street, avenue, boulevard, highway, sidewalk, alley or similar place, owned orcontrolled by a government entity.
“Public space” means any real property or structure(s) on real property, owned by a government entity andnormally accessible to the public, including but not limited to parks and other recreation areas.
“Responsible person” means (1) any person who owns, leases or is lawfully in charge of the property or motorvehicle where the noise violation takes place or (2) any person who owns or controls the source of the noise orviolation. If the responsible person is a minor, then the parent or guardian who has custody of the child at the timeof the violation shall be the responsible person who is liable under this chapter. (Ord. 324 § 2, 2008)
8.50.030 Prohibited acts.
A. It shall be unlawful for any person to engage in the following activities:
1. Sounding any horn or signal device on any automobile, motorcycle, bus or other motor vehicle in anyother manner or circumstance(s) or for any other purpose than required or permitted by the Vehicle Code orother state laws.
2. Racing the engine of any motor vehicle while the vehicle is not in motion, except when necessary to do soin the course of repairing, adjusting or testing the same.
3. Operating or permitting the use of any motor vehicle on any public right-of-way or public place or onprivate property within a residential zone for which the exhaust muffler, intake muffler or any other noiseabatement device has been modified or changed in a manner such that the noise emitted by the motorvehicle is increased above that emitted by the vehicle as originally manufactured.
4. Operating or permitting the use or operation of personal or commercial music or sound amplification orproduction equipment that is:
a. Plainly audible across property boundaries;
b. Plainly audible through partitions common to two residences within a building;
c. Plainly audible at a distance of 50 feet in any direction from the source of music or sound, betweenthe hours of 7:00 a.m. and 10:00 p.m.; or
d. Plainly audible at a distance of 25 feet in any direction from the source of music or sound, betweenthe hours of 10:00 p.m. and 7:00 a.m.
5. The intentional sounding or permitting the sounding outdoors of any fire, burglar, or civil defense alarm,siren, whistle, or any motor vehicle burglar alarm, except for emergency purposes or for testing, unless suchalarm is terminated within 15 minutes of activation.
6. Creating excessive noise adjacent to any school, church, court or library while the same is in use, oradjacent to any hospital or care facility, which unreasonably interferes with the workings of such institution,or which disturbs or unduly annoys patients in the hospital, provided conspicuous signs are displayed,
60
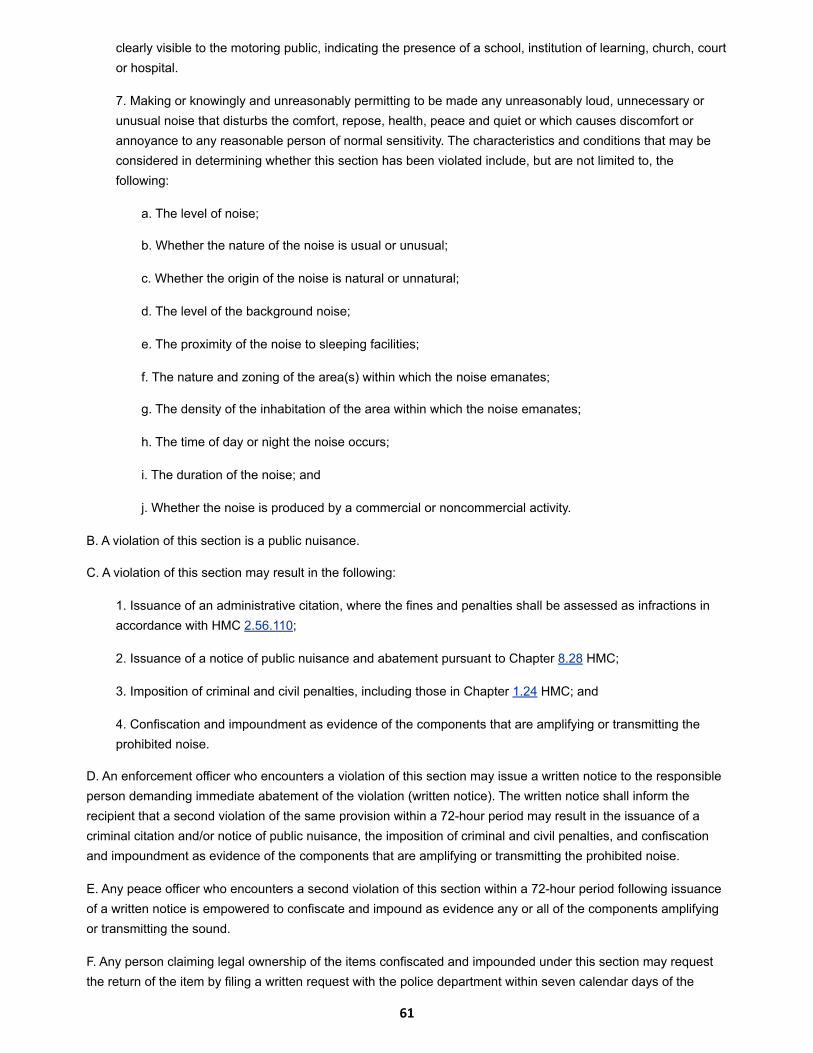
clearly visible to the motoring public, indicating the presence of a school, institution of learning, church, courtor hospital.
7. Making or knowingly and unreasonably permitting to be made any unreasonably loud, unnecessary orunusual noise that disturbs the comfort, repose, health, peace and quiet or which causes discomfort orannoyance to any reasonable person of normal sensitivity. The characteristics and conditions that may beconsidered in determining whether this section has been violated include, but are not limited to, thefollowing:
a. The level of noise;
b. Whether the nature of the noise is usual or unusual;
c. Whether the origin of the noise is natural or unnatural;
d. The level of the background noise;
e. The proximity of the noise to sleeping facilities;
f. The nature and zoning of the area(s) within which the noise emanates;
g. The density of the inhabitation of the area within which the noise emanates;
h. The time of day or night the noise occurs;
i. The duration of the noise; and
j. Whether the noise is produced by a commercial or noncommercial activity.
B. A violation of this section is a public nuisance.
C. A violation of this section may result in the following:
1. Issuance of an administrative citation, where the fines and penalties shall be assessed as infractions inaccordance with HMC 2.56.110;
2. Issuance of a notice of public nuisance and abatement pursuant to Chapter 8.28 HMC;
3. Imposition of criminal and civil penalties, including those in Chapter 1.24 HMC; and
4. Confiscation and impoundment as evidence of the components that are amplifying or transmitting theprohibited noise.
D. An enforcement officer who encounters a violation of this section may issue a written notice to the responsibleperson demanding immediate abatement of the violation (written notice). The written notice shall inform therecipient that a second violation of the same provision within a 72-hour period may result in the issuance of acriminal citation and/or notice of public nuisance, the imposition of criminal and civil penalties, and confiscationand impoundment as evidence of the components that are amplifying or transmitting the prohibited noise.
E. Any peace officer who encounters a second violation of this section within a 72-hour period following issuanceof a written notice is empowered to confiscate and impound as evidence any or all of the components amplifyingor transmitting the sound.
F. Any person claiming legal ownership of the items confiscated and impounded under this section may requestthe return of the item by filing a written request with the police department within seven calendar days of the
61

confiscation. Such requests shall be processed in accordance with the procedures adopted by the policedepartment. (Ord. 370 § 27, 2012; Ord. 324 § 2, 2008)
8.50.040 Excessive noise and vibration emanating from a motor vehicle.
A. No person shall operate or occupy a motor vehicle on any public right-of-way, public place or private property,while operating or permitting the use or operation of any radio, stereo receiver, musical instrument, television,computer, compact disc player, tape recorder, cassette player or any other device for the production orreproduction of sound from within the motor vehicle, so that the sound is plainly audible at a distance of 50 feetfrom such vehicle, or in the case of a motor vehicle on private property, beyond the property line.
B. A violation of this section is a public nuisance.
C. A violation of this section may result in the following:
1. Issuance of an administrative citation, where the fines and penalties shall be assessed as infractions inaccordance with HMC 2.56.110;
2. Issuance of a notice of public nuisance and abatement pursuant to Chapter 8.28 HMC;
3. Imposition of criminal and civil penalties, including those in Chapter 1.24 HMC; and
4. Immediate confiscation and impoundment as evidence of the components that are amplifying ortransmitting the prohibited noises or the immediate confiscation and impoundment of the motor vehicle towhich the component is attached if the same may not be removed without causing harm to the vehicle or thecomponent.
D. Any person claiming legal ownership of a motor vehicle confiscated and impounded under this section mayrequest the return of the vehicle by filing a written request with the police department within seven calendar daysof the confiscation. Such requests shall be processed in accordance with procedures adopted by the policedepartment.
E. Any person claiming legal ownership of the items confiscated and impounded under this section, other than amotor vehicle, may request the return of the item by filing a written request with the police department, which shallbe processed in accordance with procedures adopted by the police department. (Ord. 370 § 28, 2012; Ord. 324§ 2, 2008)
8.50.050 Controlled hours of operation.
It shall be unlawful for any person to engage in the following activities at a time other than between the hours of5:00 a.m. and 10:00 p.m. on any day in the industrial (I) zone, and between the hours of 7:00 a.m. and 10:00 p.m.on any day in all other zones:
A. Operate or permit the use of powered model vehicles and planes.
B. Load or unload any vehicle, or operate or permit the use of dollies, carts, forklifts, or other wheeled equipmentthat causes any impulsive sound, raucous or unnecessary noise within 1,000 feet of a residence.
C. Operate or permit the use of domestic power tools, machinery, or any other equipment or tool in any garage,workshop, house or any other structure.
D. Operate or permit the use of gasoline or electric-powered leaf blowers such as commonly used by gardenersand other persons for cleaning lawns, yards, driveways, gutters and other property.
62
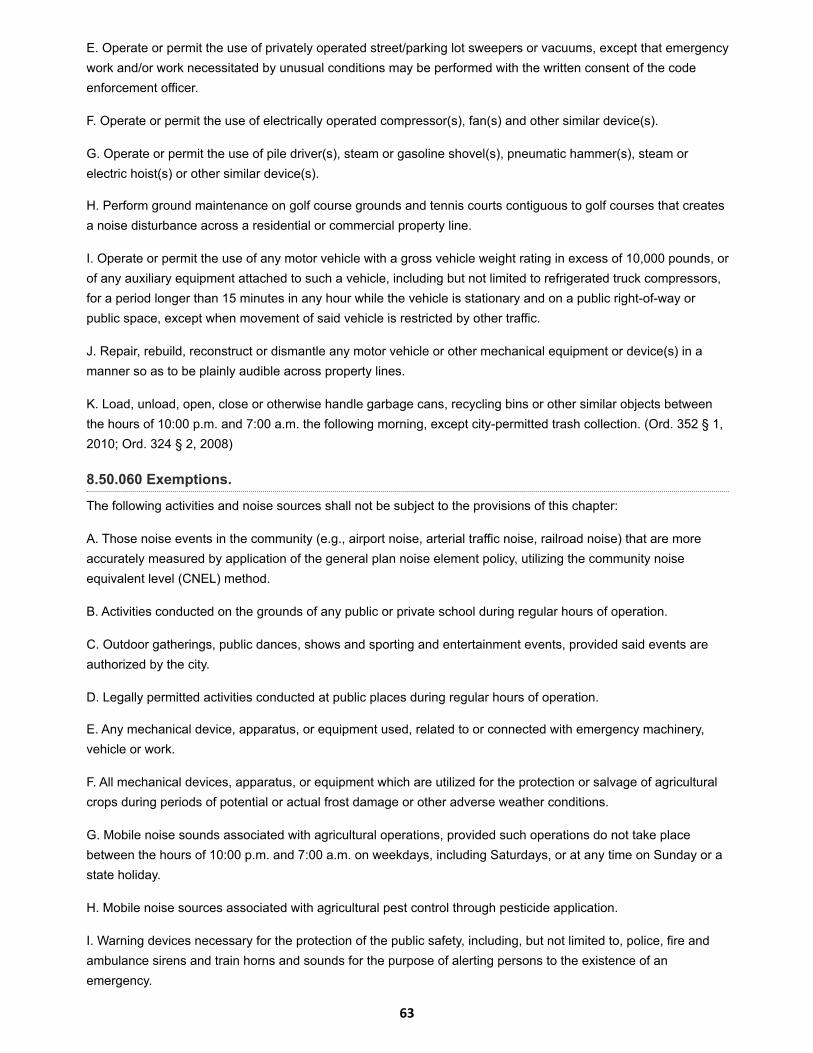
E. Operate or permit the use of privately operated street/parking lot sweepers or vacuums, except that emergencywork and/or work necessitated by unusual conditions may be performed with the written consent of the codeenforcement officer.
F. Operate or permit the use of electrically operated compressor(s), fan(s) and other similar device(s).
G. Operate or permit the use of pile driver(s), steam or gasoline shovel(s), pneumatic hammer(s), steam orelectric hoist(s) or other similar device(s).
H. Perform ground maintenance on golf course grounds and tennis courts contiguous to golf courses that createsa noise disturbance across a residential or commercial property line.
I. Operate or permit the use of any motor vehicle with a gross vehicle weight rating in excess of 10,000 pounds, orof any auxiliary equipment attached to such a vehicle, including but not limited to refrigerated truck compressors,for a period longer than 15 minutes in any hour while the vehicle is stationary and on a public right-of-way orpublic space, except when movement of said vehicle is restricted by other traffic.
J. Repair, rebuild, reconstruct or dismantle any motor vehicle or other mechanical equipment or device(s) in amanner so as to be plainly audible across property lines.
K. Load, unload, open, close or otherwise handle garbage cans, recycling bins or other similar objects betweenthe hours of 10:00 p.m. and 7:00 a.m. the following morning, except city-permitted trash collection. (Ord. 352 § 1,2010; Ord. 324 § 2, 2008)
8.50.060 Exemptions.
The following activities and noise sources shall not be subject to the provisions of this chapter:
A. Those noise events in the community (e.g., airport noise, arterial traffic noise, railroad noise) that are moreaccurately measured by application of the general plan noise element policy, utilizing the community noiseequivalent level (CNEL) method.
B. Activities conducted on the grounds of any public or private school during regular hours of operation.
C. Outdoor gatherings, public dances, shows and sporting and entertainment events, provided said events areauthorized by the city.
D. Legally permitted activities conducted at public places during regular hours of operation.
E. Any mechanical device, apparatus, or equipment used, related to or connected with emergency machinery,vehicle or work.
F. All mechanical devices, apparatus, or equipment which are utilized for the protection or salvage of agriculturalcrops during periods of potential or actual frost damage or other adverse weather conditions.
G. Mobile noise sounds associated with agricultural operations, provided such operations do not take placebetween the hours of 10:00 p.m. and 7:00 a.m. on weekdays, including Saturdays, or at any time on Sunday or astate holiday.
H. Mobile noise sources associated with agricultural pest control through pesticide application.
I. Warning devices necessary for the protection of the public safety, including, but not limited to, police, fire andambulance sirens and train horns and sounds for the purpose of alerting persons to the existence of anemergency.
63

J. Construction, repair or excavation necessary for the immediate preservation of life or property.
K. Construction, operation, maintenance and repair of equipment, apparatus or facilities of the park andrecreation department, public work projects or essential public services and facilities, including trash collectionand those of public utilities subject to the regulatory jurisdiction of the Public Utilities Commission.
L. Construction, repair or excavation work performed pursuant to a valid written agreement with the city or any ofits political subdivisions, which agreement provides for noise mitigation measures.
M. Any activity, to the extent regulation thereof has been preempted by state or federal law.
N. Any specific activity or noise source governed elsewhere in this code. Such activities include, but are notlimited to:
1. Security alarm systems (Chapter 8.04 HMC);
2. Animal noise (Chapter 6.04 HMC);
3. Loud, unruly or disorderly private parties or assemblies (Chapter 9.17 HMC). (Ord. 324 § 2, 2008)
8.50.070 Enforcement and administration.
The city manager, chief of police and/or their designees shall be responsible for administering and enforcing theprovisions of this chapter. (Ord. 324 § 2, 2008)
8.50.080 Enforcement – Interference.
No person shall interfere with, oppose, or resist any authorized person charged with the enforcement of thischapter while such person is engaged in the performance of his duty. (Ord. 324 § 3, 2008; Ord. 283 § 4, 2002.Formerly 8.50.140)
8.50.090 Violations – Notices – Abatement.
Violations of this chapter shall be prosecuted in the same manner as other violations of this code; provided,however, in the event of an initial violation of the provisions of this chapter, a written notice shall be given thealleged violator which specifies the time by which the condition shall be corrected or, where applicable, anapplication for a permit shall be received by the planning division. No complaint or further action shall be taken inthe event the cause of the violation has been removed or the condition abated or fully corrected within the timeperiod specified in the written notice. (Ord. 370 § 29, 2012; Ord. 324 § 3, 2008; Ord. 283 § 4, 2002. Formerly8.50.150)
8.50.100 Violations – Penalties.
Repealed by Ord. 370. (Ord. 324 § 3, 2008; Ord. 283 § 4, 2002. Formerly 8.50.160)
8.50.110 Violations – Notices – Service – Effect.
In the event the alleged violator cannot be located in order to serve the violation of intention to prosecute, suchnotice shall be deemed to be given upon mailing such notice by registered or certified mail to the alleged violatorat his last known address or at the place where the violation occurred, in which event the specified time period forabating the violation or applying for a variance shall commence on the date of the day following the mailing ofsuch notice. Subsequent violations of the same offense shall result in the immediate filing of a complaint. (Ord.370 § 30, 2012; Ord. 324 § 3, 2008; Ord. 283 § 4, 2002. Formerly 8.50.170)
8.50.120 Immediate threats to health and welfare.
64

A. The city manager may order an immediate halt to any sound which exposes any person, except thoseexcluded pursuant to HMC 8.50.060, to continuous sound levels in excess of those described herein. Within twodays following the issuance of any such order, the city shall apply to the appropriate court for an injunction toreplace the order.
B. No order pursuant to subsection A of this section shall be issued if the only persons exposed to sound levels inexcess of those contained herein are exposed as a result of (1) trespassing; (2) an invitation upon privateproperty by the person causing or permitting the sound; or (3) employment by the person or contractor of theperson causing or permitting the sound.
C. Any person subject to an order issued pursuant to subsection A of this section shall comply with such orderuntil (1) the sound is brought into compliance with the order, as determined by the city manager; or (2) a judicialorder has superseded the order of the city manager. (Ord. 324 § 3, 2008; Ord. 283 § 4, 2002. Formerly 8.50.180)
8.50.130 Administrative citations and costs of second and subsequent responses.
The city manager or his designee, in his/her sole discretion, may prosecute violations of this chapter through theadministrative citation process set forth in Chapter 2.56 HMC, in lieu of the criminal or nuisance abatementprocess. In the case of second and subsequent violations of this chapter, the city may assess a second responseservice fee in compliance with HMC 9.17.030 through 9.17.060, inclusive. (Ord. 324 § 4, 2008)
8.50.140 Modification, suspension and/or revocation of validly issued city permit and/or citylicense.
The violation of this chapter by any city permittee or licensee more than twice in any six-calendar-month period, inthe course of operating pursuant to a validly issued city permit and/or license, may be grounds for themodification, suspension or revocation of such license subject to normal city processes, in the discretion of thecity manager. (Ord. 324 § 4, 2008)
The Highland Municipal Code is current through Ordinance424, passed March 27, 2018.Disclaimer: The City Clerk's Office has the official version of theHighland Municipal Code. Users should contact the City Clerk'sOffice for ordinances passed subsequent to the ordinance citedabove.
65

Elder Creek Channel Improvements Noise Impact Analysis
11744-11 Noise Study
This page intentionally left blank
66

Elder Creek Channel Improvements Noise Impact Analysis
11744-11 Noise Study
APPENDIX 5.1:
STUDY AREA PHOTOS
67

Elder Creek Channel Improvements Noise Impact Analysis
11744-11 Noise Study
This page intentionally left blank
68
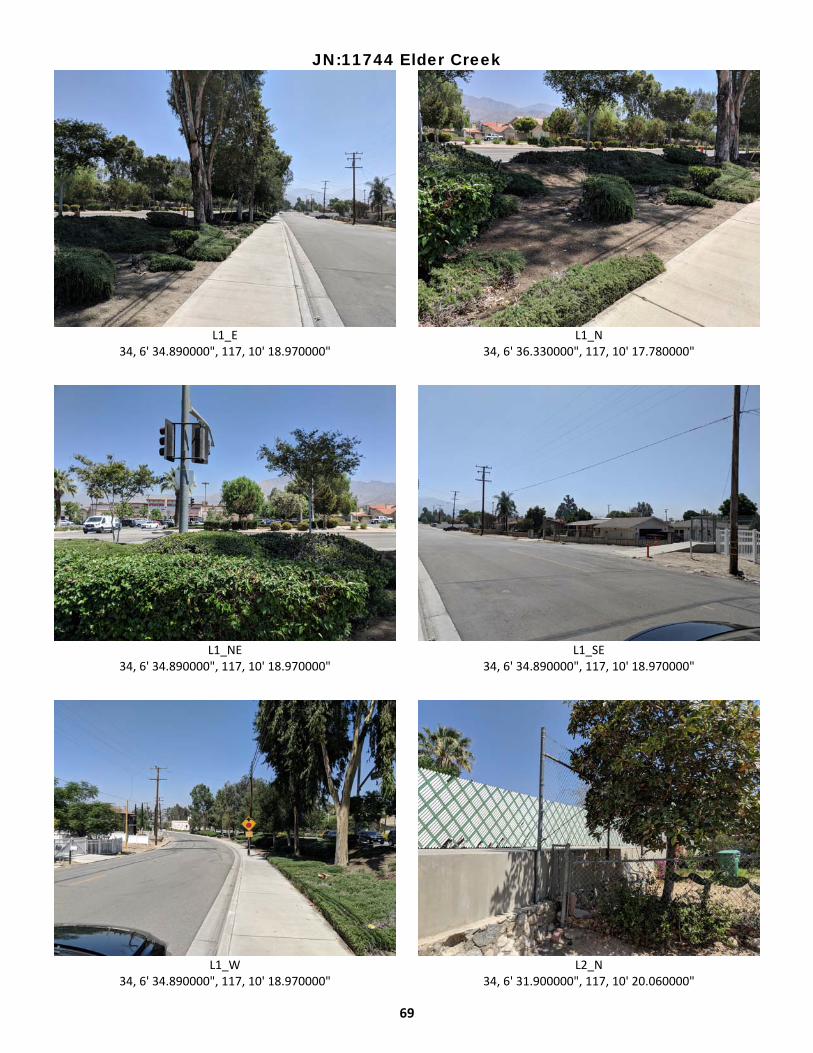
JN:11744 Elder Creek
L1_E34, 6' 34.890000", 117, 10' 18.970000"
L1_N34, 6' 36.330000", 117, 10' 17.780000"
L1_NE34, 6' 34.890000", 117, 10' 18.970000"
L1_SE34, 6' 34.890000", 117, 10' 18.970000"
L1_W34, 6' 34.890000", 117, 10' 18.970000"
L2_N34, 6' 31.900000", 117, 10' 20.060000"
69
JN:11744 Elder Creek
L2_S34, 6' 31.900000", 117, 10' 20.060000"
L3_N34, 6' 31.080000", 117, 10' 20.280000"
L3_S34, 6' 31.080000", 117, 10' 20.280000"
L3_SW34, 6' 31.080000", 117, 10' 20.280000"
L5_E34, 6' 27.000000", 117, 10' 21.830000"
L5_N34, 6' 27.000000", 117, 10' 21.830000"
70
JN:11744 Elder Creek
L5_S34, 6' 27.000000", 117, 10' 21.830000"
L5_SE34, 6' 27.000000", 117, 10' 21.830000"
L5_SW34, 6' 27.210000", 117, 10' 22.360000"
L6_E34, 6' 22.600000", 117, 10' 24.850000"
L6_N34, 6' 21.950000", 117, 10' 20.090000"
L6_S34, 6' 21.950000", 117, 10' 20.090000"
71

JN:11744 Elder Creek
L6_SW34, 6' 21.950000", 117, 10' 20.090000"
L6_W34, 6' 21.950000", 117, 10' 20.090000"
Site134, 6' 34.720000", 117, 10' 18.300000"
Site234, 6' 34.720000", 117, 10' 18.300000"
Site334, 6' 33.650000", 117, 10' 18.990000"
Site434, 6' 32.880000", 117, 10' 19.540000"
72
JN:11744 Elder Creek
Site534, 6' 32.080000", 117, 10' 19.920000"
Site634, 6' 30.330000", 117, 10' 20.870000"
Site734, 6' 30.330000", 117, 10' 20.870000"
Site834, 6' 30.330000", 117, 10' 20.870000"
Site934, 6' 30.090000", 117, 10' 21.230000"
Site1034, 6' 30.120000", 117, 10' 21.170000"
73
JN:11744 Elder Creek
Site1134, 6' 27.980000", 117, 10' 21.660000"
Site1234, 6' 27.980000", 117, 10' 21.660000"
Site1334, 6' 27.980000", 117, 10' 21.660000"
Site1434, 6' 27.980000", 117, 10' 21.660000"
74

Elder Creek Channel Improvements Noise Impact Analysis
11744-11 Noise Study
APPENDIX 5.2:
NOISE LEVEL MEASUREMENT WORKSHEETS
75

Elder Creek Channel Improvements Noise Impact Analysis
11744-11 Noise Study
This page intentionally left blank
76
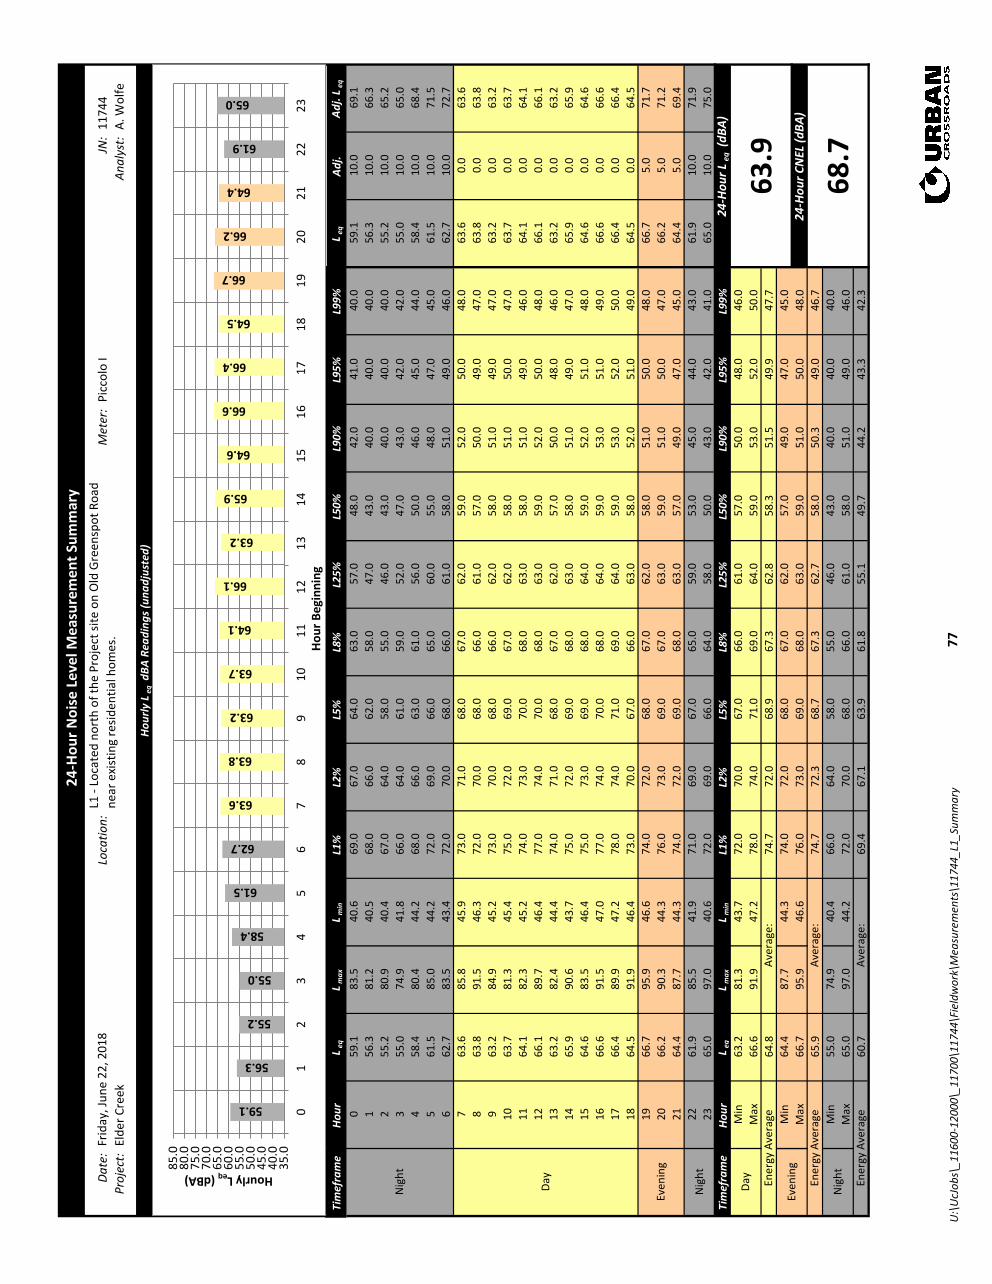
Date
:Lo
catio
n:M
eter
:Pi
ccol
o I
JN:
1174
4Pr
ojec
t:El
der C
reek
Anal
yst:
A. W
olfe
Tim
efra
me
Hour
L eq
L max
L min
L1%
L2%
L5%
L8%
L25%
L50%
L90%
L95%
L99%
L eq
Adj.
Adj.
L eq
059
.183
.540
.669
.067
.064
.063
.057
.048
.042
.041
.040
.059
.110
.069
.11
56.3
81.2
40.5
68.0
66.0
62.0
58.0
47.0
43.0
40.0
40.0
40.0
56.3
10.0
66.3
255
.280
.940
.467
.064
.058
.055
.046
.043
.040
.040
.040
.055
.210
.065
.23
55.0
74.9
41.8
66.0
64.0
61.0
59.0
52.0
47.0
43.0
42.0
42.0
55.0
10.0
65.0
458
.480
.444
.268
.066
.063
.061
.056
.050
.046
.045
.044
.058
.410
.068
.45
61.5
85.0
44.2
72.0
69.0
66.0
65.0
60.0
55.0
48.0
47.0
45.0
61.5
10.0
71.5
662
.783
.543
.472
.070
.068
.066
.061
.058
.051
.049
.046
.062
.710
.072
.77
63.6
85.8
45.9
73.0
71.0
68.0
67.0
62.0
59.0
52.0
50.0
48.0
63.6
0.0
63.6
863
.891
.546
.372
.070
.068
.066
.061
.057
.050
.049
.047
.063
.80.
063
.89
63.2
84.9
45.2
73.0
70.0
68.0
66.0
62.0
58.0
51.0
49.0
47.0
63.2
0.0
63.2
1063
.781
.345
.475
.072
.069
.067
.062
.058
.051
.050
.047
.063
.70.
063
.711
64.1
82.3
45.2
74.0
73.0
70.0
68.0
63.0
58.0
51.0
49.0
46.0
64.1
0.0
64.1
1266
.189
.746
.477
.074
.070
.068
.063
.059
.052
.050
.048
.066
.10.
066
.113
63.2
82.4
44.4
74.0
71.0
68.0
67.0
62.0
57.0
50.0
48.0
46.0
63.2
0.0
63.2
1465
.990
.643
.775
.072
.069
.068
.063
.058
.051
.049
.047
.065
.90.
065
.915
64.6
83.5
46.4
75.0
73.0
69.0
68.0
64.0
59.0
52.0
51.0
48.0
64.6
0.0
64.6
1666
.691
.547
.077
.074
.070
.068
.064
.059
.053
.051
.049
.066
.60.
066
.617
66.4
89.9
47.2
78.0
74.0
71.0
69.0
64.0
59.0
53.0
52.0
50.0
66.4
0.0
66.4
1864
.591
.946
.473
.070
.067
.066
.063
.058
.052
.051
.049
.064
.50.
064
.519
66.7
95.9
46.6
74.0
72.0
68.0
67.0
62.0
58.0
51.0
50.0
48.0
66.7
5.0
71.7
2066
.290
.344
.376
.073
.069
.067
.063
.059
.051
.050
.047
.066
.25.
071
.221
64.4
87.7
44.3
74.0
72.0
69.0
68.0
63.0
57.0
49.0
47.0
45.0
64.4
5.0
69.4
2261
.985
.541
.971
.069
.067
.065
.059
.053
.045
.044
.043
.061
.910
.071
.923
65.0
97.0
40.6
72.0
69.0
66.0
64.0
58.0
50.0
43.0
42.0
41.0
65.0
10.0
75.0
Tim
efra
me
Hour
L eq
L max
L min
L1%
L2%
L5%
L8%
L25%
L50%
L90%
L95%
L99%
Min
63.2
81.3
43.7
72.0
70.0
67.0
66.0
61.0
57.0
50.0
48.0
46.0
Max
66.6
91.9
47.2
78.0
74.0
71.0
69.0
64.0
59.0
53.0
52.0
50.0
64.8
74.7
72.0
68.9
67.3
62.8
58.3
51.5
49.9
47.7
Min
64.4
87.7
44.3
74.0
72.0
68.0
67.0
62.0
57.0
49.0
47.0
45.0
Max
66.7
95.9
46.6
76.0
73.0
69.0
68.0
63.0
59.0
51.0
50.0
48.0
65.9
74.7
72.3
68.7
67.3
62.7
58.0
50.3
49.0
46.7
Min
55.0
74.9
40.4
66.0
64.0
58.0
55.0
46.0
43.0
40.0
40.0
40.0
Max
65.0
97.0
44.2
72.0
70.0
68.0
66.0
61.0
58.0
51.0
49.0
46.0
60.7
69.4
67.1
63.9
61.8
55.1
49.7
44.2
43.3
42.3
Even
ing
L1 -
Loca
ted
nort
h of
the
Proj
ect s
ite o
n O
ld G
reen
spot
Roa
d ne
ar e
xist
ing
resid
entia
l hom
es.
24-
Hou
r Noi
se L
evel
Mea
sure
men
t Sum
mar
y
Frid
ay, J
une
22, 2
018
Hour
ly L
eq d
BA R
eadi
ngs (
unad
just
ed)
Nig
ht
Day
Nig
ht
24-H
our L
eq (d
BA)
Day
63.9
Ener
gy A
vera
geAv
erag
e:
Even
ing
24-H
our C
NEL
(dBA
)En
ergy
Ave
rage
Aver
age:
68.7
Nig
ht Ener
gy A
vera
geAv
erag
e:
59.1
56.3
55.2
55.0
58.4
61.5
62.7
63.6
63.8
63.2
63.7
64.1
66.1
63.2
65.9
64.6
66.6
66.4
64.5
66.7
66.2
64.4
61.9
65.0
35.0
40.0
45.0
50.0
55.0
60.0
65.0
70.0
75.0
80.0
85.0
01
23
45
67
89
1011
1213
1415
1617
1819
2021
2223
Hourly Leq(dBA)
Hou
r Beg
inni
ng
U:\
UcJ
obs\
_116
00-1
2000
\_11
700\
1174
4\Fi
eldw
ork\
Mea
sure
men
ts\1
1744
_L1_
Sum
mar
y77

Date
:Lo
catio
n:M
eter
:Pi
ccol
o I
JN:
1174
4Pr
ojec
t:El
der C
reek
Anal
yst:
A. W
olfe
Tim
efra
me
Hour
L eq
L max
L min
L1%
L2%
L5%
L8%
L25%
L50%
L90%
L95%
L99%
L eq
Adj.
Adj.
L eq
042
.958
.239
.448
.047
.045
.044
.043
.041
.040
.039
.039
.042
.910
.052
.91
42.2
58.5
39.4
49.0
46.0
44.0
44.0
42.0
41.0
39.0
39.0
39.0
42.2
10.0
52.2
242
.161
.339
.348
.045
.044
.043
.041
.041
.039
.039
.039
.042
.110
.052
.13
45.3
58.6
40.6
51.0
50.0
48.0
48.0
46.0
44.0
41.0
41.0
41.0
45.3
10.0
55.3
447
.056
.742
.552
.051
.050
.049
.047
.046
.044
.043
.043
.047
.010
.057
.05
47.5
60.4
41.8
53.0
51.0
50.0
49.0
48.0
46.0
44.0
43.0
42.0
47.5
10.0
57.5
646
.463
.141
.152
.051
.049
.048
.047
.045
.043
.042
.041
.046
.410
.056
.47
48.0
71.2
43.3
54.0
52.0
50.0
49.0
47.0
46.0
45.0
44.0
44.0
48.0
0.0
48.0
847
.963
.742
.556
.054
.052
.050
.047
.045
.044
.043
.043
.047
.90.
047
.99
46.8
60.8
41.1
54.0
52.0
50.0
49.0
46.0
45.0
43.0
42.0
42.0
46.8
0.0
46.8
1047
.264
.539
.457
.054
.051
.049
.046
.044
.042
.041
.039
.047
.20.
047
.211
49.2
70.3
40.4
59.0
57.0
53.0
51.0
47.0
45.0
42.0
41.0
41.0
49.2
0.0
49.2
1253
.274
.841
.364
.061
.056
.054
.050
.048
.046
.045
.042
.053
.20.
053
.213
49.1
62.6
44.5
56.0
55.0
52.0
51.0
49.0
47.0
46.0
46.0
45.0
49.1
0.0
49.1
1452
.274
.744
.859
.056
.052
.051
.049
.048
.046
.046
.045
.052
.20.
052
.215
50.7
63.7
42.2
57.0
56.0
55.0
54.0
51.0
49.0
46.0
46.0
45.0
50.7
0.0
50.7
1649
.564
.141
.158
.056
.053
.052
.049
.047
.044
.043
.042
.049
.50.
049
.517
50.7
63.2
43.3
57.0
56.0
54.0
53.0
51.0
49.0
46.0
46.0
44.0
50.7
0.0
50.7
1851
.063
.543
.159
.057
.055
.054
.051
.049
.046
.046
.044
.051
.00.
051
.019
49.2
65.6
41.1
56.0
54.0
52.0
51.0
49.0
48.0
44.0
44.0
42.0
49.2
5.0
54.2
2048
.465
.639
.457
.055
.052
.051
.048
.046
.043
.042
.041
.048
.45.
053
.421
47.4
60.3
39.1
56.0
54.0
51.0
50.0
47.0
45.0
42.0
41.0
40.0
47.4
5.0
52.4
2244
.661
.038
.753
.051
.048
.047
.044
.042
.040
.039
.039
.044
.610
.054
.623
45.4
65.9
39.4
53.0
51.0
49.0
47.0
44.0
42.0
41.0
39.0
39.0
45.4
10.0
55.4
Tim
efra
me
Hour
L eq
L max
L min
L1%
L2%
L5%
L8%
L25%
L50%
L90%
L95%
L99%
Min
46.8
60.8
39.4
54.0
52.0
50.0
49.0
46.0
44.0
42.0
41.0
39.0
Max
53.2
74.8
44.8
64.0
61.0
56.0
54.0
51.0
49.0
46.0
46.0
45.0
50.1
57.5
55.5
52.8
51.4
48.6
46.8
44.7
44.1
43.0
Min
47.4
60.3
39.1
56.0
54.0
51.0
50.0
47.0
45.0
42.0
41.0
40.0
Max
49.2
65.6
41.1
57.0
55.0
52.0
51.0
49.0
48.0
44.0
44.0
42.0
48.4
56.3
54.3
51.7
50.7
48.0
46.3
43.0
42.3
41.0
Min
42.1
56.7
38.7
48.0
45.0
44.0
43.0
41.0
41.0
39.0
39.0
39.0
Max
47.5
65.9
42.5
53.0
51.0
50.0
49.0
48.0
46.0
44.0
43.0
43.0
45.2
51.0
49.2
47.4
46.6
44.7
43.1
41.2
40.4
40.2
Ener
gy A
vera
geAv
erag
e:
53.1
Nig
ht Ener
gy A
vera
geAv
erag
e:
Nig
ht
24-H
our L
eq (d
BA)
Day
48.6
Ener
gy A
vera
geAv
erag
e:
Even
ing
24-H
our C
NEL
(dBA
)
Even
ing
L2 -
Loca
ted
at th
e ea
ster
n Pr
ojec
t site
bou
ndar
y ad
jace
nt to
ex
istin
g re
siden
tial h
omes
on
Tyle
r Str
eet.
24-
Hou
r Noi
se L
evel
Mea
sure
men
t Sum
mar
y
Frid
ay, J
une
22, 2
018
Hour
ly L
eq d
BA R
eadi
ngs (
unad
just
ed)
Nig
ht
Day
42.9
42.2
42.1
45.3
47.0
47.5
46.4
48.0
47.9
46.8
47.2
49.2
53.2
49.1
52.2
50.7
49.5
50.7
51.0
49.2
48.4
47.4
44.6
45.4
35.0
40.0
45.0
50.0
55.0
60.0
65.0
70.0
75.0
80.0
85.0
01
23
45
67
89
1011
1213
1415
1617
1819
2021
2223
Hourly Leq(dBA)
Hou
r Beg
inni
ng
U:\
UcJ
obs\
_116
00-1
2000
\_11
700\
1174
4\Fi
eldw
ork\
Mea
sure
men
ts\1
1744
_L2_
Sum
mar
y78

Date
:Lo
catio
n:M
eter
:Pi
ccol
o I
JN:
1174
4Pr
ojec
t:El
der C
reek
Anal
yst:
A. W
olfe
Tim
efra
me
Hour
L eq
L max
L min
L1%
L2%
L5%
L8%
L25%
L50%
L90%
L95%
L99%
L eq
Adj.
Adj.
L eq
039
.858
.036
.346
.044
.042
.041
.039
.038
.036
.036
.036
.039
.810
.049
.81
39.3
54.4
36.3
46.0
43.0
42.0
41.0
39.0
38.0
36.0
36.0
36.0
39.3
10.0
49.3
239
.557
.936
.247
.044
.042
.040
.039
.038
.036
.036
.036
.039
.510
.049
.53
43.0
57.7
37.8
48.0
47.0
46.0
45.0
43.0
42.0
39.0
38.0
38.0
43.0
10.0
53.0
441
.356
.336
.350
.047
.044
.043
.041
.039
.038
.038
.036
.041
.310
.051
.35
50.4
67.2
39.1
61.0
59.0
57.0
56.0
46.0
44.0
41.0
41.0
40.0
50.4
10.0
60.4
644
.964
.138
.155
.052
.047
.046
.044
.042
.040
.039
.039
.044
.910
.054
.97
49.5
69.9
41.4
61.0
58.0
54.0
52.0
47.0
44.0
43.0
43.0
42.0
49.5
0.0
49.5
846
.368
.440
.156
.053
.049
.048
.044
.043
.041
.041
.041
.046
.30.
046
.39
44.9
61.9
38.9
54.0
51.0
48.0
46.0
44.0
42.0
41.0
40.0
39.0
44.9
0.0
44.9
1047
.266
.337
.760
.058
.050
.048
.043
.041
.039
.039
.038
.047
.20.
047
.211
45.2
65.9
37.9
55.0
51.0
48.0
47.0
43.0
41.0
39.0
39.0
38.0
45.2
0.0
45.2
1246
.061
.838
.155
.054
.051
.049
.045
.042
.040
.039
.039
.046
.00.
046
.013
43.4
60.4
37.6
52.0
50.0
47.0
46.0
42.0
41.0
39.0
39.0
38.0
43.4
0.0
43.4
1446
.268
.037
.956
.052
.048
.046
.043
.041
.039
.039
.038
.046
.20.
046
.215
44.5
57.2
37.9
51.0
50.0
49.0
48.0
45.0
42.0
39.0
38.0
38.0
44.5
0.0
44.5
1645
.660
.538
.155
.054
.050
.049
.044
.042
.040
.039
.039
.045
.60.
045
.617
46.6
61.1
39.8
55.0
53.0
51.0
49.0
46.0
44.0
42.0
42.0
41.0
46.6
0.0
46.6
1848
.473
.540
.856
.055
.053
.051
.047
.045
.043
.042
.041
.048
.40.
048
.419
45.6
63.8
38.5
53.0
52.0
49.0
48.0
45.0
44.0
41.0
40.0
40.0
45.6
5.0
50.6
2044
.963
.538
.053
.051
.049
.047
.044
.042
.039
.039
.038
.044
.95.
049
.921
43.4
58.0
36.3
52.0
50.0
48.0
46.0
42.0
41.0
39.0
38.0
38.0
43.4
5.0
48.4
2241
.259
.936
.349
.046
.044
.043
.041
.039
.038
.037
.036
.041
.210
.051
.223
43.2
70.5
36.3
51.0
48.0
44.0
43.0
40.0
39.0
37.0
36.0
36.0
43.2
10.0
53.2
Tim
efra
me
Hour
L eq
L max
L min
L1%
L2%
L5%
L8%
L25%
L50%
L90%
L95%
L99%
Min
43.4
57.2
37.6
51.0
50.0
47.0
46.0
42.0
41.0
39.0
38.0
38.0
Max
49.5
73.5
41.4
61.0
58.0
54.0
52.0
47.0
45.0
43.0
43.0
42.0
46.5
55.5
53.3
49.8
48.3
44.4
42.3
40.4
40.0
39.3
Min
43.4
58.0
36.3
52.0
50.0
48.0
46.0
42.0
41.0
39.0
38.0
38.0
Max
45.6
63.8
38.5
53.0
52.0
49.0
48.0
45.0
44.0
41.0
40.0
40.0
44.7
52.7
51.0
48.7
47.0
43.7
42.3
39.7
39.0
38.7
Min
39.3
54.4
36.2
46.0
43.0
42.0
40.0
39.0
38.0
36.0
36.0
36.0
Max
50.4
70.5
39.1
61.0
59.0
57.0
56.0
46.0
44.0
41.0
41.0
40.0
44.2
50.3
47.8
45.3
44.2
41.3
39.9
37.9
37.4
37.0
Even
ing
L3 -
Loca
ted
at th
e ea
ster
n Pr
ojec
t site
bou
ndar
y ad
jace
nt to
ex
istin
g re
siden
tial h
omes
on
Tyle
r Str
eet.
24-
Hou
r Noi
se L
evel
Mea
sure
men
t Sum
mar
y
Frid
ay, J
une
22, 2
018
Hour
ly L
eq d
BA R
eadi
ngs (
unad
just
ed)
Nig
ht
Day
Nig
ht
24-H
our L
eq (d
BA)
Day
45.5
Ener
gy A
vera
geAv
erag
e:
Even
ing
24-H
our C
NEL
(dBA
)En
ergy
Ave
rage
Aver
age:
51.2
Nig
ht Ener
gy A
vera
geAv
erag
e:
39.8
39.3
39.5
43.0
41.3
50.4
44.9
49.5
46.3
44.9
47.2
45.2
46.0
43.4
46.2
44.5
45.6
46.6
48.4
45.6
44.9
43.4
41.2
43.2
35.0
40.0
45.0
50.0
55.0
60.0
65.0
70.0
75.0
80.0
85.0
01
23
45
67
89
1011
1213
1415
1617
1819
2021
2223
Hourly Leq(dBA)
Hou
r Beg
inni
ng
U:\
UcJ
obs\
_116
00-1
2000
\_11
700\
1174
4\Fi
eldw
ork\
Mea
sure
men
ts\1
1744
_L3_
Sum
mar
y79

Date
:Lo
catio
n:M
eter
:Pi
ccol
o I
JN:
1174
4Pr
ojec
t:El
der C
reek
Anal
yst:
A. W
olfe
Tim
efra
me
Hour
L eq
L max
L min
L1%
L2%
L5%
L8%
L25%
L50%
L90%
L95%
L99%
L eq
Adj.
Adj.
L eq
045
.465
.839
.153
.051
.048
.047
.045
.042
.040
.039
.039
.045
.410
.055
.41
46.6
66.9
39.1
58.0
56.0
50.0
47.0
44.0
42.0
39.0
39.0
39.0
46.6
10.0
56.6
245
.166
.439
.155
.051
.048
.047
.044
.042
.040
.039
.039
.045
.110
.055
.13
47.1
61.4
41.0
54.0
52.0
50.0
49.0
47.0
46.0
43.0
42.0
42.0
47.1
10.0
57.1
449
.158
.643
.954
.054
.052
.051
.049
.048
.045
.045
.044
.049
.110
.059
.15
51.1
68.3
41.0
59.0
57.0
54.0
53.0
50.0
49.0
46.0
45.0
44.0
51.1
10.0
61.1
650
.263
.843
.058
.056
.054
.052
.050
.048
.045
.044
.043
.050
.210
.060
.27
50.8
65.4
46.2
59.0
56.0
53.0
52.0
50.0
49.0
47.0
47.0
46.0
50.8
0.0
50.8
849
.661
.644
.656
.055
.052
.051
.049
.048
.046
.046
.045
.049
.60.
049
.69
49.5
65.9
42.6
58.0
55.0
52.0
51.0
49.0
48.0
45.0
45.0
43.0
49.5
0.0
49.5
1048
.764
.940
.956
.055
.052
.051
.048
.047
.044
.043
.042
.048
.70.
048
.711
49.6
67.9
40.6
58.0
56.0
53.0
52.0
49.0
47.0
44.0
43.0
42.0
49.6
0.0
49.6
1252
.271
.840
.862
.059
.056
.054
.050
.048
.044
.044
.042
.052
.20.
052
.213
48.4
64.0
39.2
56.0
54.0
51.0
51.0
48.0
46.0
43.0
42.0
41.0
48.4
0.0
48.4
1450
.068
.840
.958
.056
.054
.052
.049
.047
.044
.043
.042
.050
.00.
050
.015
49.4
66.2
40.8
57.0
55.0
53.0
52.0
49.0
47.0
44.0
43.0
42.0
49.4
0.0
49.4
1650
.562
.742
.257
.056
.054
.053
.050
.049
.046
.045
.044
.050
.50.
050
.517
51.3
67.3
43.2
59.0
57.0
54.0
53.0
51.0
49.0
47.0
46.0
44.0
51.3
0.0
51.3
1851
.864
.943
.760
.059
.056
.055
.051
.050
.047
.046
.045
.051
.80.
051
.819
51.2
68.6
41.7
60.0
58.0
55.0
53.0
51.0
49.0
45.0
45.0
43.0
51.2
5.0
56.2
2052
.070
.542
.062
.059
.056
.054
.051
.048
.045
.044
.043
.052
.05.
057
.021
50.4
68.7
40.8
60.0
58.0
55.0
53.0
50.0
47.0
44.0
43.0
42.0
50.4
5.0
55.4
2250
.668
.039
.262
.060
.056
.053
.048
.045
.042
.041
.039
.050
.610
.060
.623
49.7
69.3
38.8
62.0
59.0
54.0
51.0
47.0
44.0
40.0
39.0
39.0
49.7
10.0
59.7
Tim
efra
me
Hour
L eq
L max
L min
L1%
L2%
L5%
L8%
L25%
L50%
L90%
L95%
L99%
Min
48.4
61.6
39.2
56.0
54.0
51.0
51.0
48.0
46.0
43.0
42.0
41.0
Max
52.2
71.8
46.2
62.0
59.0
56.0
55.0
51.0
50.0
47.0
47.0
46.0
50.3
58.0
56.1
53.3
52.3
49.4
47.9
45.1
44.4
43.2
Min
50.4
68.6
40.8
60.0
58.0
55.0
53.0
50.0
47.0
44.0
43.0
42.0
Max
52.0
70.5
42.0
62.0
59.0
56.0
54.0
51.0
49.0
45.0
45.0
43.0
51.2
60.7
58.3
55.3
53.3
50.7
48.0
44.7
44.0
42.7
Min
45.1
58.6
38.8
53.0
51.0
48.0
47.0
44.0
42.0
39.0
39.0
39.0
Max
51.1
69.3
43.9
62.0
60.0
56.0
53.0
50.0
49.0
46.0
45.0
44.0
48.8
57.2
55.1
51.8
50.0
47.1
45.1
42.2
41.4
40.9
Ener
gy A
vera
geAv
erag
e:
55.9
Nig
ht Ener
gy A
vera
geAv
erag
e:
Nig
ht
24-H
our L
eq (d
BA)
Day
50.0
Ener
gy A
vera
geAv
erag
e:
Even
ing
24-H
our C
NEL
(dBA
)
Even
ing
L4 -
Loca
ted
wes
t of t
he P
roje
ct si
te o
n Ch
urch
Str
eet n
ear
vaca
nt la
nd a
nd e
xist
ing
resid
entia
l hom
es.
24-
Hou
r Noi
se L
evel
Mea
sure
men
t Sum
mar
y
Frid
ay, J
une
22, 2
018
Hour
ly L
eq d
BA R
eadi
ngs (
unad
just
ed)
Nig
ht
Day
45.4
46.6
45.1
47.1
49.1
51.1
50.2
50.8
49.6
49.5
48.7
49.6
52.2
48.4
50.0
49.4
50.5
51.3
51.8
51.2
52.0
50.4
50.6
49.7
35.0
40.0
45.0
50.0
55.0
60.0
65.0
70.0
75.0
80.0
85.0
01
23
45
67
89
1011
1213
1415
1617
1819
2021
2223
Hourly Leq(dBA)
Hou
r Beg
inni
ng
U:\
UcJ
obs\
_116
00-1
2000
\_11
700\
1174
4\Fi
eldw
ork\
Mea
sure
men
ts\1
1744
_L4_
Sum
mar
y80

Date
:Lo
catio
n:M
eter
:Pi
ccol
o I
JN:
1174
4Pr
ojec
t:El
der C
reek
Anal
yst:
A. W
olfe
Tim
efra
me
Hour
L eq
L max
L min
L1%
L2%
L5%
L8%
L25%
L50%
L90%
L95%
L99%
L eq
Adj.
Adj.
L eq
045
.858
.843
.051
.049
.047
.047
.045
.045
.044
.043
.043
.045
.810
.055
.81
45.3
56.2
42.8
50.0
49.0
47.0
46.0
45.0
44.0
43.0
43.0
43.0
45.3
10.0
55.3
246
.162
.542
.750
.049
.048
.047
.046
.045
.044
.043
.043
.046
.110
.056
.13
49.2
62.0
44.7
55.0
53.0
52.0
51.0
49.0
48.0
46.0
45.0
45.0
49.2
10.0
59.2
451
.162
.346
.056
.055
.053
.053
.051
.050
.048
.048
.047
.051
.110
.061
.15
52.7
70.7
44.4
61.0
58.0
56.0
55.0
52.0
50.0
47.0
46.0
45.0
52.7
10.0
62.7
652
.173
.344
.062
.059
.055
.054
.050
.048
.046
.046
.045
.052
.110
.062
.17
51.2
69.0
46.4
58.0
55.0
53.0
52.0
50.0
49.0
48.0
48.0
47.0
51.2
0.0
51.2
852
.074
.045
.361
.058
.055
.053
.050
.049
.047
.046
.046
.052
.00.
052
.09
50.3
70.4
43.1
58.0
56.0
54.0
53.0
49.0
47.0
45.0
45.0
44.0
50.3
0.0
50.3
1052
.272
.841
.364
.060
.054
.052
.049
.046
.044
.043
.042
.052
.20.
052
.211
50.7
68.8
41.9
61.0
58.0
54.0
53.0
49.0
46.0
44.0
43.0
43.0
50.7
0.0
50.7
1257
.481
.540
.868
.065
.059
.056
.049
.047
.044
.043
.042
.057
.40.
057
.413
54.2
79.2
40.8
66.0
63.0
58.0
56.0
50.0
46.0
43.0
42.0
41.0
54.2
0.0
54.2
1450
.673
.240
.961
.058
.054
.051
.048
.046
.043
.042
.042
.050
.60.
050
.615
50.5
73.0
41.4
60.0
56.0
52.0
51.0
48.0
46.0
43.0
43.0
42.0
50.5
0.0
50.5
1651
.275
.741
.961
.059
.054
.052
.049
.048
.045
.044
.043
.051
.20.
051
.217
51.2
69.0
44.9
58.0
56.0
54.0
53.0
51.0
49.0
47.0
46.0
46.0
51.2
0.0
51.2
1852
.568
.044
.962
.059
.056
.054
.051
.050
.048
.047
.046
.052
.50.
052
.519
51.2
71.8
44.0
59.0
57.0
55.0
53.0
50.0
49.0
46.0
46.0
45.0
51.2
5.0
56.2
2051
.667
.244
.459
.058
.056
.055
.051
.049
.046
.045
.045
.051
.65.
056
.621
49.2
66.9
43.4
57.0
55.0
53.0
51.0
48.0
46.0
45.0
44.0
44.0
49.2
5.0
54.2
2247
.360
.142
.755
.053
.051
.049
.047
.045
.044
.044
.043
.047
.310
.057
.323
47.1
63.6
42.1
55.0
54.0
51.0
49.0
46.0
45.0
43.0
43.0
42.0
47.1
10.0
57.1
Tim
efra
me
Hour
L eq
L max
L min
L1%
L2%
L5%
L8%
L25%
L50%
L90%
L95%
L99%
Min
50.3
68.0
40.8
58.0
55.0
52.0
51.0
48.0
46.0
43.0
42.0
41.0
Max
57.4
81.5
46.4
68.0
65.0
59.0
56.0
51.0
50.0
48.0
48.0
47.0
52.6
61.5
58.6
54.8
53.0
49.4
47.4
45.1
44.3
43.7
Min
49.2
66.9
43.4
57.0
55.0
53.0
51.0
48.0
46.0
45.0
44.0
44.0
Max
51.6
71.8
44.4
59.0
58.0
56.0
55.0
51.0
49.0
46.0
46.0
45.0
50.8
58.3
56.7
54.7
53.0
49.7
48.0
45.7
45.0
44.7
Min
45.3
56.2
42.1
50.0
49.0
47.0
46.0
45.0
44.0
43.0
43.0
42.0
Max
52.7
73.3
46.0
62.0
59.0
56.0
55.0
52.0
50.0
48.0
48.0
47.0
49.4
55.0
53.2
51.1
50.1
47.9
46.7
45.0
44.6
44.0
Even
ing
L5 -
Loca
ted
on M
erris
Str
eet w
ithin
the
Proj
ect s
ite
boun
darie
s adj
acen
t to
exis
ting
resi
dent
ial h
omes
and
co
mm
erci
al u
ses.
24-
Hou
r Noi
se L
evel
Mea
sure
men
t Sum
mar
y
Frid
ay, J
une
22, 2
018
Hour
ly L
eq d
BA R
eadi
ngs (
unad
just
ed)
Nig
ht
Day
Nig
ht
24-H
our L
eq (d
BA)
Day
51.4
Ener
gy A
vera
geAv
erag
e:
Even
ing
24-H
our C
NEL
(dBA
)En
ergy
Ave
rage
Aver
age:
56.6
Nig
ht Ener
gy A
vera
geAv
erag
e:
45.8
45.3
46.1
49.2
51.1
52.7
52.1
51.2
52.0
50.3
52.2
50.7
57.4
54.2
50.6
50.5
51.2
51.2
52.5
51.2
51.6
49.2
47.3
47.1
35.0
40.0
45.0
50.0
55.0
60.0
65.0
70.0
75.0
80.0
85.0
01
23
45
67
89
1011
1213
1415
1617
1819
2021
2223
Hourly Leq(dBA)
Hou
r Beg
inni
ng
U:\
UcJ
obs\
_116
00-1
2000
\_11
700\
1174
4\Fi
eldw
ork\
Mea
sure
men
ts\1
1744
_L5_
Sum
mar
y81

Date
:Lo
catio
n:M
eter
:Pi
ccol
o I
JN:
1174
4Pr
ojec
t:El
der C
reek
Anal
yst:
A. W
olfe
Tim
efra
me
Hour
L eq
L max
L min
L1%
L2%
L5%
L8%
L25%
L50%
L90%
L95%
L99%
L eq
Adj.
Adj.
L eq
049
.961
.639
.959
.058
.056
.056
.045
.042
.040
.040
.040
.049
.910
.059
.91
47.9
55.7
40.8
51.0
50.0
50.0
49.0
48.0
47.0
45.0
44.0
42.0
47.9
10.0
57.9
247
.656
.743
.653
.052
.051
.050
.047
.046
.044
.044
.043
.047
.610
.057
.63
47.4
55.0
43.6
52.0
51.0
50.0
49.0
47.0
46.0
45.0
44.0
43.0
47.4
10.0
57.4
448
.858
.343
.654
.053
.052
.051
.049
.047
.045
.044
.043
.048
.810
.058
.85
48.3
61.2
43.5
53.0
52.0
51.0
50.0
49.0
47.0
44.0
44.0
43.0
48.3
10.0
58.3
647
.866
.943
.554
.052
.051
.050
.047
.046
.045
.045
.044
.047
.810
.057
.87
46.9
61.0
42.4
54.0
52.0
51.0
50.0
46.0
44.0
43.0
43.0
43.0
46.9
0.0
46.9
845
.765
.242
.253
.051
.048
.046
.045
.044
.042
.042
.042
.045
.70.
045
.79
43.9
58.1
40.6
49.0
48.0
46.0
45.0
44.0
43.0
41.0
40.0
40.0
43.9
0.0
43.9
1044
.068
.438
.150
.048
.045
.044
.042
.041
.040
.040
.040
.044
.00.
044
.011
44.6
64.2
38.0
55.0
50.0
46.0
45.0
43.0
42.0
40.0
40.0
40.0
44.6
0.0
44.6
1243
.961
.037
.852
.050
.047
.046
.043
.042
.040
.040
.040
.043
.90.
043
.913
42.6
63.5
37.8
50.0
47.0
45.0
43.0
41.0
40.0
37.0
37.0
37.0
42.6
0.0
42.6
1446
.771
.537
.856
.053
.048
.046
.042
.041
.040
.038
.037
.046
.70.
046
.715
42.2
56.7
37.8
49.0
46.0
45.0
44.0
42.0
40.0
40.0
38.0
37.0
42.2
0.0
42.2
1645
.460
.837
.855
.053
.049
.047
.044
.043
.040
.040
.040
.045
.40.
045
.417
45.8
62.3
40.7
52.0
51.0
49.0
47.0
45.0
44.0
42.0
42.0
41.0
45.8
0.0
45.8
1847
.463
.540
.755
.054
.050
.049
.046
.045
.043
.042
.041
.047
.40.
047
.419
51.0
65.7
40.6
63.0
63.0
55.0
52.0
47.0
45.0
42.0
41.0
40.0
51.0
5.0
56.0
2061
.771
.742
.470
.070
.069
.067
.060
.052
.047
.046
.044
.061
.75.
066
.721
54.3
62.4
41.0
60.0
60.0
59.0
58.0
54.0
53.0
51.0
47.0
44.0
54.3
5.0
59.3
2247
.760
.240
.756
.055
.054
.051
.047
.044
.042
.042
.040
.047
.710
.057
.723
42.8
54.4
39.3
47.0
45.0
44.0
44.0
43.0
42.0
40.0
40.0
40.0
42.8
10.0
52.8
Tim
efra
me
Hour
L eq
L max
L min
L1%
L2%
L5%
L8%
L25%
L50%
L90%
L95%
L99%
Min
42.2
56.7
37.8
49.0
46.0
45.0
43.0
41.0
40.0
37.0
37.0
37.0
Max
47.4
71.5
42.4
56.0
54.0
51.0
50.0
46.0
45.0
43.0
43.0
43.0
45.2
52.5
50.3
47.4
46.0
43.6
42.4
40.7
40.2
39.8
Min
51.0
62.4
40.6
60.0
60.0
55.0
52.0
47.0
45.0
42.0
41.0
40.0
Max
61.7
71.7
42.4
70.0
70.0
69.0
67.0
60.0
53.0
51.0
47.0
44.0
58.0
64.3
64.3
61.0
59.0
53.7
50.0
46.7
44.7
42.7
Min
42.8
54.4
39.3
47.0
45.0
44.0
44.0
43.0
42.0
40.0
40.0
40.0
Max
49.9
66.9
43.6
59.0
58.0
56.0
56.0
49.0
47.0
45.0
45.0
44.0
47.9
53.2
52.0
51.0
50.0
46.9
45.2
43.3
43.0
42.0
Ener
gy A
vera
geAv
erag
e:
56.9
Nig
ht Ener
gy A
vera
geAv
erag
e:
Nig
ht
24-H
our L
eq (d
BA)
Day
50.7
Ener
gy A
vera
geAv
erag
e:
Even
ing
24-H
our C
NEL
(dBA
)
Even
ing
L6 -
Loca
ted
on A
bbey
Way
adj
acen
t to
the
Proj
ect s
ite n
ear
exist
ing
vaca
nt la
nd.
24-
Hou
r Noi
se L
evel
Mea
sure
men
t Sum
mar
y
Frid
ay, J
une
22, 2
018
Hour
ly L
eq d
BA R
eadi
ngs (
unad
just
ed)
Nig
ht
Day
49.9
47.9
47.6
47.4
48.8
48.3
47.8
46.9
45.7
43.9
44.0
44.6
43.9
42.6
46.7
42.2
45.4
45.8
47.4
51.0
61.7
54.3
47.7
42.8
35.0
40.0
45.0
50.0
55.0
60.0
65.0
70.0
75.0
80.0
85.0
01
23
45
67
89
1011
1213
1415
1617
1819
2021
2223
Hourly Leq(dBA)
Hou
r Beg
inni
ng
U:\
UcJ
obs\
_116
00-1
2000
\_11
700\
1174
4\Fi
eldw
ork\
Mea
sure
men
ts\1
1744
_L6_
Sum
mar
y82

Elder Creek Channel Improvements Noise Impact Analysis
11744-11 Noise Study
APPENDIX 7.1:
RCNM EQUIPMENT DATABASE
83

Elder Creek Channel Improvements Noise Impact Analysis
11744-11 Noise Study
This page intentionally left blank
84

FHWA Roadway Construction Noise Model User’s Guide
Final Report January 2006
U.S. Department of Transportation Federal Highway Administration
FHWA-HEP-05-054 DOT-VNTSC-FHWA-05-01
Prepared for U.S. Department of Transportation Federal Highway Administration Office of Natural and Human Environment Washington, DC 20590
Prepared by U.S. Department of Transportation Research and Innovative Technology Administration John A. Volpe National Transportation Systems Center Acoustics Facility Cambridge, MA 02142
85

RCNM User’s Guide Construction Noise Prediction
3
Table 1. CA/T equipment noise emissions and acoustical usage factors database. CA/T Noise Emission Reference Levels and Usage Factors filename: EQUIPLST.xls revised: 7/26/05 Acoustical Spec 721.560 Actual Measured No. of Actual
Impact Use Factor Lmax @ 50ft Lmax @ 50ft Data SamplesEquipment Description Device ? ( % ) (dBA, slow) (dBA, slow) (Count)
(samples averaged) All Other Equipment > 5 HP No 50 85 -- N/A -- 0 Auger Drill Rig No 20 85 84 36 Backhoe No 40 80 78 372 Bar Bender No 20 80 -- N/A -- 0 Blasting Yes -- N/A -- 94 -- N/A -- 0 Boring Jack Power Unit No 50 80 83 1 Chain Saw No 20 85 84 46 Clam Shovel (dropping) Yes 20 93 87 4 Compactor (ground) No 20 80 83 57 Compressor (air) No 40 80 78 18 Concrete Batch Plant No 15 83 -- N/A -- 0 Concrete Mixer Truck No 40 85 79 40 Concrete Pump Truck No 20 82 81 30 Concrete Saw No 20 90 90 55 Crane No 16 85 81 405 Dozer No 40 85 82 55 Drill Rig Truck No 20 84 79 22 Drum Mixer No 50 80 80 1 Dump Truck No 40 84 76 31 Excavator No 40 85 81 170 Flat Bed Truck No 40 84 74 4 Front End Loader No 40 80 79 96 Generator No 50 82 81 19 Generator (<25KVA, VMS signs) No 50 70 73 74 Gradall No 40 85 83 70 Grader No 40 85 -- N/A -- 0 Grapple (on backhoe) No 40 85 87 1 Horizontal Boring Hydr. Jack No 25 80 82 6 Hydra Break Ram Yes 10 90 -- N/A -- 0 Impact Pile Driver Yes 20 95 101 11 Jackhammer Yes 20 85 89 133 Man Lift No 20 85 75 23 Mounted Impact Hammer (hoe ram) Yes 20 90 90 212 Pavement Scarafier No 20 85 90 2 Paver No 50 85 77 9 Pickup Truck No 40 55 75 1 Pneumatic Tools No 50 85 85 90 Pumps No 50 77 81 17 Refrigerator Unit No 100 82 73 3 Rivit Buster/chipping gun Yes 20 85 79 19 Rock Drill No 20 85 81 3 Roller No 20 85 80 16 Sand Blasting No 20 85 96 9 Scraper No 40 85 84 12 Shears (on backhoe) No 40 85 96 5 Slurry Plant No 100 78 78 1 Slurry Trenching Machine No 50 82 80 75 Soil Mix Drill Rig No 50 80 -- N/A -- 0 Tractor No 40 84 -- N/A -- 0 Vacuum Excavator (Vac-truck) No 40 85 85 149 Vacuum Street Sweeper No 10 80 82 19 Ventilation Fan No 100 85 79 13 Vibrating Hopper No 50 85 87 1 Vibratory Concrete Mixer No 20 80 80 1 Vibratory Pile Driver No 20 95 101 44 Warning Horn No 5 85 83 12 Welder / Torch No 40 73 74 5
(Single Nozzle)
86
Elder Creek Channel Improvements Noise Impact Analysis
11744-11 Noise Study
APPENDIX 7.2:
TEMPORARY NOISE BARRIER ATTENUATION CALCULATIONS
87

Elder Creek Channel Improvements Noise Impact Analysis
11744-11 Noise Study
This page intentionally left blank
88
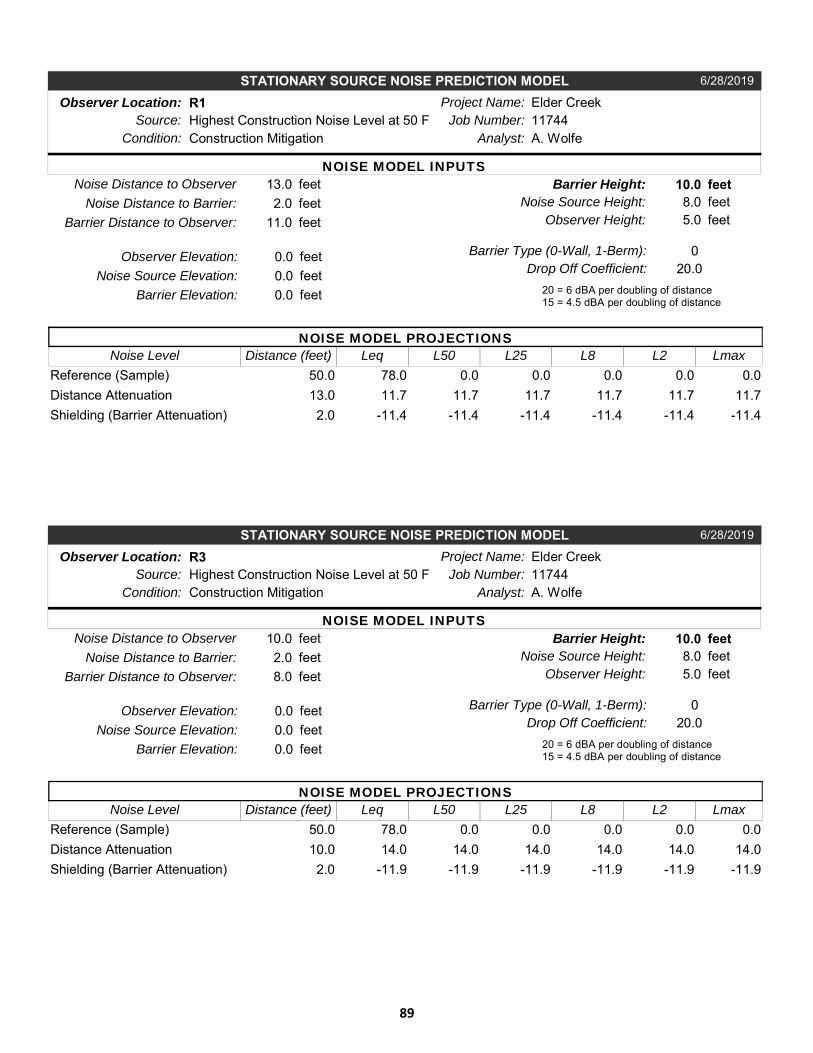
Project Name: Elder CreekJob Number: 11744
Analyst: A. WolfeSource: Highest Construction Noise Level at 50 F
2.0
NOISE MODEL INPUTS
Noise Distance to Barrier:
13.0Noise Distance to Observer
feetfeet
Noise Source Elevation: 0.0Observer Elevation: 0.0 feet
feet
Barrier Height: 10.0Noise Source Height: 8.0 feet
feet
Drop Off Coefficient: 20.020 = 6 dBA per doubling of distance15 = 4.5 dBA per doubling of distance
11.0Barrier Distance to Observer: feet
Barrier Type (0-Wall, 1-Berm): 0
Leq LmaxL50
0.00.0L25
0.0L2
0.0L8
0.078.0Noise Level
NOISE MODEL PROJECTIONSDistance (feet)
50.0Reference (Sample)11.711.7 11.7 11.711.711.713.0Distance Attenuation
2.0Shielding (Barrier Attenuation) -11.4-11.4 -11.4 -11.4-11.4-11.4
Observer Height: 5.0 feet
Observer Location: R1
Condition: Construction Mitigation
Barrier Elevation: 0.0 feet
STATIONARY SOURCE NOISE PREDICTION MODEL 6/28/2019
Project Name: Elder CreekJob Number: 11744
Analyst: A. WolfeSource: Highest Construction Noise Level at 50 F
2.0
NOISE MODEL INPUTS
Noise Distance to Barrier:
10.0Noise Distance to Observer
feetfeet
Noise Source Elevation: 0.0Observer Elevation: 0.0 feet
feet
Barrier Height: 10.0Noise Source Height: 8.0 feet
feet
Drop Off Coefficient: 20.020 = 6 dBA per doubling of distance15 = 4.5 dBA per doubling of distance
8.0Barrier Distance to Observer: feet
Barrier Type (0-Wall, 1-Berm): 0
Leq LmaxL50
0.00.0L25
0.0L2
0.0L8
0.078.0Noise Level
NOISE MODEL PROJECTIONSDistance (feet)
50.0Reference (Sample)14.014.0 14.0 14.014.014.010.0Distance Attenuation
2.0Shielding (Barrier Attenuation) -11.9-11.9 -11.9 -11.9-11.9-11.9
Observer Height: 5.0 feet
Observer Location: R3
Condition: Construction Mitigation
Barrier Elevation: 0.0 feet
STATIONARY SOURCE NOISE PREDICTION MODEL 6/28/2019
89
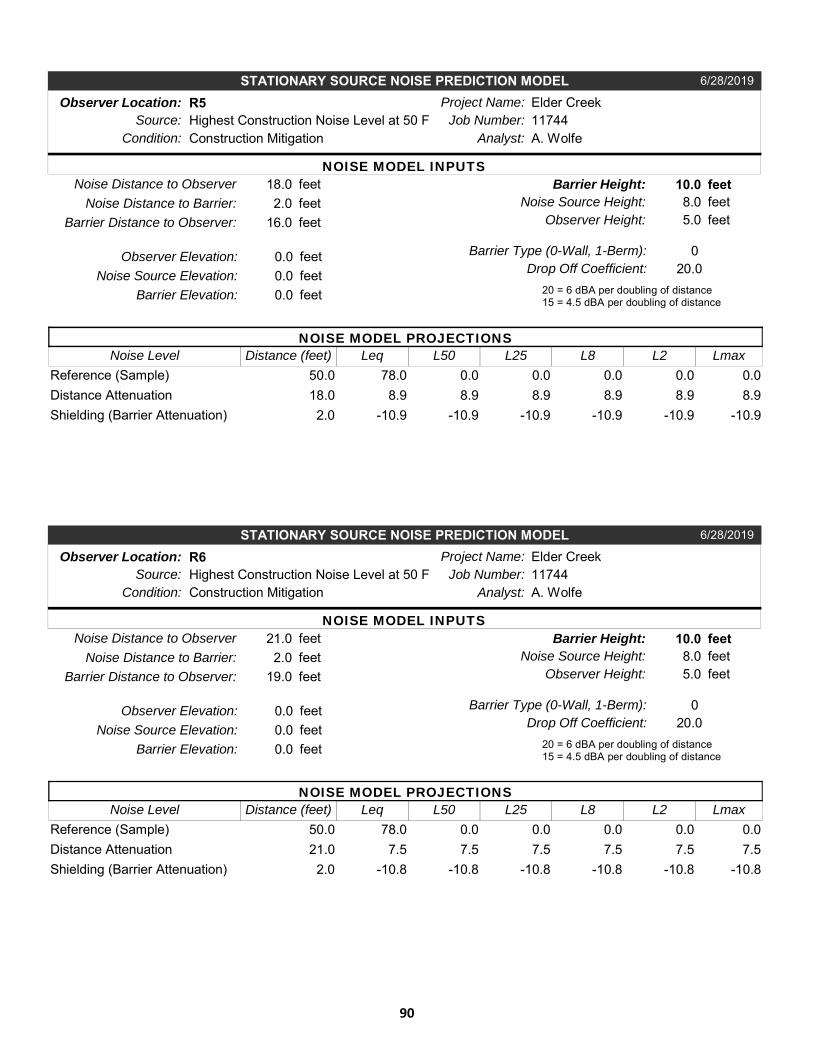
Project Name: Elder CreekJob Number: 11744
Analyst: A. WolfeSource: Highest Construction Noise Level at 50 F
2.0
NOISE MODEL INPUTS
Noise Distance to Barrier:
18.0Noise Distance to Observer
feetfeet
Noise Source Elevation: 0.0Observer Elevation: 0.0 feet
feet
Barrier Height: 10.0Noise Source Height: 8.0 feet
feet
Drop Off Coefficient: 20.020 = 6 dBA per doubling of distance15 = 4.5 dBA per doubling of distance
16.0Barrier Distance to Observer: feet
Barrier Type (0-Wall, 1-Berm): 0
Leq LmaxL50
0.00.0L25
0.0L2
0.0L8
0.078.0Noise Level
NOISE MODEL PROJECTIONSDistance (feet)
50.0Reference (Sample)8.98.9 8.9 8.98.98.918.0Distance Attenuation
2.0Shielding (Barrier Attenuation) -10.9-10.9 -10.9 -10.9-10.9-10.9
Observer Height: 5.0 feet
Observer Location: R5
Condition: Construction Mitigation
Barrier Elevation: 0.0 feet
STATIONARY SOURCE NOISE PREDICTION MODEL 6/28/2019
Project Name: Elder CreekJob Number: 11744
Analyst: A. WolfeSource: Highest Construction Noise Level at 50 F
2.0
NOISE MODEL INPUTS
Noise Distance to Barrier:
21.0Noise Distance to Observer
feetfeet
Noise Source Elevation: 0.0Observer Elevation: 0.0 feet
feet
Barrier Height: 10.0Noise Source Height: 8.0 feet
feet
Drop Off Coefficient: 20.020 = 6 dBA per doubling of distance15 = 4.5 dBA per doubling of distance
19.0Barrier Distance to Observer: feet
Barrier Type (0-Wall, 1-Berm): 0
Leq LmaxL50
0.00.0L25
0.0L2
0.0L8
0.078.0Noise Level
NOISE MODEL PROJECTIONSDistance (feet)
50.0Reference (Sample)7.57.5 7.5 7.57.57.521.0Distance Attenuation
2.0Shielding (Barrier Attenuation) -10.8-10.8 -10.8 -10.8-10.8-10.8
Observer Height: 5.0 feet
Observer Location: R6
Condition: Construction Mitigation
Barrier Elevation: 0.0 feet
STATIONARY SOURCE NOISE PREDICTION MODEL 6/28/2019
90
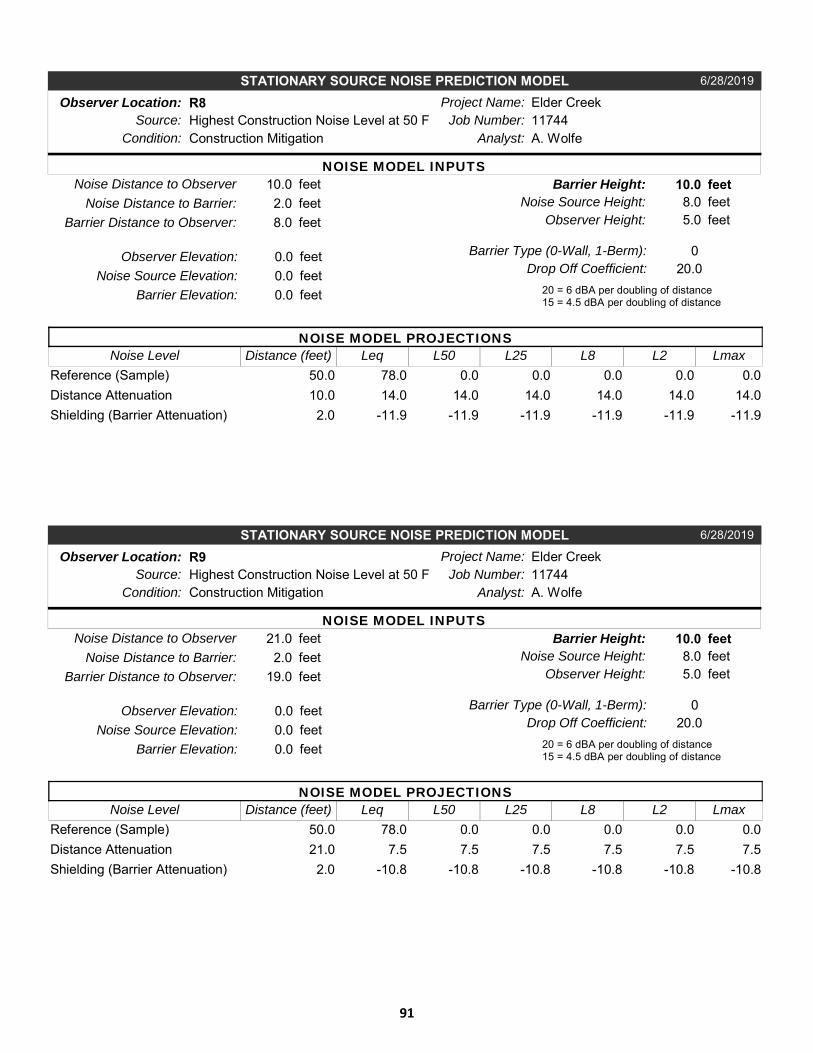
Project Name: Elder CreekJob Number: 11744
Analyst: A. WolfeSource: Highest Construction Noise Level at 50 F
2.0
NOISE MODEL INPUTS
Noise Distance to Barrier:
10.0Noise Distance to Observer
feetfeet
Noise Source Elevation: 0.0Observer Elevation: 0.0 feet
feet
Barrier Height: 10.0Noise Source Height: 8.0 feet
feet
Drop Off Coefficient: 20.020 = 6 dBA per doubling of distance15 = 4.5 dBA per doubling of distance
8.0Barrier Distance to Observer: feet
Barrier Type (0-Wall, 1-Berm): 0
Leq LmaxL50
0.00.0L25
0.0L2
0.0L8
0.078.0Noise Level
NOISE MODEL PROJECTIONSDistance (feet)
50.0Reference (Sample)14.014.0 14.0 14.014.014.010.0Distance Attenuation
2.0Shielding (Barrier Attenuation) -11.9-11.9 -11.9 -11.9-11.9-11.9
Observer Height: 5.0 feet
Observer Location: R8
Condition: Construction Mitigation
Barrier Elevation: 0.0 feet
STATIONARY SOURCE NOISE PREDICTION MODEL 6/28/2019
Project Name: Elder CreekJob Number: 11744
Analyst: A. WolfeSource: Highest Construction Noise Level at 50 F
2.0
NOISE MODEL INPUTS
Noise Distance to Barrier:
21.0Noise Distance to Observer
feetfeet
Noise Source Elevation: 0.0Observer Elevation: 0.0 feet
feet
Barrier Height: 10.0Noise Source Height: 8.0 feet
feet
Drop Off Coefficient: 20.020 = 6 dBA per doubling of distance15 = 4.5 dBA per doubling of distance
19.0Barrier Distance to Observer: feet
Barrier Type (0-Wall, 1-Berm): 0
Leq LmaxL50
0.00.0L25
0.0L2
0.0L8
0.078.0Noise Level
NOISE MODEL PROJECTIONSDistance (feet)
50.0Reference (Sample)7.57.5 7.5 7.57.57.521.0Distance Attenuation
2.0Shielding (Barrier Attenuation) -10.8-10.8 -10.8 -10.8-10.8-10.8
Observer Height: 5.0 feet
Observer Location: R9
Condition: Construction Mitigation
Barrier Elevation: 0.0 feet
STATIONARY SOURCE NOISE PREDICTION MODEL 6/28/2019
91

Elder Creek Channel Improvements Noise Impact Analysis
11744-11 Noise Study
This page intentionally left blank
92

Elder Creek Channel Improvements Noise Impact Analysis
11744-11 Noise Study
APPENDIX 7.3:
SAMPLE TEMPORARY CONSTRUCTION NOISE BARRIER PHOTOS
93

Elder Creek Channel Improvements Noise Impact Analysis
11744-11 Noise Study
This page intentionally left blank
94
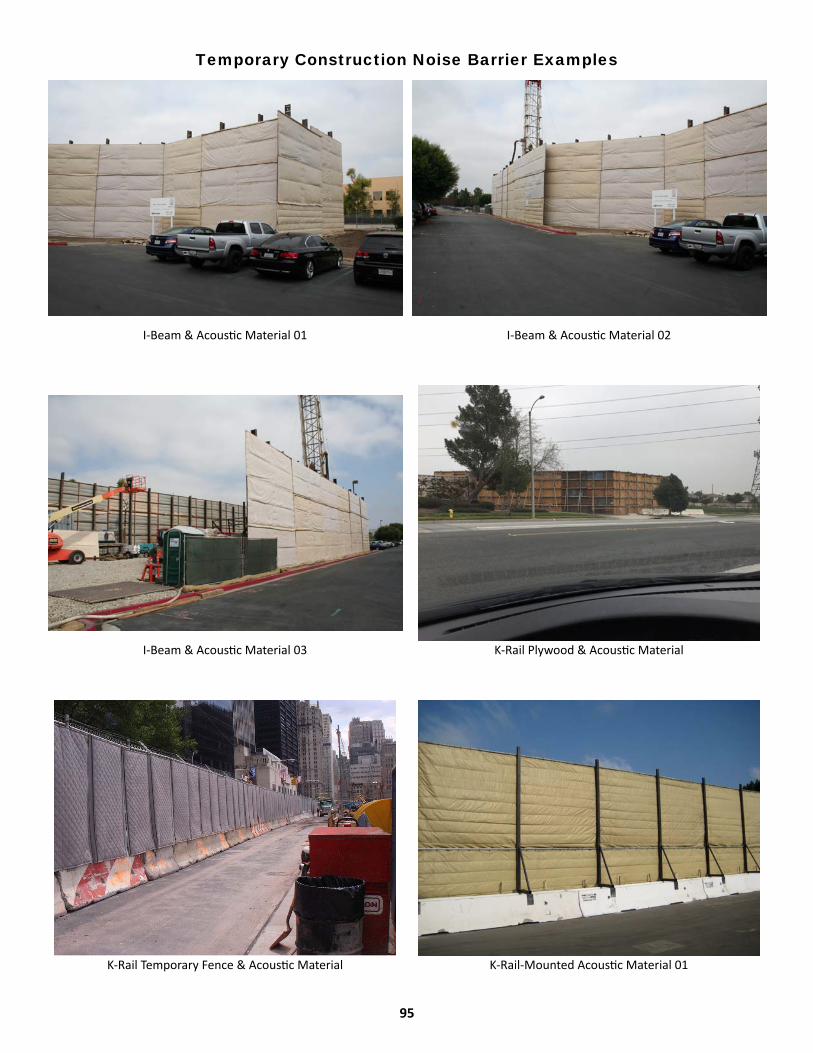
Temporary Construction Noise Barrier Examples
I-Beam & Acous c Material 01 I-Beam & Acous c Material 02
I-Beam & Acous c Material 03 K-Rail Plywood & Acous c Material
K-Rail Temporary Fence & Acous c Material K-Rail-Mounted Acous c Material 01
95

Temporary Construction Noise Barrier Examples
Pillar & Acous c Material Straw Bales 01
Straw Bales 02 Temporary Fence & Acous c Material 01
Temporary Fence & Acous c Material 02
96