Embed Size (px)
Citation preview
Noise in Fourier self-deconvolution
Jyrki K. Kauppinen, Douglas J. Moffatt, David G. Cameron, and Henry H. Mantsch
A general formula for computing changes in the signal-to-noise ratio of a spectrum resulting from the Fourierself-deconvolution procedure is derived. Self-deconvolution reduces the intrinsic halfwidths of lines by afactor K, which is in practice limited by the noise in the spectrum. With the help of the derived formula,the rate of decrease in the SNR as a function of K for eight different smoothing (apodization) functions isstudied. With high K values there are significant differences in the SNR as a result of the use of differentsmoothing functions. With K = 4 a difference of more than 1 order of magnitude between two extreme casesis demonstrated, and with K = 5 a difference of almost 2 orders of magnitude in the SNR is predicted.
1. Introduction
In a previous paperl we developed a Fourier self-deconvolution procedure whereby we reduce the spec-tral linewidth by a factor K, defined as the ratio of thelinewidth before self-deconvolution to that after.
According to our notations a spectrum E(v) and aninterferogram I(x) are related by
E(v) = 1 I(x) exp(i27rvx)dx = 511Ax)I
1(x) = S. E(M) exp(-i2irvx)dv = 91-11E(v)J,
(1)
(2)
where I and J-11 are the Fourier transform and theinverse Fourier transform, respectively. The self-deconvoluted interferogram I'(x) is obtained via theoperation
I'(x) = Dg(x) ).1-l~( ) ,
The authors are with National Research Council of Canada, Divi-sion of Chemistry, Ottawa, Ontario KA OR6.
Received 5 January 1981.0003-6935/81/101866-14$00.50/0.
(3)
where Eo(v) is the intrinsic line shape function, andDg(x) is an apodization function. The deconvolutedspectrum E'(v) is then simply the Fourier transform ofI'(x). The multiplication by 1/f-l'Eo(v)I results inself-deconvolution, and Dg(x) determines the line shapefunction 5((Dg(x)I and thus the spectral linewidth in thedeconvoluted spectrum E'(v). The factor K is givenby
1866 APPLIED OPTICS / Vol. 20, No. 10 / 15 May 1981
S° O N Sv~vL A2( 2(x)ax-L
where 2 is the halfwidth 2 of Eo(v), and AV,1/ 2 is thehalfwidth of JjDg(x)}. Alternately expressed, in ourself-deconvolution we smooth E(v) with 5(IDg(x)} andthen self-deconvolute the smoothed spectrum.
In practice, the spectrum E(v) must be recorded sothat the instrumental resolution is higher than the de-sired spectral linewidth Av,12 in E'(v). In addition, theline shape function EO(v) must be known precisely.However, in many spectroscopic techniques, the lineshape can be approximated by a Lorentzian line, i.e.,
Eo(v) = '(5)£12 + p2
and then
9-yEo(~l) = Io(x) = exp(-2ral x l). (6)
As the examples in our previous paperl showed, thefactor K by which we are able to reduce the spectrallinewidth in self-deconvolution is practically limited bythe SNR of the experimental spectrum E(v). From Eq.(3) it is evident that with a fixed Eo(v) and K value theonly way to change the SNR of E'(v) is to change theshape of Dg (x).
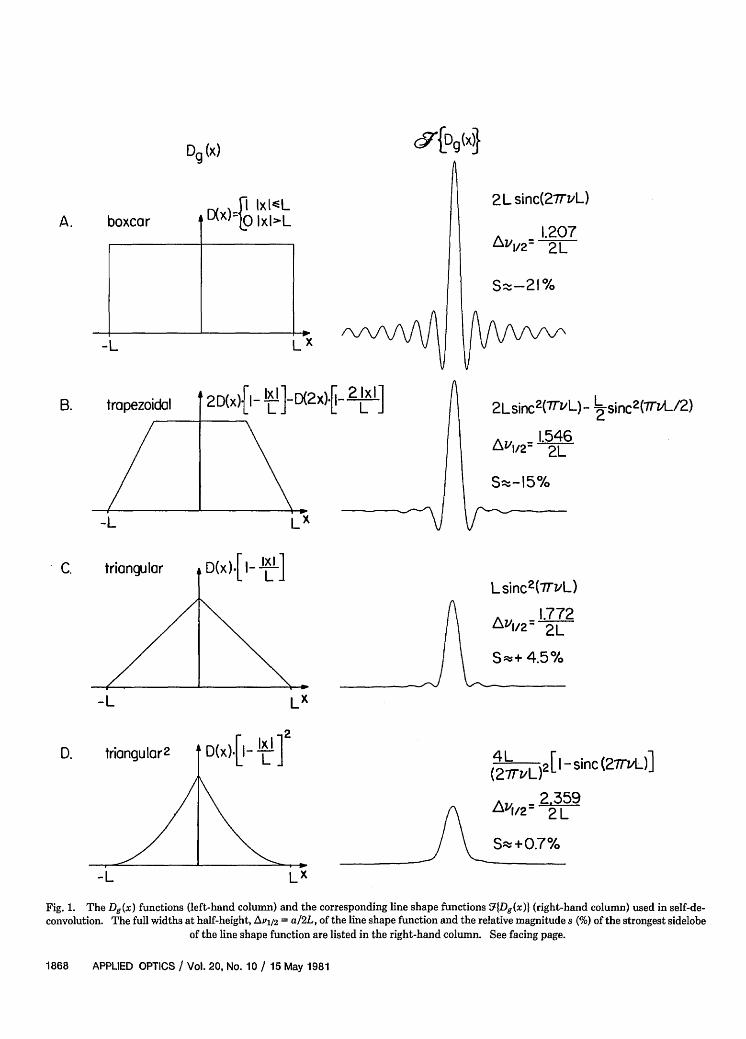
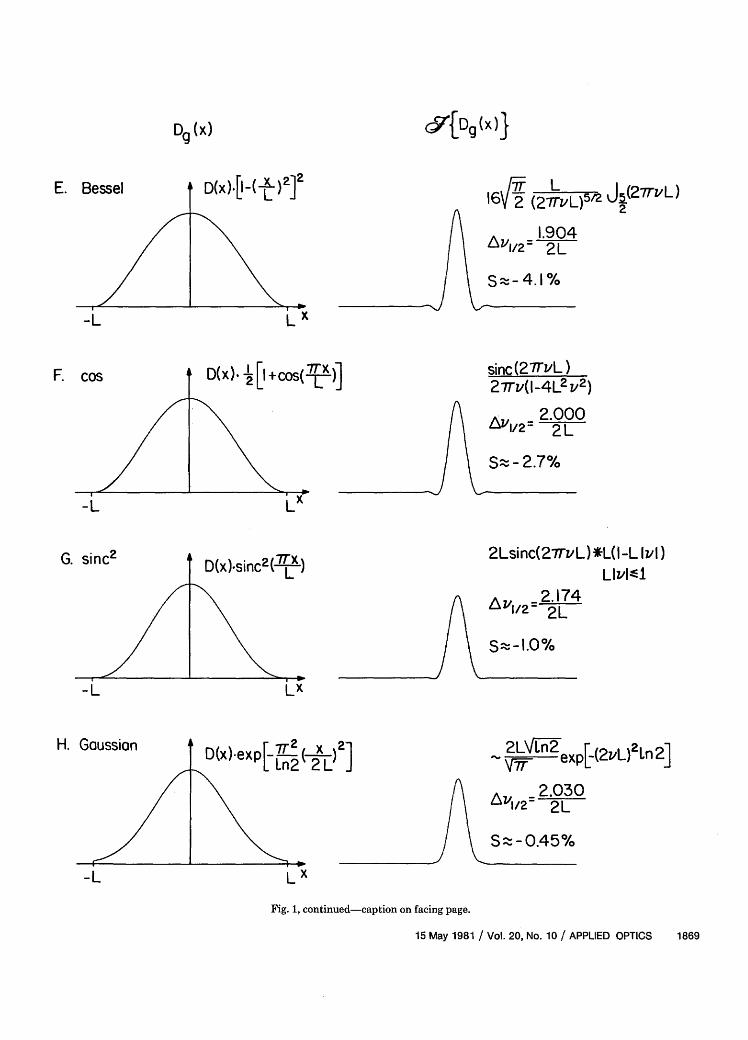
In this work we have derived a general formula forcomputing changes in the SNR in the self-deconvoutionprocedure. We have used this formula to study the rateof change in the SNR as a function of K employing eightdifferent types of apodization function Dg (x) andcompared the theoretical values with experimental ones.The functions Dg (x) used are shown in the left-handcolumn of Fig. 1, while the corresponding line shapefunctions 9IDg (x)) are shown in the right-hand columnof Fig. 1.
In the case of random, white noise n2(x) varies muchmore rapidly than A2(x), hence
r N2(P)dE =- L n2(x)dx- L A2(X)dx.-VO 2L -L -L
(9)
Thus the root mean square (rms) of the noise in thespectrum is given by
< ;21so S-'0 NA ()dl \2,n2r (xd=-* v 2()dx, (10)~
v2 1vo , 5
0 O
where -\/-A is the rms noise in the interferogram.For a general line shape Eo(v), its height (the signal)
is given by
Eo(O) = J Io(x)dx,
where
Io(x) = 1-I{Eo(v)j.
Hence, after apodization the height is given by
E8(0) =
(11).
(12)
(13)
Now we can express the general signal-to-noise ratio ofan apodized spectrum as
L L
A 2 f A2(X)dx(14)
11. Noise in Self-Deconvolution
Let us consider a random, white noise spectrum N(v)and its inverse Fourier transform n(x), i.e., a noise in-terferogram. Both N(v) and n(x) are assumed to beeven functions and hence real.
Using Parseval's relation3 the noise power spectrumN 2 (v) and the noise power interferogram n2 (x) are re-lated by
Setting A(x) = Dg(x)/Io(x) in the above equation we areable to calculate the signal-to-noise ratio, (S/N)', of thespectrum after self-deconvolution. This is given by
2 f Dg(x)dx(15)
J N 2(v)dv = J n2(x)dx. (7)
Experimental considerations will generally limit theintegrals to a range (-v0 ,v0 ) and (-LOLo), respectively.If we apply a general apodization function A (x) [A (x)= O, x I> L, A(x) 0 O Ix I < L, and even] to the noiseinterferogram, we can express the noise power spectrumN2(v) as
On the other hand, according to Eq. (14) the signal-to-noise ratio, (S/N), before self-deconvolution is givenby
(16)
,,Iv 2 f S(x)Io(x)dx
-%-n * f S2(X)dx
15 May 1981 / Vol. 20, No. 10 / APPLIED OPTICS 1867
K =-,A1/2
(4) (8)
(N)''v/72 -V D 2(X)[IO(X)1-2dx
f, 9
Dg (x)
A. boxcar
-L
B. trapezoidal
C.
D.
D(x)- Ix IxI-LLA 10 Ix I>L
L
2L sinc(27TvL)
1.2072 L
So-21%
VVVVJ\
2Lsinc 2(W~vL)- L sinC2(WZ/uL/2)- 1.54
_ /\/
2D(x)Il ILJ]-D(2x)j- 2 W]
A_~~~I I- L~_
-L Lx
triangular x).[ I
X \~~~~ D
-L Lx
triangular 11 (x). [ LIx I]2
I,//~~~-L
A112= 1.5462L
S~~-15%
Lsinc2(7rvL)
AZv/ = 1.7722L
s + 4.5 %
4L jI-sinc(27rvU)](27TvL)
2 L
S_- + 0.7 %
LX
Fig. 1. The Dg(x) functions (left-hand column) and the corresponding line shape functions ViDg(x)I (right-hand column) used in self-de-convolution. The full widths at half-height, Avj/2 = a/2L, of the line shape function and the relative magnitude s (%) of the strongest sidelobe
of the line shape function are listed in the right-hand column. See facing page.
1868 APPLIED OPTICS / Vol. 20, No. 10 / 15 May 1981
l
(g[Dg (x�
CDg (X)}
2 (27rvL)5/2
1.904A' 1/2 - 2L
S -4.1%
sinc 27TvL)27rv(1-4L2 v2 )
I, .
-L LX
sinc 2 A D(x).sinc2( I )
-L Lx
Av=2.0002 L
S- -2.7%
2Lsinc(27TvL)*L(I-L Ivt)LlvIe1
Ae .. 2.174
S 21.0%
H. Gaussian
-L L
2 exp[-(2vL)2 ln2]
,v = 2.030A"/?= 2L
S - 0.45%
x
Fig. 1, continued-caption on facing page.
15 May 1981 / Vol. 20, No. 10 / APPLIED OPTICS
E. Bessel
-L
J(2wVL)2
L
cosF.
G.
1869
D9 (x
A D(x)-exp[ 7T'Z ( X -]LnP I )?
_
i
D(x)-11-( LX)?-]?-
D(x) I +COS( 7TX)]21, C_
and Io(x) it is difficult to observe any characteristicbehavior of Q in this general form. However, in Eq. (17)L is directly proportional to the factor K, the relationbetween K and L being given by
K = 2a = = 4oLAv112 a a
2L
(18)
where 2a is the halfwidth of the original line shapeEo(v), and a/2L is the halfwidth of the line shapefunction 5'IDg(x)} after self-deconvolution. The pa-rameter a depends on the shape of Dg(x) (see Fig. 1).Further, we find that, with fixed Dg (x), Io(x), and S(x),the factor Q is a function of K, i.e., Q = Q(K).
Ill. Practical Formulas
In this section we apply Eq. (17) using a Lorentzianline shape function [Eq. (5)] and its interferogram Io(x)[Eq. (6)]. We are then able to derive from Eq. (17)practical formulas for computing Q-values, given spe-cific S(x) functions.
The first case recognizes that in our self-deconvolu-tion procedure the spectrum is smoothed by 9rjDg(x)},hence we set S(x) = Dg(x) in Eq. (17) and obtain
QD = I)(SIN)D
f 'DB(.)d. * Vf Dg(x)dx* (19)
SL Dg(X) exp(-27r.x)dx * D2(x) exp(47rox)dx
(S/N)D is now the signal-to-noise ratio of the truespectrum E(v) smoothed by 9Y{Dg(x)j, i.e., by the samefunction as that used in self-deconvolution.
QD depends on K and on the function Dg(x), i.e., QD= QD (K). This is easily demonstrated by deriving anexplicit form of Eq. (19), for example, in the case ofDg(x) = D(x) * (1 - Ix IL) (triangular in Fig. 1):
(20)
4-V- + [exp(-T/2) - -. 1 + 2 + 1 exp(T) - 1]}
where S(x) = '11W(v)I, and W(u) is the intrinsicsmoothing function of the recording system.
Now we can derive the ratio Q by which self-decon-volution decreases the SNR. This is given by
fL Dg(X)dX * , S2(x)dxQ (S/N)'
(S/N) S(x)Io(x)dx V rDS(x)[Io(x)j-2dx
The above equation is the general expression for Q andis applicable to all cases of our self-deconvolutionmethod. Without specific knowledge of Dg(x), S(x),
where T = arK = 1.7727rK.Equations (19) and (20) compare the signal-to-noise
ratio, (SIN)', of a self-deconvoluted spectrum to that,(S/N)D, of the spectrum smoothed by the function5Y{Dg(x)}, i.e., they solely characterize the effect ofself-deconvolution on the SNR.
However, in practice it is useful to compare the SNRafter self-deconvolution (S/N)', to the experimental one,(S/N)o, i.e., prior to smoothing by 5YDg(x)}. Using Eq.(17) this is possible if we know the smoothing functionW(v) and derive S(x) = Y-1W(v)j. In principle we canapproximate S(x) by taking the inverse Fourier trans-form of part of the noise in the original spectrum andusing the envelope of the interferogram as S(x).
1870 APPLIED OPTICS / Vol. 20, No. 10 / 15 May 1981
QD(K) =
The situation is simpler in Fourier transform sltroscopy where the smoothing function is better kncIn most cases S(x) is the apodization applied to thecorded interferogram and usually apodization defJthe instrumental resolution. In the case of bo)apodization,4 i.e., truncation at x = Lo, S(x) is a bo3function giving the instrumental resolution of 1.207/'If the instrumental resolution due to the truncatioKo times higher than the spectral one 2a, we haveanalogy with Eq. (18),
1.207 2tT
2L Ko
Using a Lorentzian line shape function and a boiS(x), we obtain, from the general expression in(17),
(SIN)YQo =
(S/N)o fLo
Jo
SLDg(x)dx /
exp(-27nix)dx -V S LD2(X ) exp(4rax'
JLDg(x)dX * 2arrZ
J D2(X) exp(47rax)dxV fL X)'i V 1.207KOo_. fLD(x)dx
V s D,(x) exp(4rax)dx
)ec-Mwn.ere-inesicarccarrZLO.
on is,by
(21)
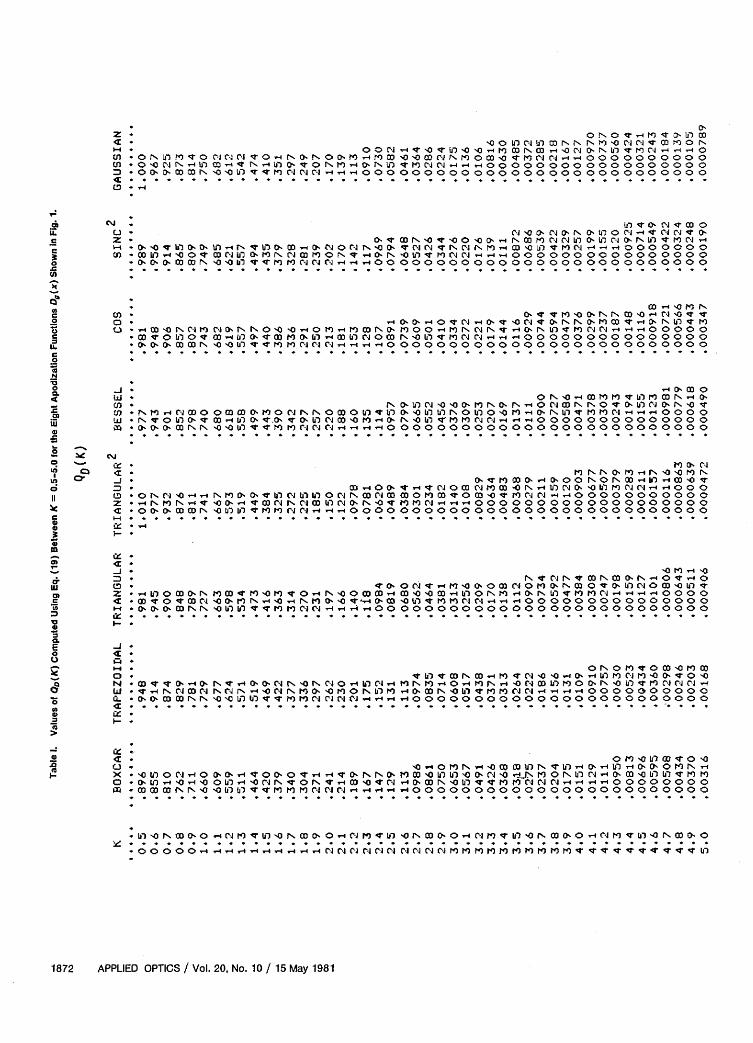
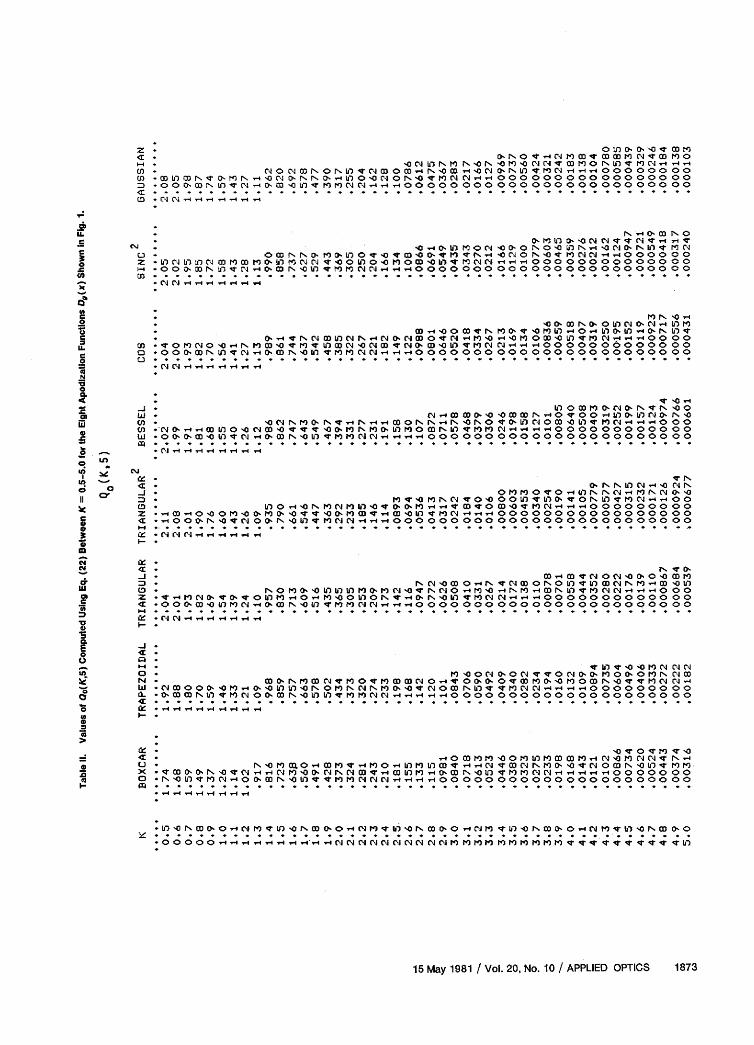
listed in Tables I and II, respectively. All QD (K) andQo(K,5) values were computed directy from Eqs. (19)and (22). It is also possible to derive explicit equationsfor Q for all apodization functions similar to those de-rived for the triangular function [Eqs. (20) and (24)].However, such equations are too complicated for prac-tical use.
As is apparent from Eq. (22), any Qo(KKo) value canbe obtained by the operation
Qo(K,Ko) = V- Qo(K,5). (25)
rcar In practice, Tables I and II can easily be used to esti-Eq. mate the signal-to-noise ratio, (S/N)', after self-de-
convolution by multiplying the original SNR by theappropriate Q-value.
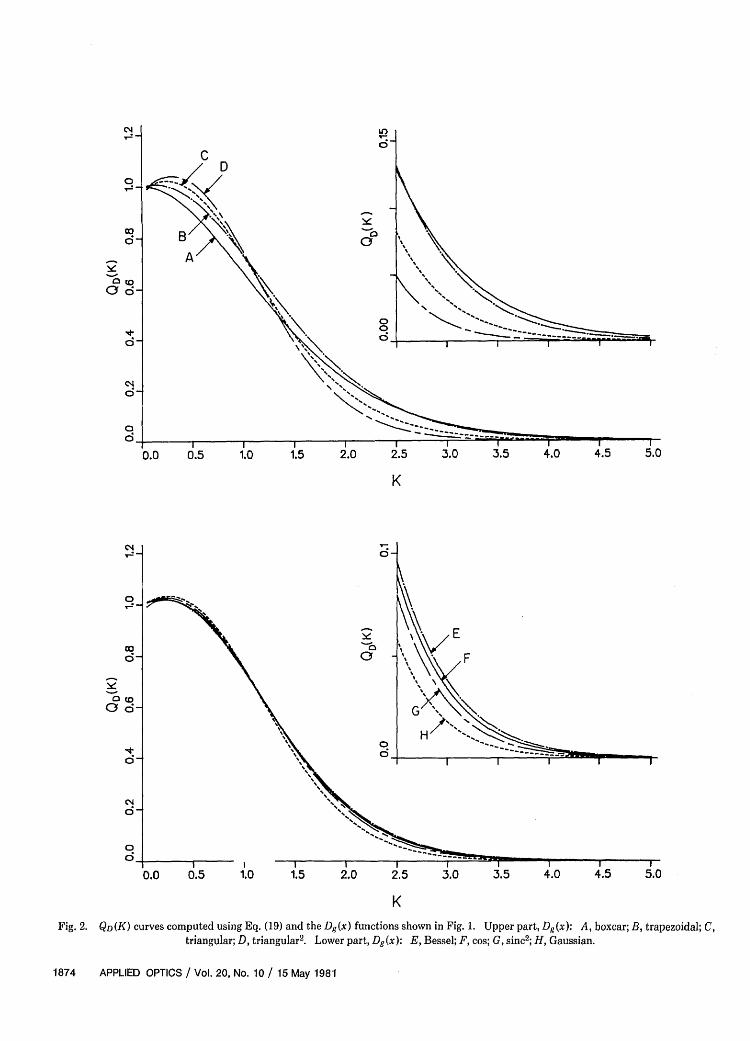
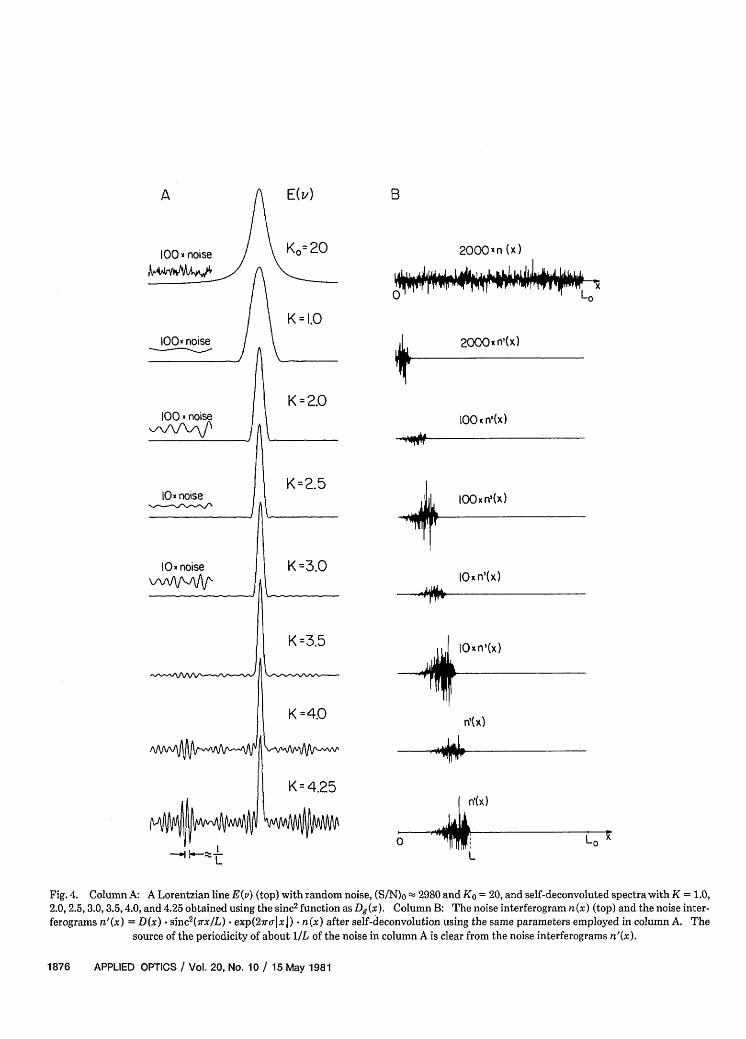
In both Figs. 2 and 3 the characteristic behavior of Qwhen K > 1.0 is that it decreases rapidly and nonlinearlyas a function of K. This is demonstrated in Fig. 4 usingthe sinc2 function as Dg(x) and starting from a Lo-rentzian line with Ko = 20, to which has been added
Idx random noise so that (S/N)O c 2980. The spectrumE(v) and the self-deconvoluted spectra with K = 1.0,2.0,2.5, 3.0, 3.5, 4.0, and 4.25 are shown in the left-handcolumn of Fig. 4. The signal-to-noise ratios, (S/N)', are9280, 2440, 825, 266,78.6,22.6, and 11.4 for K = 1.0,2.0,2.5, 3.0, 3.5, 4.0, and 4.25, respectively. These valuesare in good agreement with the values of 9420,2200,799,259, 76.9, 21.4, and 11.1 calculated by multiplying (S/
(22) N)o 2980 by the corresponding Q-values [Eq. (25) andTable II].
With high K values Q decreases nearly exponentially.This results from the dominance of the
where we assume Ko is so high that there is only a smalldistortion of the peak height, i.e.,
fL exp(-27rox)dx 5 ex(-2rox)dx = 2- (23)
The factor Qo depends on K, Ko, and Dg(x), as is clearlyshown in the explicit form of Eq. (22) for triangularDg(x):
Qo(K,Ko) =ir v'/1.207. 1.772KKo T
: (24)
OI D2(X ) exP(4rox)dx
term in Eqs. (19) and (22). This can be clearly shownin the case of triangular Dg(x) by using Eqs. (20) and(24). With high K values
QD(K) -T -exp(-T/2),
Qo(K,Ko) 4v1 exp(-T/2),
(26)
(27)
4 /- 1+2 I- + [exp(T)-111
where T = 1.7727rK and Ko > K. If triangular apodi-zation [S(x )] is used in the computation of the originalspectrum, we need only replace 1.207 by 1.772/3 in Eqs.(22) and (24).
The utility of Eqs. (19) and (22) is dependent on thedata being analyzed. As mentioned above, in Fouriertransform spectroscopy Lo is usually known, hence Eq.(22) is more useful. If S(x) is unknown, we can use Eq.(19) provided we first smooth the original spectrum with?IIDg(x)1 in order to measure (S/N)D. After this we canderive (S/N)' = QD (S/N)D.
IV. Results and ExamplesPlots of QD (K) and Qo(K,5) vs K for the eight apod-
ization functions Dg(x) are shown in Figs. 2 and 3 and
where T = 1.7727rK.It is evident in Fig. 4 that at high K values the noise
is no longer random. Rather, those components havingperiodicities of about 1L ( Av1/2 = a/2L) dominate.The reason for this is apparent in the right-hand sideof Fig. 4, which shows the interferograms of the noisefollowing self-deconvolution, i.e., multiplication by D(x)* sinc2(irx/L) * exp(2iralx I). After self-deconvolutionthe noise amplitude of the interferogram has a maxi-mum just below L. This maximum results in periodi-cities of about IlL in the noise of the self-deconvolutedspectra.
Apart from the dependence of Q on K, there is alsoa clear dependence on Dg (x). At a fixed K in the 0-2.5range, the extreme values of Q only differ by a factor of-2.7. At higher K the differences are much larger,being factors of -4.7 at K = 3,17 at K = 4, and 67 at K
15 May 1981 / Vol. 20, No. 10 / APPLIED OPTICS 1871
0'1
< ~~~~~~~~~~~~~~~'00DC-in WMN N Nrl) CI NW 03 no ON'-4 * ~~~~~~~~0 0 N -w V'OW 0 0 0 -4 N) W NWM -i4 ' ()O-Nb) t r' rN -s, 4
Ifl 0 *Oo OD-MN '- 0U) VWM C1 C1N -'-0 000 0 000 0 000 0o0 0 00 00 00
di* u-i Ito ( W 1cooir C.) (1-i~~~~~~~~~~~~~~~~~~~~l '0 0 (N 0' N -O 0i 0 (IJ -4W C, OsU T .2 0' V O N '0-t-O0 V O, -N r0 ri Ci- b Q- 0,i C 0- N IC) t N I-
(' TW s-I- 4 ,V00 D- ,C40N 00 .o Cj' , qNP) 0, - Tp C4- 4-
_ -~~~ 0.o.-.4oqr*J~~~~~~~~~.~~ orjt~0 IT vm Q'r-N NqOD iO N 10 IT N
IL. *G~~~G.G~~~cflWN 'O'O~~~~flt~~flN)CCC.-0 (I-4.- (1-4OOOCOOOOOOOOOCDOOOOOOOOOOOOOT 11C ~ ~ ~ ~ ~~0- AMrI0 , 0- Or , - ,r 0% 4(- 4--
CL.
4 ON~~~~~~~~~~~~~~~~~~~~~~~~~~~~~~~~O '0- CC V~ 0) WCL 0 N -40- N~~NM~qNO 3CD( 4j0C NNaO - Or if j0 O0I' N O 0 N -'0( iM N NOW G'IA O0 N 0
.9W N f ,V0 )0 .p -W - DCM-0 r ,1)MN(- - 4000000000
o cc* 11~~~~~~~~~~~~~~ ~V 4-rC 0C - 0 4 ,~ W 1O ) - O. (1I ~~~~~ ( ,0 V0NU )0 DC4O W rM' MOq RN 000 ' 0 0-r o oro NZn.a -4NMN~ 00 4I 3CAN 1N- TMM 0 0 rIO' 00 0 00 0- If -1C 0 o 00 -O Dr )l')VMMi- - 4~ 40 0 -i 00 0(N 0 l 10 0 -O 0- 11 '0' ' 0 0i lf C0 ri r4 .4 Q0
QC
_i`im -4-
a) C-J.
C4" mI D lm0
0. lt-t 41 "Nm0 0m0N m ( IIN ) W C N CO m -4 -' '0-I'q O 0 -f 0) 1 fl o O 0 N. 0-O 3O C00VVMMNNNr O i 0..
U)~ ~ ~ ~ ~ ~ ~ ~ ~ ~ ~ ~ ~ ~ ~ ~ ~ ~ ~~~~~~~~~~~~~~~~ 0i)0 I 4
* ~ ~ ~~U DO 4CAt)I ' 00 C- rW 0NO -0- - TU)' 0C,0 C m4V)I 0W a to o00
* Li 0 N 0D 0 0 -4 C- I t4 U) 04 N (0 0. 01-C MW N CO4rI0 I C 0 M- CJ r' 't D 0 Nl 0) G 0 It IJ IV Wr C ' Nr It Oq IT
1872 APPLIED OPTICS / Vol. 20, No. 10 / 15 May 1981
Z *0 a-O- 04 m 1M C- M-O - I D1M N ID MO6 * -O NW N MN ON-CM-C N NW DMON4. oM t rO NO MN.-- '-mD * cN NM NONOVNIom -4 N-CmIO N-N Wr WN v. -4 '4-4 0000o00O? .IDW)I cN MNo -* N H cNN 0---)o'O ONN 'CMNN-4 00 o 00o 0 0O000 0oD .OO0-IDNW)TC' 40-ID0tlWVMMNN.-.,-0 0000 OOO 000000O0O000OO0000
C3 * C- C -4i f-4 -4 -4 - 4
PN _ '00 NO
C * 0-M O 0- N C W 4 NW 44 _4 T- O - . 0_ID M 0 -0 c0 -0) O O N - -ON 0-N V 4 MN
C
0 m, co rarsoa ss o~ -n ODNN-M0-WMWN--CetONWMN4 O ~ OD -0000 00
o H ' O O is -W)CJW)IDMID M0-eW)MN(NW-COW)3 N < 0 t ¢ ( '4 _ OD O CO W M J O If 0 0 O O 0 O O V
rA
V ---- . . . . . . . . . . . . . . . . . . . . . . . . . . . . . . . . . . . . . . . . '- -.. ... .......... * . . .. .... ................
80~ ~ ~ ~ ~ ~ ~ ~ ~ ~ ~ ~ ~ ~ ~ ~ ~ ~ ~ ~~~~~~~~~~~~~~~~~~I 10.
C . MN '0'-No , O00ID N0 -W) NO N W) M
ci - ID0C4r )C- T4N- 4O 0 ,-4NO N M V0-Ws)C- OD~t -4- Ifl0-Ifl-'0N W)W
C * 0-4NNDDNJ-IoWNO-m0bsrwvwID-CW)WMs~t~'-0000
.L m - O I O O 0 O C- r0 m o It rV O , v) " 11 On m r) 0 c ) m O m M M CA c- -4 o4 o4 o o o o o o o o o o o
eV * COM N O C N O IT W) D N C4 ND - W - 0 0 -I'O W) Wo o oo oo o0000000000- *NN-44 J J _ -_ -401
C; 0 1-~~~~~~~~~~~~~~~~~~~~~~~~~4 0-cr 0 M M 0 V~~~~~~~~~~~~~~t 01DM 0- ~l N0-NW N, '00
Q * . M.T0 N 4W I 0-0 I I 0W00 I 0 V) N -4N'Ow. u * oCJNMr0oNWNIONNmoNoWo0oW)NOI^DsrW)WN-'-'-40
CD t-- 44D IO- I v CDO0-MNM 0WM cOD NW) M MN_ ooo o o oo000000000
1±1 00--IDCW)N0-DN-W)W00J0-4-a000-00000000000000000000
ID.cj OD-()I -u -ooom0Dc ION~o vrn0v^^ o o o O~ o o o o O O)
u . .. . . .. .. . . . . . .. ... . .. . . . . .. ... .. . ... . .. . .. ... ..... cC -
'V ~~~~~~~~~~~~~~~~~~~~~~~~~~~~~~~~~~~~~~~~~~~~ Wve 0MC40 -
* o C . . . . . . . . ............ ..C.. .-.... IT.v.0 .0-N N O. 0 N . N Na J 0 M Mo r O 0 I-O N N N O M O 0 --II MW-CM O ..... . ....m... ... V...........L4O N NW 00 ID 4 W) 0-4 0 O 0 M o o o 0
Ixt . .. . . . ... ... ................ . . . .. . . .. .... . . . . . . . . . . . . . . .... . . . . . . . . . . . . . . . .*IX *4 W)04-NMN W OWO-M4.-WIWOICW N-4-44000004
* I-* c '...- H H ^ H I V )
Cc * en N N ~ ~ ~ ~ ~ ~ ~ 140m )M100MO mc M- 4 aMN
C- N3 . 0-.4.vIV - I W en 0 MN m0 m0 1D M
a; fl* N N o'mO o No oriov v _O o O O Oooooooooooooooo O_ .c N e -4 -4- -4 -4--4
a.~~~~~
O~~ 4 .DWO'MC
'5 0.~~ M0NM0 0NM1 )ONO O , 9V010NM0 -COMv N0O 440- N0-~ M 0-OMN M; O,
N * D NMW0 I DNWMOWMIDIDNO.-eWO0-0-OWDM0'3 M N W NJ CV T v
a (C *_ 4-g,-i,-_n- 40F
0
I-I.-- 4-4-4-44o4 -4 -
-~~~~ D' D0 - D'NI -0. D' D0 4Nt DCNI -0. M 4 IDrnonlr~ m 'O c ro eID 0- z.t ~ o 3q now~r rtHJ¢oiNe orJoo ar r5> ~ ~ - 0 000oo -'-4 o-. N N N N N N N N N NlM MMII MM I MM M 44W 4 4 44 4 W 4W
15 May 1981 / Vol. 20, No. 10 / APPLIED OPTICS 1873
0C
U,)
c/ D
I0CY
Or 6-~~~~~~~~~~~~~~~~~~~~~~~~~~~-
dl X
IN~~~~~~~~~~~~
C4X
0~
0.0 0.5 1.0 1.5 2.0 2.5 3.0 3.5 4.0 4.5 5.0
K
04~~~~~~~
6 i
o0 ---
0.0 0.5 1.0 1.5 2.0 2.5 3.0 3.5 4.0 4.5 5.0
K
Fig. 2. QD(K) curves computed using Eq. (19) and the Dg(x) functions shown in Fig. 1. Upper part, Dg(x): A, boxcar; B, trapezoidal; C,triangular; D, triangular 2 . Lower part, Dg(x): E, Bessel; F, cos; G, sinc2 ; H, Gaussian.
1874 APPLIED OPTICS / Vol. 20, No. 10 / 15 May 1981
'c
u0
a
0.0 0.5 1.0 1.5 2.0 2.5 3.0 3.5 4.0 4. 5 5.0
K- _ ii
N~ ~~~~N
0~~~~~~~~
0 -
0.0 0.5 1.0 1.5 2.0 2.5 3.0 3.5 4.0 4.5 5.0
K
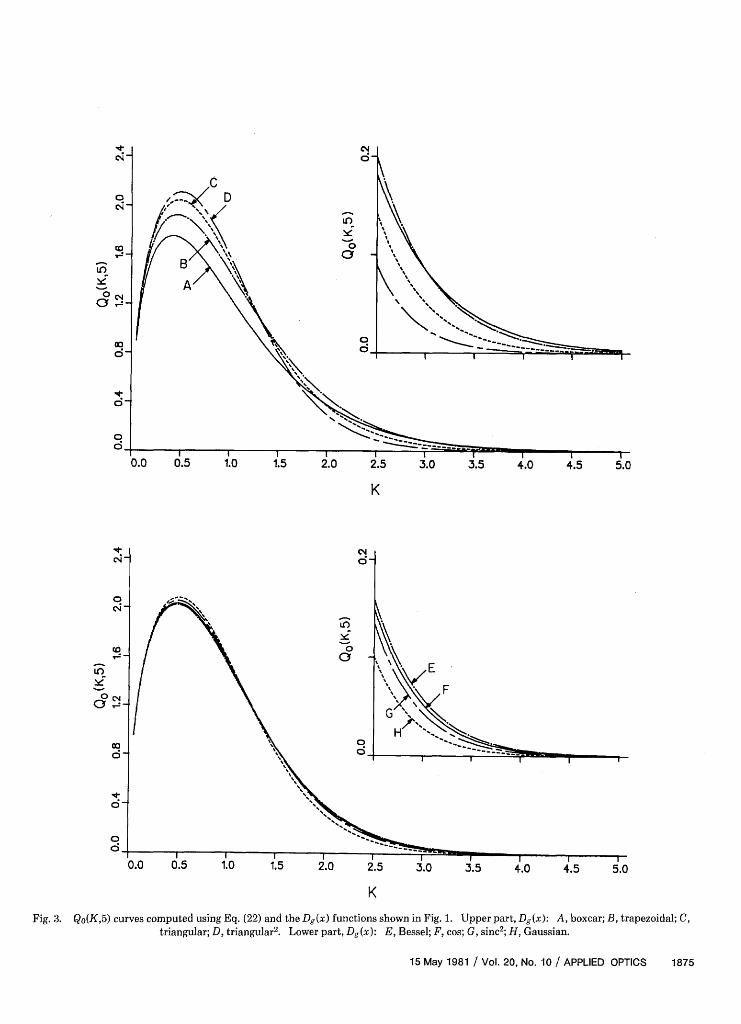
Fig. 3. Q(K,5) curves computed using Eq. (22) and teLg(x) functions shown in Fig.l1. Upperpart,Dg(x): A, boxcar; Btrapezoidal; C,triangular; D, triangular2. Lower part, Dg(x): , Bessel; Fcos; Gsinc2;X, Gaussian.
15 May 1981 / Vol. 20, No. 10 / APPLIED OPTICS 1875
B
2000xn (X)
tALLU1- I ll-e i ALLL
2000x n'(x)
lOO x n'(x)
r -
I Ox n'(x)
lO x n'(x)
rYx n'(x)
.n'(x
. -71
n'(x)
0
Fig. 4. Column A: A Lorentzian line E(v) (top) with random noise, (SIN)o 2980 and K0 = 20, and self-deconvoluted spectra with K = 1.0,
2.0, 2.5, 3.0,3.5,4.0, and 4.25 obtained using the sinc2 function as Dg(x). Column B: The noise interferogram n(x) (top) and the noise inter-ferograms n'(x) = D(x) sinc2(7rx/L) -exp(2rix1) .n(x) after self-deconvolution using the same parameters employed in column A. The
source of the periodicity of about 1/L of the noise in column A is clear from the noise interferograms n'(x).
1876 APPLIED OPTICS / Vol. 20, No. 10 / 15 May 1981
i
A. boxcar
B. trapezoidal
C. triangular
D. triangular 2
F. cos
G. sinc 2
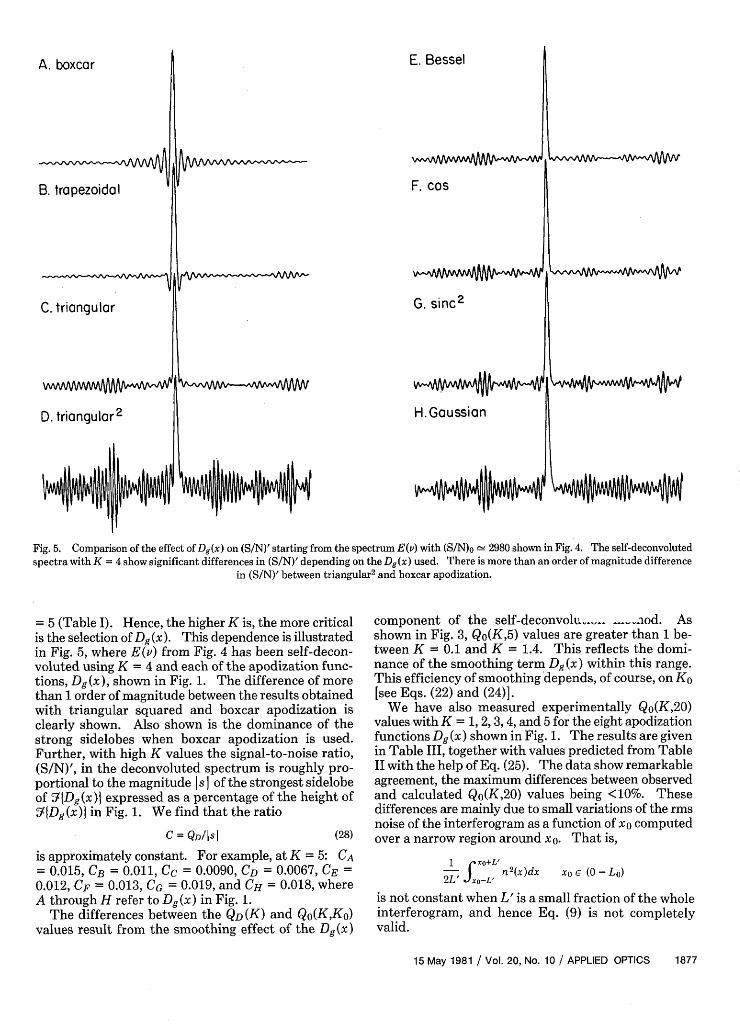
Fig. 5. Comparison of the effect of Dg(x) on (S/N)' starting from the spectrum E(v) with (S/N)o 2980 shown in Fig. 4. The self-deconvolutedspectra with K =4 show significant differences in (S/N)' depending on the Dg(x) used. There is more than an order of magnitude difference
in (S/N)' between triangular2 and boxcar apodization.
= 5 (Table I). Hence, the higher K is, the more criticalis the selection of Dg (x). This dependence is illustratedin Fig. 5, where E(v) from Fig. 4 has been self-decon-voluted using K = 4 and each of the apodization func-tions, Dg(x), shown in Fig. 1. The difference of morethan 1 order of magnitude between the results obtainedwith triangular squared and boxcar apodization isclearly shown. Also shown is the dominance of thestrong sidelobes when boxcar apodization is used.Further, with high K values the signal-to-noise ratio,(S/N)', in the deconvoluted spectrum is roughly pro-portional to the magnitude Is of the strongest sidelobeof 7I{Dg(x)} expressed as a percentage of the height of?I{Dg(x)} in Fig. 1. We find that the ratio
C = QD/ISI (28)
is approximately constant. For example, at K = 5: CA= 0.015, CB = 0.011, CC = 0.0090, CD = 0.0067, CE =0.012, CF = 0.013, CG = 0.019, and CH = 0.018, whereA through H refer to Dg (x) in Fig. 1.
The differences between the QD(K) and Qo(K,Ko)values result from the smoothing effect of the Dg(x)
component of the self-deconvolh. -. *-- .od. Asshown in Fig. 3, Qo(K,5) values are greater than 1 be-tween K = 0.1 and K = 1.4. This reflects the domi-nance of the smoothing term Dg (x) within this range.This efficiency of smoothing depends, of course, on Ko[see Eqs. (22) and (24)].
We have also measured experimentally Qo(K,20)values with K = 1, 2,3,4, and 5 for the eight apodizationfunctions Dg (x) shown in Fig. 1. The results are givenin Table III, together with values predicted from TableII with the help of Eq. (25). The data show remarkableagreement, the maximum differences between observedand calculated Qo(K,20) values being <10%. Thesedifferences are mainly due to small variations of the rmsnoise of the interferogram as a function of x0 computedover a narrow region around xO. That is,
I rxo+L'2L' x:o-L}
2 (x)dx Xoe (0-L 0)
is not constant when L' is a small fraction of the wholeinterferogram, and hence Eq. (9) is not completelyvalid.
15 May 1981 / Vol. 20, No. 10 / APPLIED OPTICS 1877
E. Bessel
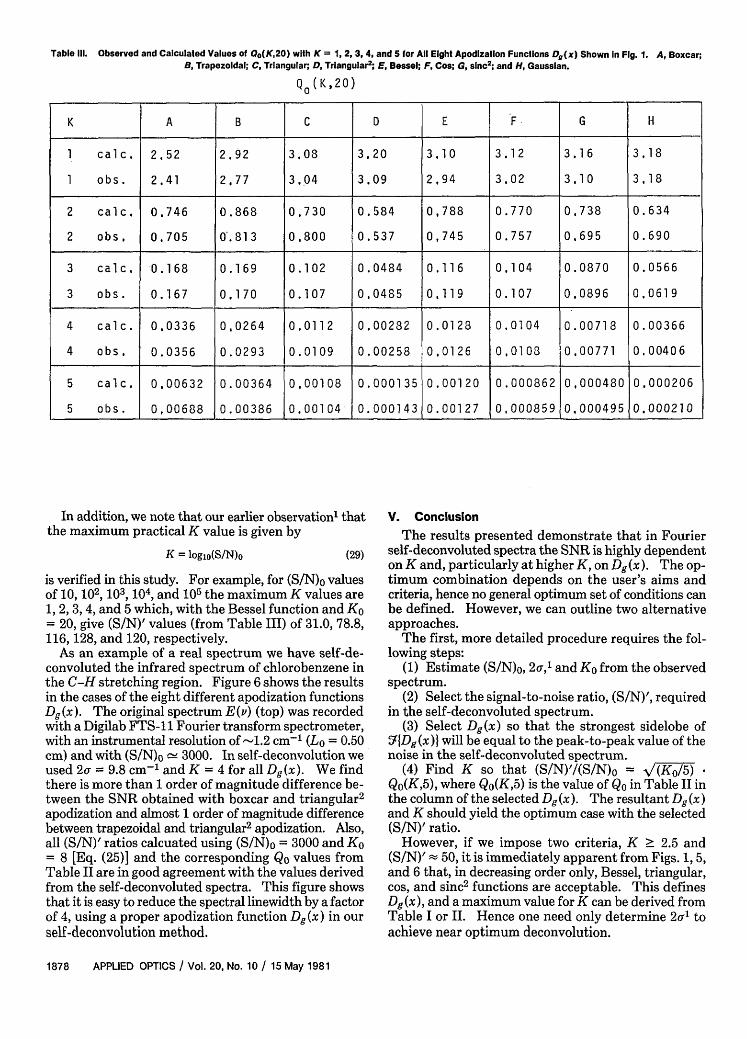
Table Ill. Observed and Calculated Values of Qo(K,20) with K = 1, 2, 3, 4, and 5 for All Eight Apodization Functions Dg(x) Shown In Fig. 1. A, Boxcar;B, Trapezoidal; C, Triangular; D, Triangular2; E, Bessel; F, Cos; G, sinc2; and H, Gaussian.
QO ( K,20)
K A B C D E F G H
1 caic. 2,52 2.92 3.08 3.20 3.10 3.12 3.16 3.18
1 obs. 2.41 2.77 3,04 3.09 2,94 3,02 3.10 3.18
2 caic, 0.746 0.868 0.730 0.584 0,788 0.770 0.738 0.634
2 obs, 0,705 0.813 0,800 0.537 0,745 0.757 0,695 0.690
3 caic, 0.168 0.169 0.102 0.0484 0.116 0,104 0.0870 0,0566
3 obs. 0.167 0.170 0.107 0,0485 0,119 0.107 0.0896 0,0619
4 caic. 0,0336 0,0264 0,0112 0.00282 0.0128 0.0104 0.00718 0.00366
4 obs. 0.0356 0.0293 0.0109 0.00258 0,0126 0,0108 0.00771 0.00406
5 calc, 0,00632 0.00364 0,00108 0.000135 0.00120 0.000862 0,000480 0,000206
5 obs. 0,00688 0.00386 0.00104- 0.000143 0.00127 0,000859 0,000495 0.000210
In addition, we note that our earlier observations thatthe maximum practical K value is given by
K = loglo(S/N)o (29)
is verified in this study. For example, for (S/N)o valuesof 10, 102, 103, 104, and 105 the maximum K values are1, 2, 3, 4, and 5 which, with the Bessel function and Ko= 20, give (S/N)' values (from Table III) of 31.0, 78.8,116, 128, and 120, respectively.
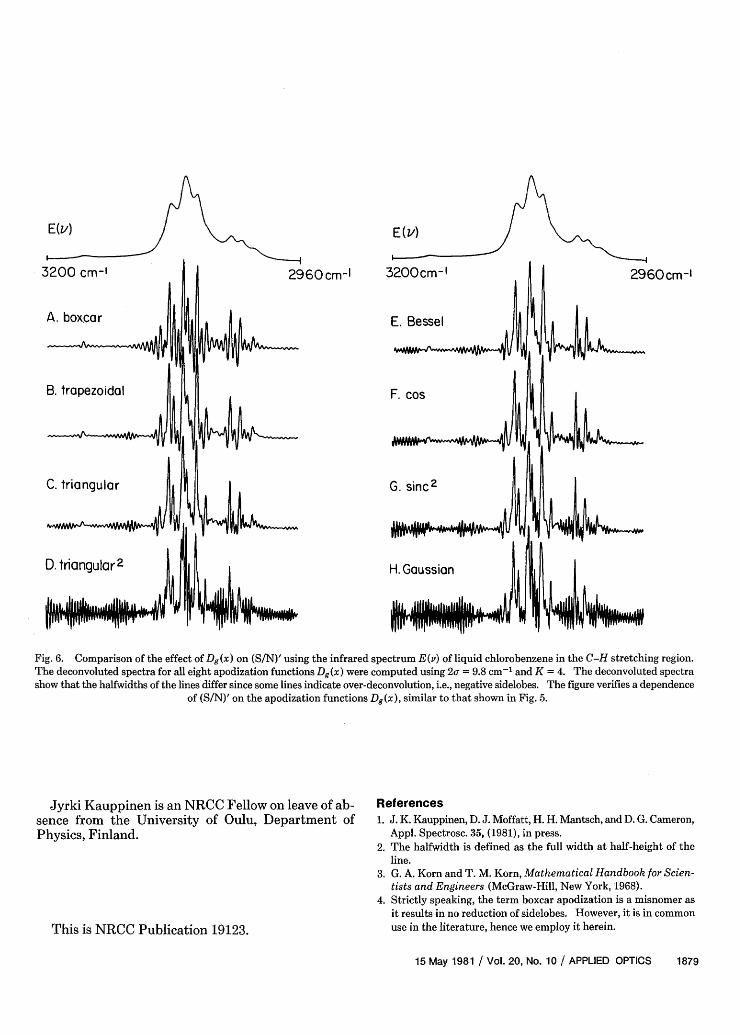
As an example of a real spectrum we have self-de-convoluted the infrared spectrum of chlorobenzene inthe C-H stretching region. Figure 6 shows the resultsin the cases of the eight different apodization functionsDg(x). The original spectrum E(v) (top) was recordedwith a Digilab FTS-11 Fourier transform spectrometer,with an instrumental resolution of -1.2 cm- 1 (Lo = 0.50cm) and with (S/N)o _ 3000. In self-deconvolution weused 2o 9.8 cm-l and K = 4 for all Dg(x). We findthere is more than 1 order of magnitude difference be-tween the SNR obtained with boxcar and triangular 2
apodization and almost 1 order of magnitude differencebetween trapezoidal and triangular 2 apodization. Also,all (S/N)' ratios calcuated using (S/N)o = 3000 and Ko= 8 [Eq. (25)] and the corresponding Qo values fromTable II are in good agreement with the values derivedfrom the self-deconvoluted spectra. This figure showsthat it is easy to reduce the spectral linewidth by a factorof 4, using a proper apodization function Dg (x) in ourself-deconvolution method.
V. Conclusion
The results presented demonstrate that in Fourierself-deconvoluted spectra the SNR is highly dependenton K and, particularly at higher K, on Dg(x). The op-timum combination depends on the user's aims andcriteria, hence no general optimum set of conditions canbe defined. However, we can outline two alternativeapproaches.
The first, more detailed procedure requires the fol-lowing steps:
(1) Estimate (S/N)o, 2a,l and Ko from the observedspectrum.
(2) Select the signal-to-noise ratio, (S/N)', requiredin the self-deconvoluted spectrum.
(3) Select Dg(x) so that the strongest sidelobe of5fDg(x)I will be equal to the peak-to-peak value of thenoise in the self-deconvoluted spectrum.
(4) Find K so that (S/N)'/(S/N) = (K/5) -Qo(K,5), where Qo(K,5) is the value of Qo in Table II inthe column of the selected Dg(x). The resultant Dg(x)and K should yield the optimum case with the selected(S/N)' ratio.
However, if we impose two criteria, K ' 2.5 and(S/N)' 50, it is immediately apparent from Figs. 1, 5,and 6 that, in decreasing order only, Bessel, triangular,cos, and sinc2 functions are acceptable. This definesDg(x), and a maximum value for K can be derived fromTable I or I. Hence one need only determine 2 toachieve near optimum deconvolution.
1878 APPLIED OPTICS / Vol. 20, No. 10 / 15 May 1981
E(>) E(M)
2960 cm-l 2960cm-1
Fig. 6. Comparison of the effect of Dg(x) on (S/N)' using the infrared spectrum E(v) of liquid chlorobenzene in the C-H stretching region.The deconvoluted spectra for all eight apodization functions Dg(x) were computed using 2u = 9.8 cm 1 and K = 4. The deconvoluted spectrashow that the halfwidths of the lines differ since some lines indicate over-deconvolution, i.e., negative sidelobes. The figure verifies a dependence
of (S/N)' on the apodization functions Dg(x), similar to that shown in Fig. 5.
Jyrki Kauppinen is an NRCC Fellow on leave of ab-sence from the University of Oulu, Department ofPhysics, Finland.
This is NRCC Publication 19123.
References1. J. K. Kauppinen, D. J. Moffatt, H. H. Mantsch, and D. G. Cameron,
Appl. Spectrosc. 35, (1981), in press.2. The halfwidth is defined as the full width at half-height of the
line.3. G. A. Korn and T. M. Korn, Mathematical Handbook for Scien-
tists and Engineers (McGraw-Hill, New York, 1968).4. Strictly speaking, the term boxcar apodization is a misnomer as
it results in no reduction of sidelobes. However, it is in commonuse in the literature, hence we employ it herein.
15 May 1981 / Vol. 20, No. 10 / APPLIED OPTICS 1879