Embed Size (px)
Citation preview
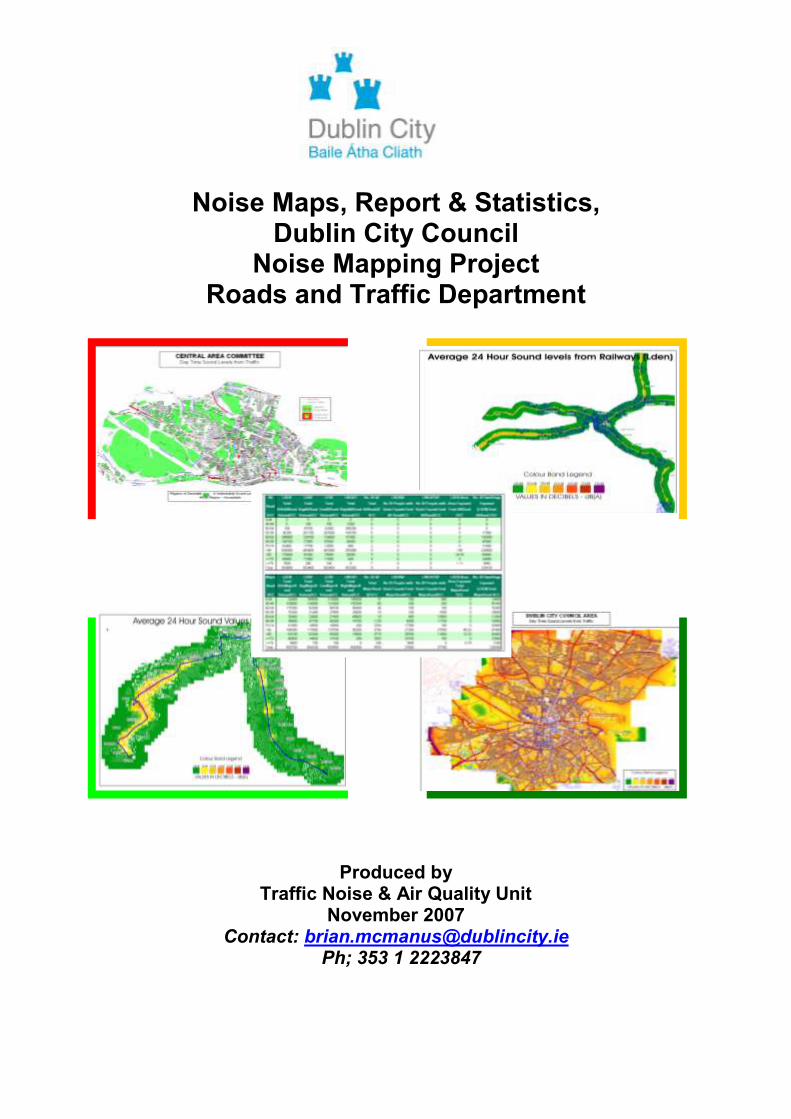
Noise Maps, Report & Statistics, Dublin City Council
Noise Mapping Project Roads and Traffic Department
Produced by Traffic Noise & Air Quality Unit
November 2007 Contact: [email protected]
Ph; 353 1 2223847
Summary
Under EU Directive 2002/49/EC relating to The Assessment and Management of
Environmental Noise (known as the END), the four local authorities, within the agglomeration
of Dublin, are required to produce ‘ Strategic Noise Maps’. The ‘END‘ emphasises that
Strategic maps are not to be used to address local noise nuisances such as neighbourhood
or domestic noise nuisance. The maps were required to be completed by end of June 2007
followed by Action Plans, which are to be completed by 18th July 2008. The data on noise
maps has to be forwarded to the European Commission before the end of December 2007.
This report includes all the variation of noise maps required to be produced under the
Environmental Noise Directive. The calculations for the Dublin City Council Maps were
completed by 30th June 2007.
This report supersedes the ‘ Provisional Report & Statistics, Dublin City Council Noise
Mapping Project’ produced in June 2007.
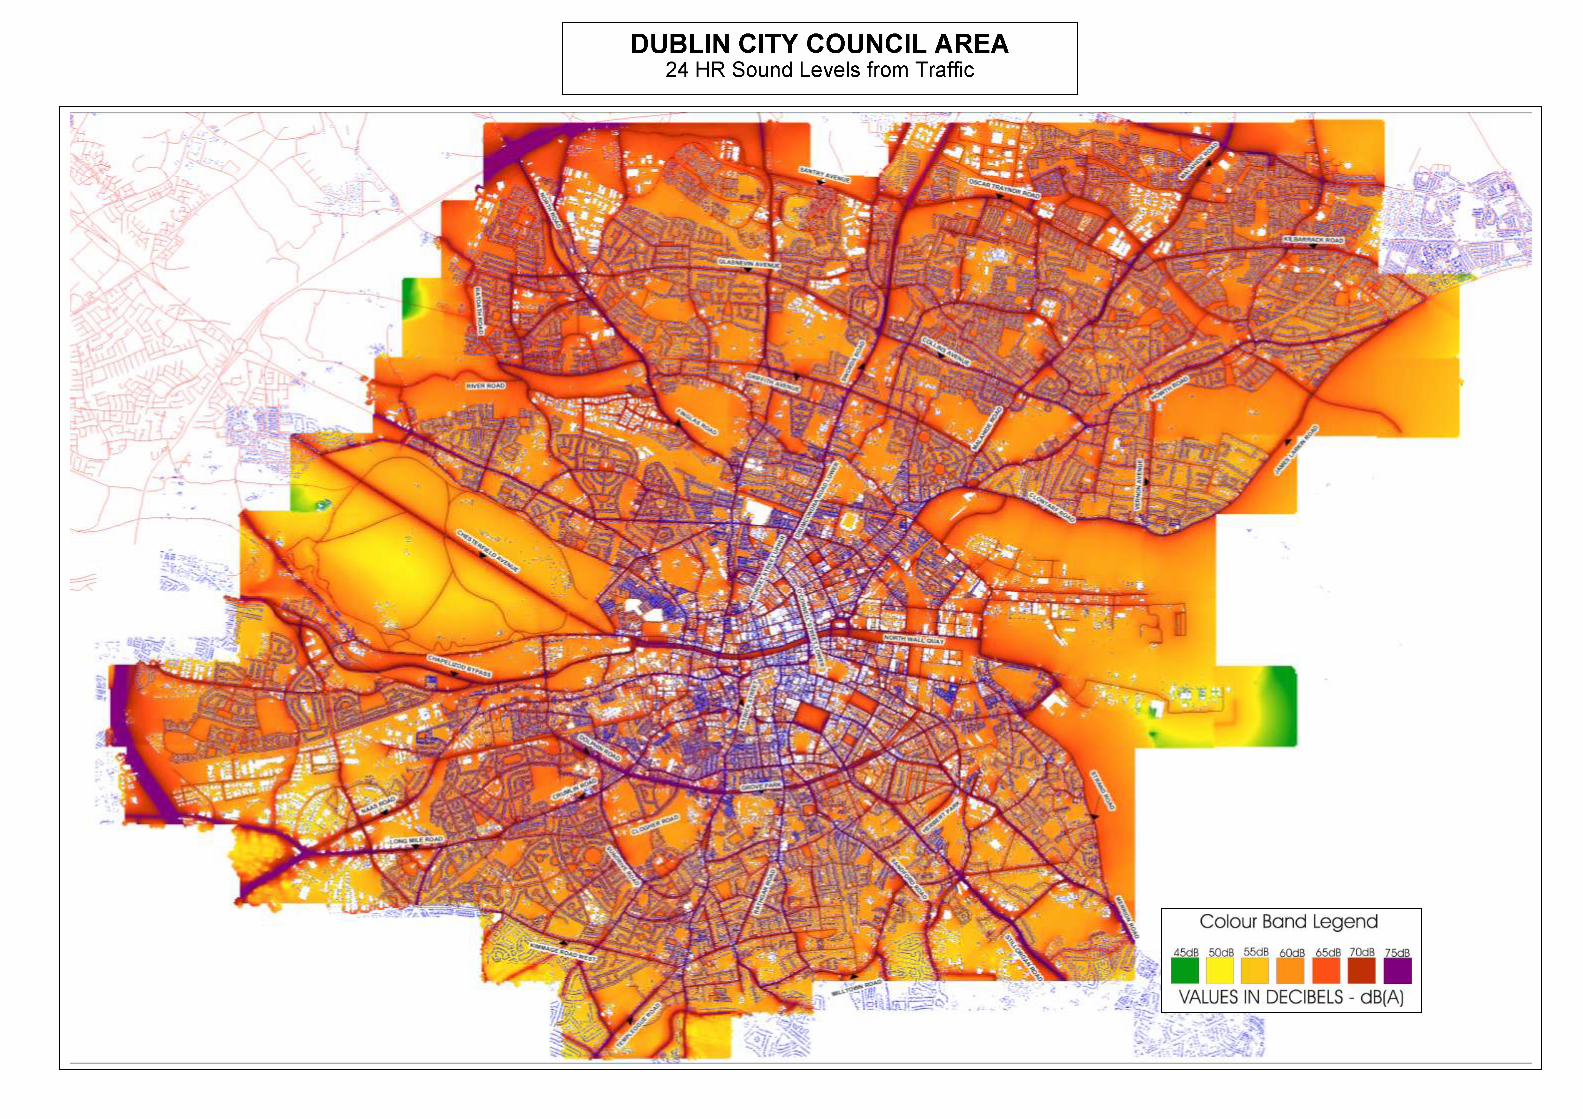
The ‘Noise Maps’ show colour coded areas in Dublin based on noise levels, in 5 bands.
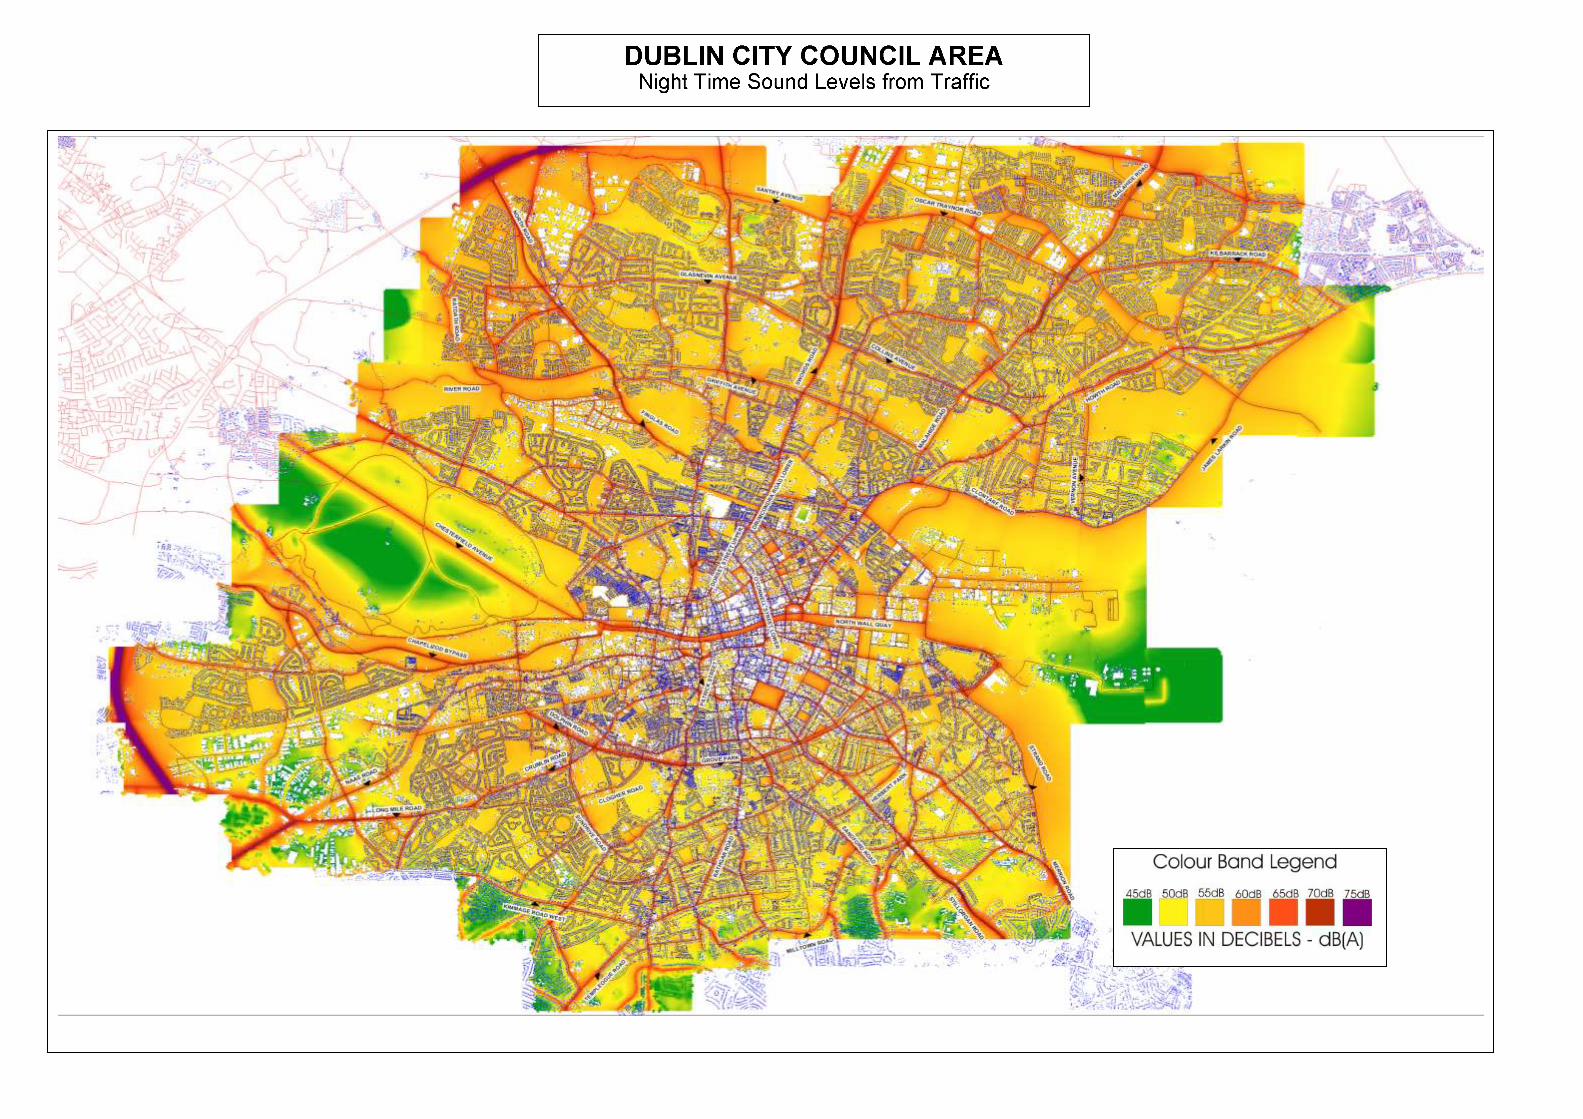
These increment in 5 decibels. The Night time band start at 50 decibels and the 24 Hour band
starts at 55 decibels. The EU Directive does not give an indication as to what level of noise is
acceptable. This is left to each member state. At this point in time, Ireland does not have any
statutory limit values, as is the case for air pollution. In the absence of guidance, one could
assume that the closer the calculated noise level is to the highest band of noise set out in the
Directive the more unacceptable it is. And conversely, the closer the calculated noise is to the
lowest band of noise set out in the Directive the more acceptable it is. Separate colour coded
maps have been developed to show what is deemed to be acceptable and desirable
/undesirable, using this criteria.
The different sources of noise included in the maps are ‘All Roads’, ‘Major Roads’ and ‘All
Railway’ and ‘Major Railways’. The ‘Luas’ rail is included in ‘All Railway’ and ‘Major Railway’
categories. In this report the Luas and Rail map statistics are produced for the ‘Agglomeration
of Dublin’, which includes all four local authority regions in the Dublin region. No maps are
being produced for industrial point sources or aircraft noise, as these categories have been
found to have no strategic impact on overall noise levels within the Dublin City Council region.
Some of the statistics for the Dublin City Council area indicate that: -
Railway noise does not have a major impact on overall noise levels.
Traffic noise is the dominant noise source.
Just over 66% of citizens are exposed to 24-hour (Lden) sound levels from traffic
below 65 decibels
The ‘All Roads’ category has a greater impact on more people that the ‘Major Road’
category.

24 hour (Lden) sound levels from traffic do not drop below 55 decibels.
58% of Citizens are being expose to Nighttime levels from traffic above 55 decibels.
Approximately 7600 people are being exposed to average 24hour sound levels sound
levels equal to or greater than 75 decibels
The complete table of population exposure to sound from traffic can be found in
Annex I
Introduction Under EU Directive 2002/49/EC relating to The Assessment and Management of
Environmental Noise, which was transposed by SI number 140 of 2006, Environmental Noise
Regulations 2006, the four local authorities, within the agglomeration of Dublin (Dublin City
Council, Fingal, Dun Laoire Rathdown and South Dublin County Councils), are required to
produce ‘Maps’ for noise emanating from Major Industry, Roads including Major Roads, Rail
including Major Rail and Airports including Major Airports.
This Directive was implemented on foot of an EU Green Paper on ‘Future Noise Policy’, which
highlighted the need for a high level of health and environmental protection against noise. In
the Green Paper, the Commission addressed noise in the environment as one of the main
environmental problems in Europe.
The aims of this Directive are: -
To monitor environmental noise problems by requiring competent authorities in
Member States to draw up "strategic noise maps" for major roads, railways, airports
and agglomerations, using harmonised noise indicators Lden (day-evening-night
equivalent level) and Lnight (night equivalent level). These maps are to be used to
assess the number of people annoyed and sleep-disturbed respectively throughout
each member state in the European Union.
To inform and consult the public about noise exposure, its effects, and the measures
to be considered to address noise problems.
To address local noise issues by requiring competent authorities to draw up action
plans to reduce noise where necessary and maintain the environmental acoustic
quality where it is good. The directive does not set any limit value, nor does it
prescribe the measures to be used in the action plans, which remain at the discretion
of the competent authorities.
To develop a long-term EU strategy, which includes objectives to reduce the number
of people affected by noise in the longer term, and provides a framework for
developing existing Community policy on noise reduction from source.
The Directive is also aimed at providing a basis for developing EU wide measures to reduce
noise emitted by the major sources, in particular road and rail vehicles and infrastructure,
aircraft, outdoor and industrial equipment. The Directive applies to environmental noise to
which humans are exposed, in particular in built-up areas, in public parks or other quiet areas
in an agglomeration, in quiet areas in open country, near schools, hospitals and other noise
sensitive buildings and areas. It does not apply to noise that is caused by the exposed person
himself\herself, noise from domestic activities, noise created by neighbours, noise at work

places or noise inside means of transport or due to military activities in military areas. The fact
that these maps are Strategic Noise Maps, precludes their use for the assessment of local
noise nuisances.
Implementation and responsibilities
Under the Environmental Noise Regulations 2006 the 4 Local Authorities within the
‘Agglomeration of Dublin’ are designated as the noise-mapping and action planning bodies for
the purpose of making and approving strategic noise maps and action plans and have been
designated as the noise mapping bodies and action planning authorities for the following
categories within their areas:-
All Roads and Major Roads,
All Rail and Major Rail,
Major Industrial Processes,
All Airports and Major Airport.
No later than 18 July 2008, Action Plans are required to be made which are designed to
manage, within the agglomeration, noise issues and effects, including noise reduction if
necessary. The plans shall also aim to protect quiet areas against an increase in noise.
Before producing and implementing Action Plans the Local Authorities must consult with the
Environmental Protection Agency and the noise-mapping body for the noise-map involved,
i.e. NRA, Iarnród Eireann, IPPC licensed Plants, Dublin Airport. The Local Authorities are also
responsible for consulting with members of the public and are required under the Directive to
demonstrate how they have done so.

Noise Mapping and Action Plans
Not alone do Noise Maps and Action Plans have to be developed for agglomerations with
more than 250 000 inhabitants, but also for places near major roads which have more than
six million vehicle passages a year, major railways which have more than 60 000 train
passages per year and major airports.
On completion of the Noise Maps, measures to be taken which are contained in the Action
Plans are at the discretion of the Local Authorities, in consultation with the EPA, and the
appropriate body i.e. NRA, Iarnród Eireann, IPPC licensed Plants, Dublin Airport. The plans
should notably address priorities, which may be identified by the exceedance of any relevant
limit value or by other criteria chosen by the Member States, and apply in particular to the
most important areas as established by the strategic noise mapping. The Maps and Action
Plans shall be reviewed, and revised if necessary, when a major development occurs
affecting the existing noise situation, and at least every five years.
The Directive also requires that Member States shall ensure that: -
the public is consulted about proposals for action plans,
the public is given early and effective opportunities to participate in the preparation
and review of the action plans,
the results of that participation are taken into account and that the public is informed
on the decisions taken.
reasonable time frames shall be provided allowing sufficient time for each stage of
public participation.
the information shall be clear, comprehensible and accessible.
Dublin City Council Noise Mapping Project
Noise mapping entails the prediction or measurement of noise levels at a number of
receiver\receptor points. These values are then used to draw colour contour noise maps,
which visually represent the levels of noise throughout the area being mapped.
Dublin City Council produced its first noise map in July 2004. These were solely for sound
emitted from traffic. Noise Maps consist of a base map of an area to be ‘noise mapped’
overlaid with colour contour\bands representing the various levels of noise in the map region.
Population exposure is then calculated by summing the number of people living within each
colour contour.
The EU recommends that noise maps should be developed by computer modelling, rather
than measurement. This entails inputting detailed information into a computer modelling
programme such as building, barrier, rail and road structures along with volume, speed and
some other characteristics of the traffic. Overlaid on these structures is a disaggregation of
the population and type of land use i.e. residential, commercial or green space.
The objectives of the current Noise Mapping Project are as follows: -
1.To Comply with the requirements of EU Directive 2002/49/EC and S.I. No. 140 of 2006
2. To identify and quantify the scale of the noise problem in Dublin by providing information on
noise levels.
3. To provide information to the public on the level of noise throughout the City and the
location of 'Hot Spots'.
4. To assist Dublin City Council in the process of setting realistic targets for noise
reduction if required.
5. To provide a tool, permitting the more effective use of planning controls to reduce noise
from new noise sources and to identify and protect and create areas of low noise levels.
6. To be a tool, whereby action plans to reduce noise from existing sources can be
developed analysed and costed.
7. To be a means of monitoring the effectiveness of planning controls and action plans for
reducing noise.
The Objectives of Current Noise Mapping Project contd.
8. To be capable of monitoring trends in environmental noise.
9. To provide a platform for further research into the effects of environmental noise on the
citizens of Dublin.
The current round of maps, have been developed using data inputted into the computer
modelling which was less than 3 years old. The Maps represent the situation for the year
2006. The Directive requires that 5 bands of noise be represented on the Noise Maps, in
increments of 5 decibels. The 24-hour values ( Lden) start at 55dB whilst the night time
(Lnight) values start at 50dB.
This report includes statistics for the Dublin City Council Region on Road Traffic noise and for
the agglomeration of Dublin for Railway Noise (including the Luas). The accompanying Noise
Maps include, maps for noise from Railway, Major Railway, All Roads, Major Roads only, and
the Luas. As the main sound emissions of concern are from road traffic, emphasis has been
put on this source. More detailed maps have been produced based on this sound source for
the five local Dublin City Council administrative areas. Maps for these areas have been
produced, indicating the areas affected by sound levels that are desirable, undesirable or
acceptable.
Comment
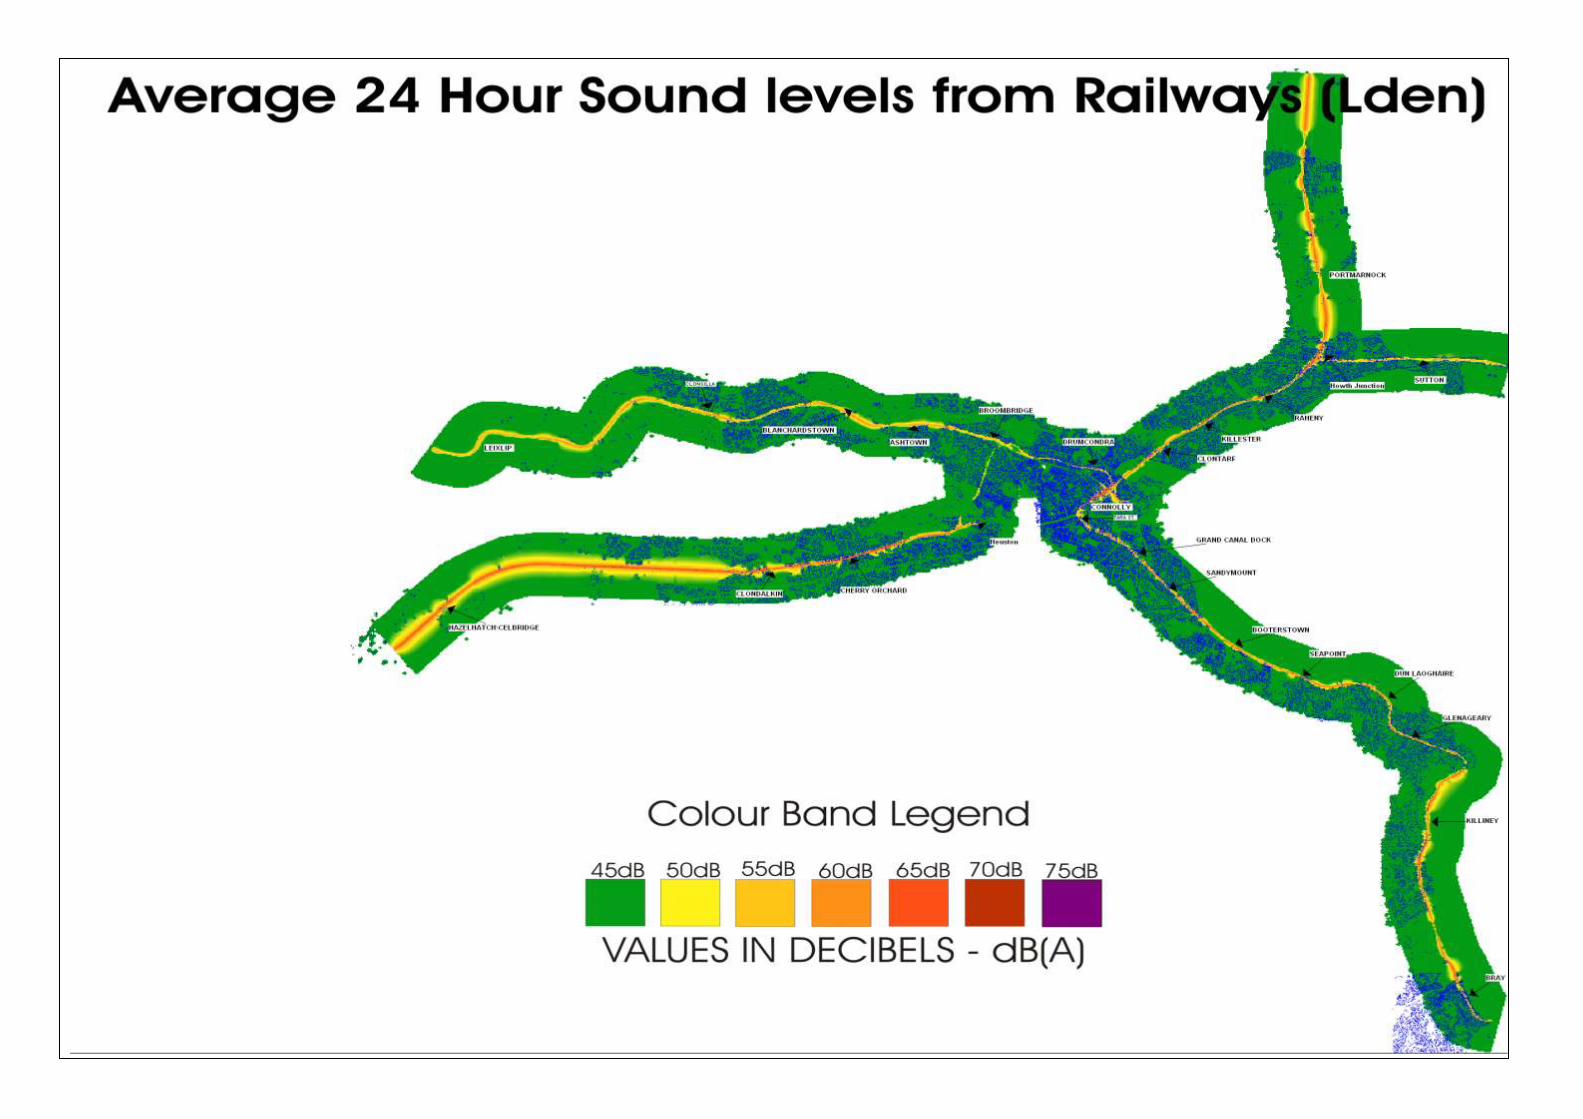
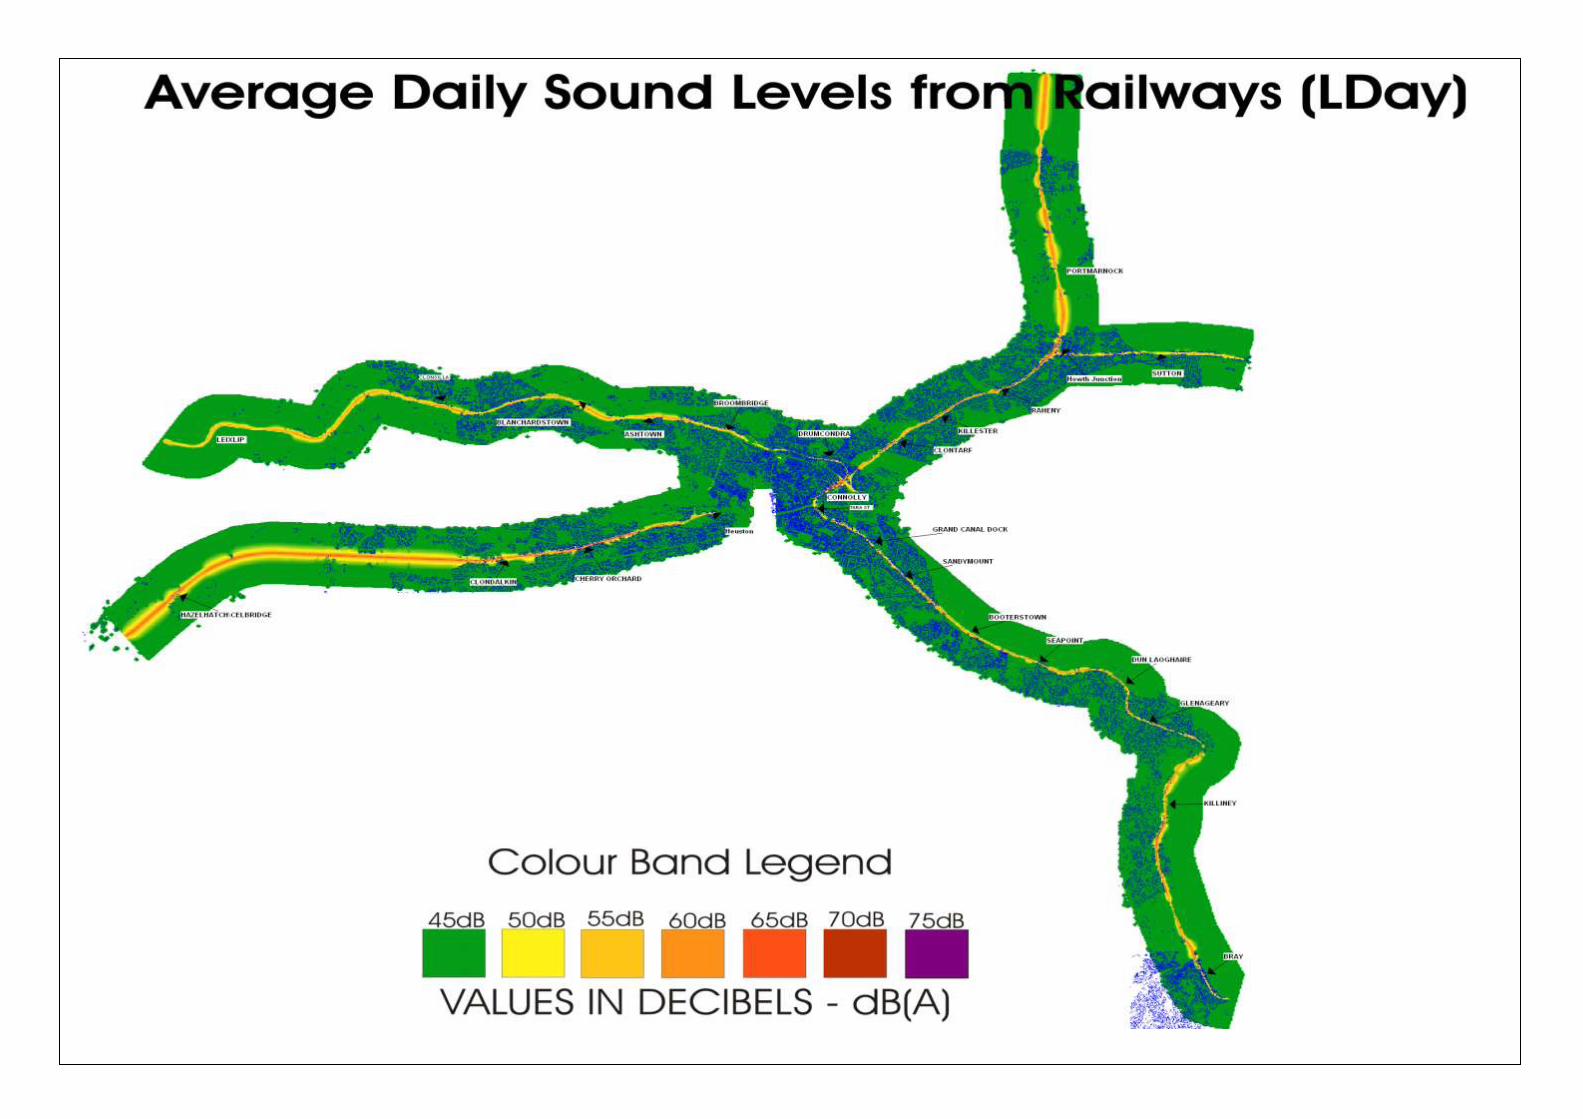
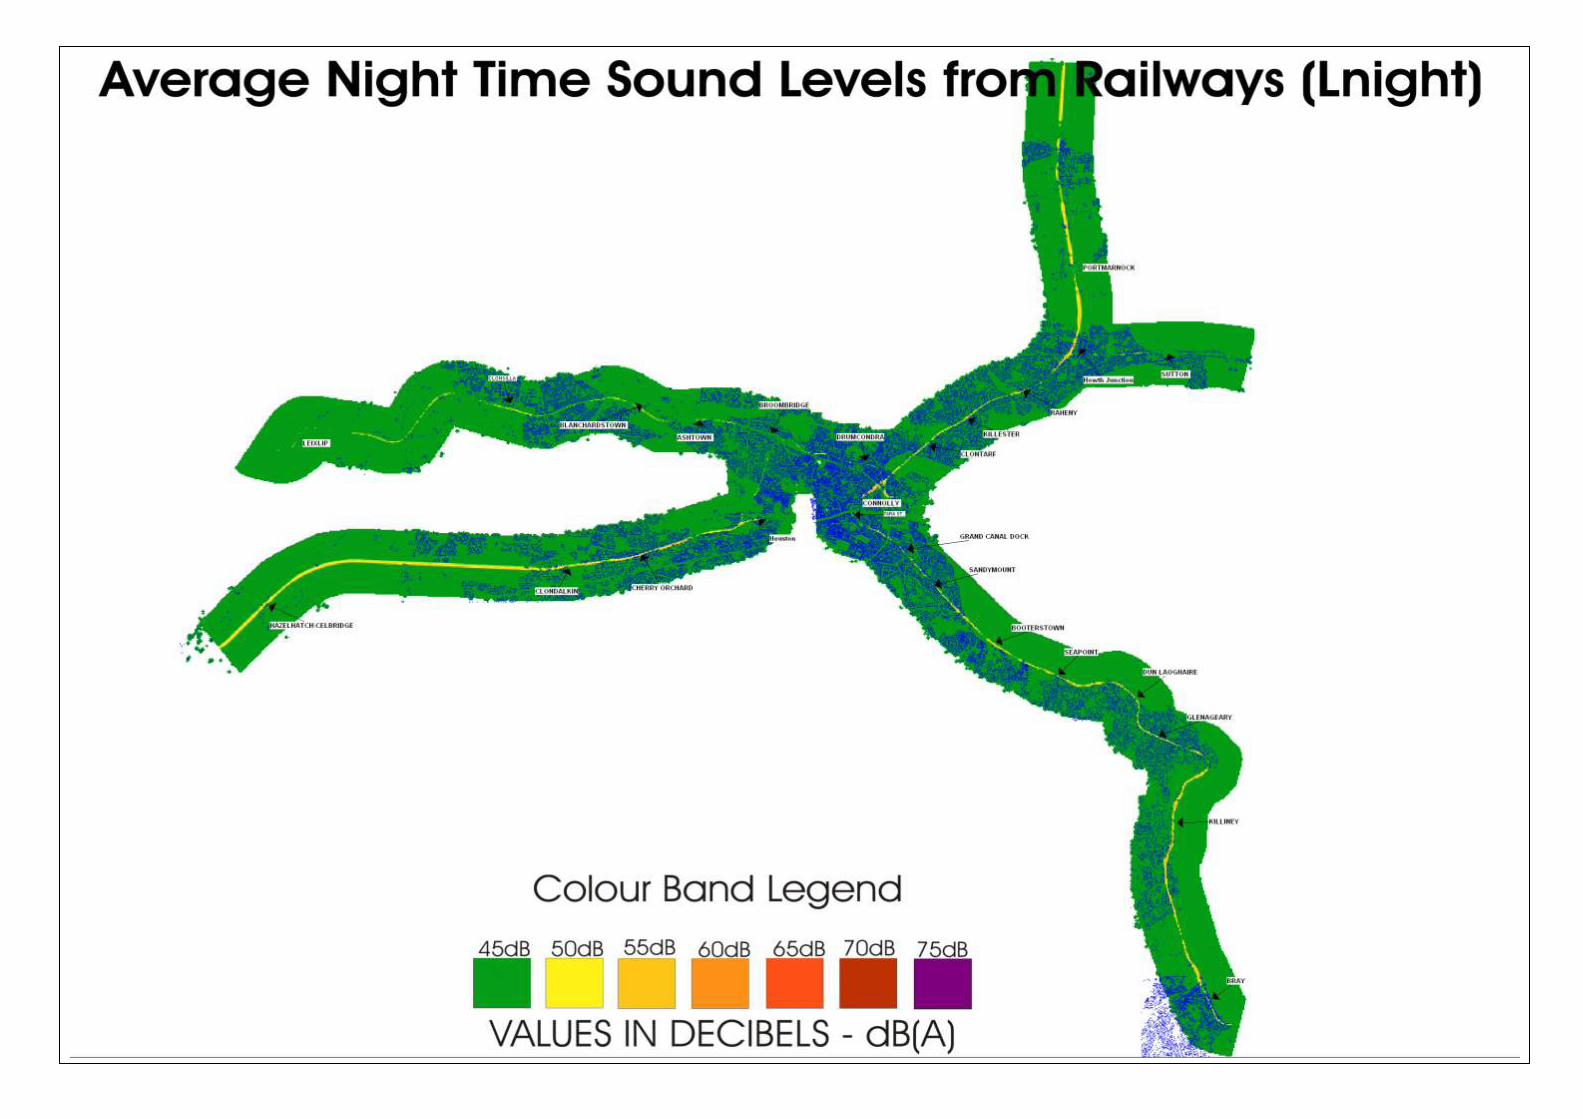
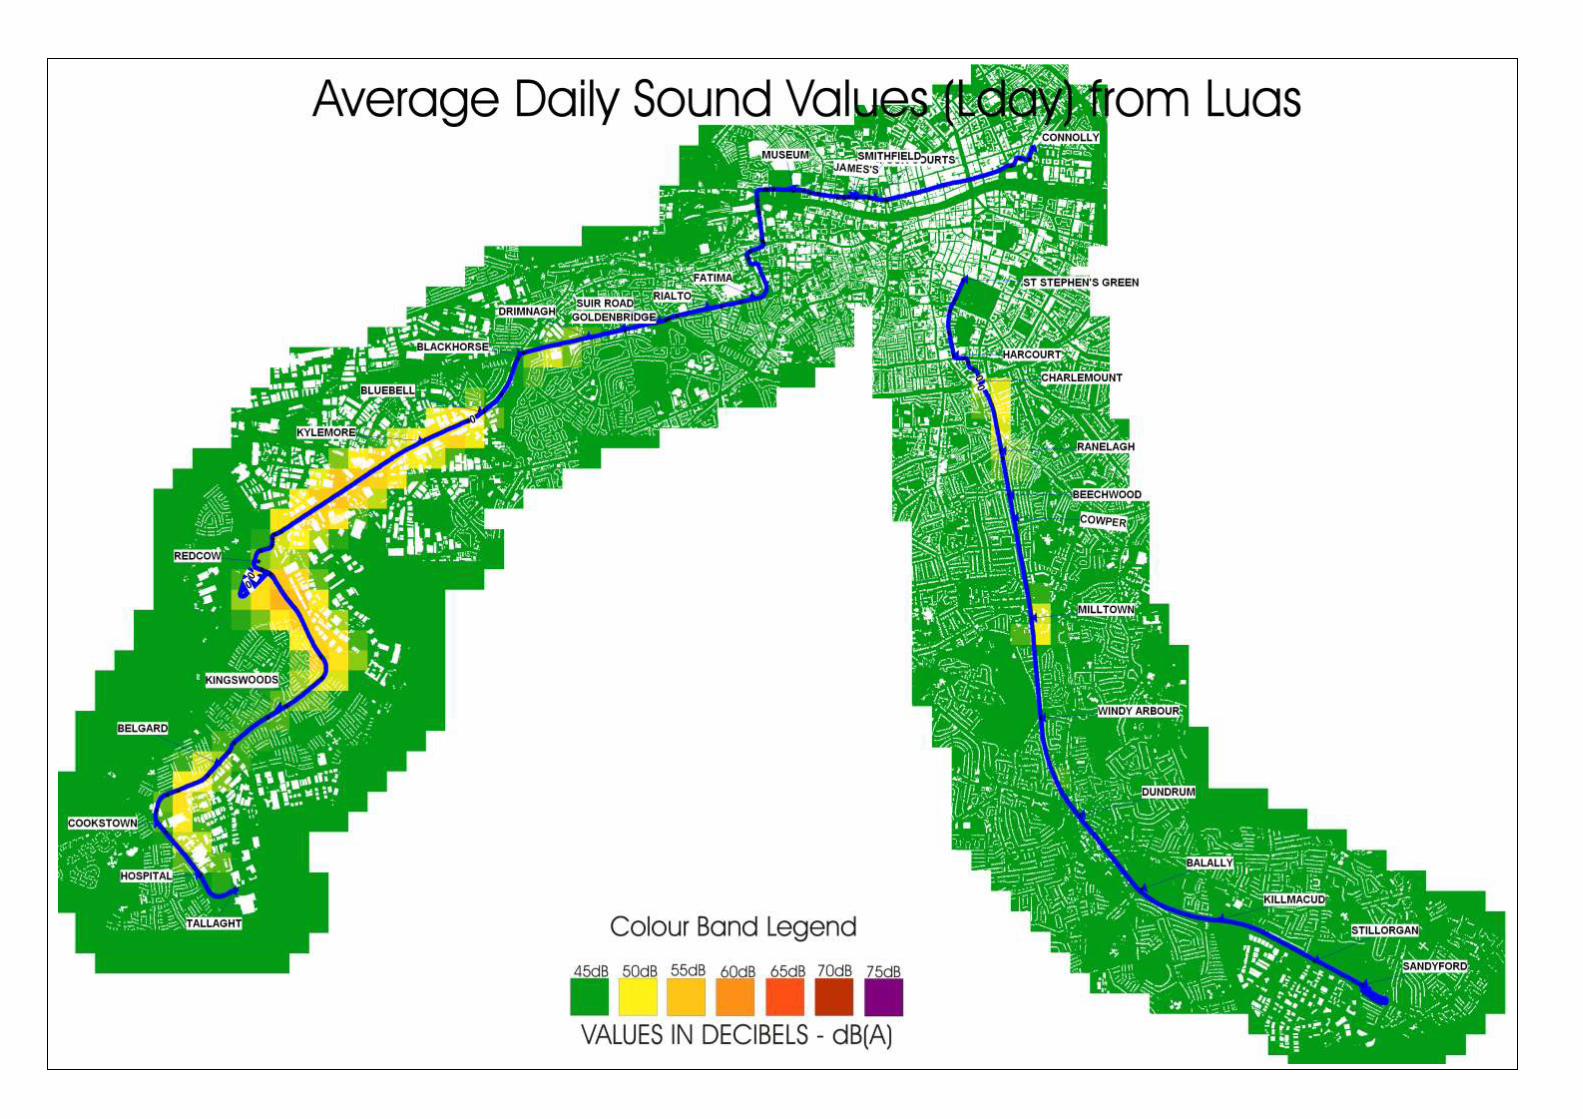
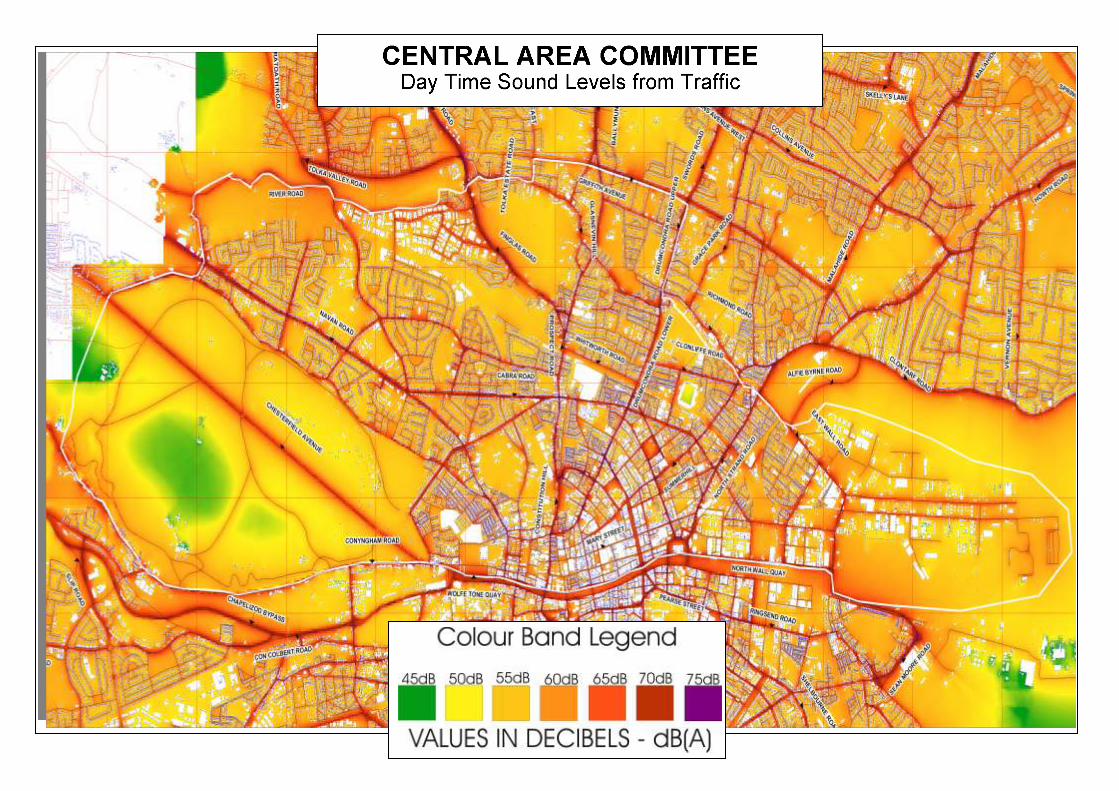
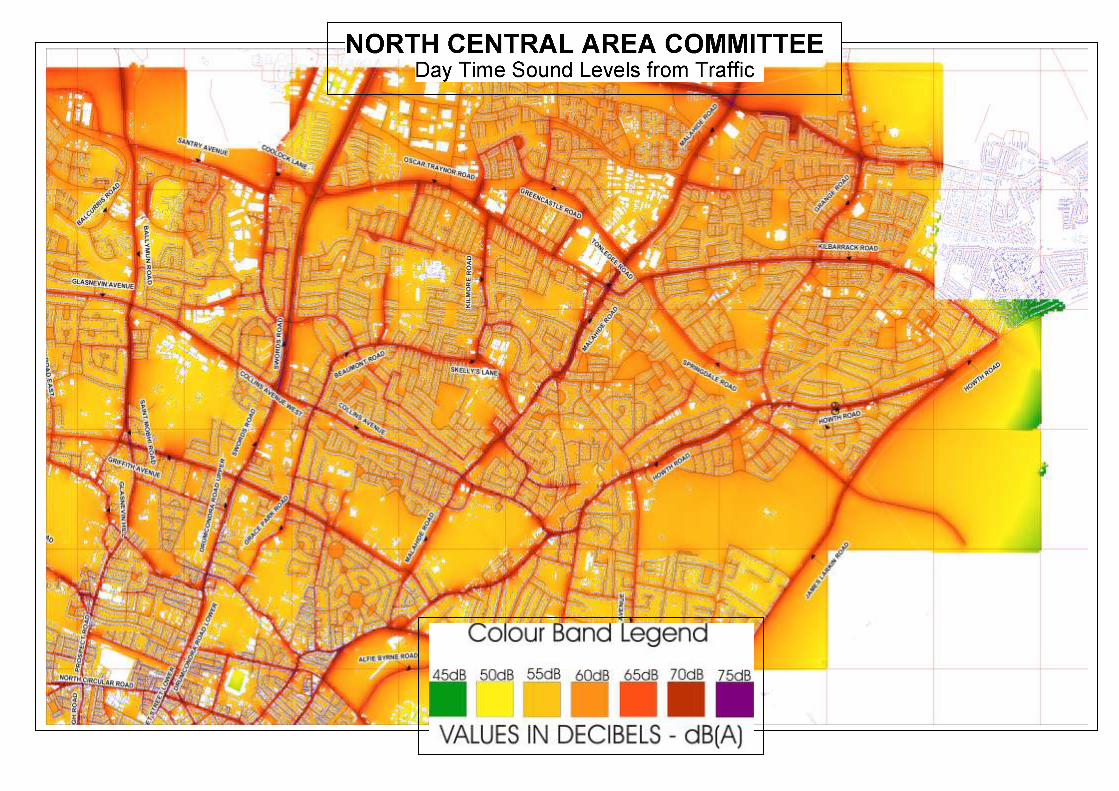
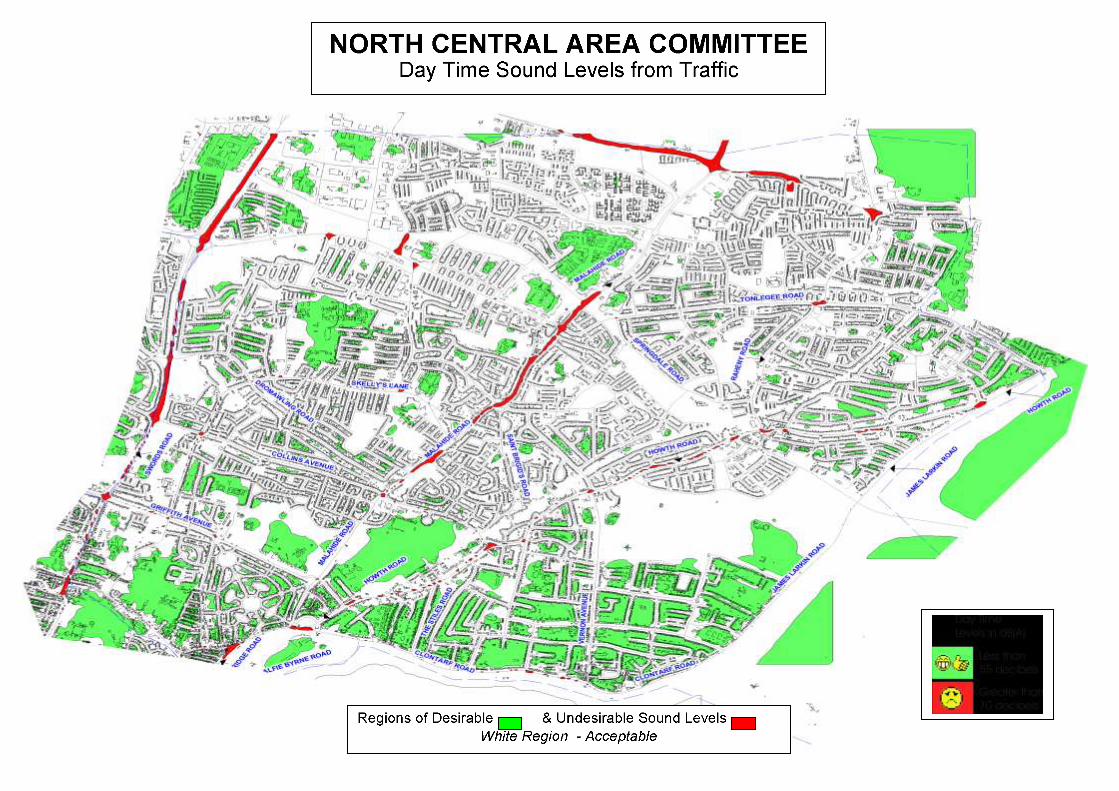
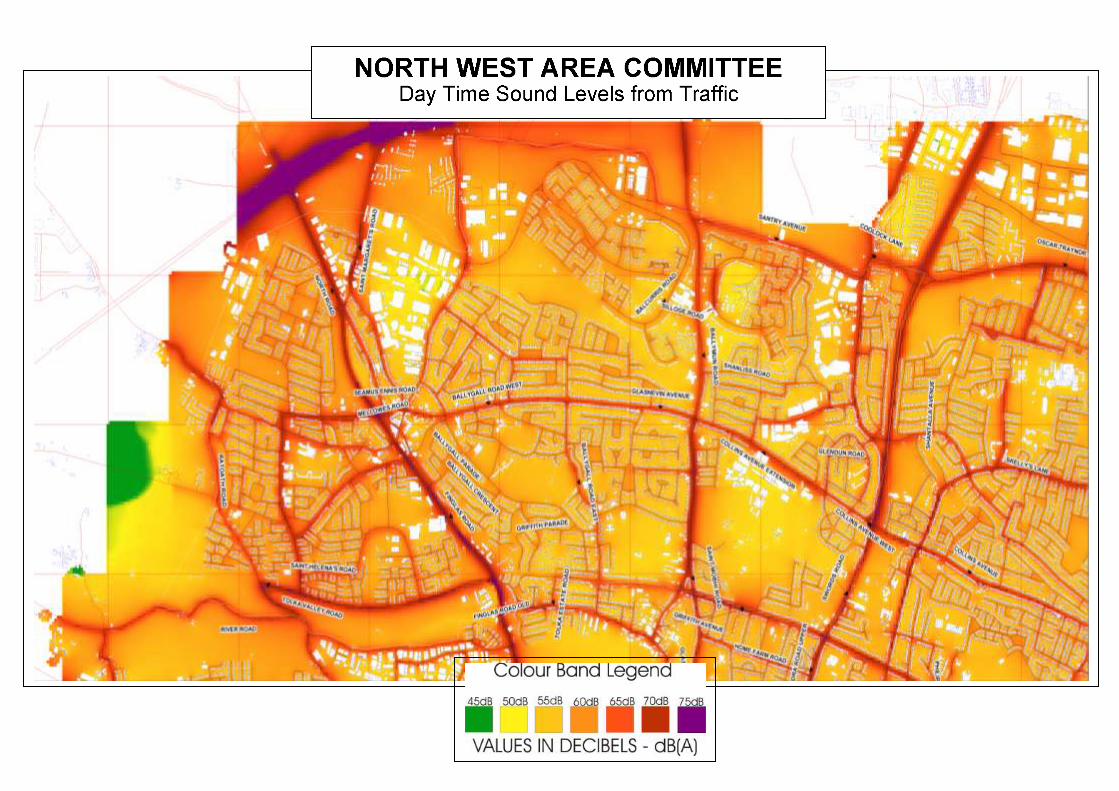
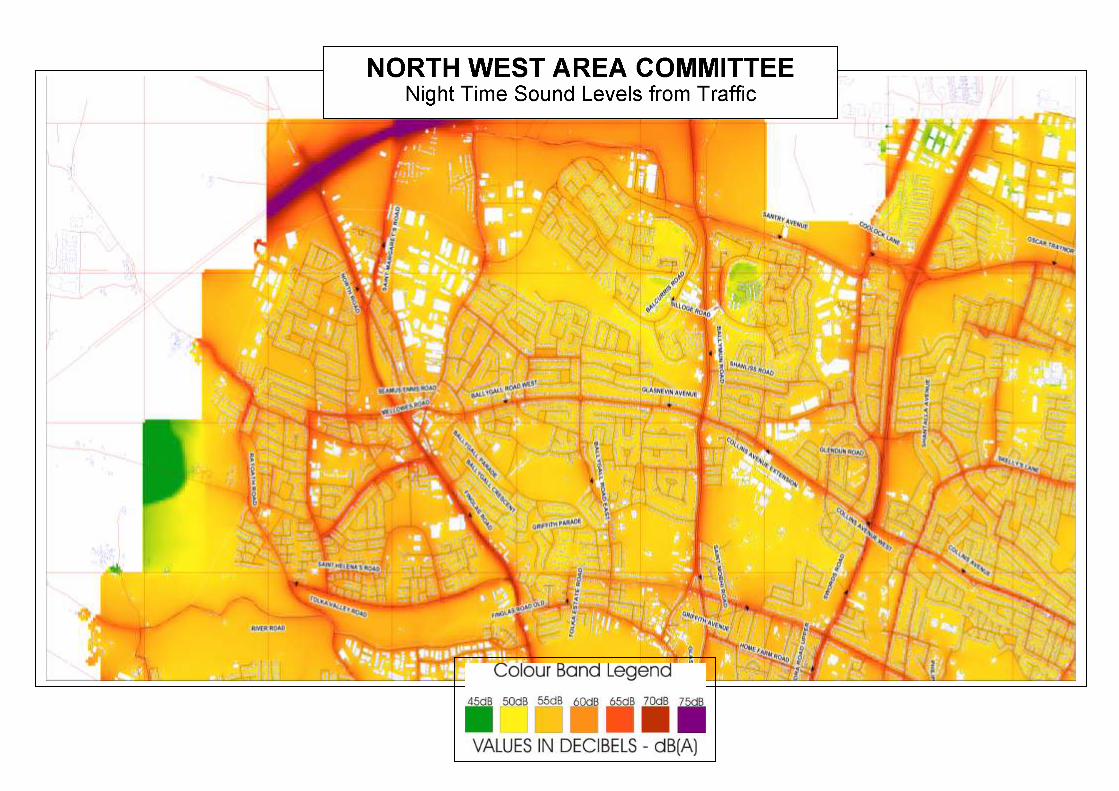
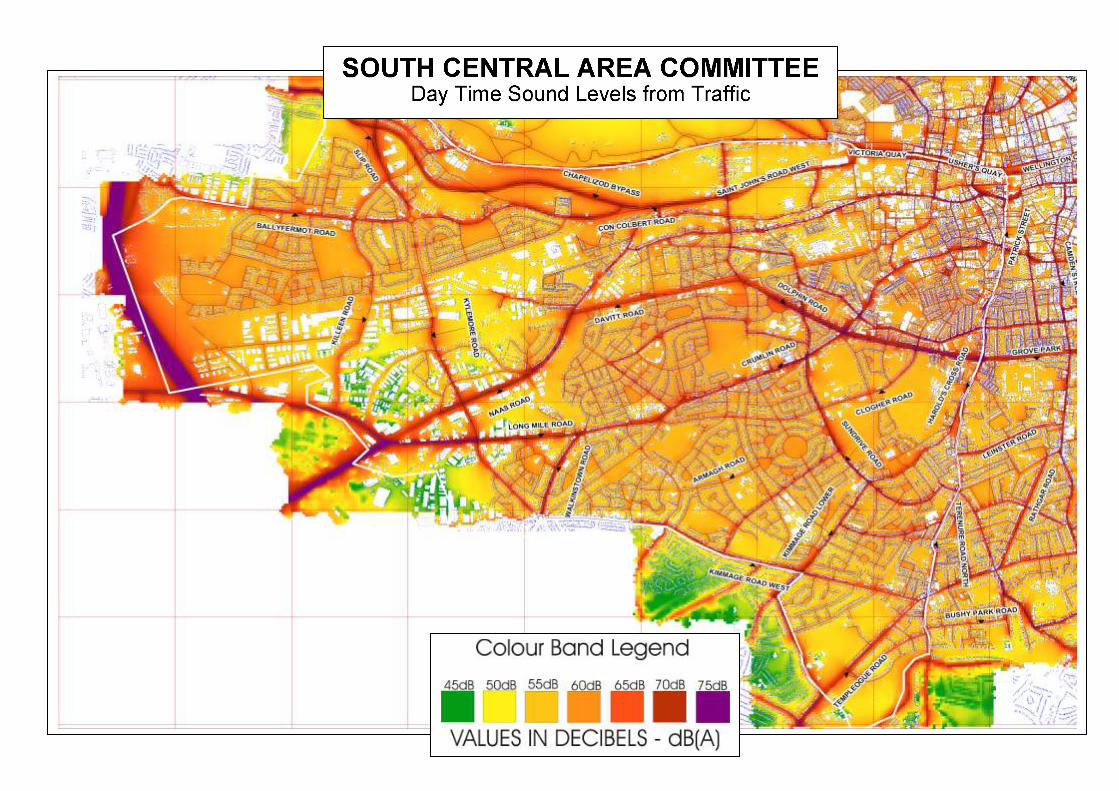
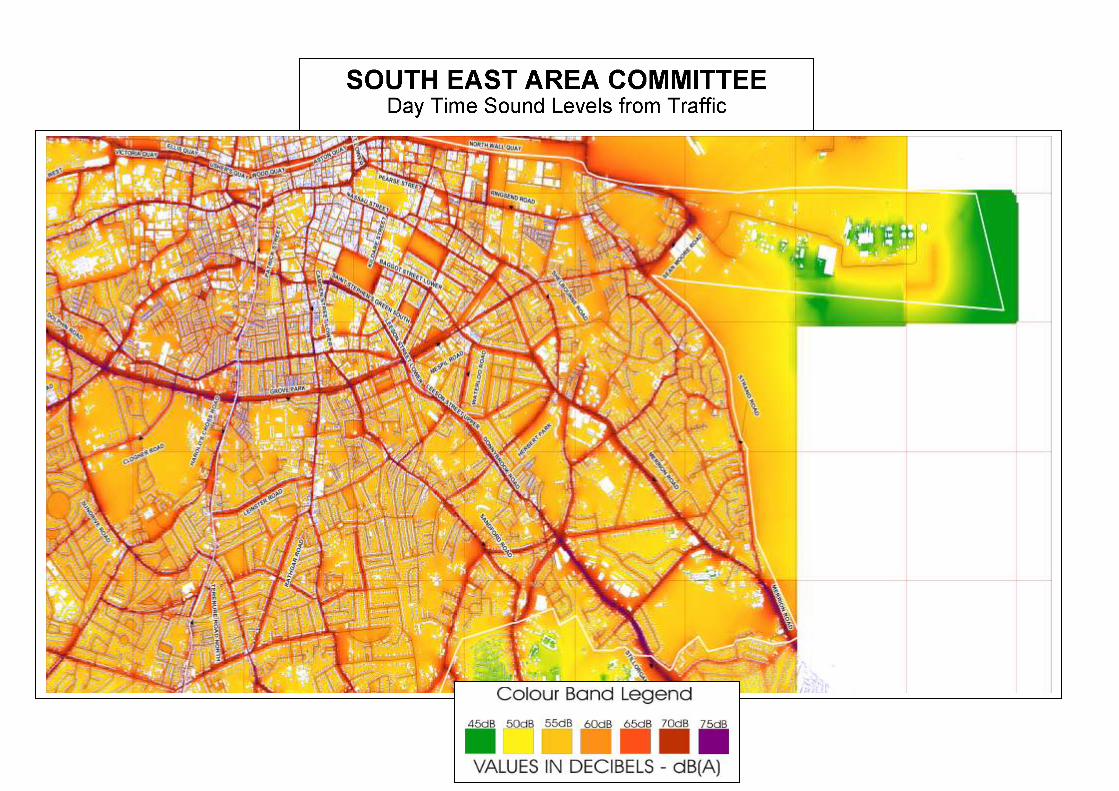
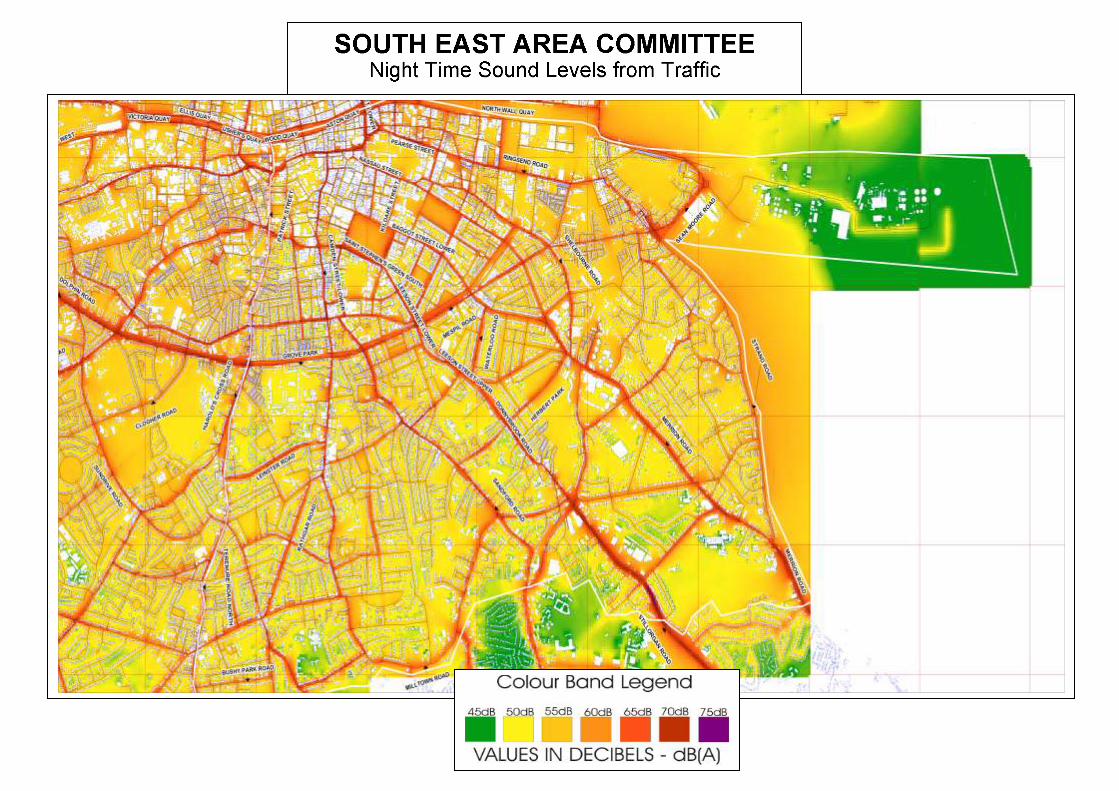
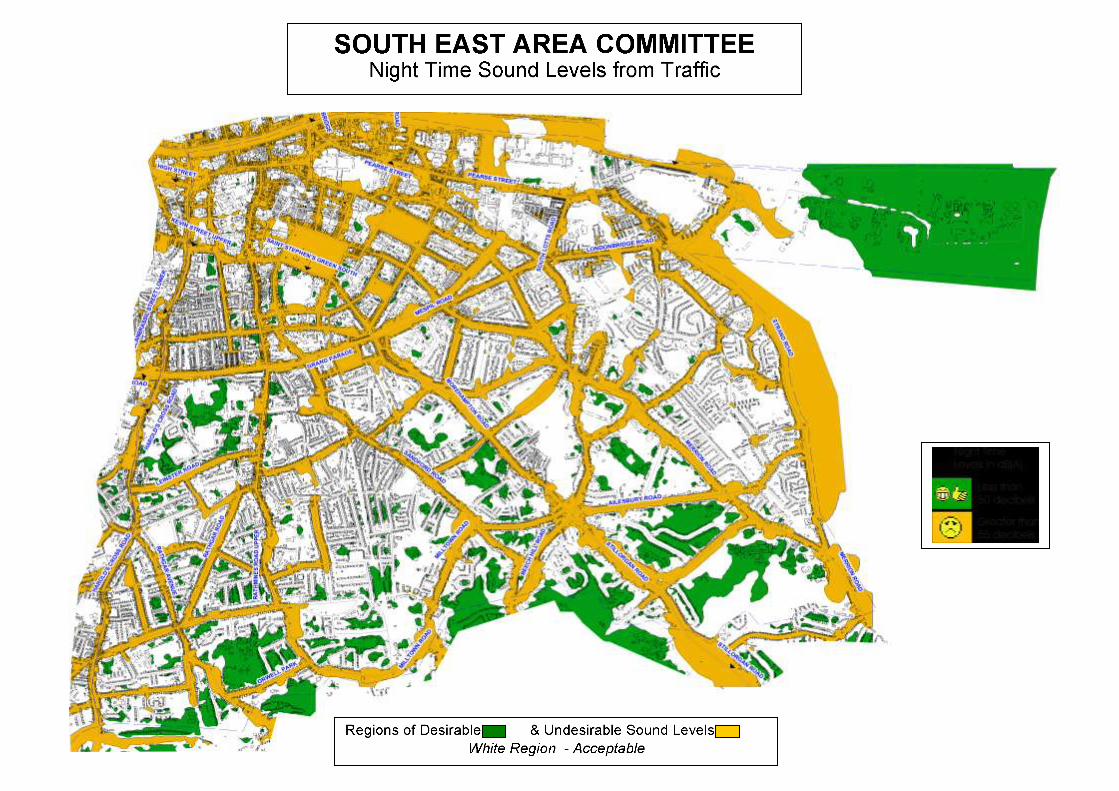
Noise Maps represent a visual expression of sound values throughout the Dublin City Council
region. Matching the colour in the map with the colour in the accompanying legend will give
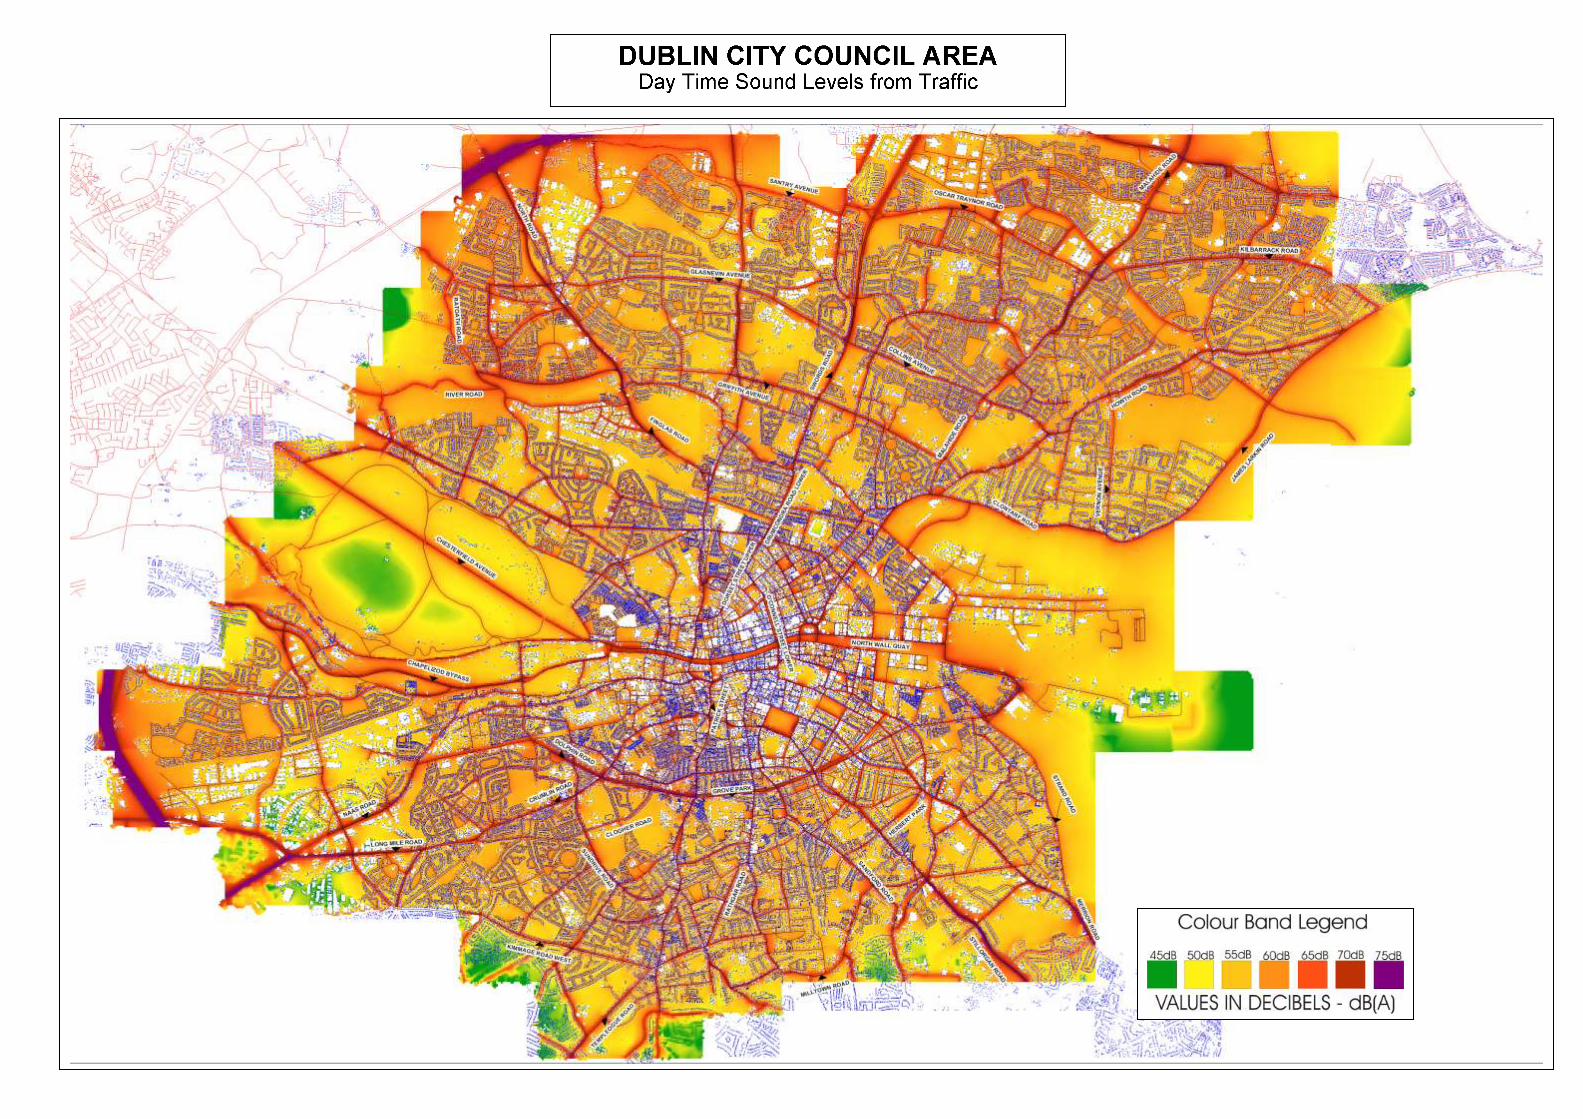
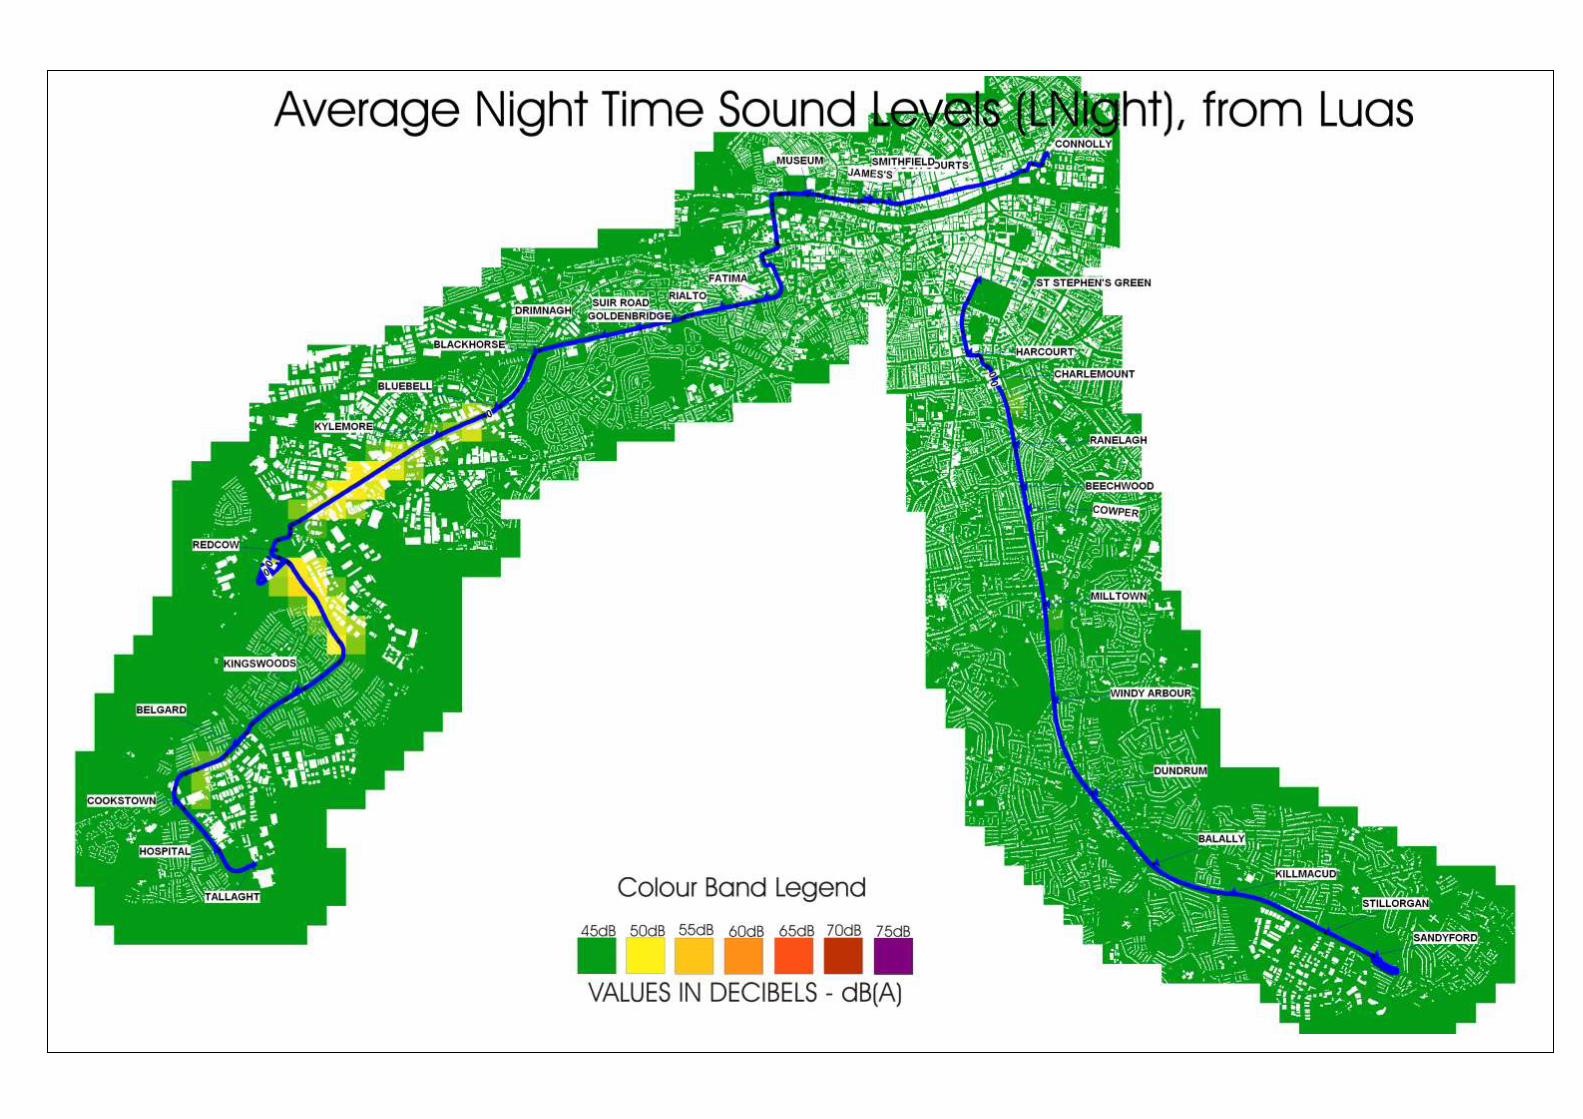
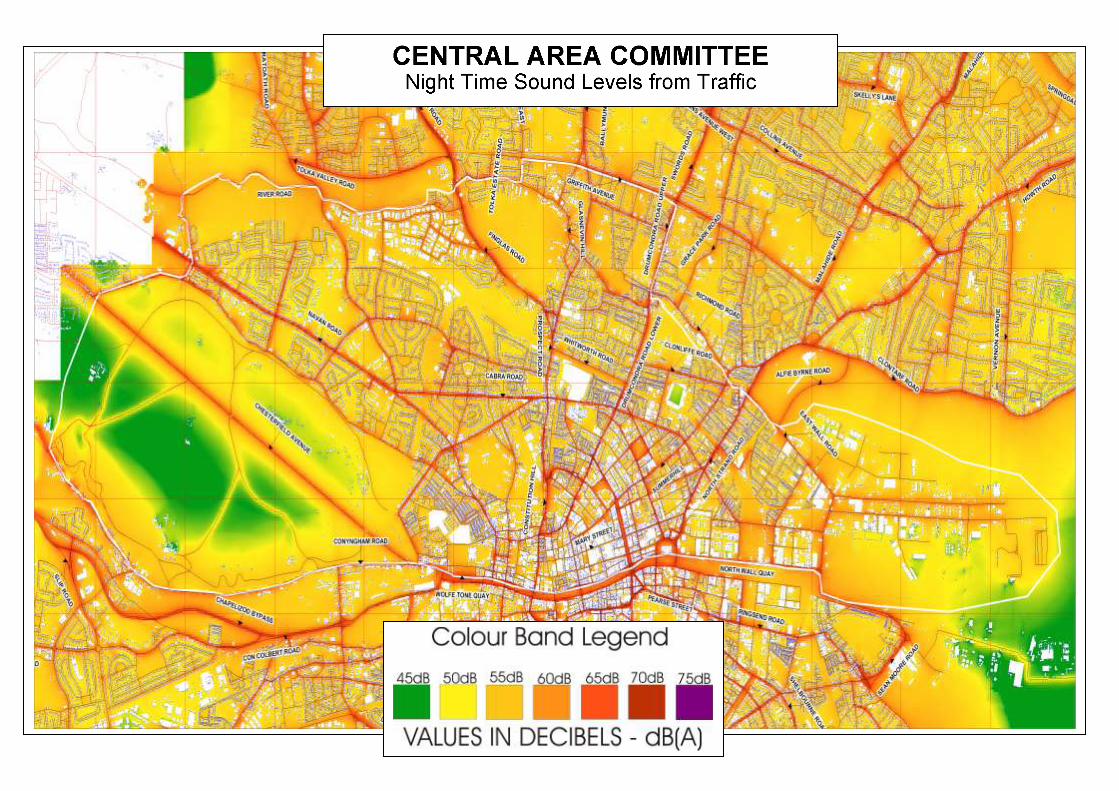
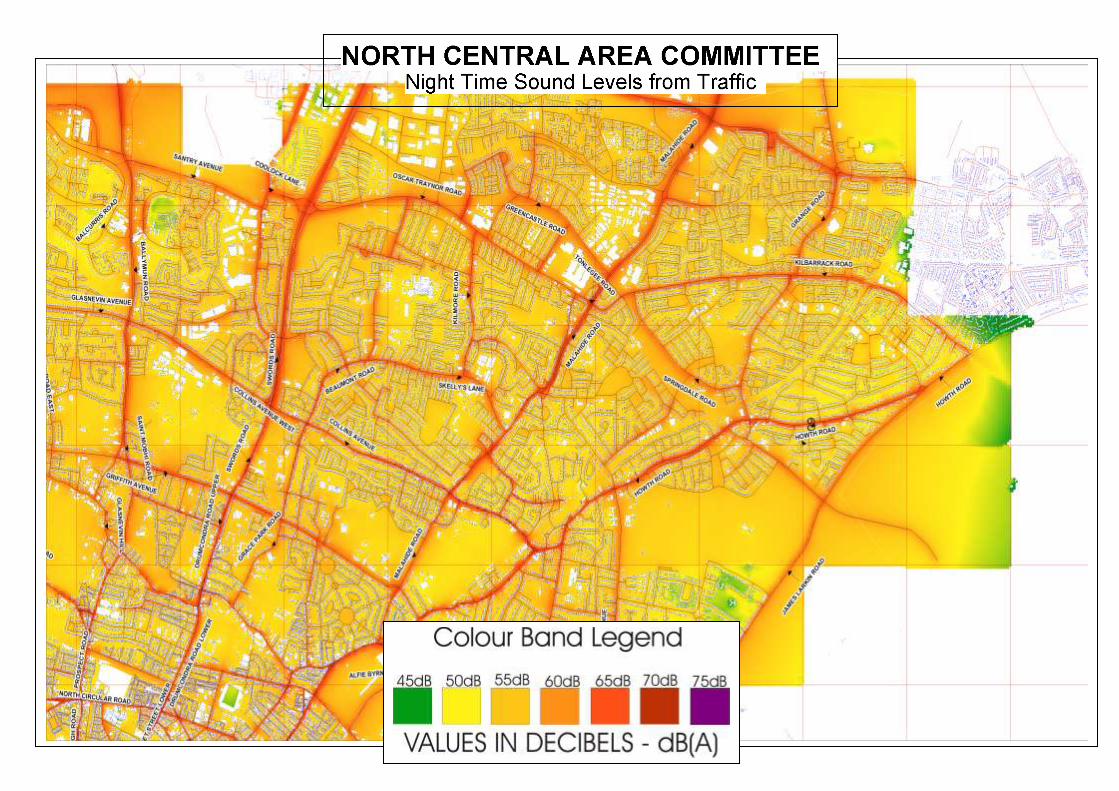
the viewer the sound level band for the location of interest. There are maps for daytime, night
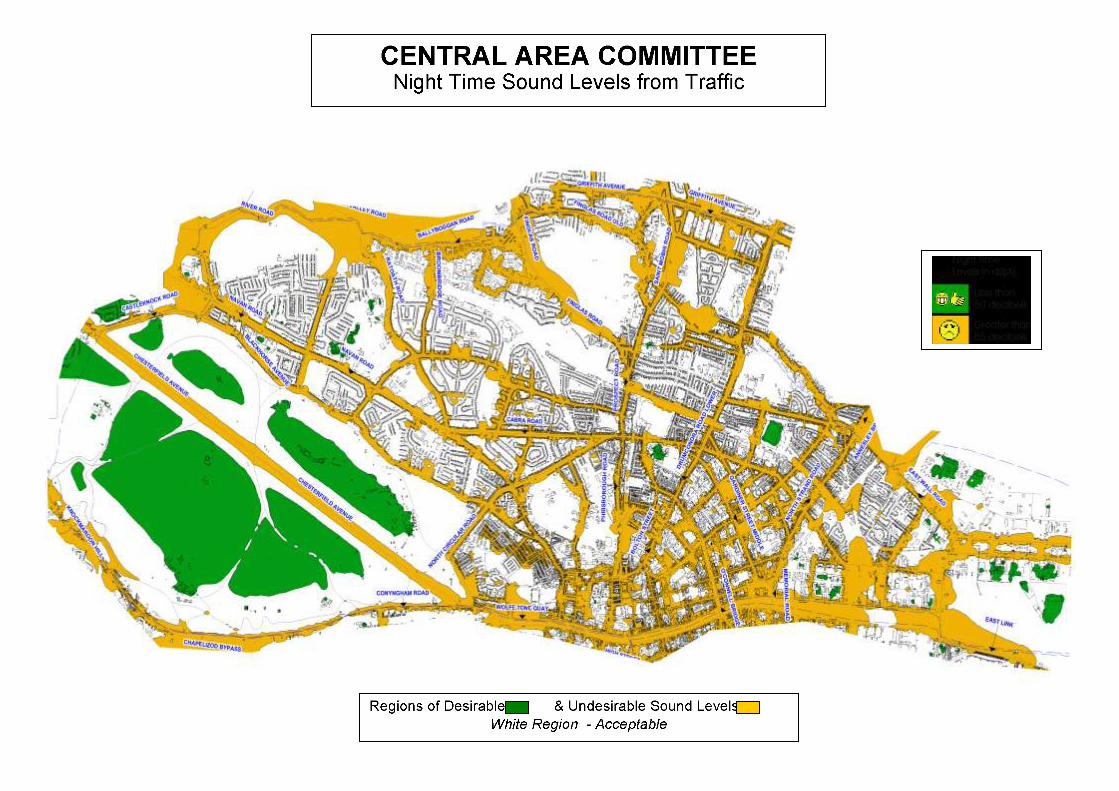
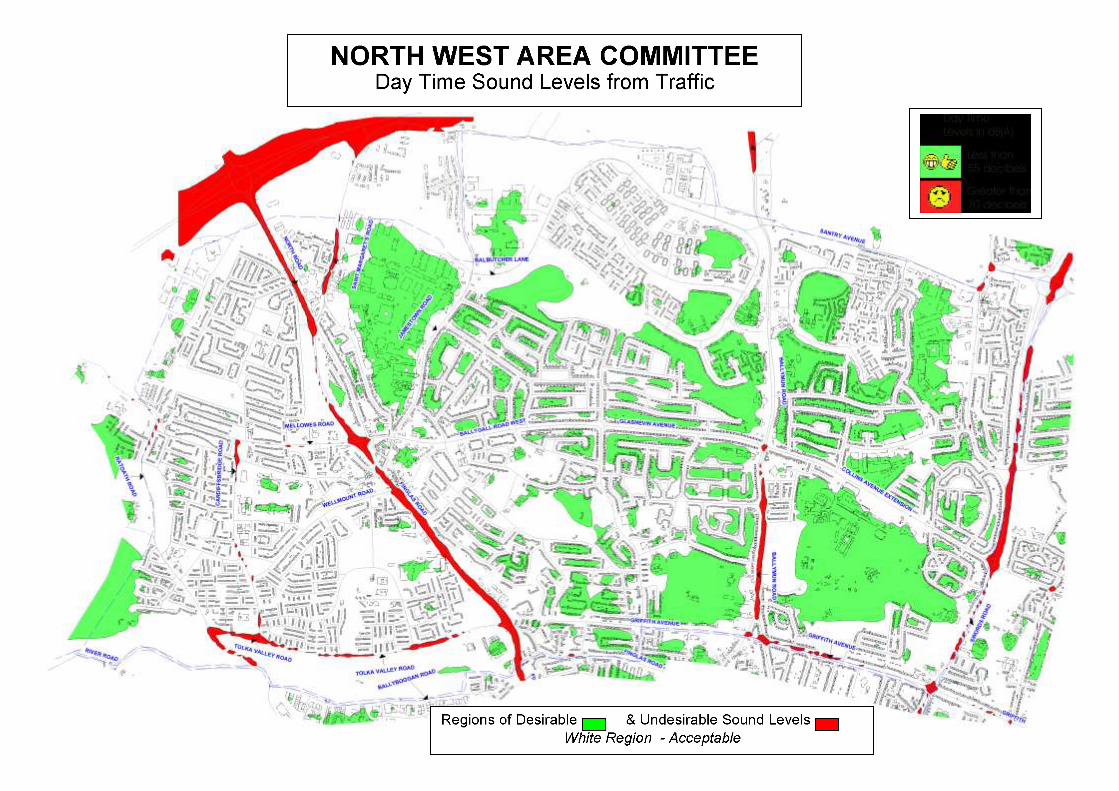
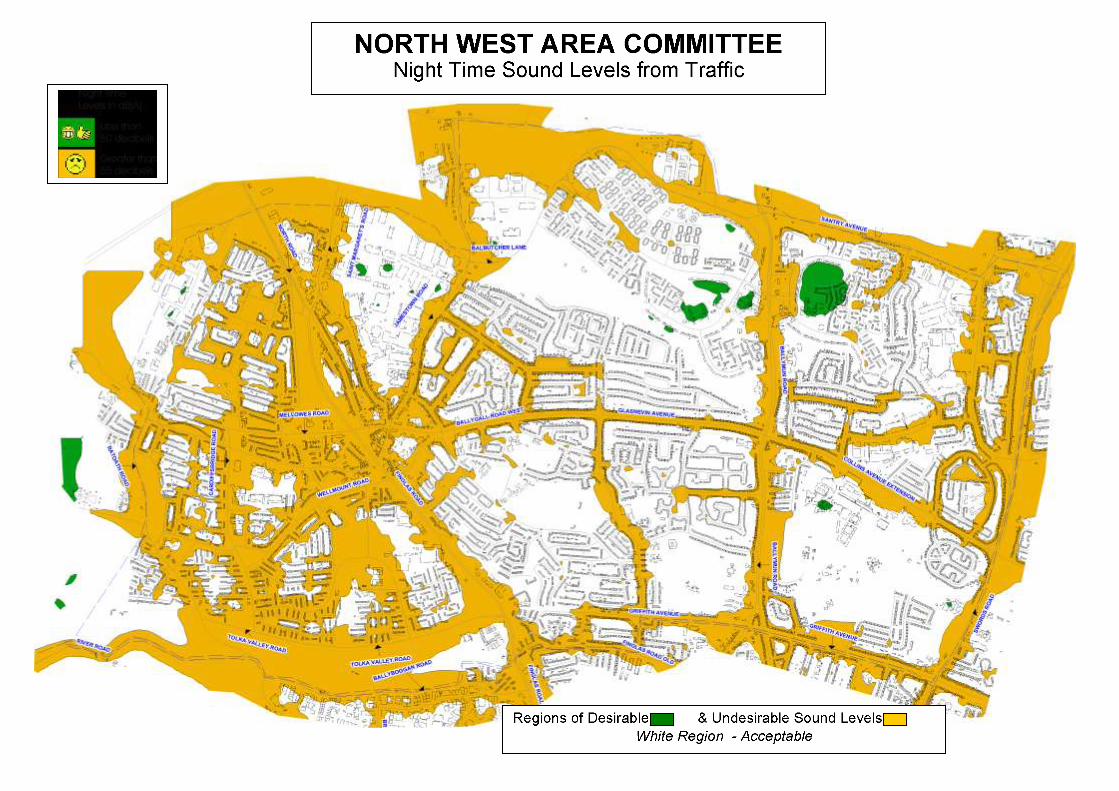
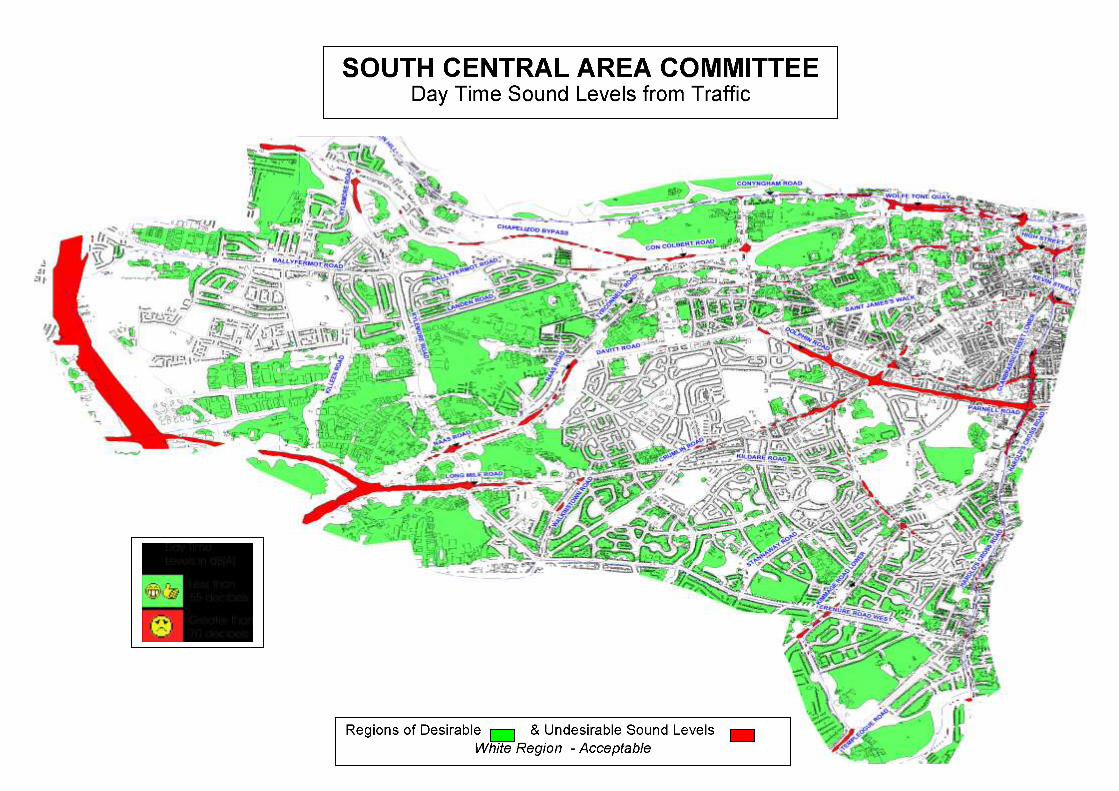
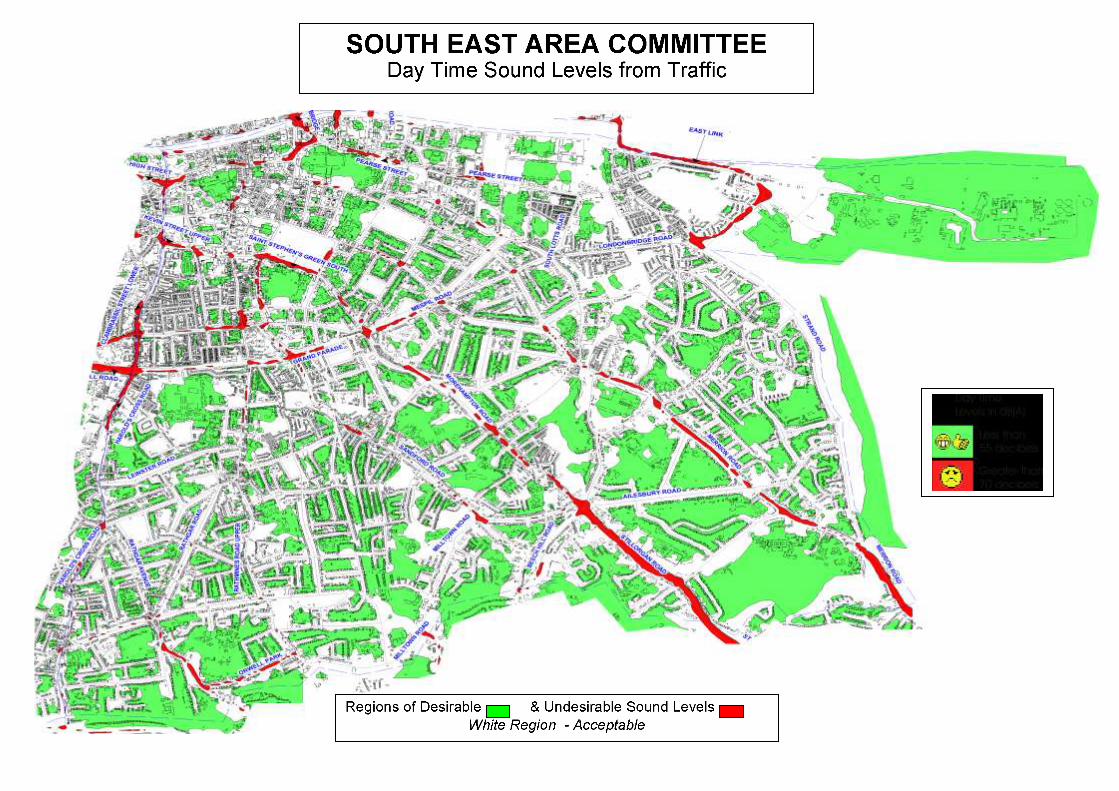
time and 24hr hour (Lden) sound levels. Maps have also been produced for each of the five
local area committee regions showing the locations that are exposed to what could be
considered acceptable, desirable\undesirable sound levels.
Accompanying the maps are tables which list the number of people who are exposed to
sound from the various types of noise sources, in the relevant sound level bands, as set out in
the Environmental Noise Directive.
A very small number of the population (less than 100) within the Dublin City Council region
are being exposed to daytime sound values from the Railway sector that could be deemed to
be undesirable, (<70dB(A)). All of this exposure is due to the sound emissions from the Luas.
There are approximately 4,800 people, or less than 1% of Dublin City Council population
exposed to undesirable night time sound levels, (>55dB(A)). The majority of this exposure is
caused by the Luas (3,100 people). However as sound from road traffic is the dominant
source along the same routes as the Luas, in most of the City Council area, this sound tends
to ‘mask’ the sound from the Luas.
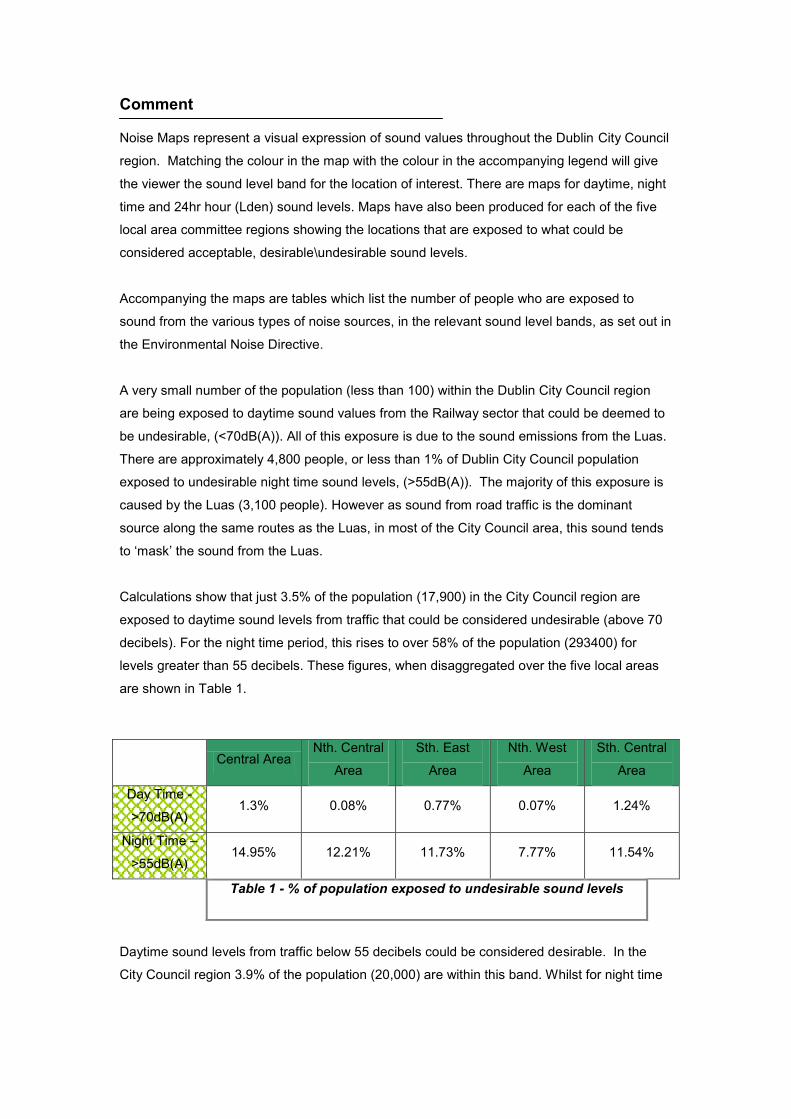
Calculations show that just 3.5% of the population (17,900) in the City Council region are
exposed to daytime sound levels from traffic that could be considered undesirable (above 70
decibels). For the night time period, this rises to over 58% of the population (293400) for
levels greater than 55 decibels. These figures, when disaggregated over the five local areas
are shown in Table 1.
Daytime sound levels from traffic below 55 decibels could be considered desirable. In the
City Council region 3.9% of the population (20,000) are within this band. Whilst for night time
Central Area
Nth. Central
Area
Sth. East
Area
Nth. West
Area
Sth. Central
Area
Day Time -
>70dB(A) 1.3% 0.08% 0.77% 0.07% 1.24%
Night Time –
>55dB(A) 14.95% 12.21% 11.73% 7.77% 11.54%
Table 1 - % of population exposed to undesirable sound levels
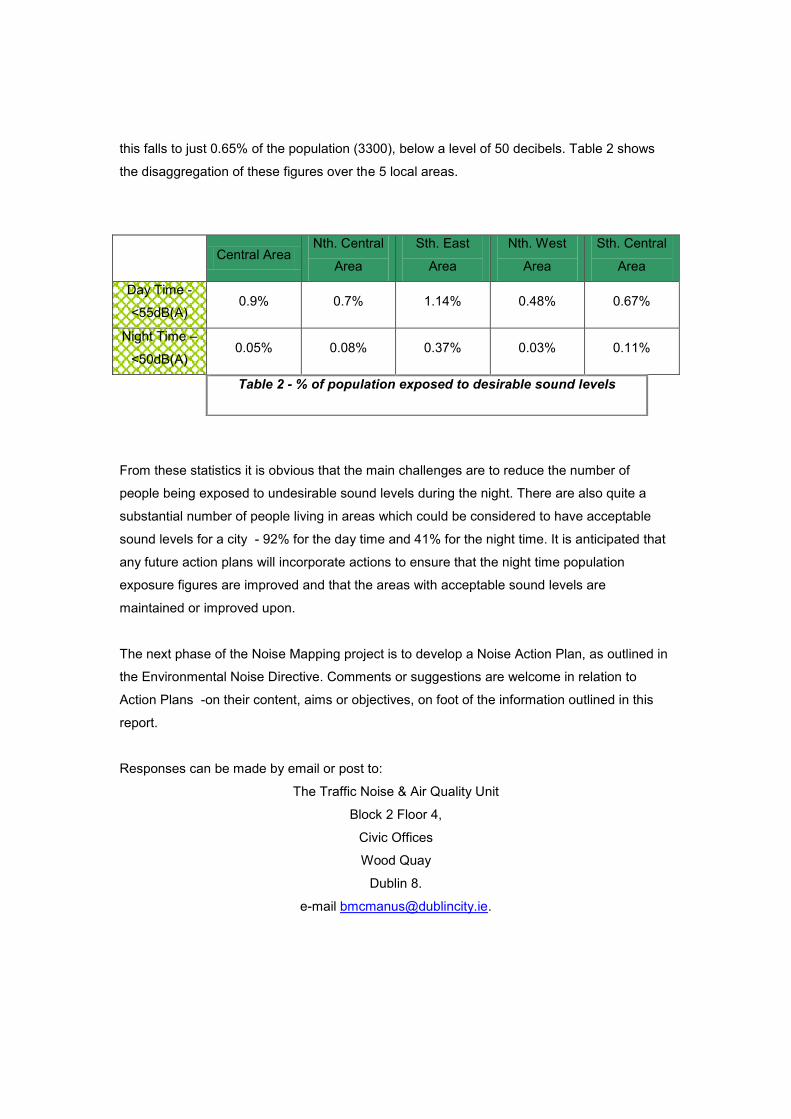
this falls to just 0.65% of the population (3300), below a level of 50 decibels. Table 2 shows
the disaggregation of these figures over the 5 local areas.
From these statistics it is obvious that the main challenges are to reduce the number of
people being exposed to undesirable sound levels during the night. There are also quite a
substantial number of people living in areas which could be considered to have acceptable
sound levels for a city - 92% for the day time and 41% for the night time. It is anticipated that
any future action plans will incorporate actions to ensure that the night time population
exposure figures are improved and that the areas with acceptable sound levels are
maintained or improved upon.
The next phase of the Noise Mapping project is to develop a Noise Action Plan, as outlined in
the Environmental Noise Directive. Comments or suggestions are welcome in relation to
Action Plans -on their content, aims or objectives, on foot of the information outlined in this
report.
Responses can be made by email or post to:
The Traffic Noise & Air Quality Unit
Block 2 Floor 4,
Civic Offices
Wood Quay
Dublin 8.
e-mail [email protected].
Central Area
Nth. Central
Area
Sth. East
Area
Nth. West
Area
Sth. Central
Area
Day Time -
<55dB(A) 0.9% 0.7% 1.14% 0.48% 0.67%
Night Time –
<50dB(A) 0.05% 0.08% 0.37% 0.03% 0.11%
Table 2 - % of population exposed to desirable sound levels

ANNEX 1 Dublin City Council
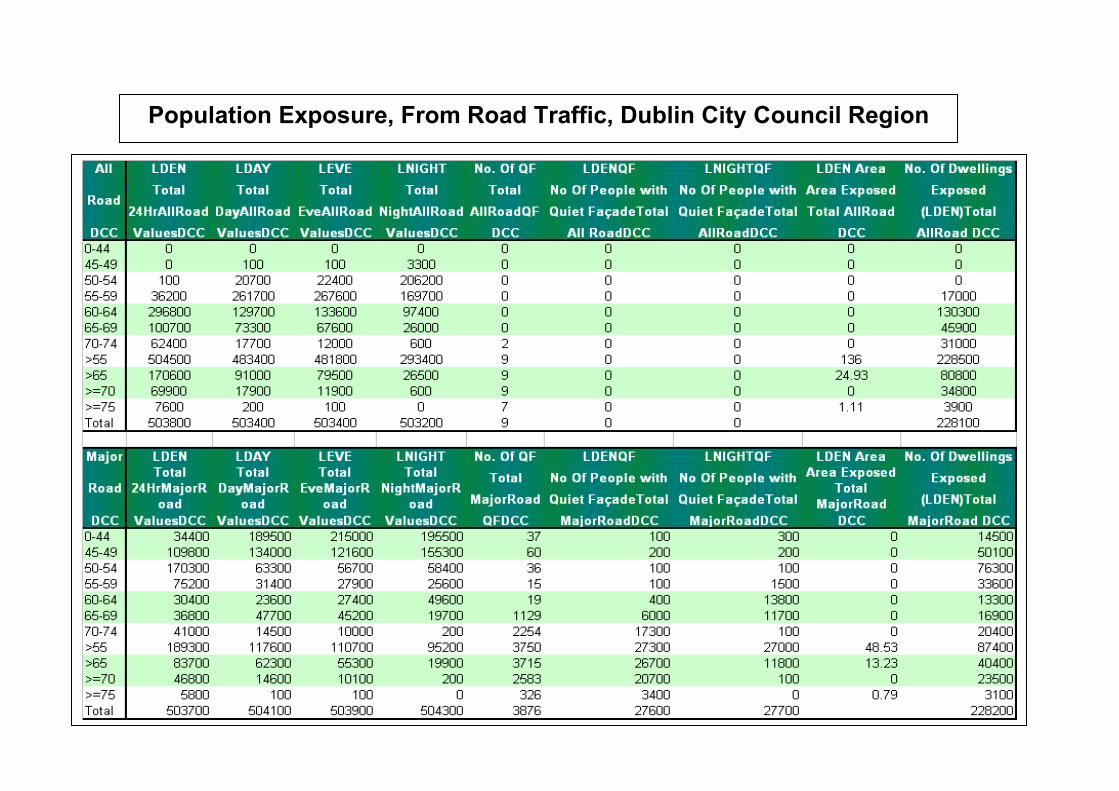
Population Exposure, From Road Traffic, Dublin City Council Region
ANNEX 2 Dublin City Council
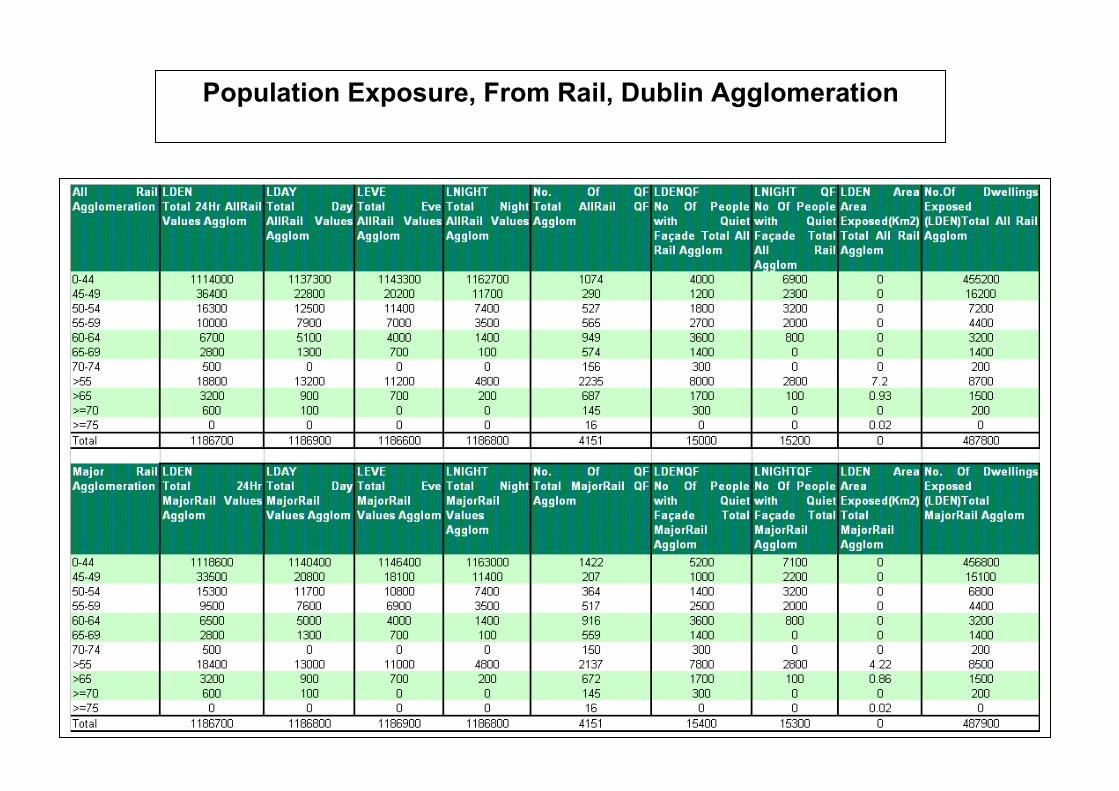
Population Exposure, From Rail, Dublin Agglomeration
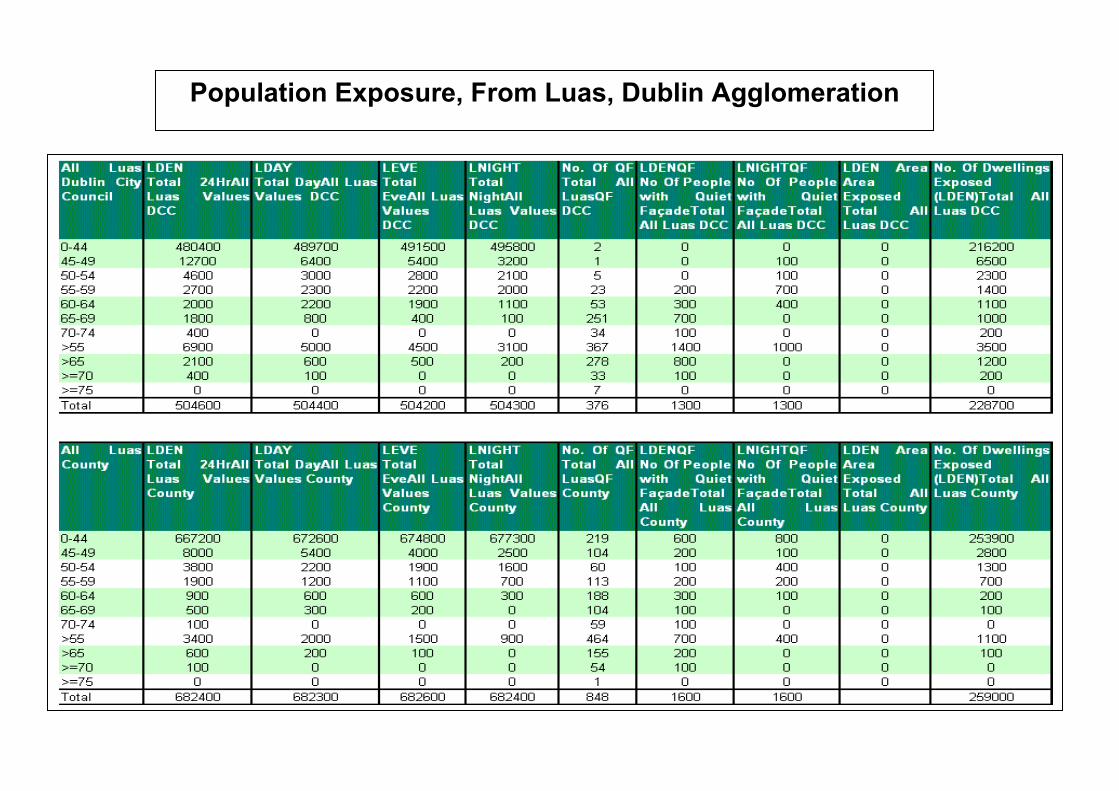
Population Exposure, From Luas, Dublin Agglomeration

ANNEX 3 Central Area Committee Noise Maps and Tables
For Road Traffic
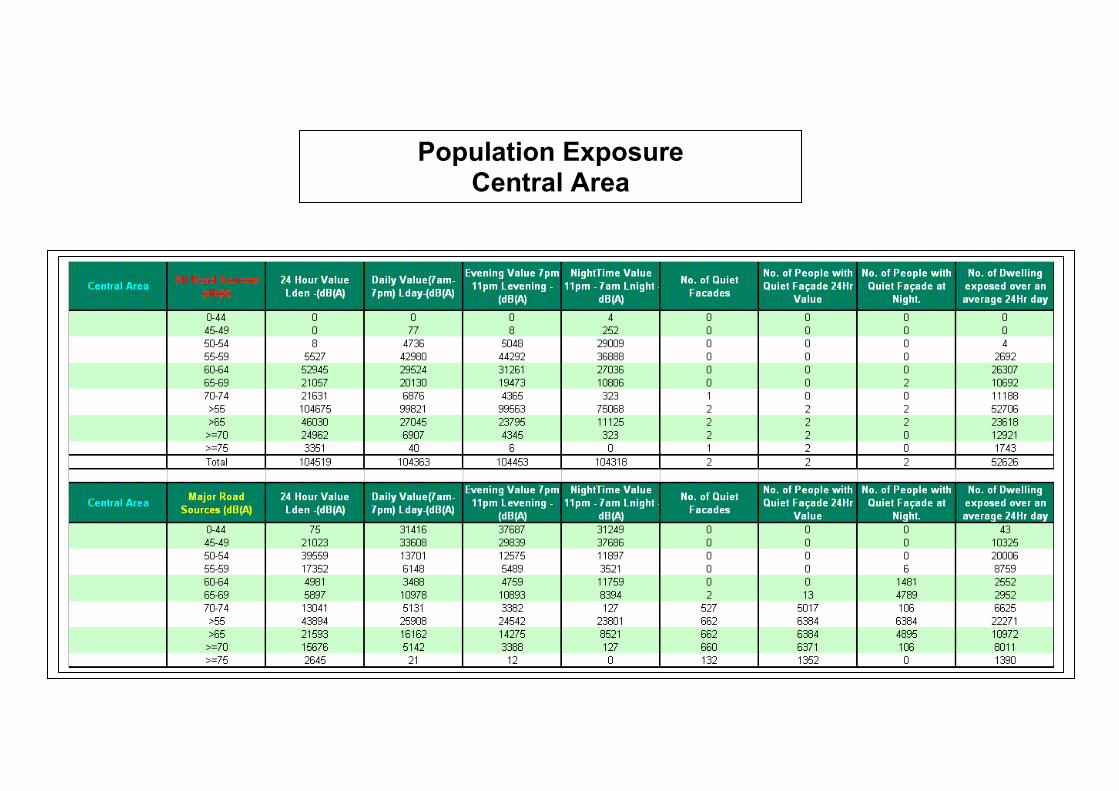
Population Exposure Central Area

ANNEX 4 North Central Area Committee
Noise Maps and Tables
For Road Traffic
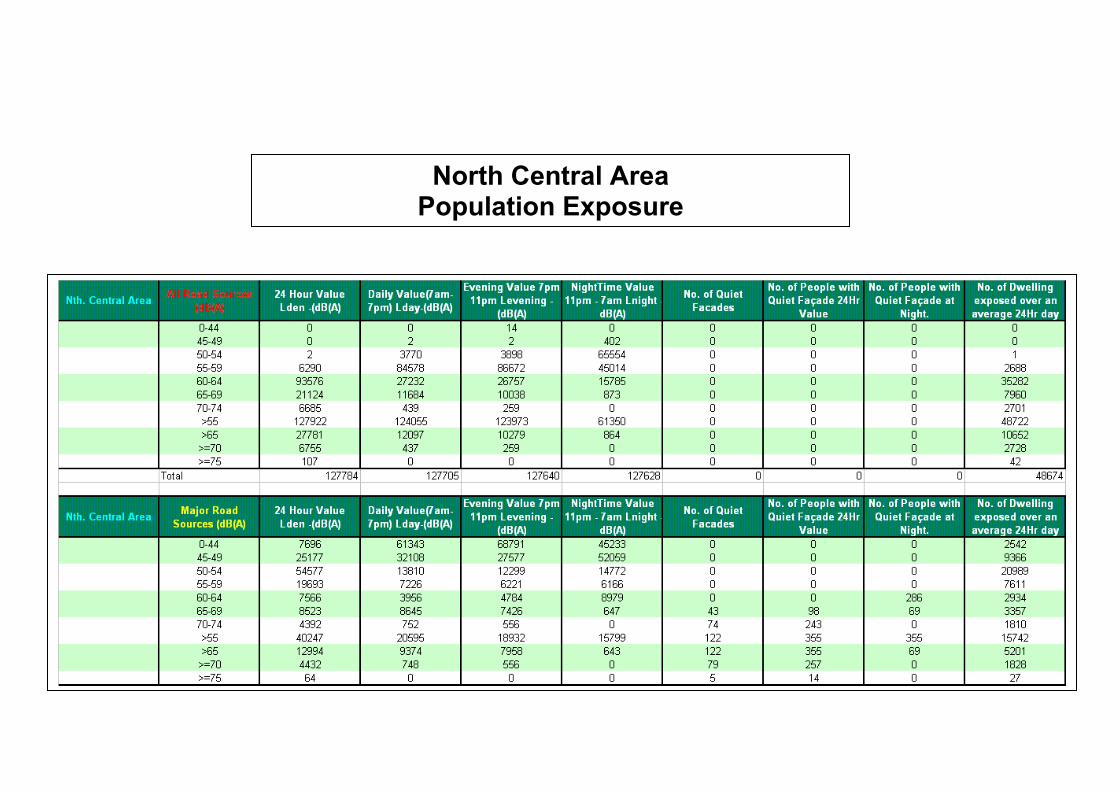
North Central Area Population Exposure

ANNEX 5 North West Area Committee
Noise Maps and Tables For Road Traffic
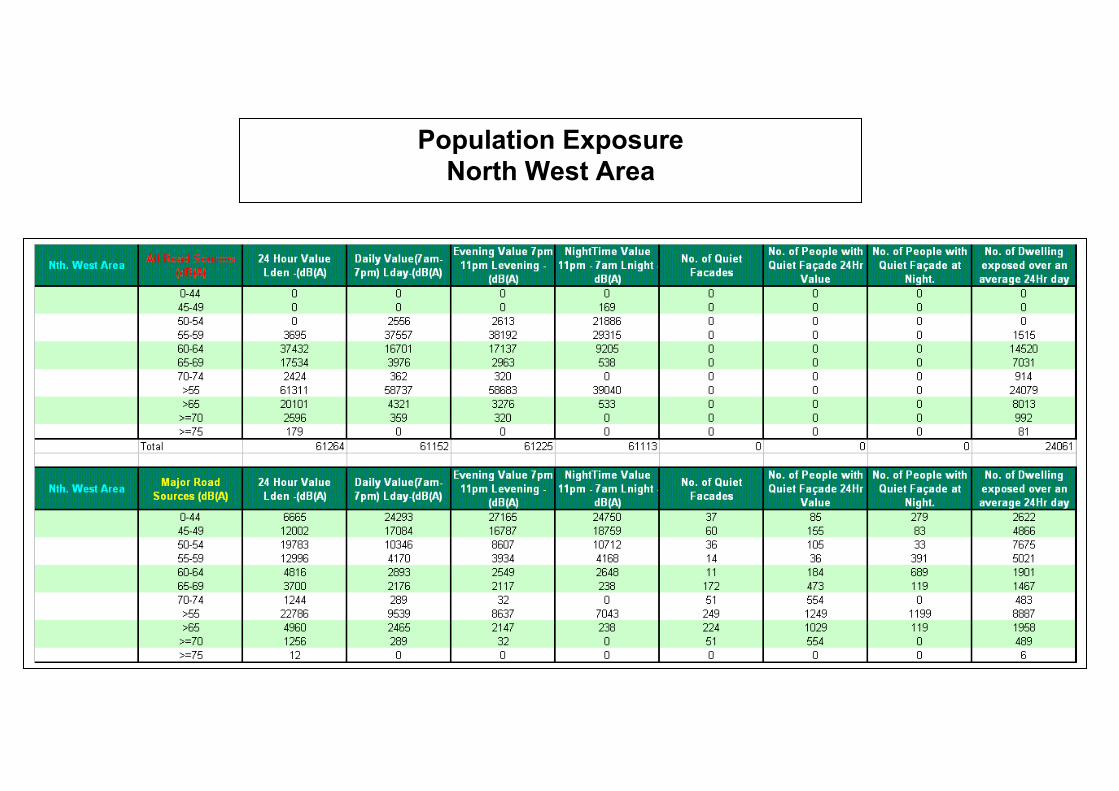
Population Exposure
North West Area
ANNEX 6
South Central Area Committee Noise Maps and Tables
For Road Traffic
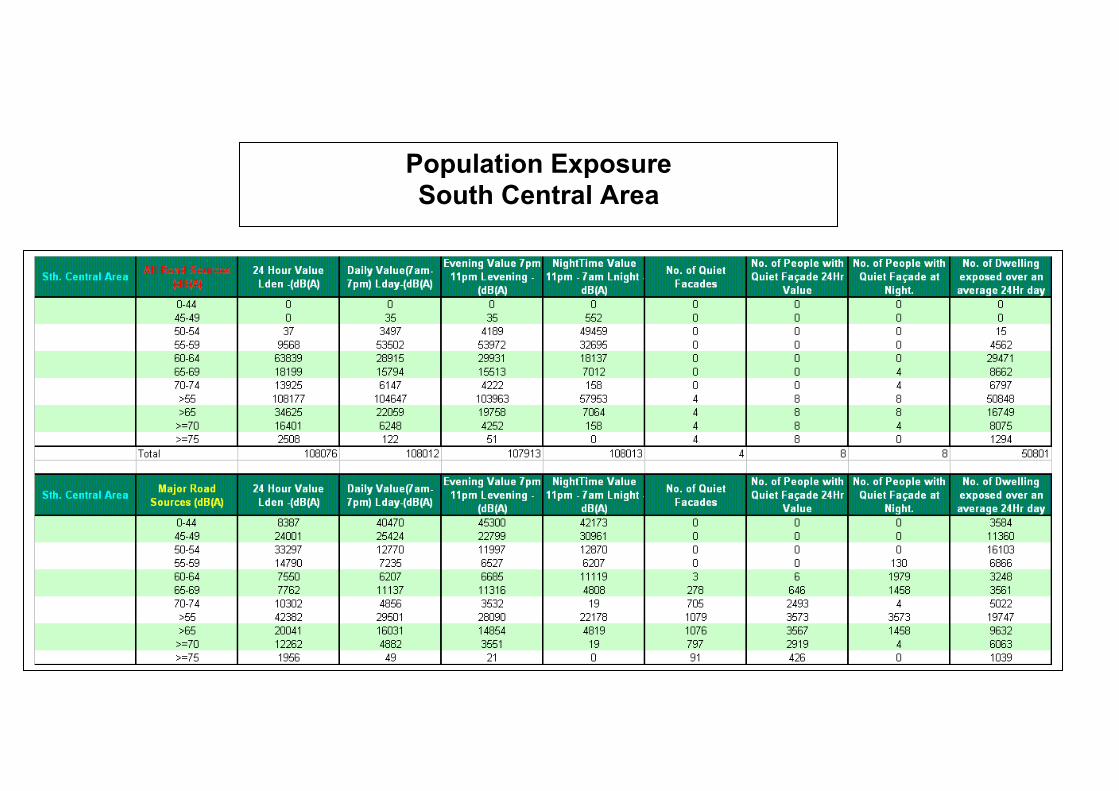
Population Exposure
South Central Area


ANNEX 7
South East Area Committee Noise Maps and Tables
For Road Traffic
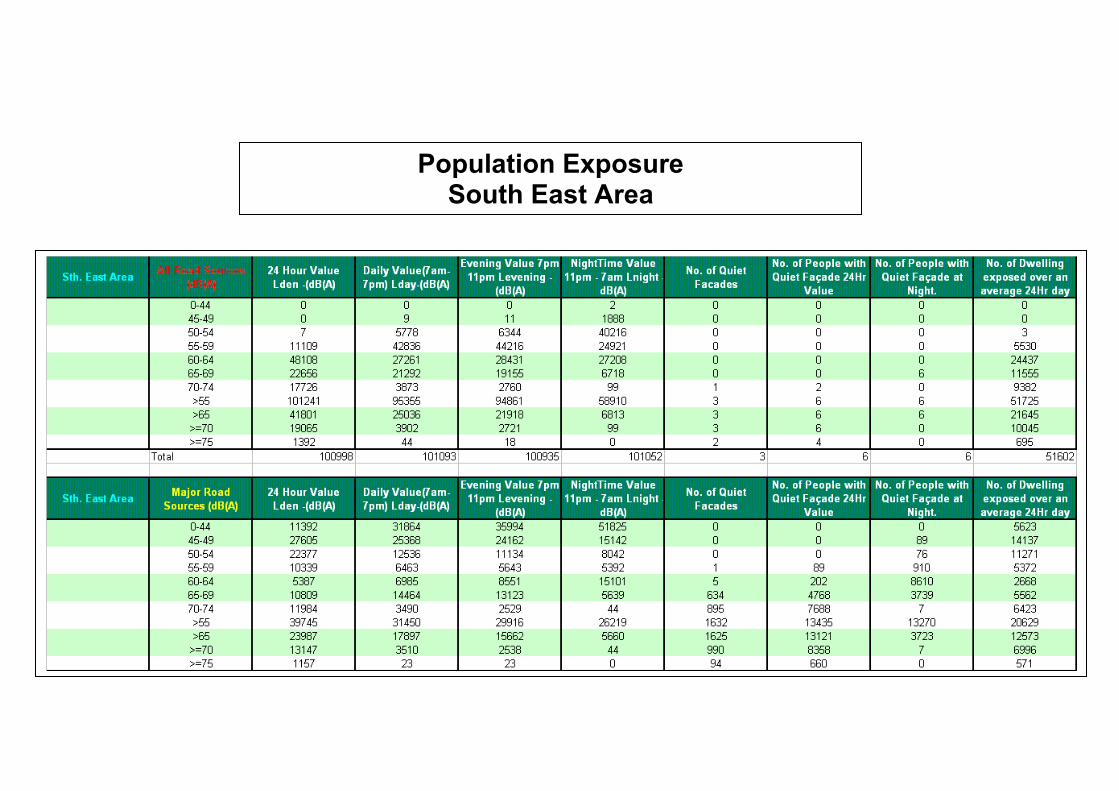
Population Exposure South East Area


![Online Noise Maps - Geographical Association · The Paris Noise map plots noise for each of the arrondissements [areas] of Paris. Two different types of map can be selected – 2D](https://img.pdfslide.net/doc/110x75/6105eedb775509498a5a5b65/online-noise-maps-geographical-association-the-paris-noise-map-plots-noise-for.jpg)