Embed Size (px)
Citation preview
8/2/2019 Noise Notes
http://slidepdf.com/reader/full/noise-notes 1/89
AnalCommunic
Suresh P. Nair [AIE, ME, (PhD)] MIEEEProfessor & Head
Department of Electronics and Communication EngineeringRoyal College of Engineering and Technology
Chiramanangad PO, Akkikkavu, Thrissur, Kerala, India
8/2/2019 Noise Notes
http://slidepdf.com/reader/full/noise-notes 2/89
Module 4
NOISE
P. Suresh Venugopal 2Analog Communication - NOISE
8/2/2019 Noise Notes
http://slidepdf.com/reader/full/noise-notes 3/89
Topics to be covered• Noise
– Sources of noise • Thermal Noise, Shot Noise, Flicker noise and White noise
• Noise Parameters – Signal to noise ratio – Noise factor – Noise equivalent band width – Effective noise temperature
P. Suresh Venugopal 3Analog Communication - NOISE
8/2/2019 Noise Notes
http://slidepdf.com/reader/full/noise-notes 4/89

8/2/2019 Noise Notes
http://slidepdf.com/reader/full/noise-notes 5/89
Noise Sources•
Introduction to Noise• Shot Noise• Thermal Noise•
Flicker Noise• White Noise
P. Suresh Venugopal 5Analog Communication - NOISE
8/2/2019 Noise Notes
http://slidepdf.com/reader/full/noise-notes 6/89
Noise - Introduction
• Noise – Unwanted Signals that tend to disturb theTransmission and Processing of Signals inCommunication System and over which we haveincomplete control.
• Noise is a general term which is used to describe
an unwanted signal which affects a wanted signal.• These unwanted signals arise from a variety of
sources.
P. Suresh Venugopal 6Analog Communication - NOISE
8/2/2019 Noise Notes
http://slidepdf.com/reader/full/noise-notes 7/89
Sources of Noise
• Sources of noise may be: – External – Internal
• Naturally occurring external noise sources include: – Atmosphere disturbance (e.g. electric storms, lighting,
ionospheric effect etc), so called ‘Sky Noise’ – Cosmic noise which includes noise from galaxy, solar
noise – ‘Hot spot’ due to oxygen and water vapour resonance
in the earth’s atmosphere.P. Suresh Venugopal 7Analog Communication - NOISE
8/2/2019 Noise Notes
http://slidepdf.com/reader/full/noise-notes 8/89
Sources of Noise
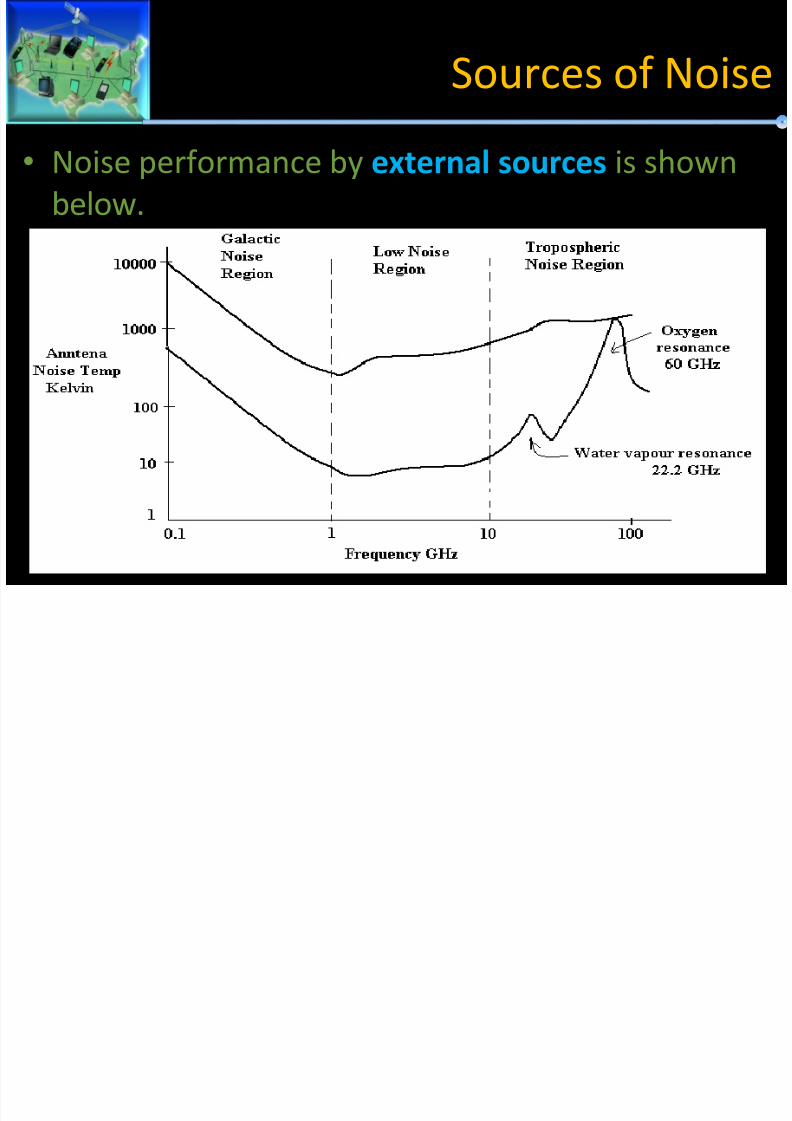
• Noise performance by external sources is shownbelow.
8/2/2019 Noise Notes
http://slidepdf.com/reader/full/noise-notes 9/89
Sources of Noise• Internal Noise is an important type of noise that
arises from the SPONTANEOUS FLUCTUATIONSof Current or Voltage in Electrical Circuits.
• This type of noise is the basic limiting factor of employing more complex Electrical Circuits inCommunication System.
• Most Common Internal Noises are: – Shot Noise –
Thermal NoiseP. Suresh Venugopal 9Analog Communication - NOISE
8/2/2019 Noise Notes
http://slidepdf.com/reader/full/noise-notes 10/89
Shot Noise• Shot Noise arises in Electronic Components like
Diodes and Transistors .• Due to the discrete nature of Current flow In
these components.• Take an example of Photodiode circuit .•
Photodiode emits electrons from the cathodewhen light falls on it.• The circuit generates a current pulse when an
electron is emitted.P. Suresh Venugopal 10Analog Communication - NOISE
8/2/2019 Noise Notes
http://slidepdf.com/reader/full/noise-notes 11/89
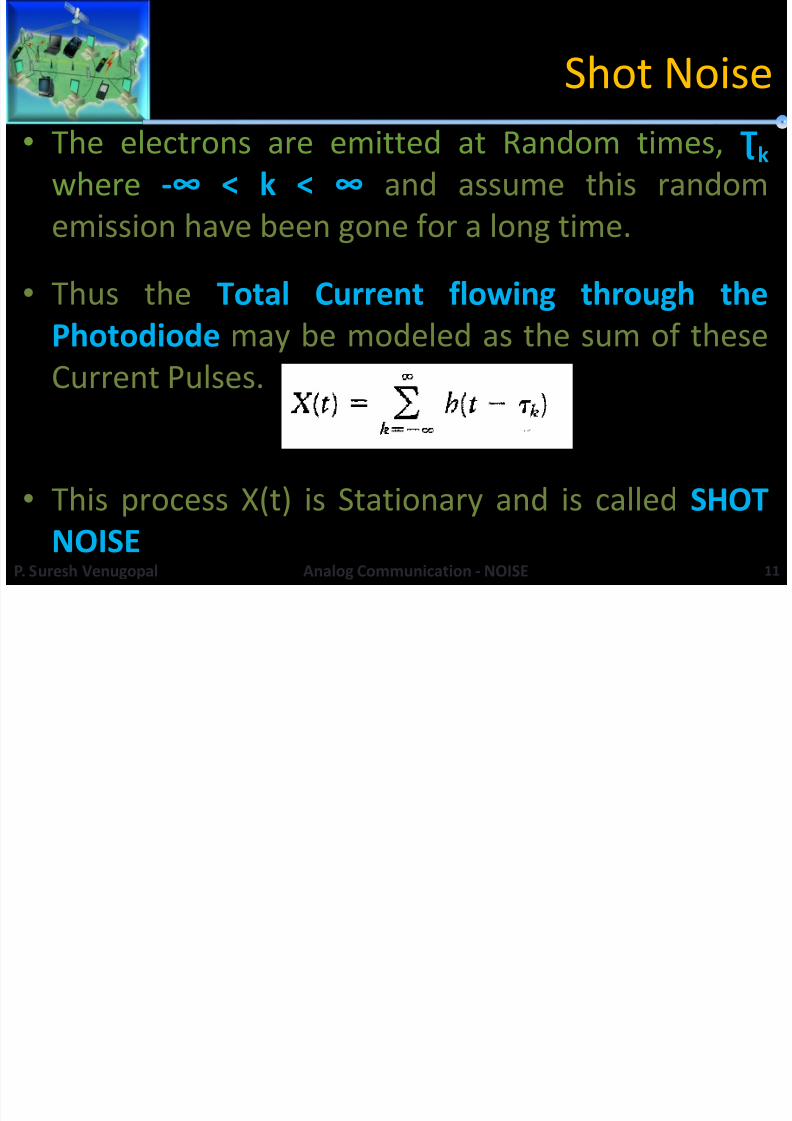
Shot Noise• The electrons are emitted at Random times, k
where -∞ < k < ∞ and assume this randomemission have been gone for a long time.
• Thus the Total Current flowing through thePhotodiode may be modeled as the sum of theseCurrent Pulses.
• This process X(t) is Stationary and is called SHOT
NOISEP. Suresh Venugopal 11Analog Communication - NOISE
8/2/2019 Noise Notes
http://slidepdf.com/reader/full/noise-notes 12/89
Thermal Noise
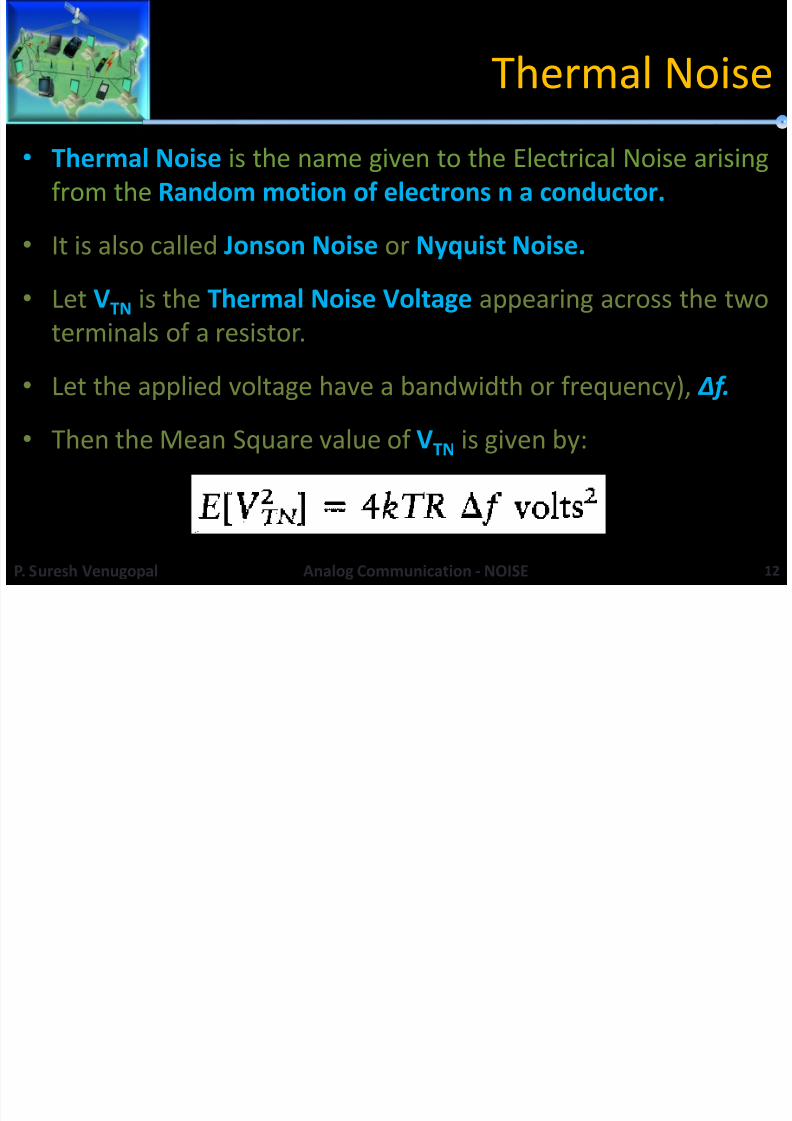
• Thermal Noise is the name given to the Electrical Noise arisingfrom the Random motion of electrons n a conductor.
• It is also called Jonson Noise or Nyquist Noise.
• Let VTN is the Thermal Noise Voltage appearing across the twoterminals of a resistor.
• Let the applied voltage have a bandwidth or frequency), ∆f .
• Then the Mean Square value of VTN is given by:
P. Suresh Venugopal 12Analog Communication - NOISE
8/2/2019 Noise Notes
http://slidepdf.com/reader/full/noise-notes 13/89
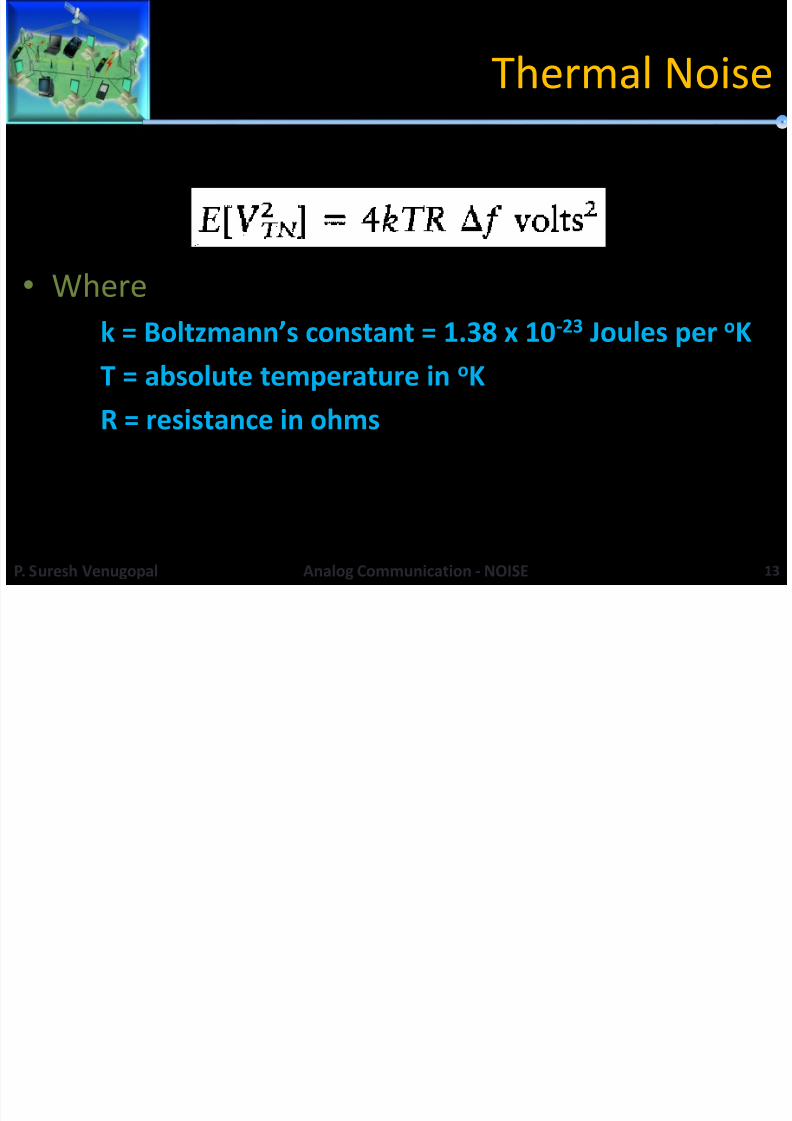
Thermal Noise
• Wherek = Boltzmann’s constant = 1.38 x 10 -23 Joules per oKT = absolute temperature in oK
R = resistance in ohms
P. Suresh Venugopal 13Analog Communication - NOISE
8/2/2019 Noise Notes
http://slidepdf.com/reader/full/noise-notes 14/89
Jonson Noise or Nyquist Noise
P. Suresh Venugopal 14Analog Communication - NOISE
8/2/2019 Noise Notes
http://slidepdf.com/reader/full/noise-notes 15/89
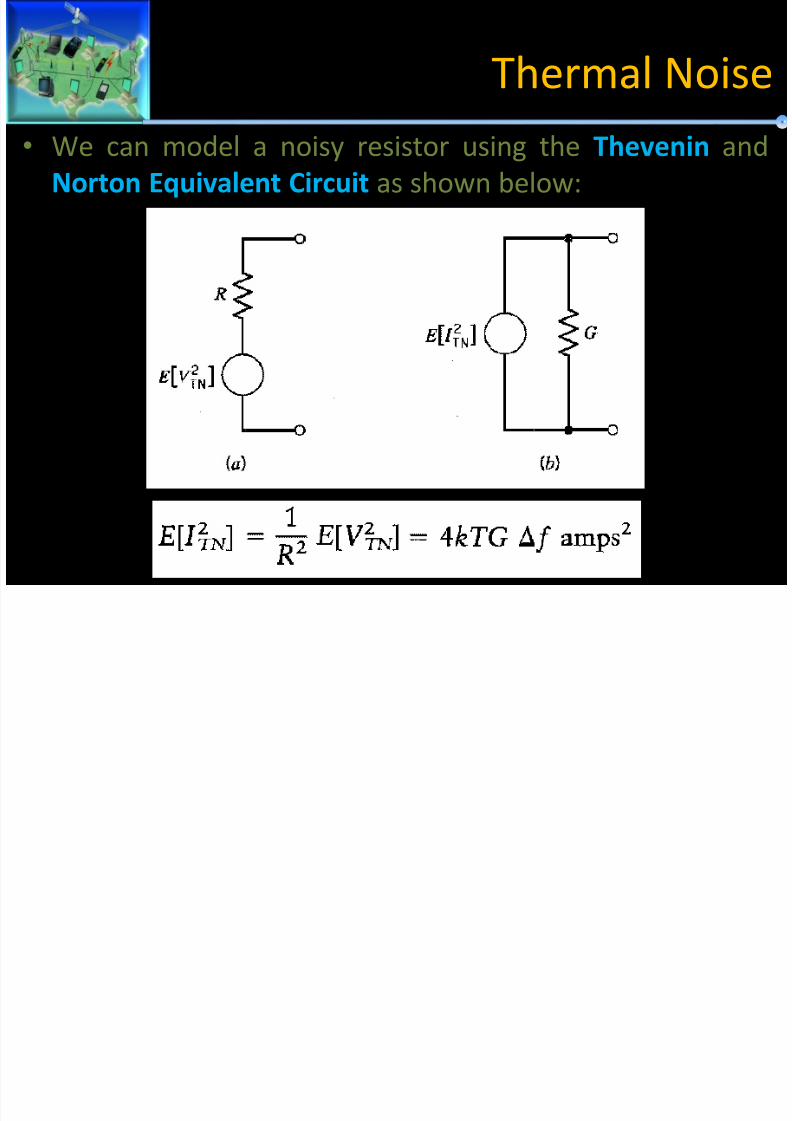
Thermal Noise• We can model a noisy resistor using the Thevenin and
Norton Equivalent Circuit as shown below:
8/2/2019 Noise Notes
http://slidepdf.com/reader/full/noise-notes 16/89
Thermal Noise
• The number of electrons inside a resistor is verylarge and their random motions inside theresistors are statistically independent.
•
The Central Limiting Theorem indicates thatthermal Noise is a Gaussian Distribution with Zeromean.
P. Suresh Venugopal 16Analog Communication - NOISE
8/2/2019 Noise Notes
http://slidepdf.com/reader/full/noise-notes 17/89
Low Frequency or Flicker Noise• Active devices, integrated circuit, diodes, transistors etc also
exhibits a low frequency noise, which is frequencydependent (i.e. non uniform) known as flicker noise .
• It is also called ‘one – over – f’ noise or 1/f noise because of its low-frequency variation.
• Its origin is believed to be attributable to contaminants anddefects in the crystal structure in semiconductors, and inthe oxide coating on the cathode of vacuum tube devices
P. Suresh Venugopal 17Analog Communication - NOISE
8/2/2019 Noise Notes
http://slidepdf.com/reader/full/noise-notes 18/89
Low Frequency or Flicker Noise• Flicker Noise is found in many natural phenomena such as
nuclear radiation, electron flow through a conductor, oreven in the environment.
• The noise power is proportional to the bias current , and,unlike Thermal and Shot Noise, Flicker Noise decreases withfrequency.
• An exact mathematical model does not exist for flickernoise because it is so device-specific.
• However, the inverse proportionality with frequency isalmost exactly 1/f for low frequencies, whereas forfrequencies above a few kilohertz, the noise power is weakbut essentially flat.
P. Suresh Venugopal 18Analog Communication - NOISE
8/2/2019 Noise Notes
http://slidepdf.com/reader/full/noise-notes 19/89
Low Frequency or Flicker Noise• Flicker Noise is essentially random, but because its frequency
spectrum is not flat , it is not a white noise.
• It is often referred to as pink noise because most of the power isconcentrated at the lower end of the frequency spectrum.
• Flicker Noise is more prominent in FETs (smaller the channel length,greater the Flicker Noise), and in bulky carbon resistors.
• The objection to carbon resistors mentioned earlier for critical lownoise applications is due to their tendency to produce flicker noisewhen carrying a direct current.
• In this connection, metal film resistors are a better choice for low
frequency, low noise applications.P. Suresh Venugopal 19Analog Communication - NOISE
8/2/2019 Noise Notes
http://slidepdf.com/reader/full/noise-notes 20/89
White Noise• The Noise Analysis of Communication System is
done on the basis of an idealized form of noisecalled WHITE NOISE.
• Its power spectral density is independent onoperating frequency.
• White – White light contain equal amount of allfrequencies in visible spectrum.
P. Suresh Venugopal 20Analog Communication - NOISE
8/2/2019 Noise Notes
http://slidepdf.com/reader/full/noise-notes 21/89
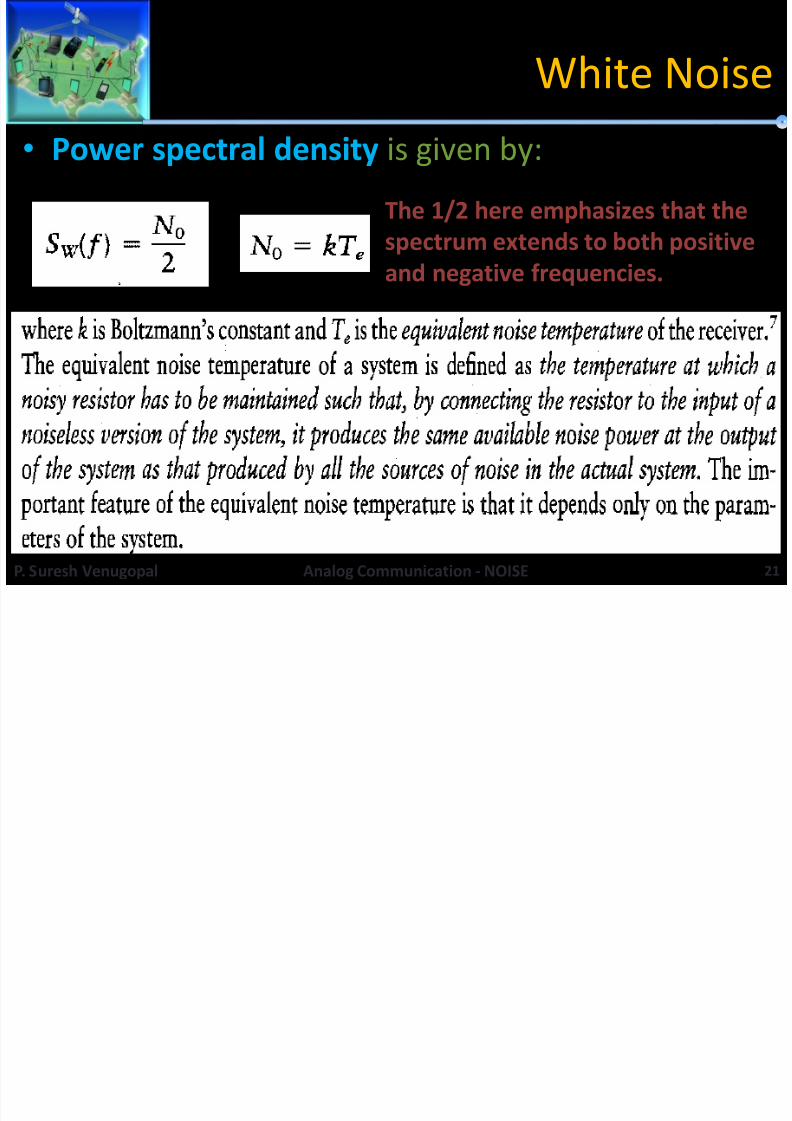
White Noise• Power spectral density is given by:
The 1/2 here emphasizes that thespectrum extends to both positive
and negative frequencies.
P. Suresh Venugopal 21Analog Communication - NOISE
8/2/2019 Noise Notes
http://slidepdf.com/reader/full/noise-notes 22/89
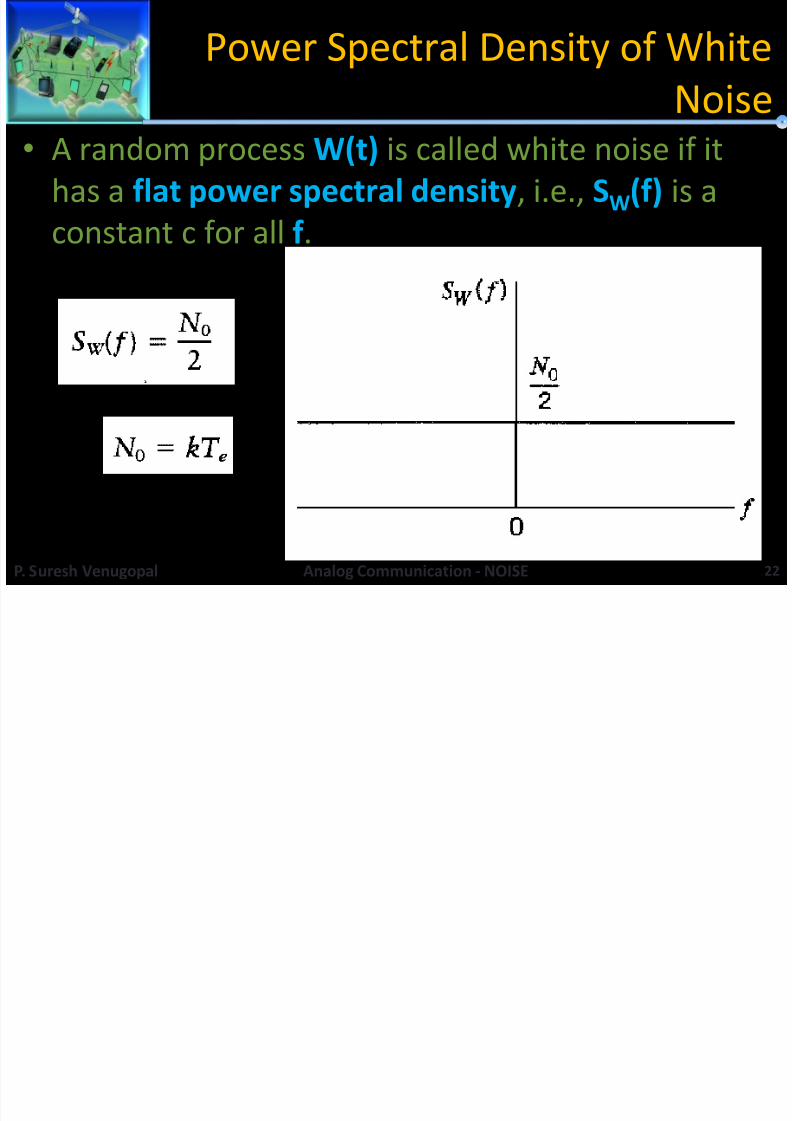
Power Spectral Density of WhiteNoise
• A random process W(t) is called white noise if ithas a flat power spectral density , i.e., SW(f) is aconstant c for all f .
P. Suresh Venugopal 22Analog Communication - NOISE
8/2/2019 Noise Notes
http://slidepdf.com/reader/full/noise-notes 23/89
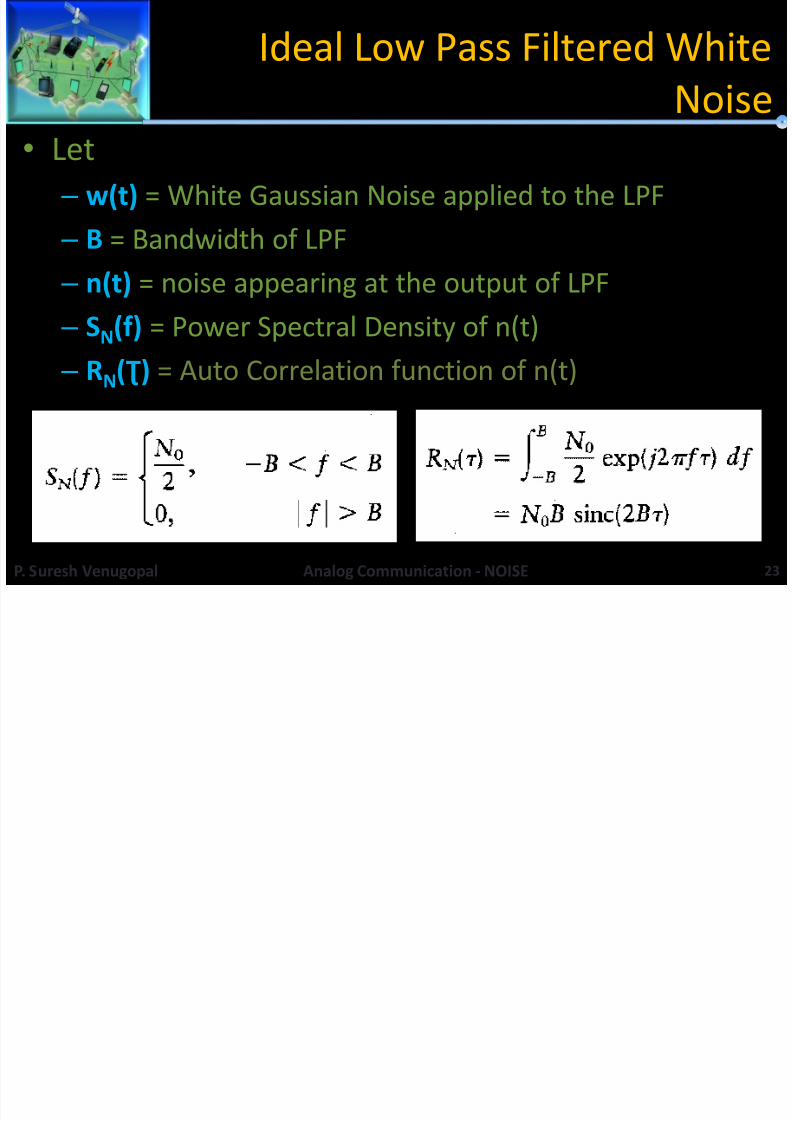
Ideal Low Pass Filtered WhiteNoise
• Let – w(t) = White Gaussian Noise applied to the LPF – B = Bandwidth of LPF – n(t) = noise appearing at the output of LPF – SN(f) = Power Spectral Density of n(t) – RN( ) = Auto Correlation function of n(t)
P. Suresh Venugopal 23Analog Communication - NOISE
8/2/2019 Noise Notes
http://slidepdf.com/reader/full/noise-notes 24/89
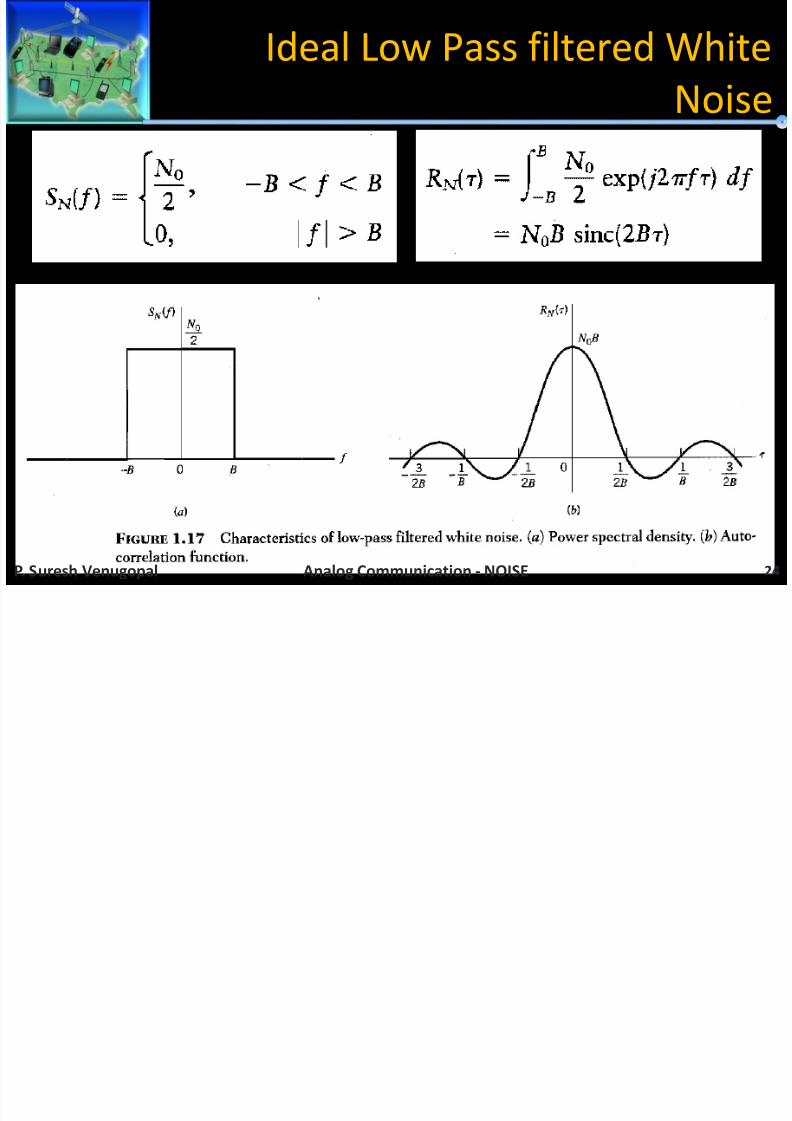
Ideal Low Pass filtered WhiteNoise
P. Suresh Venugopal 24Analog Communication - NOISE

8/2/2019 Noise Notes
http://slidepdf.com/reader/full/noise-notes 25/89
Noise Parameters•
Signal to noise ratio• Noise factor• Noise equivalent band width• Effective noise temperature
P. Suresh Venugopal 25Analog Communication - NOISE
8/2/2019 Noise Notes
http://slidepdf.com/reader/full/noise-notes 26/89
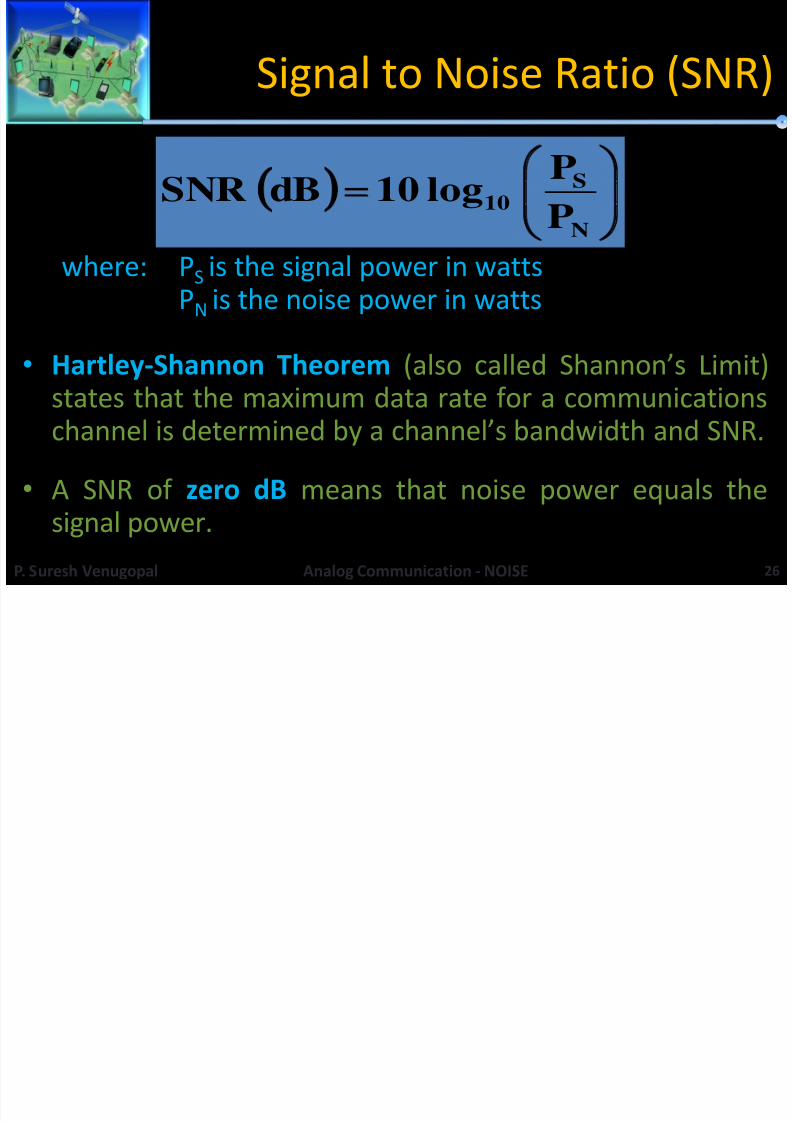
Signal to Noise Ratio (SNR)
where: P S is the signal power in wattsPN is the noise power in watts
• Hartley-Shannon Theorem (also called Shannon’s Limit)states that the maximum data rate for a communicationschannel is determined by a channel’s bandwidth and SNR.
• A SNR of zero dB means that noise power equals thesignal power.
N
S10 P
P log10dBSNR
P. Suresh Venugopal 26Analog Communication - NOISE
8/2/2019 Noise Notes
http://slidepdf.com/reader/full/noise-notes 27/89
8/2/2019 Noise Notes
http://slidepdf.com/reader/full/noise-notes 28/89
8/2/2019 Noise Notes
http://slidepdf.com/reader/full/noise-notes 29/89
Noise equivalent band width
P. Suresh Venugopal 29Analog Communication - NOISE
8/2/2019 Noise Notes
http://slidepdf.com/reader/full/noise-notes 30/89
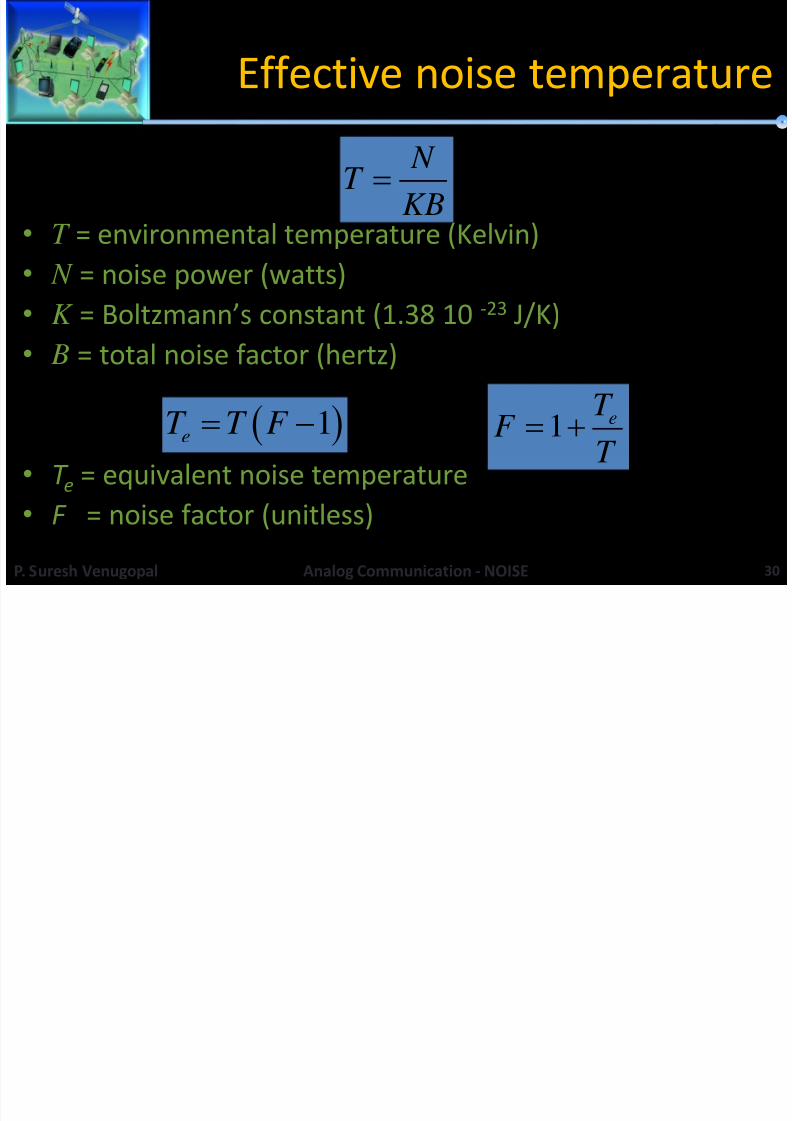
Effective noise temperature
• T = environmental temperature (Kelvin)•
N = noise power (watts) • K = Boltzmann’s constant (1.38 10 -23 J/K)
• B = total noise factor (hertz)
• T e = equivalent noise temperature• F = noise factor (unitless)
P. Suresh Venugopal 30Analog Communication - NOISE
N T
KB
1eT T F 1 eT F T

8/2/2019 Noise Notes
http://slidepdf.com/reader/full/noise-notes 31/89
NarrowbandNoise• Introduction to Narrowband Noise
• Representation of narrowband noise in terms of
In phase and Quadrature Components
P. Suresh Venugopal 31Analog Communication - NOISE
8/2/2019 Noise Notes
http://slidepdf.com/reader/full/noise-notes 32/89
Narrow band noise
• Preprocessing of received signals
• Preprocessing done by a Narrowband Filter
• Narrowband Filter – Bandwidth large enough topass the modulated signal.
•
Noise also pass through this filter.• The noise appearing at the output of this NB filter
is called NARROWBAND NOISE.P. Suresh Venugopal 32Analog Communication - NOISE
8/2/2019 Noise Notes
http://slidepdf.com/reader/full/noise-notes 33/89
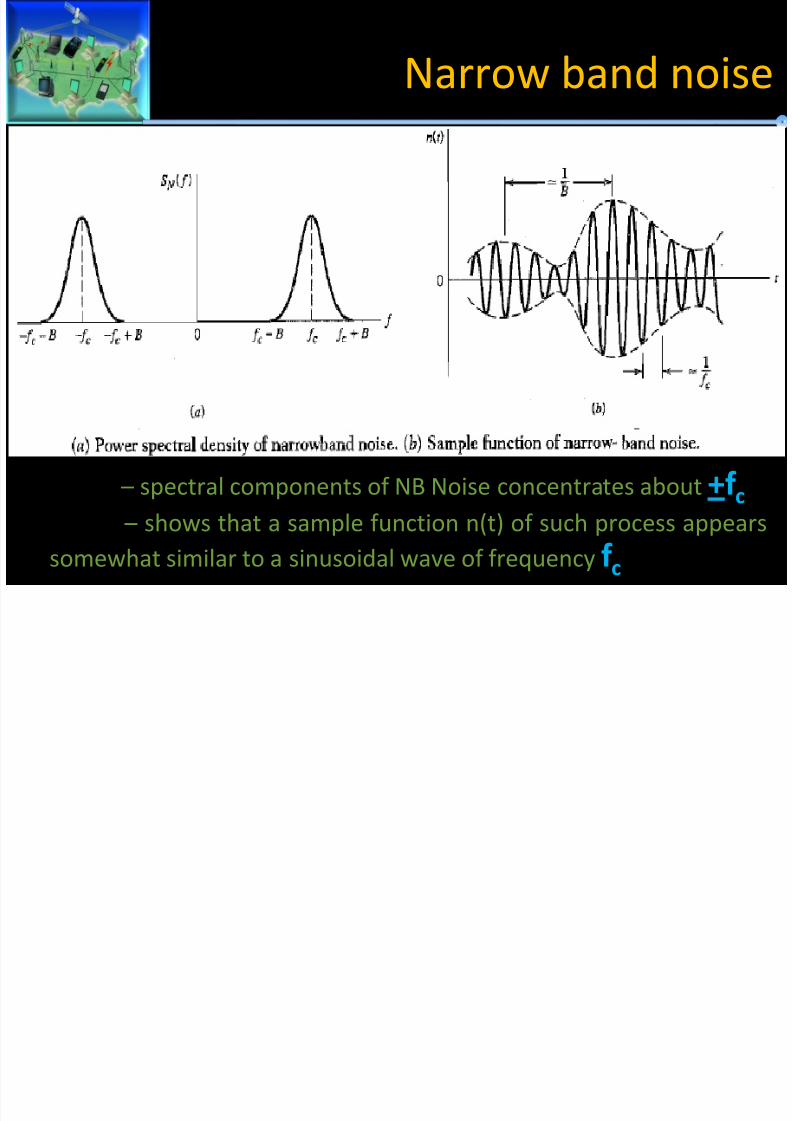
Narrow band noise
• Fig (a) – spectral components of NB Noise concentrates about +f c • Fig (b) – shows that a sample function n(t) of such process appears
somewhat similar to a sinusoidal wave of frequency f c

8/2/2019 Noise Notes
http://slidepdf.com/reader/full/noise-notes 34/89
Narrow band noise• We need a mathematical representation to analyze the
effect of this NB Noise.• There are 2 specific representation of NB Noise
(depending on the application)
P. Suresh Venugopal 34Analog Communication - NOISE
Representation of narrowband noise in
8/2/2019 Noise Notes
http://slidepdf.com/reader/full/noise-notes 35/89
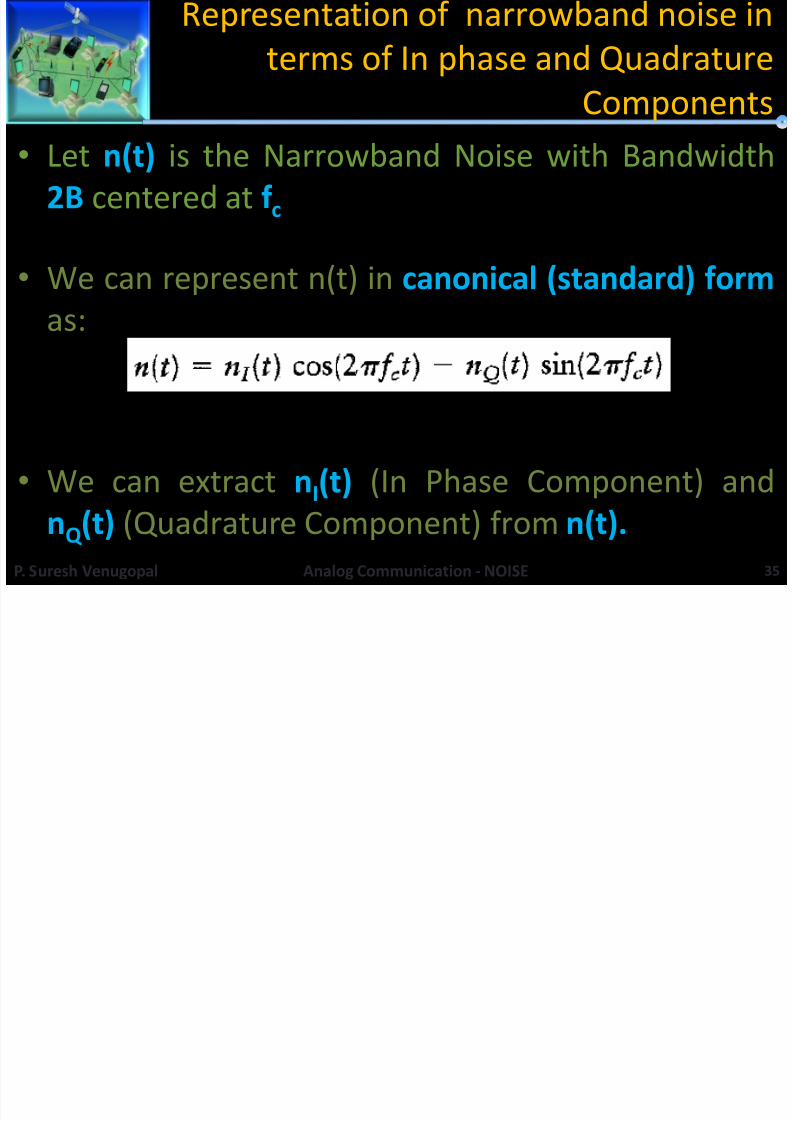
Representation of narrowband noise interms of In phase and Quadrature
Components• Let n(t) is the Narrowband Noise with Bandwidth
2B centered at f c
• We can represent n(t) in canonical (standard) formas:
• We can extract n I(t) (In Phase Component) andnQ (t) (Quadrature Component) from n(t).
P. Suresh Venugopal 35Analog Communication - NOISE
f f
8/2/2019 Noise Notes
http://slidepdf.com/reader/full/noise-notes 36/89
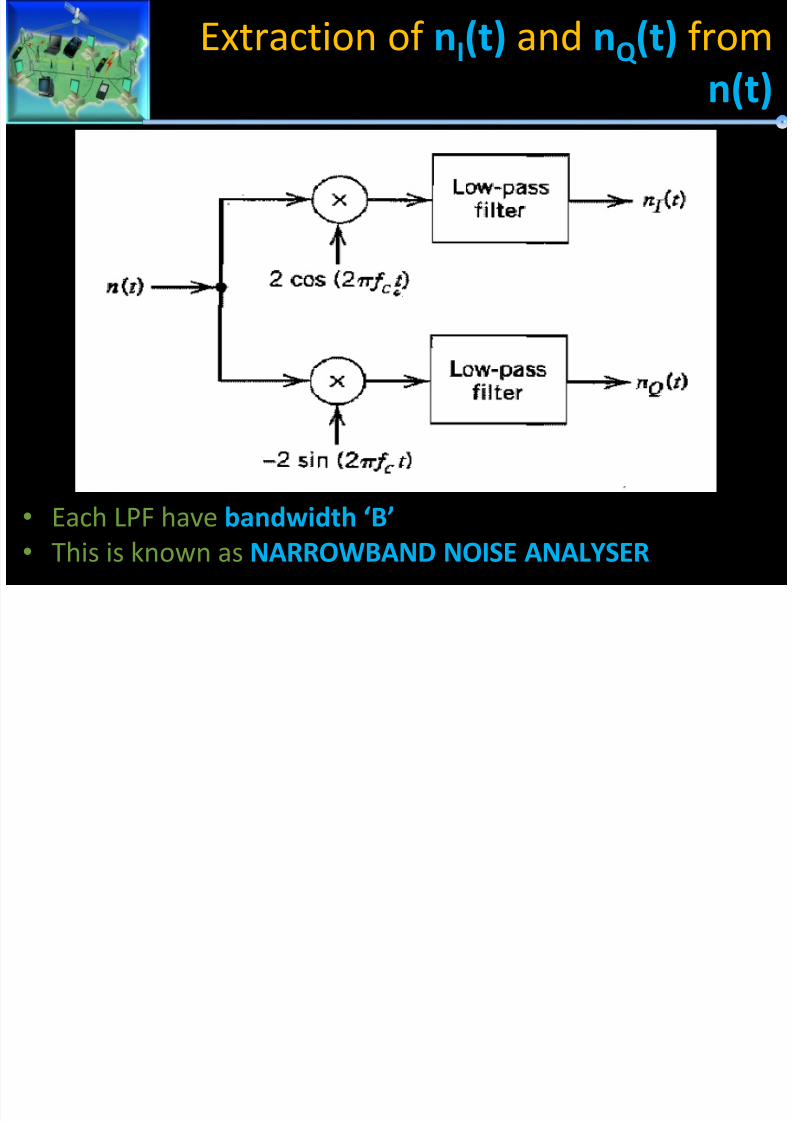
Extraction of n I(t) and nQ (t) from n(t)
• Each LPF have bandwidth ‘B’ • This is known as NARROWBAND NOISE ANALYSER
f ( ) f ( ) d
8/2/2019 Noise Notes
http://slidepdf.com/reader/full/noise-notes 37/89
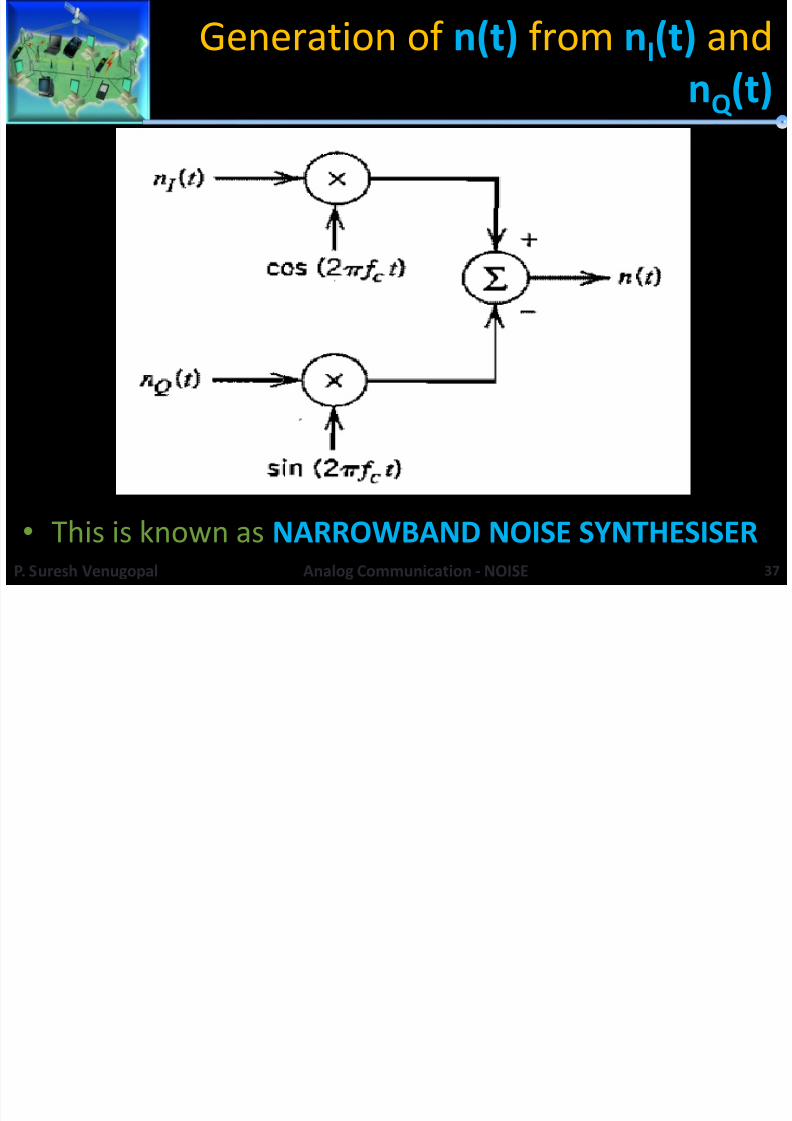
Generation of n(t) from n I(t) and nQ (t)
• This is known as NARROWBAND NOISE SYNTHESISERP. Suresh Venugopal 37Analog Communication - NOISE
i f ( ) d
8/2/2019 Noise Notes
http://slidepdf.com/reader/full/noise-notes 38/89
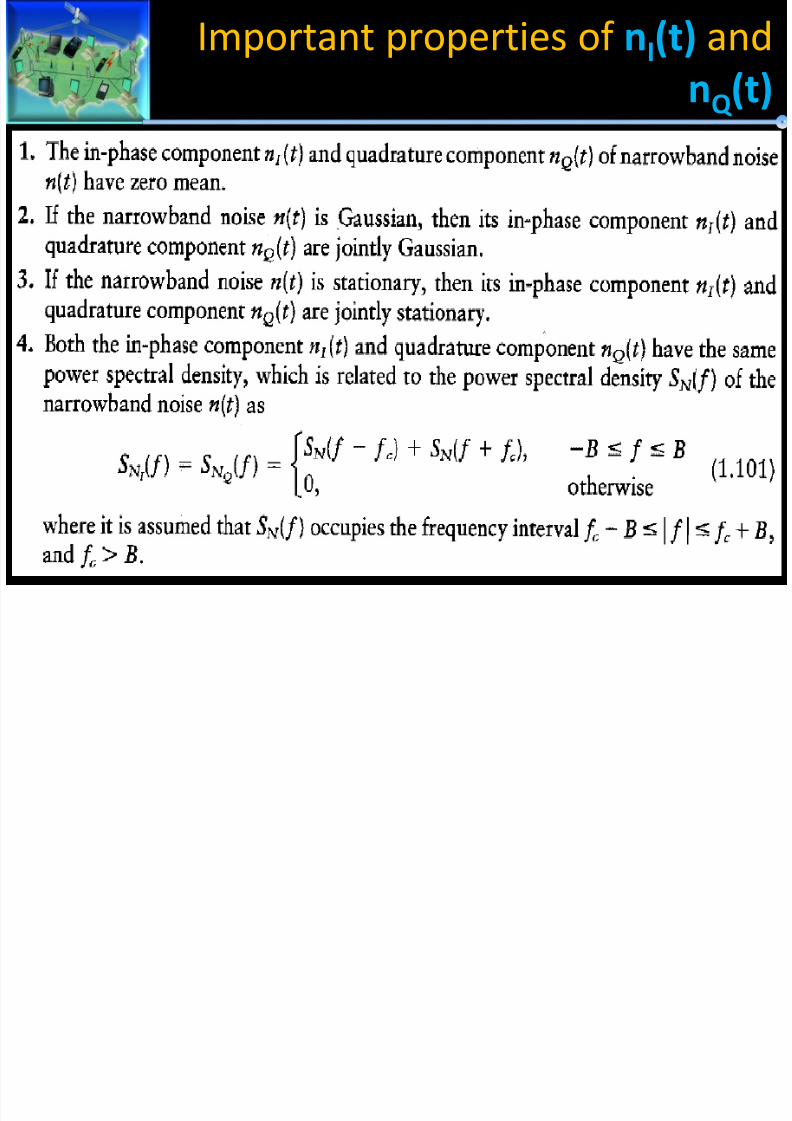
Important properties of n I(t) and nQ (t)
I i f ( ) d
8/2/2019 Noise Notes
http://slidepdf.com/reader/full/noise-notes 39/89
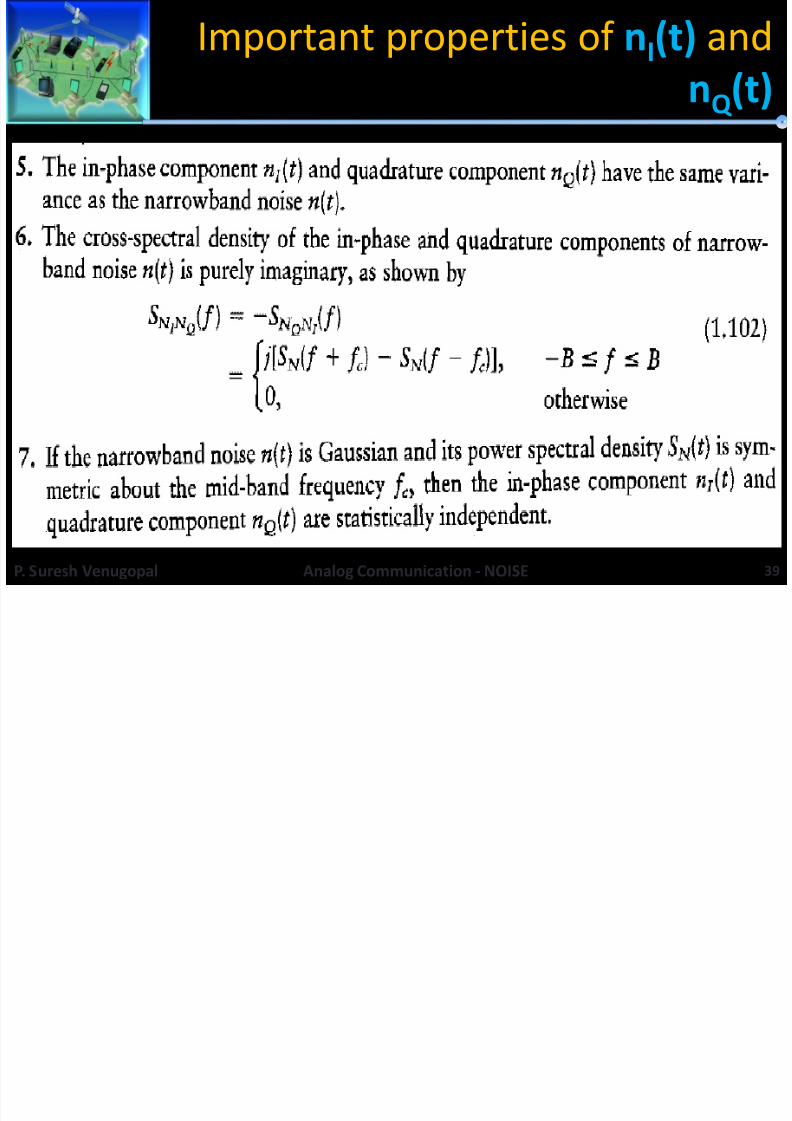
Important properties of n I(t) and nQ (t)
P. Suresh Venugopal 39Analog Communication - NOISE
8/2/2019 Noise Notes
http://slidepdf.com/reader/full/noise-notes 40/89
Noise in CW modulationSystems
• Noise in linear Receivers using Coherent detection•
Noise in AM Receivers using Envelope detection• Noise in FM Receivers
P. Suresh Venugopal 40Analog Communication - NOISE
8/2/2019 Noise Notes
http://slidepdf.com/reader/full/noise-notes 41/89
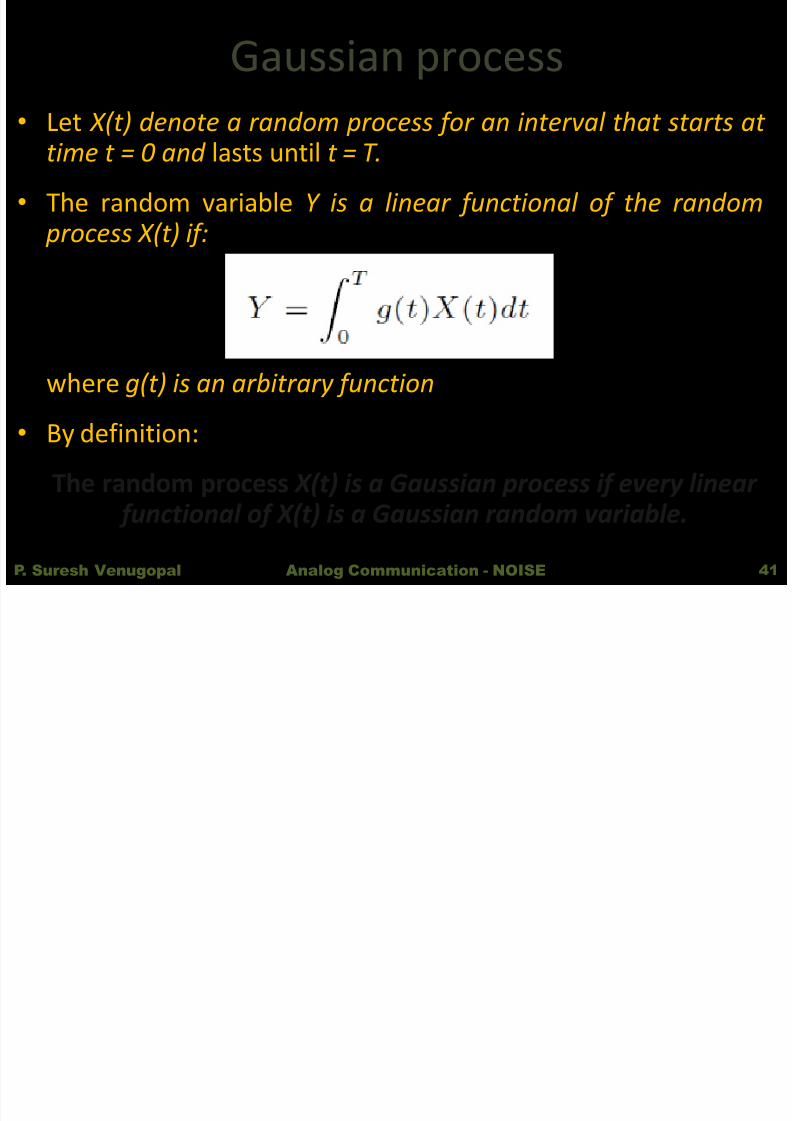
Gaussian process• Let X(t) denote a random process for an interval that starts at
time t = 0 and lasts until t = T.• The random variable Y is a linear functional of the random
process X(t) if:
where g(t) is an arbitrary function
• By definition:
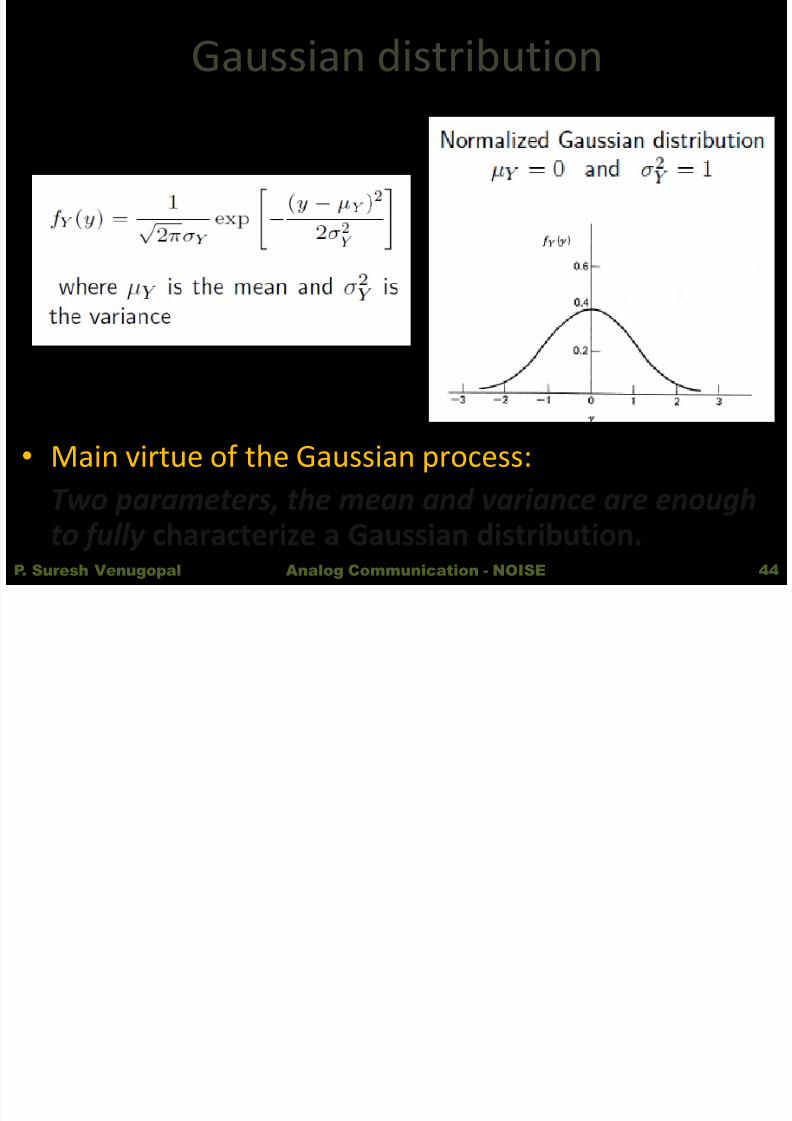
The random process X(t) is a Gaussian process if every linear functional of X(t) is a Gaussian random variable.
P. Suresh Venugopal 41Analog Communication - NOISE
8/2/2019 Noise Notes
http://slidepdf.com/reader/full/noise-notes 42/89
Main virtues of the Gaussian process:
• Gaussian process has many properties that make results possible in analytic form
• Random processes produced by physical phenomena (seethermal noise as an example) are often such that theymay be modeled by the Gaussian process
• If the input to a linear time invariant (LTI) system isGaussian then its output is also Gaussian
P. Suresh Venugopal 42Analog Communication - NOISE
8/2/2019 Noise Notes
http://slidepdf.com/reader/full/noise-notes 43/89
Thermal noise
• Is generated by each resistor.
• Used to model channel noise in analysis the of communication systems.
• It is an ergodic, Gaussian process with themean of zero.
P. Suresh Venugopal 43Analog Communication - NOISE
8/2/2019 Noise Notes
http://slidepdf.com/reader/full/noise-notes 44/89
Power spectral density (PSD) of a
8/2/2019 Noise Notes
http://slidepdf.com/reader/full/noise-notes 45/89
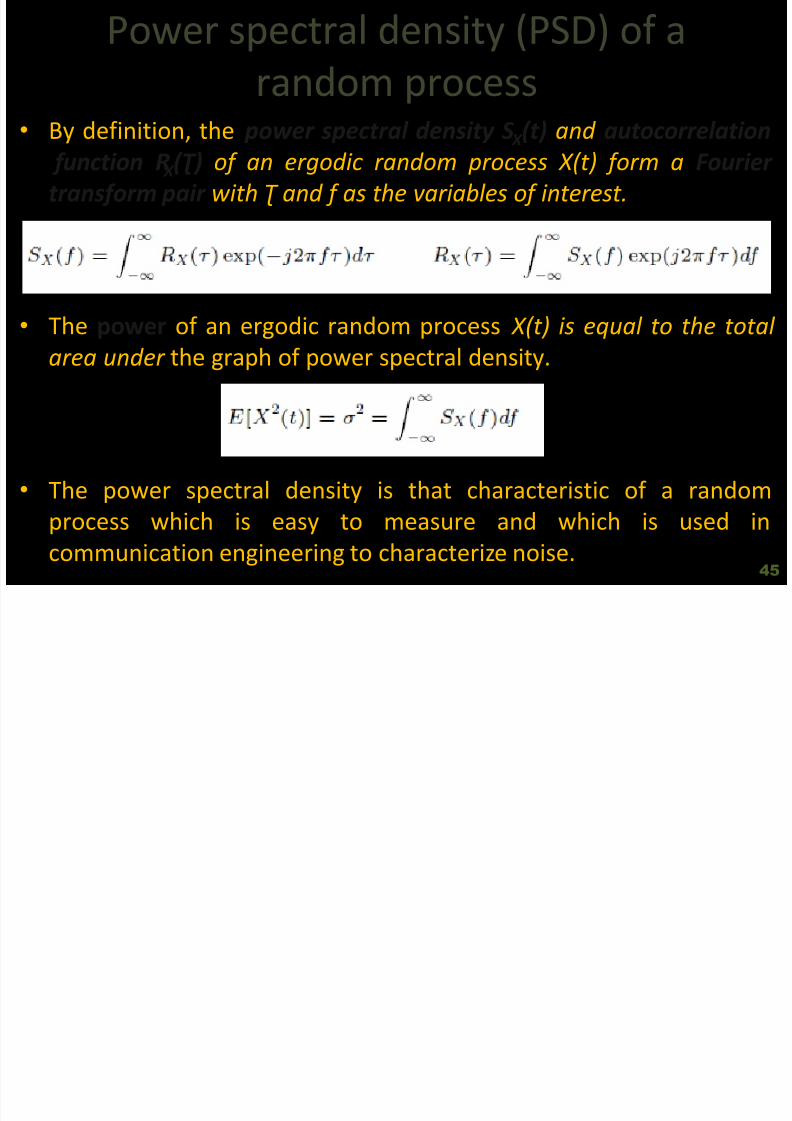
Power spectral density (PSD) of arandom process
• By definition, the power spectral density S X
(t) and autocorrelation function R X ( ) of an ergodic random process X(t) form a Fourier transform pair with and f as the variables of interest.
• The power of an ergodic random process X(t) is equal to the total area under the graph of power spectral density.
• The power spectral density is that characteristic of a randomprocess which is easy to measure and which is used in
communication engineering to characterize noise. 45
8/2/2019 Noise Notes
http://slidepdf.com/reader/full/noise-notes 46/89
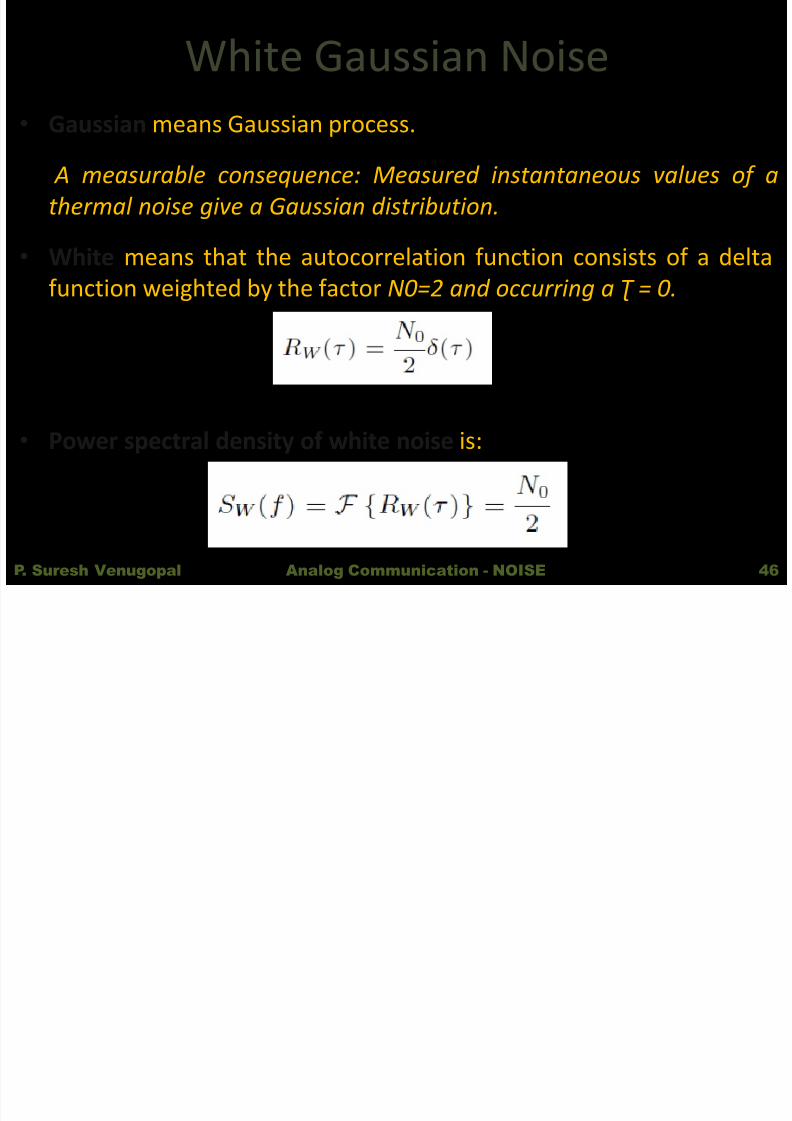
White Gaussian Noise• Gaussian means Gaussian process.
A measurable consequence: Measured instantaneous values of athermal noise give a Gaussian distribution.
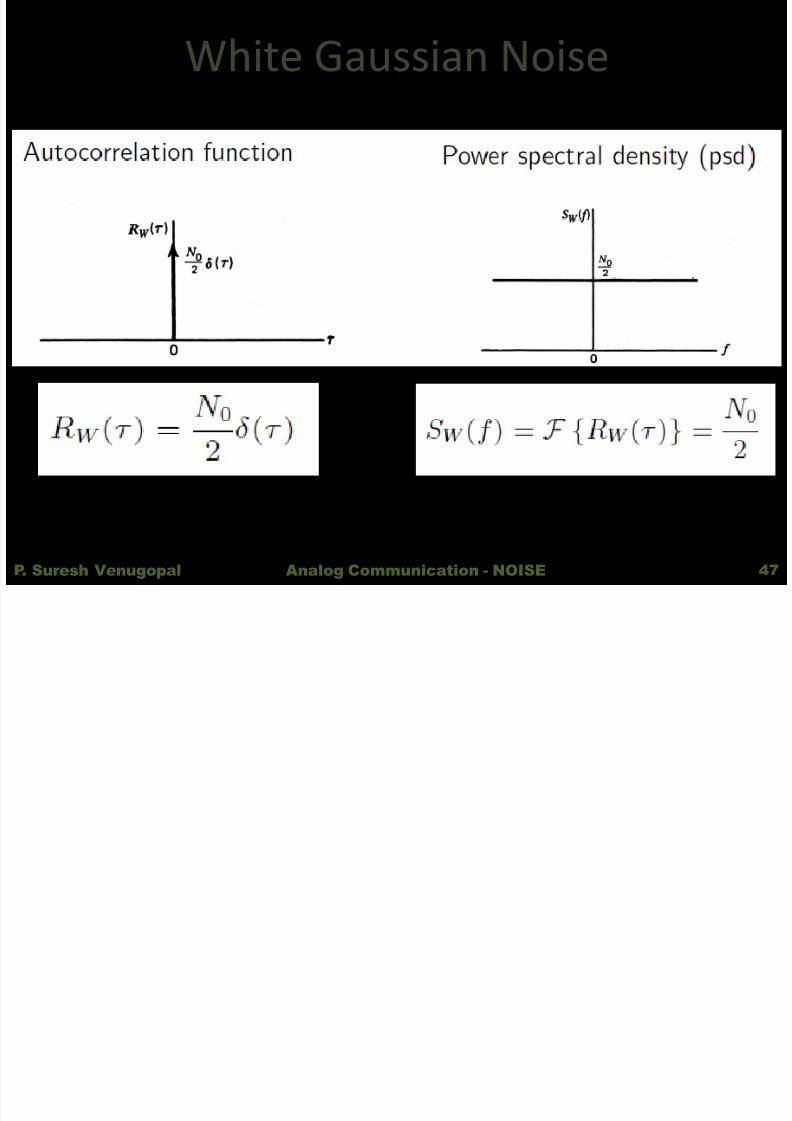
• White means that the autocorrelation function consists of a deltafunction weighted by the factor N0=2 and occurring a = 0.
• Power spectral density of white noise is:
P. Suresh Venugopal 46Analog Communication - NOISE
8/2/2019 Noise Notes
http://slidepdf.com/reader/full/noise-notes 47/89
White Gaussian Noise
P. Suresh Venugopal 47Analog Communication - NOISE
8/2/2019 Noise Notes
http://slidepdf.com/reader/full/noise-notes 48/89
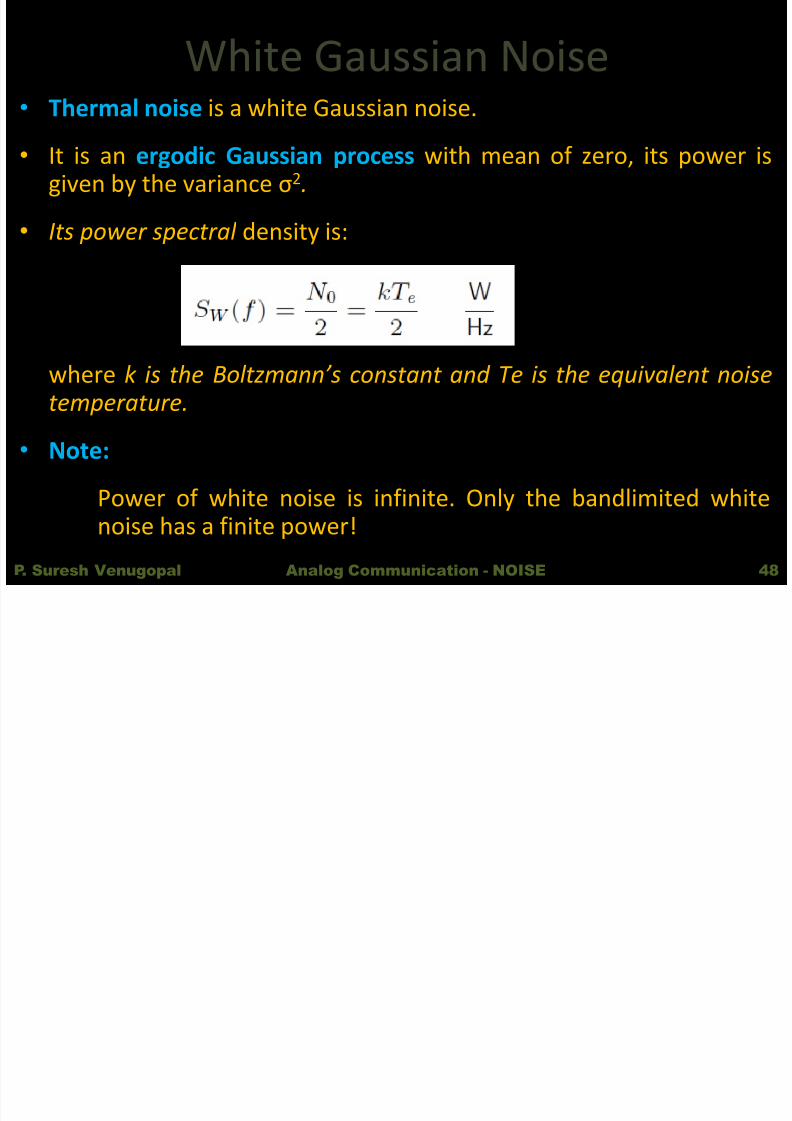
White Gaussian Noise• Thermal noise is a white Gaussian noise.
• It is an ergodic Gaussian process with mean of zero, its power isgiven by the variance σ2.
• Its power spectral density is:
where k is the Boltzmann’s constant and Te is the equivalent noisetemperature.
• Note:
Power of white noise is infinite. Only the bandlimited whitenoise has a finite power!
P. Suresh Venugopal 48Analog Communication - NOISE
8/2/2019 Noise Notes
http://slidepdf.com/reader/full/noise-notes 49/89
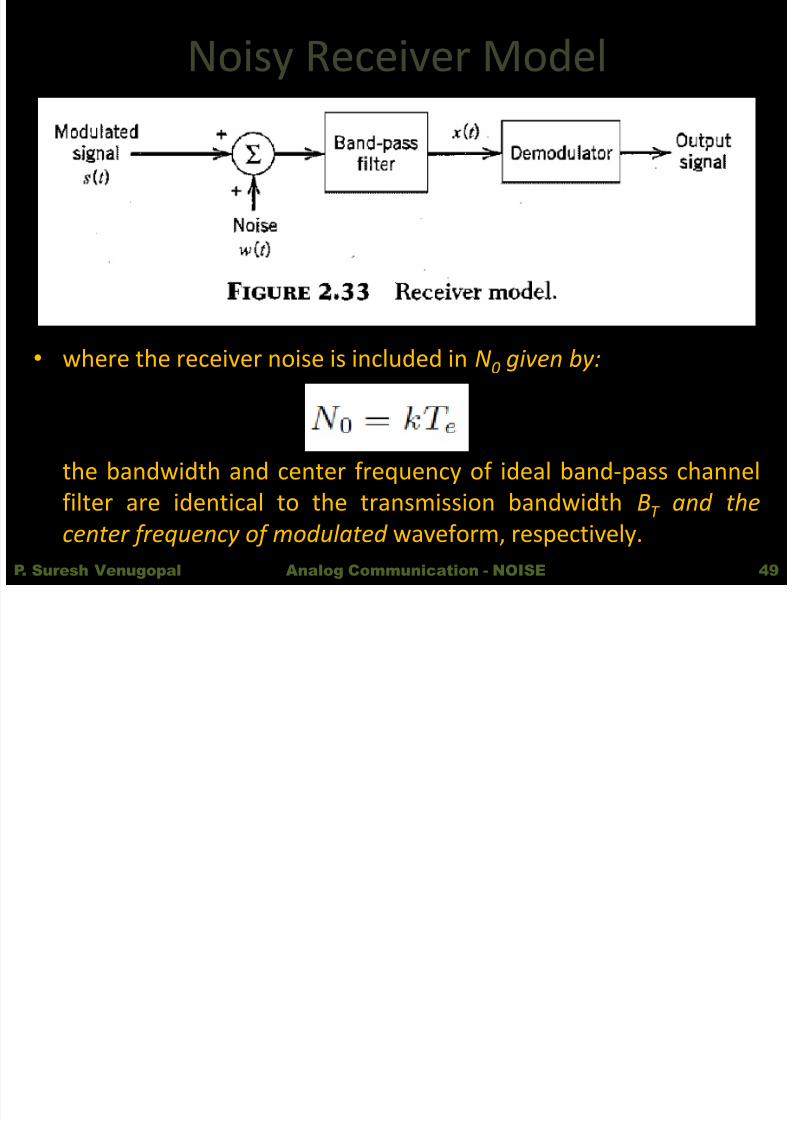
Noisy Receiver Model
• where the receiver noise is included in N0 given by:
the bandwidth and center frequency of ideal band-pass channelfilter are identical to the transmission bandwidth BT and thecenter frequency of modulated waveform, respectively.
P. Suresh Venugopal 49Analog Communication - NOISE
8/2/2019 Noise Notes
http://slidepdf.com/reader/full/noise-notes 50/89
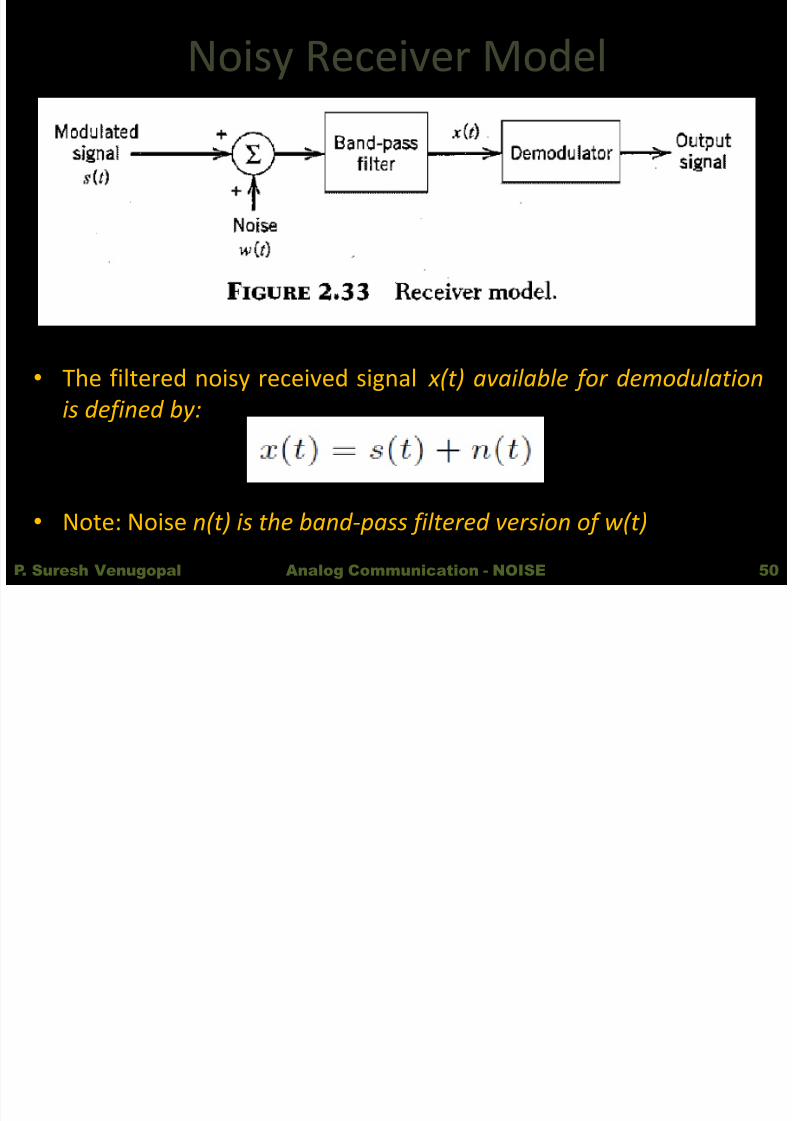
Noisy Receiver Model
• The filtered noisy received signal x(t) available for demodulation
is defined by:
• Note: Noise n(t) is the band-pass filtered version of w(t)
P. Suresh Venugopal 50Analog Communication - NOISE
l d ( ) f b d
8/2/2019 Noise Notes
http://slidepdf.com/reader/full/noise-notes 51/89
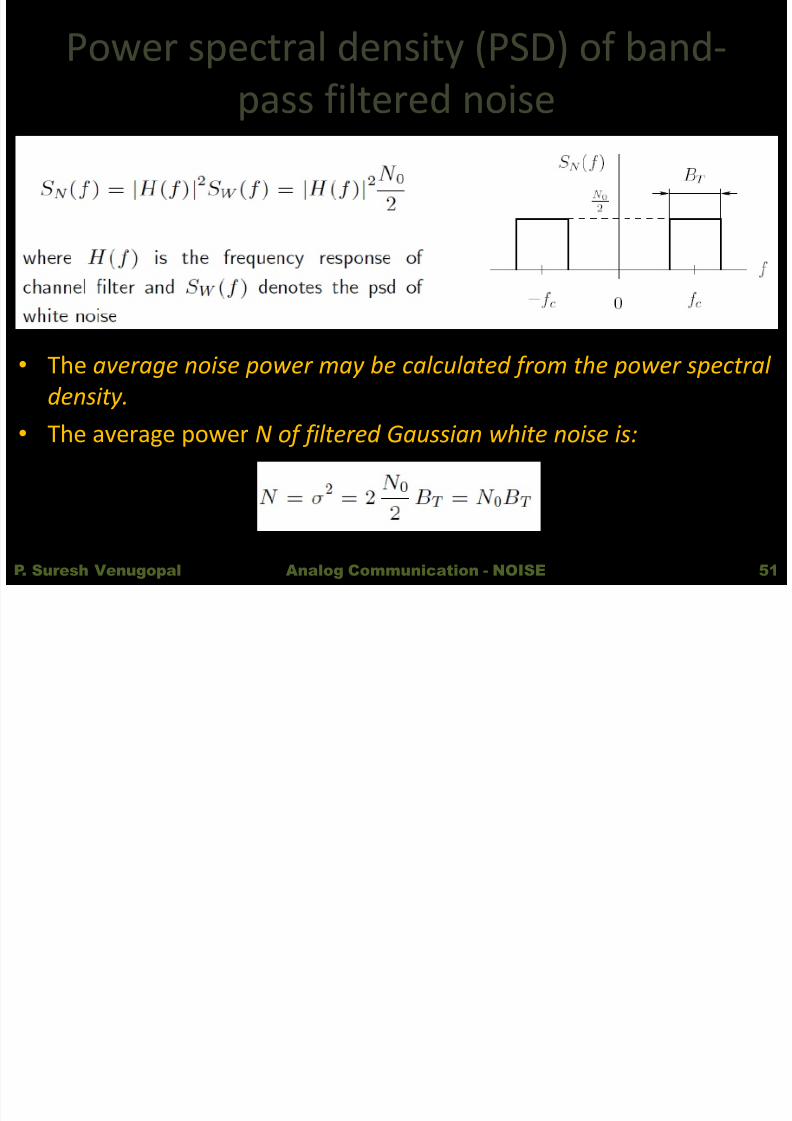
Power spectral density (PSD) of band-pass filtered noise
• The average noise power may be calculated from the power spectral density.
• The average power N of filtered Gaussian white noise is:
P. Suresh Venugopal 51Analog Communication - NOISE
8/2/2019 Noise Notes
http://slidepdf.com/reader/full/noise-notes 52/89
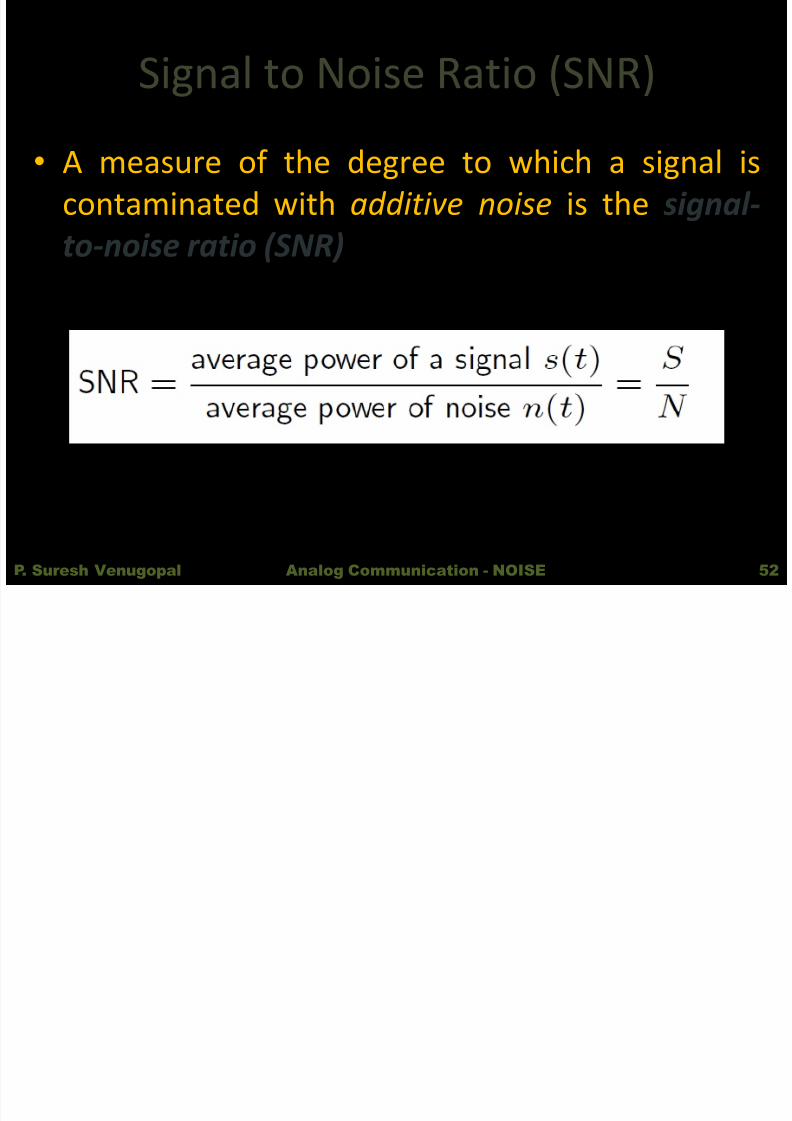
Signal to Noise Ratio (SNR)
• A measure of the degree to which a signal iscontaminated with additive noise is the signal-to-noise ratio (SNR)
P. Suresh Venugopal 52Analog Communication - NOISE
Fi f M i Of CW M d l i
8/2/2019 Noise Notes
http://slidepdf.com/reader/full/noise-notes 53/89
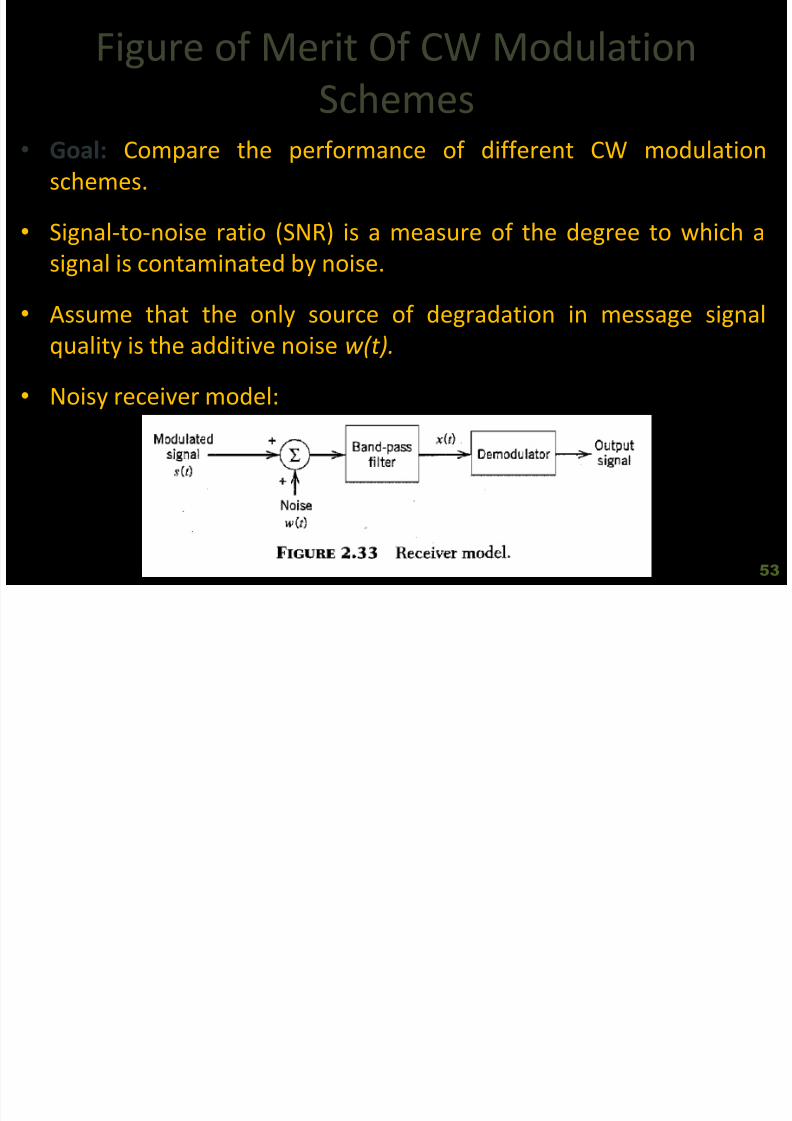
Figure of Merit Of CW ModulationSchemes
• Goal: Compare the performance of different CW modulationschemes.
• Signal-to-noise ratio (SNR) is a measure of the degree to which asignal is contaminated by noise.
• Assume that the only source of degradation in message signalquality is the additive noise w(t).
• Noisy receiver model:
53
8/2/2019 Noise Notes
http://slidepdf.com/reader/full/noise-notes 54/89
Fi f M i Of CW M d l i
8/2/2019 Noise Notes
http://slidepdf.com/reader/full/noise-notes 55/89
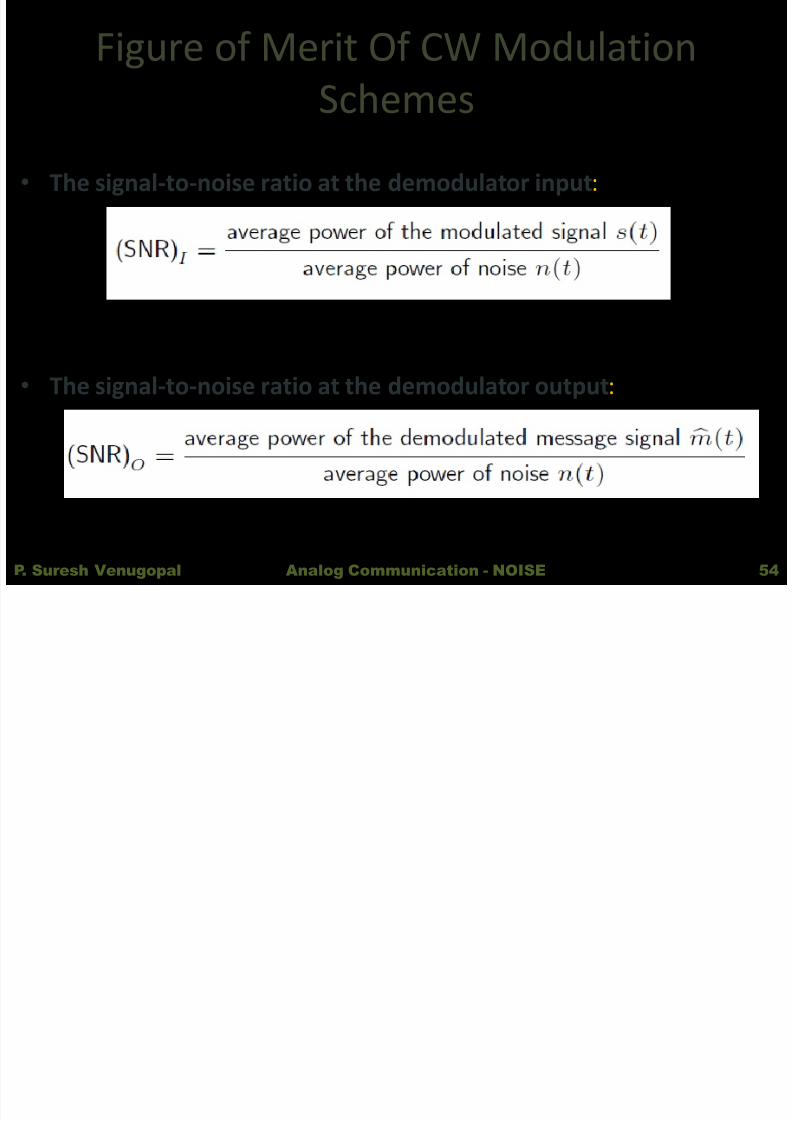
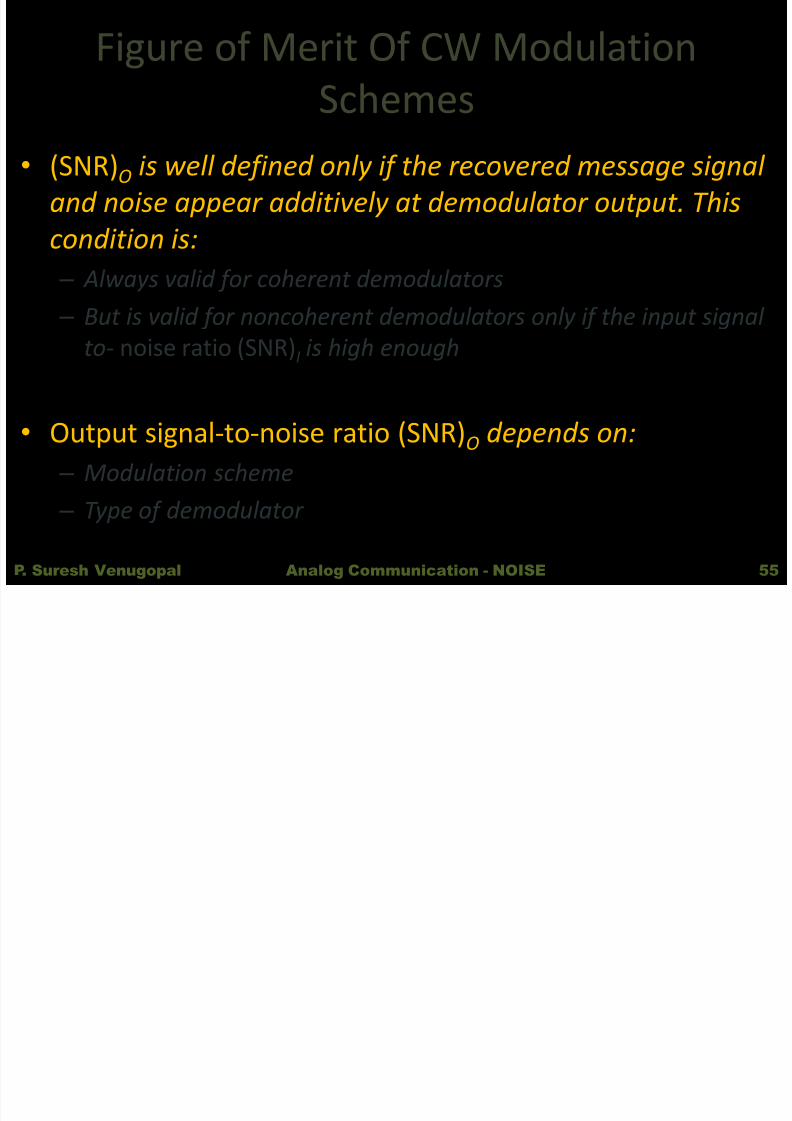
Figure of Merit Of CW ModulationSchemes
• (SNR)O is well defined only if the recovered message signal and noise appear additively at demodulator output. Thiscondition is:
–
Always valid for coherent demodulators – But is valid for noncoherent demodulators only if the input signal
to- noise ratio (SNR) I is high enough
• Output signal-to-noise ratio (SNR) O depends on: – Modulation scheme – Type of demodulator
P. Suresh Venugopal 55Analog Communication - NOISE
Fi f M i Of CW M d l i

8/2/2019 Noise Notes
http://slidepdf.com/reader/full/noise-notes 56/89
Figure of Merit Of CW ModulationSchemes
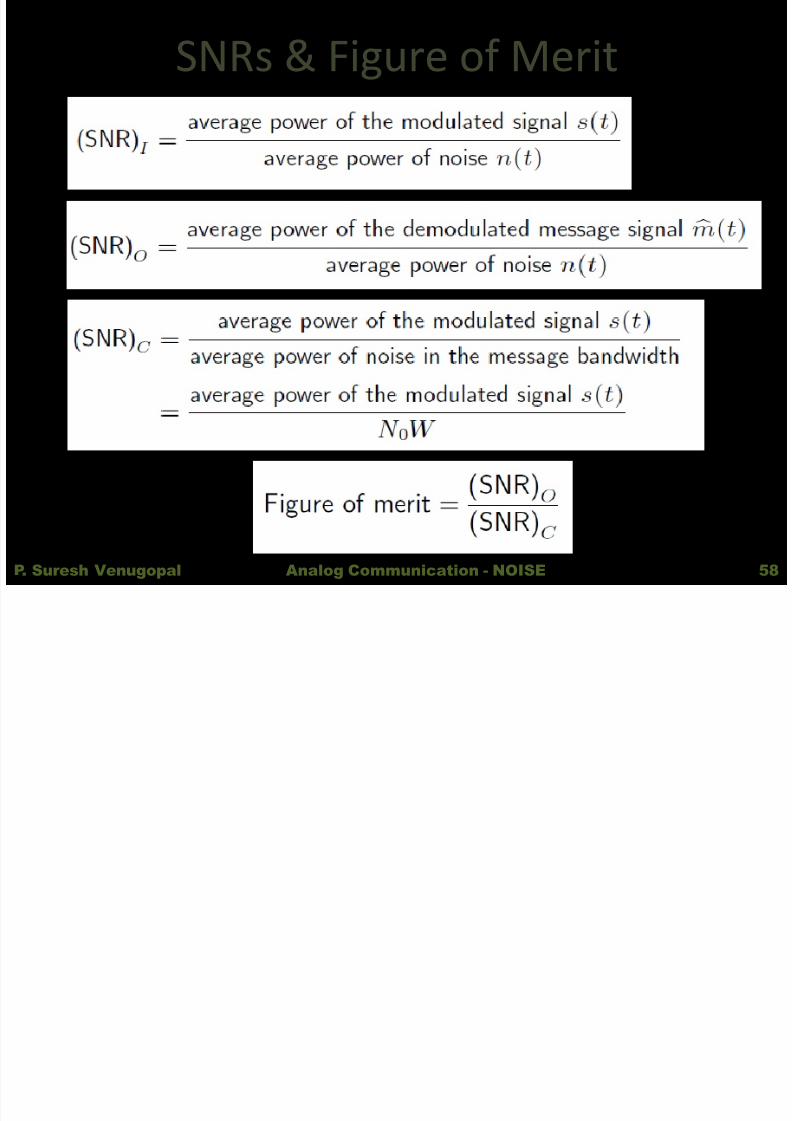
Conditions of comparison• To get a fair comparison of CW modulation schemes and receiver
configurations, it must be made on an equal basis. – Modulated signal s(t) transmitted by each modulation scheme has the same
average power – Channel and receiver noise w(t) has the same average power measured in the
message bandwidth W • According to the equal basis, the channel signal-to-noise ratio is
defined as:
56
Fi f M i Of CW M d l i
8/2/2019 Noise Notes
http://slidepdf.com/reader/full/noise-notes 57/89
Figure of Merit Of CW ModulationSchemes
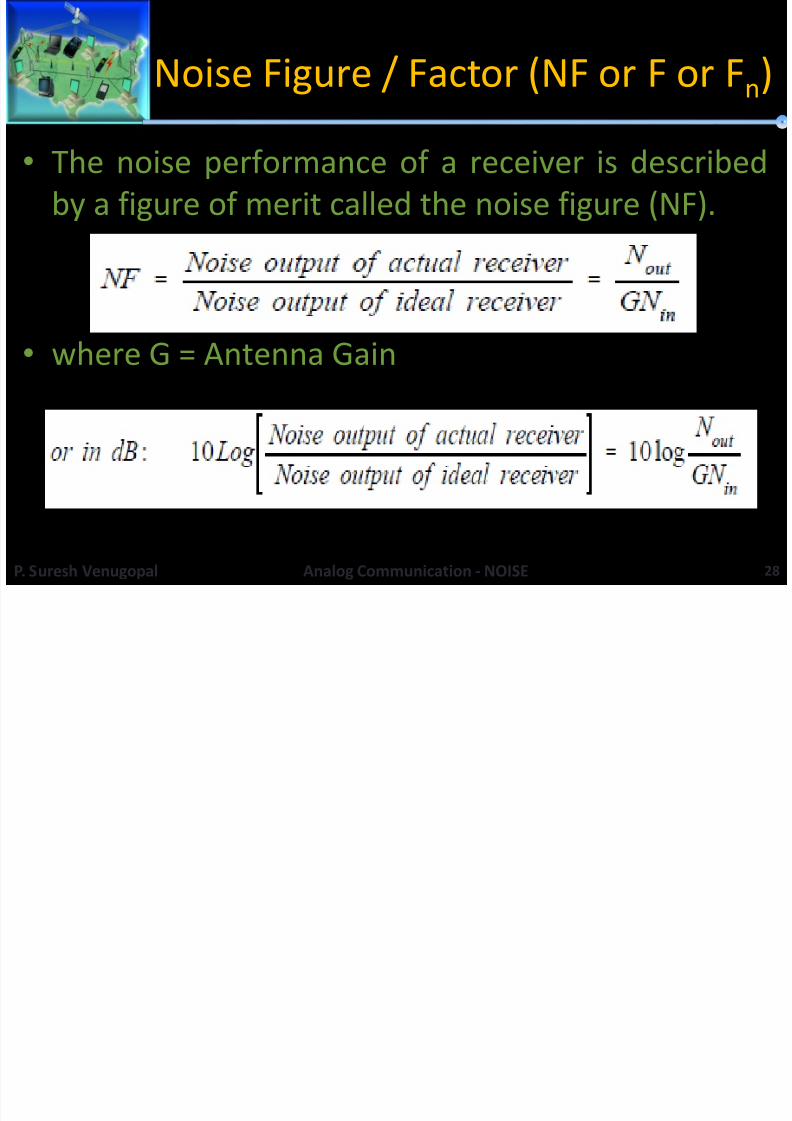
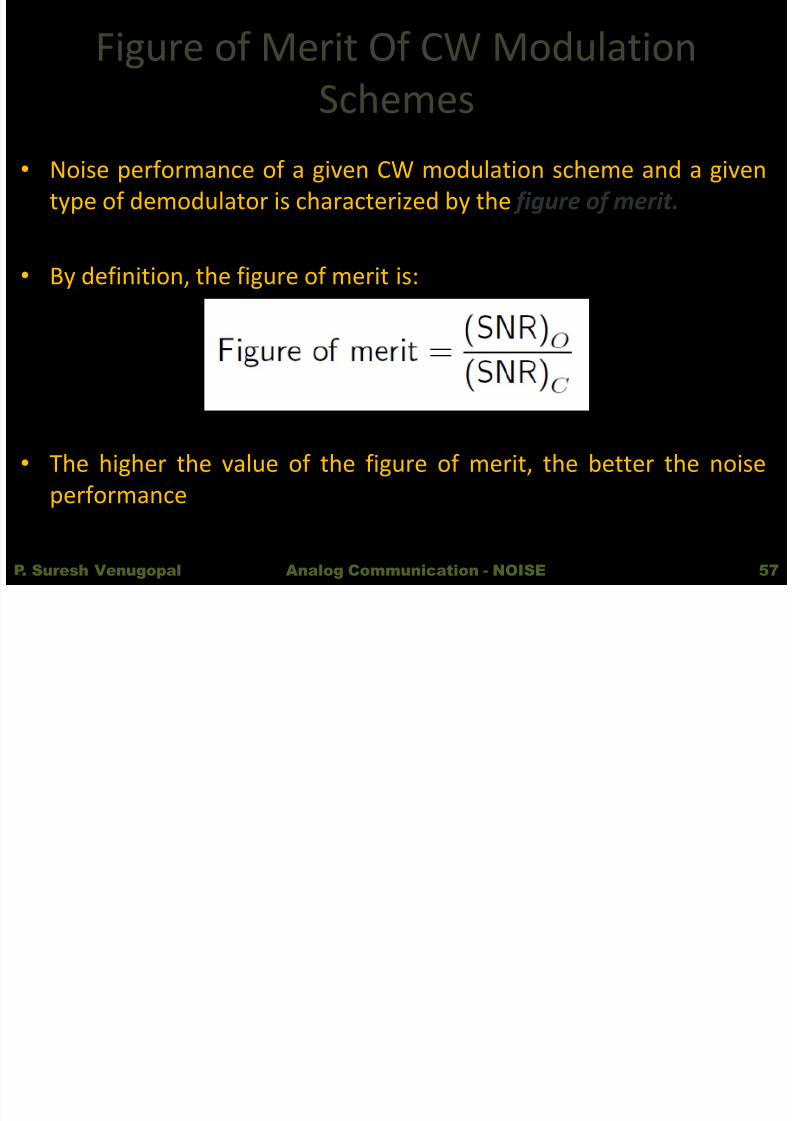
• Noise performance of a given CW modulation scheme and a giventype of demodulator is characterized by the figure of merit.
•
By definition, the figure of merit is:
• The higher the value of the figure of merit, the better the noiseperformance
P. Suresh Venugopal 57Analog Communication - NOISE
8/2/2019 Noise Notes
http://slidepdf.com/reader/full/noise-notes 58/89
SNRs & Figure of Merit
P. Suresh Venugopal 58Analog Communication - NOISE
N i i AM DSB FC R i
8/2/2019 Noise Notes
http://slidepdf.com/reader/full/noise-notes 59/89
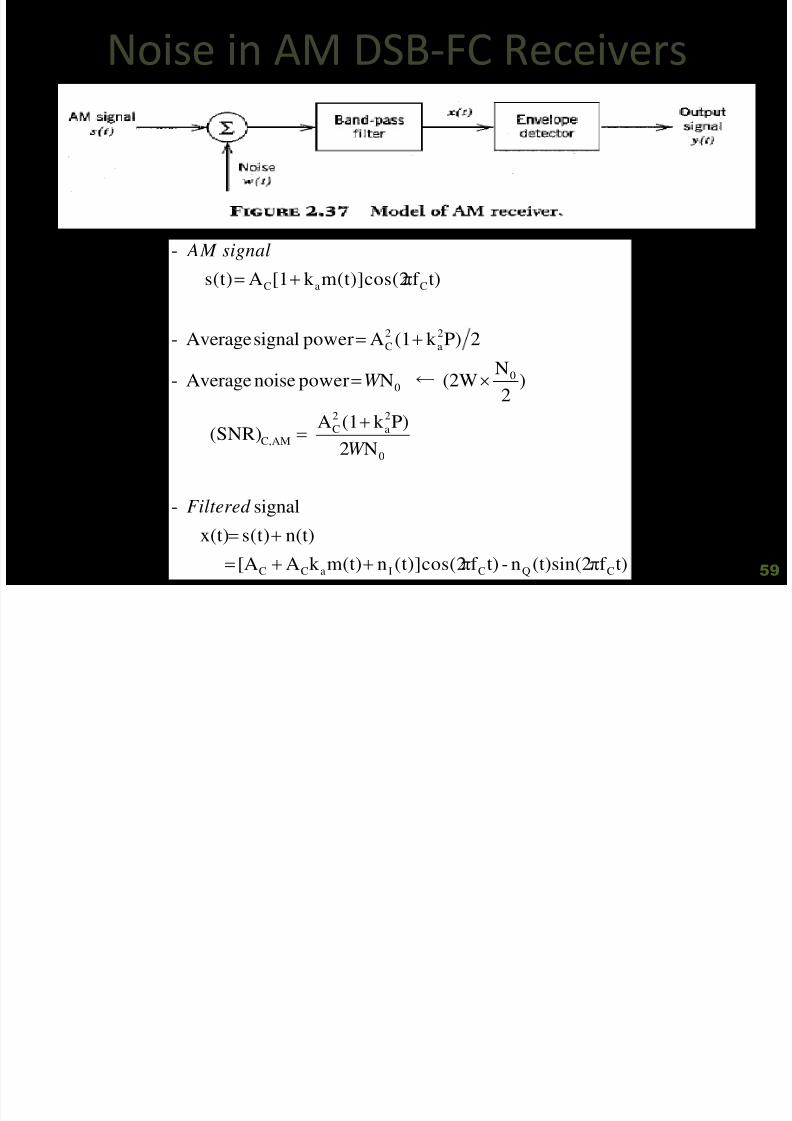
Noise in AM DSB-FC Receivers
t)f π(t)sin(2n-t)f π(t)]cos(2nm(t)k A[A
n(t)s(t)x(t)
signal -
N2P)k (1A (SNR)
)2
N(2W ← NpowernoiseAverage -
2P)k (1ApowersignalAverage -
t)f πm(t)]cos(2k [1As(t)
-
CQCIaCC
0
2a2CAMC,
00
2a
2C
CaC
Filtered
W
W
signal AM
59
8/2/2019 Noise Notes
http://slidepdf.com/reader/full/noise-notes 60/89
Noise in AM DSB-FC Receivers
1Pk 1
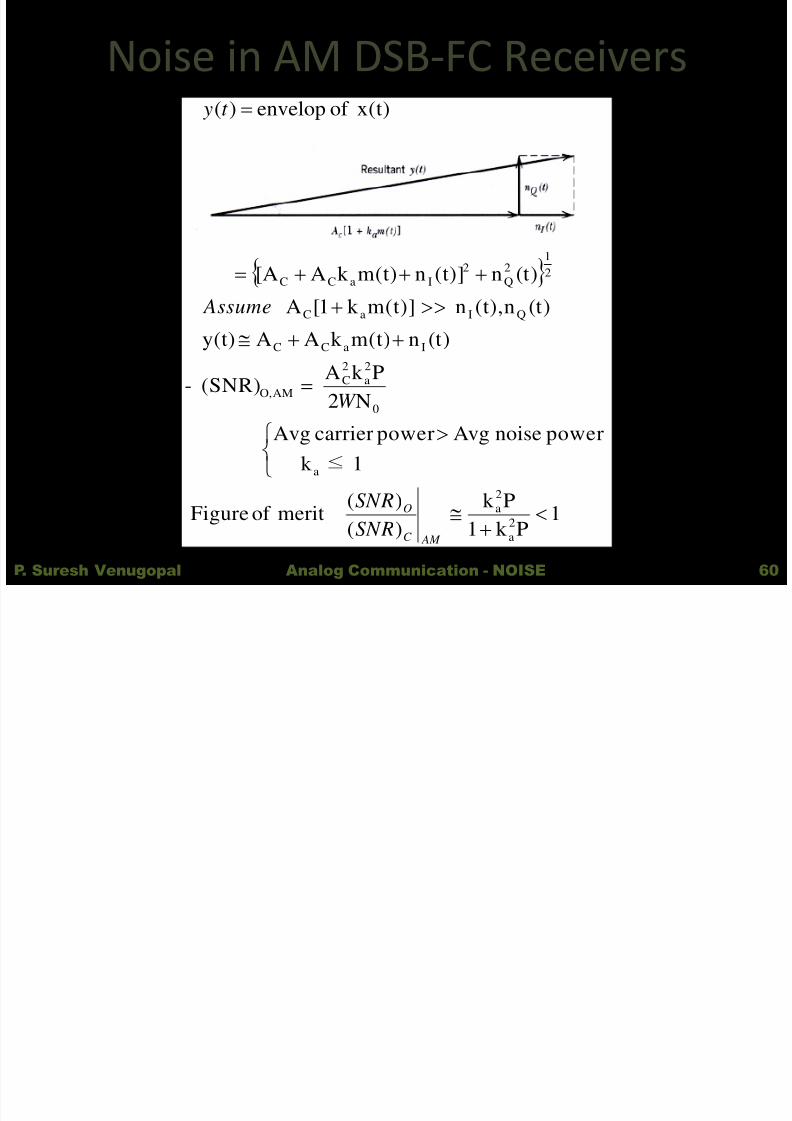
Pk )()(
meritof Figure
1 ≤k
powernoiseAvgpowercarrierAvg
N2Pk A
(SNR) -
(t)nm(t)k AAy(t)
(t)n(t),n m(t)]k 1[A (t)n(t)]nm(t)k A[A
x(t)of envelop)(
2a
2a
a
0
2a
2C
AMO,
IaCC
QIaC
21
2
Q
2
IaCC
AM C
O
SNRSNR
W
Assume
t y
P. Suresh Venugopal 60Analog Communication - NOISE
8/2/2019 Noise Notes
http://slidepdf.com/reader/full/noise-notes 61/89
Threshold effect
• The threshold is a value of carrier-to-noise ratio below which the noise performance of a demodulatordeteriorates much more rapidly than proportionately tothe carrier-to-noise ratio.
• Every noncoherent detector exhibits a threshold effect,
below the threshold the restored message signalbecomes practically useless.
P. Suresh Venugopal 61Analog Communication - NOISE
N i i AM DSB FC R i
8/2/2019 Noise Notes
http://slidepdf.com/reader/full/noise-notes 62/89
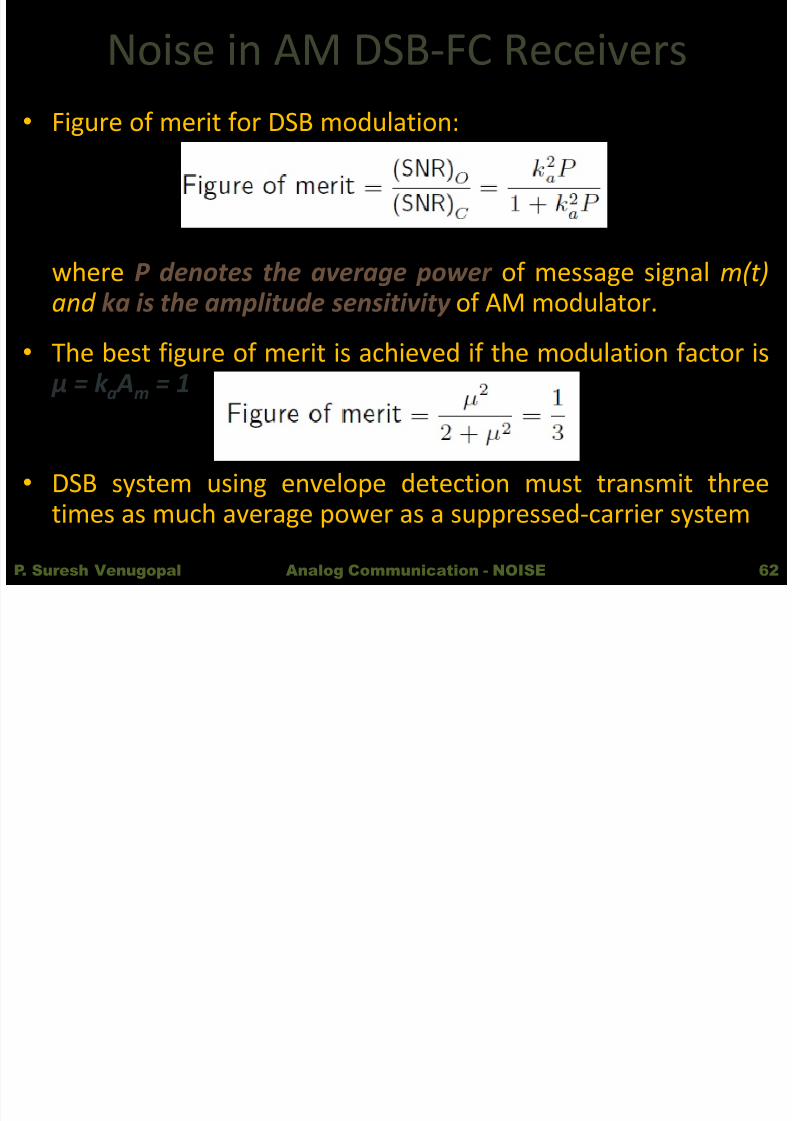
Noise in AM DSB-FC Receivers• Figure of merit for DSB modulation:
where P denotes the average power of message signal m(t)and ka is the amplitude sensitivity of AM modulator.
• The best figure of merit is achieved if the modulation factor is µ = k a Am = 1
• DSB system using envelope detection must transmit threetimes as much average power as a suppressed-carrier system
P. Suresh Venugopal 62Analog Communication - NOISE
8/2/2019 Noise Notes
http://slidepdf.com/reader/full/noise-notes 63/89
Threshold effect
Physical explanation:
• If the carrier-to-noise ratio is high enough then the signaldominates and the noise causes only a small unwanted
AM and PM.
• However, if the carrier-to-noise ratio is small then thenoise dominates which results in a complete loss of
information.• As a result, the demodulator output does not contain the
message signal at all.P. Suresh Venugopal 63Analog Communication - NOISE
Th h ld ff t
8/2/2019 Noise Notes
http://slidepdf.com/reader/full/noise-notes 64/89
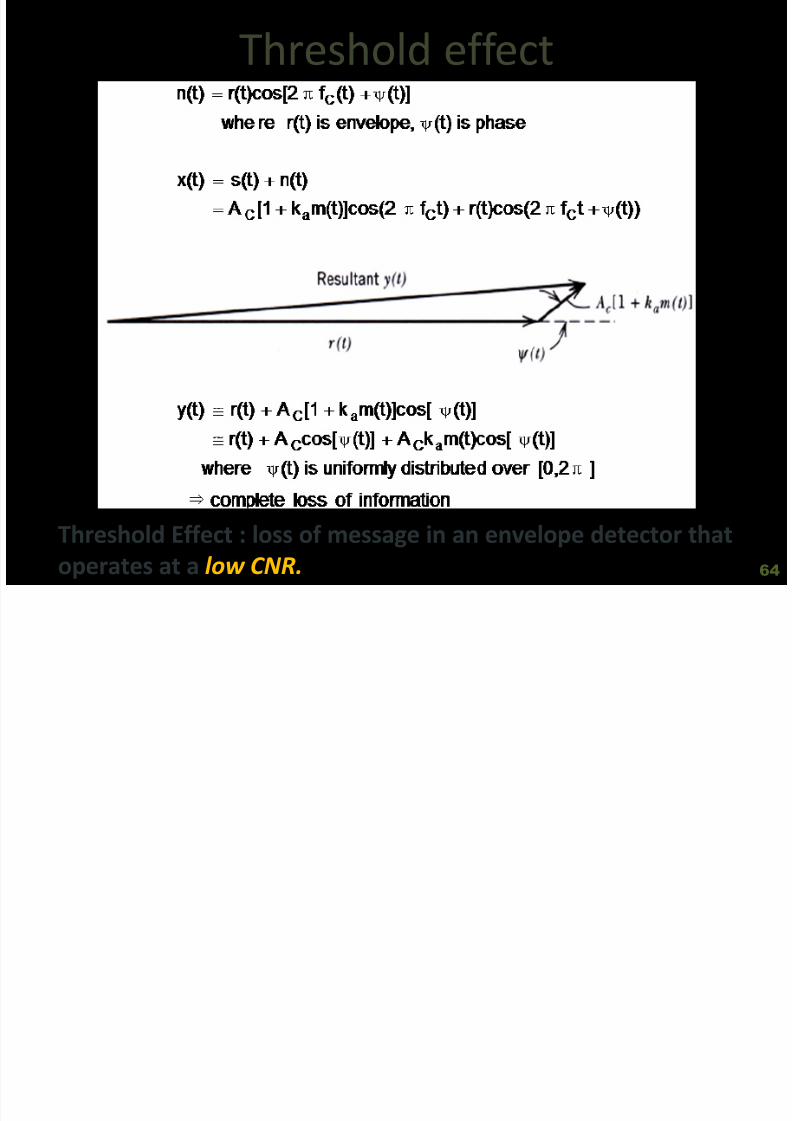
Threshold effect
Threshold Effect : loss of message in an envelope detector thatoperates at a low CNR. 64
N i i AM DSB SC R i

8/2/2019 Noise Notes
http://slidepdf.com/reader/full/noise-notes 65/89
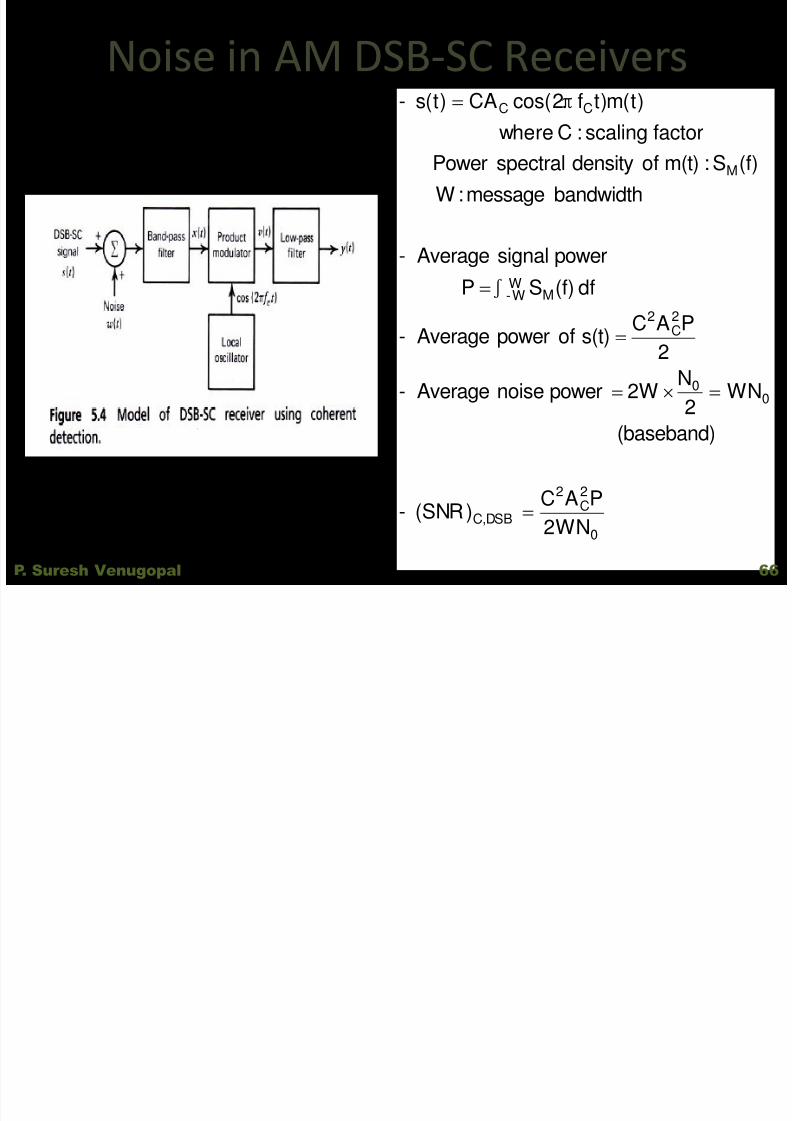
Noise in AM DSB-SC Receivers
P. Suresh Venugopal 65Analog Communication - NOISE
8/2/2019 Noise Notes
http://slidepdf.com/reader/full/noise-notes 66/89
N i i AM DSB SC R i
8/2/2019 Noise Notes
http://slidepdf.com/reader/full/noise-notes 67/89
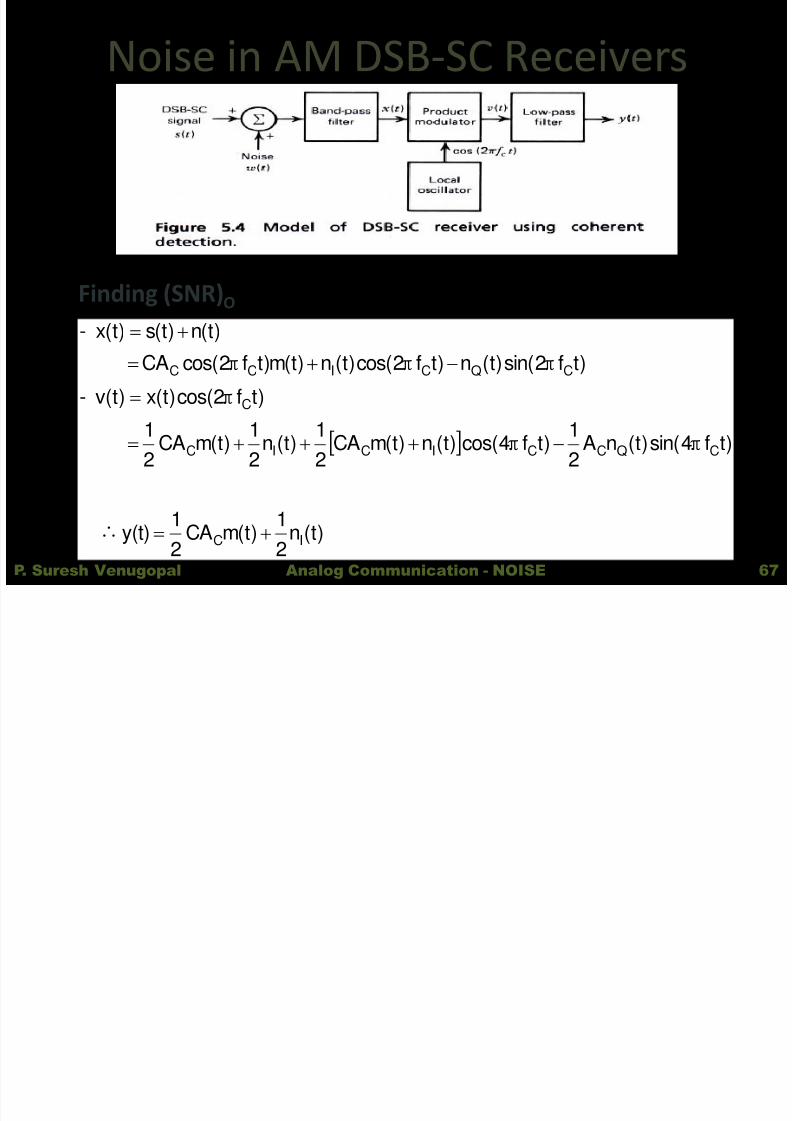
Noise in AM DSB-SC Receivers
Finding (SNR) O
)t(n
2
1)t(mCA
2
1y(t)
)tf4sin()t(nA21)tf4cos()t(n)t(mCA
21)t(n
21)t(mCA
21
)tf2cos()t(x)t(v -
)tf2sin()t(n)tf2cos()t(n)t(m)tf2cos(CA
)t(n)t(s)t(x -
IC
CQCCICIC
C
CQCICC
ππ
π
πππ
P. Suresh Venugopal 67Analog Communication - NOISE
N i i AM DSB SC R i
8/2/2019 Noise Notes
http://slidepdf.com/reader/full/noise-notes 68/89
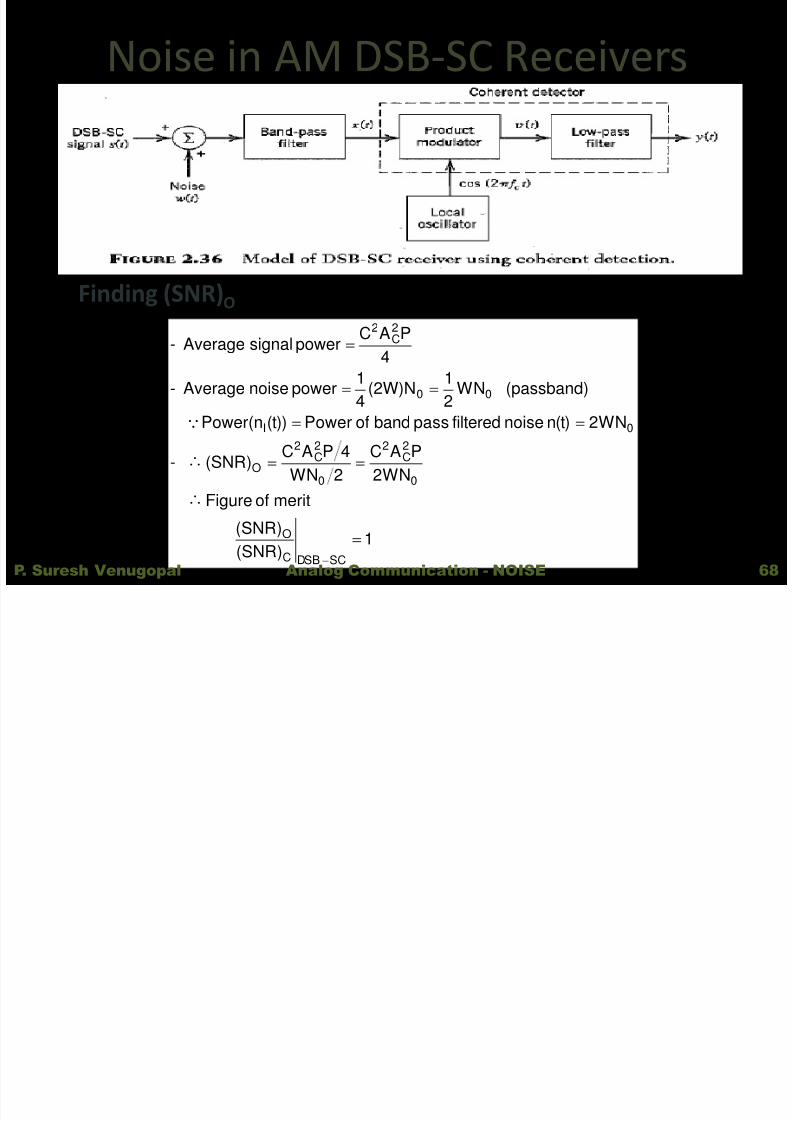
Noise in AM DSB-SC Receivers
Finding (SNR) O
1
)SNR(
)SNR(
meritofFigure NW2
PAC2NW4PAC
)SNR( -
NW2n(t)noisefilteredpassbandofPower(t))Power(n
(passband) NW21(2W)N
41 powernoiseAverage-
4PAC
powersignalAverage-
SCDSBC
O
0
2C
2
0
2C
2
O
0I
00
2C
2
P. Suresh Venugopal 68Analog Communication - NOISE
8/2/2019 Noise Notes
http://slidepdf.com/reader/full/noise-notes 69/89
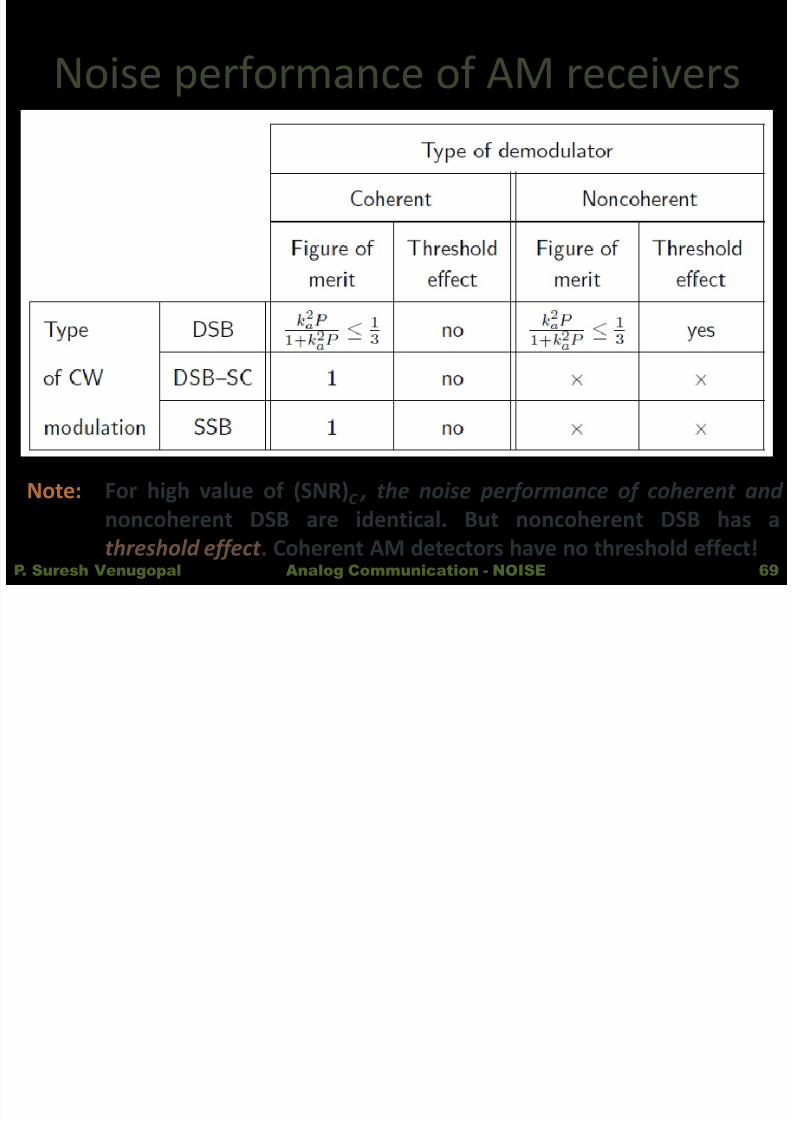
Noise performance of AM receivers
Note: For high value of (SNR) C , the noise performance of coherent and noncoherent DSB are identical. But noncoherent DSB has athreshold effect . Coherent AM detectors have no threshold effect!
P. Suresh Venugopal 69Analog Communication - NOISE
Comparison of noise performance of
8/2/2019 Noise Notes
http://slidepdf.com/reader/full/noise-notes 70/89
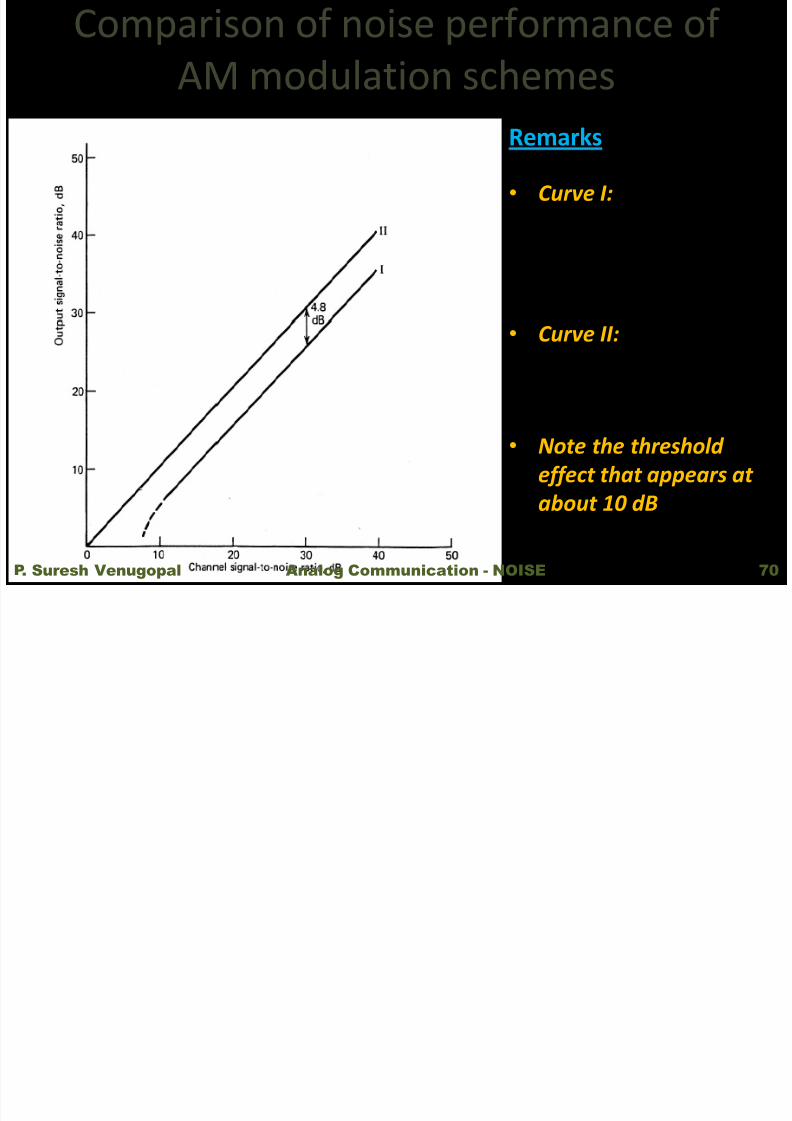
p pAM modulation schemes
Remarks• Curve I: DSB modulation
and envelope detector with modulation factor
µ = 1• Curve II: DSB– SC and
SSB with coherent demodulator
• Note the threshold effect that appears at about 10 dB
P. Suresh Venugopal 70Analog Communication - NOISE
Noise in FM Receivers
8/2/2019 Noise Notes
http://slidepdf.com/reader/full/noise-notes 71/89
Noise in FM Receivers
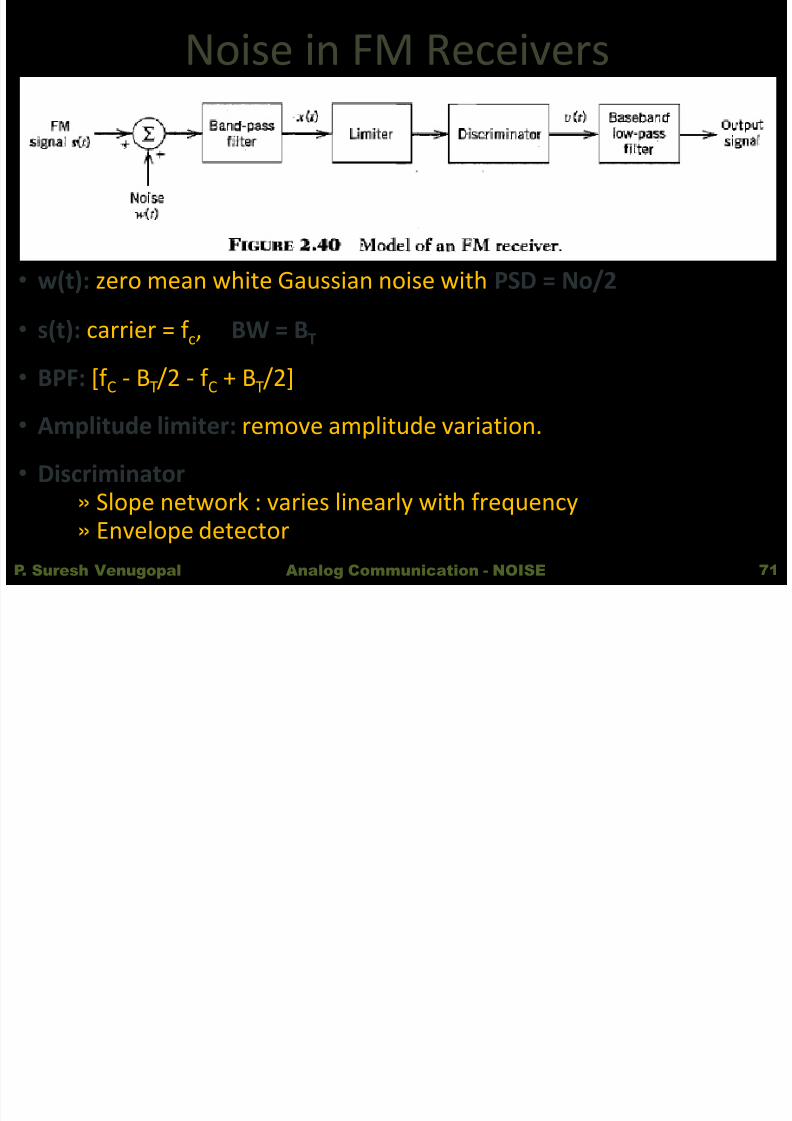
•
w(t): zero mean white Gaussian noise with PSD = No/2• s(t): carrier = f c, BW = BT
• BPF: [f C - BT/2 - f C + BT/2]
• Amplitude limiter: remove amplitude variation.• Discriminator
» Slope network : varies linearly with frequency» Envelope detector
P. Suresh Venugopal 71Analog Communication - NOISE
Noise in FM Receivers
8/2/2019 Noise Notes
http://slidepdf.com/reader/full/noise-notes 72/89
Noise in FM Receivers
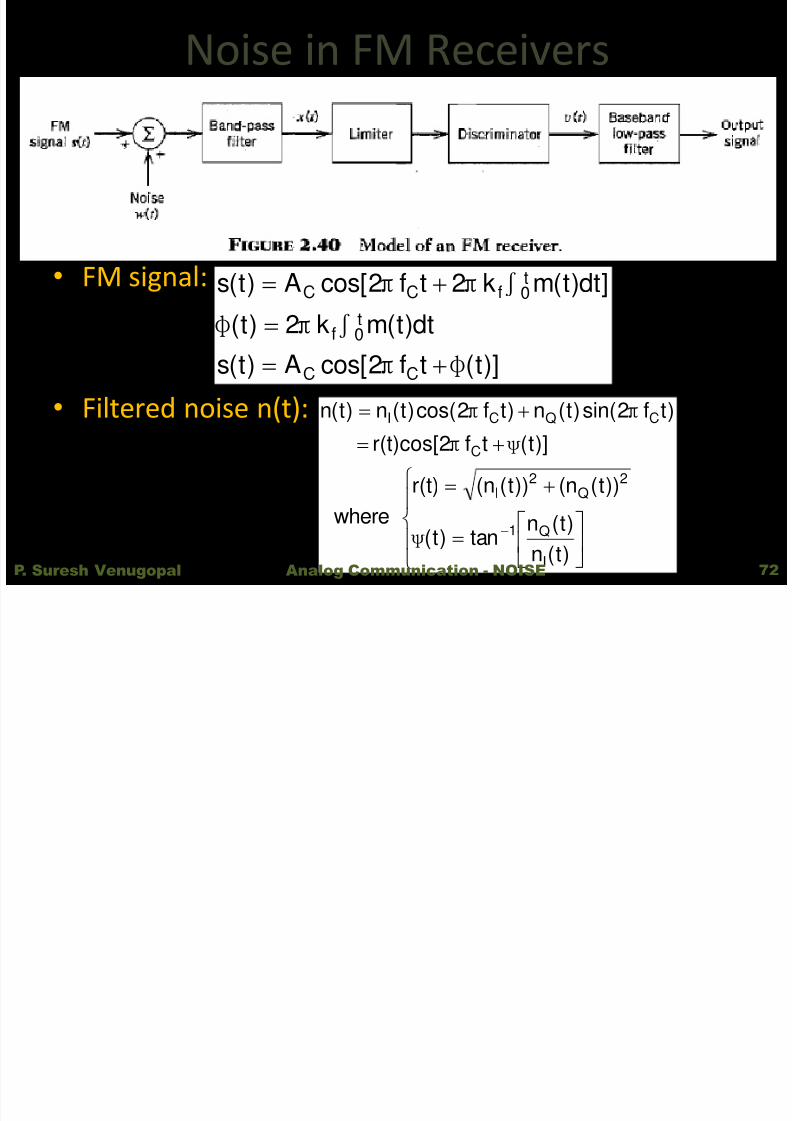
•
FM signal:
• Filtered noise n(t):)]t(tf2cos[A)t(s
dt)t(mk2)t(]dt)t(mk2tf2cos[A)t(s
CC
t0f
t0fCC
φπ
πφππ
∫∫
)t(n
)t(ntan)t(
))t(n())t(n(r(t) where
)]t(tf2r(t)cos[
)tf2sin()t(n)tf2cos()t(n)t(n
I
Q1
2Q
2I
C
CQCI
ψ
ψπ
ππ
P. Suresh Venugopal 72Analog Communication - NOISE
Noise in FM Receivers
8/2/2019 Noise Notes
http://slidepdf.com/reader/full/noise-notes 73/89
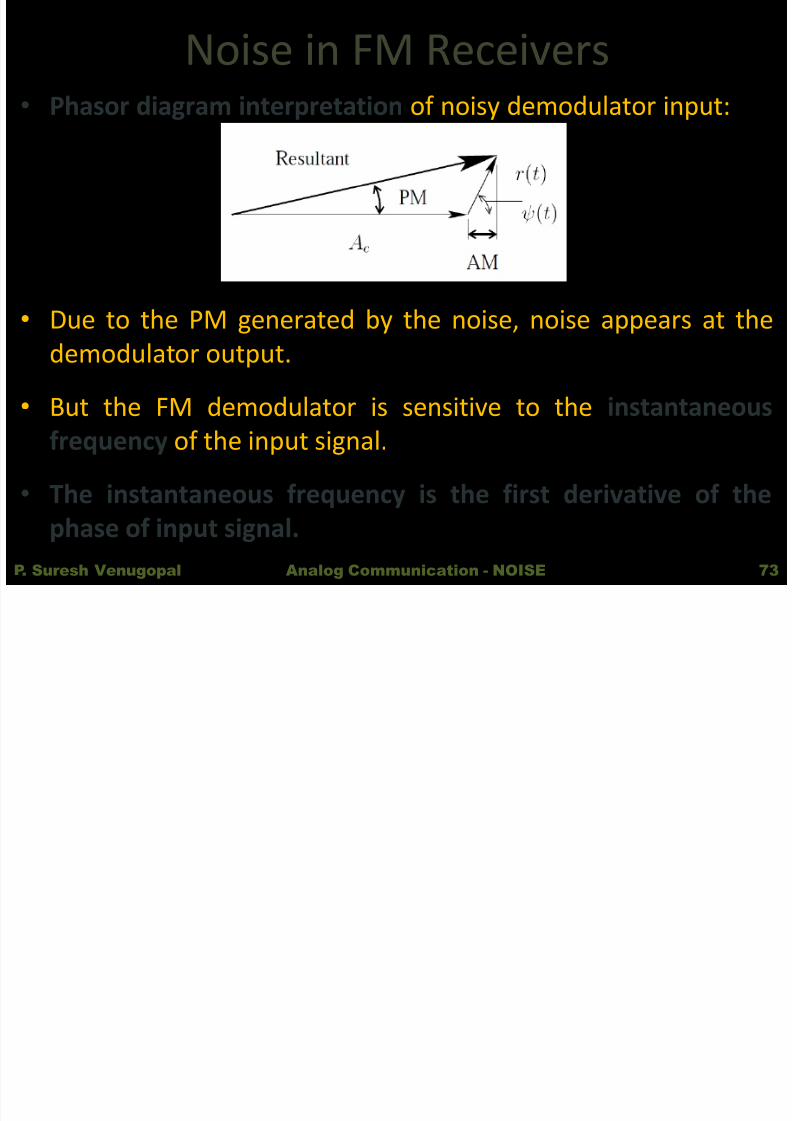
Noise in FM Receivers• Phasor diagram interpretation of noisy demodulator input:
• Due to the PM generated by the noise, noise appears at thedemodulator output.
• But the FM demodulator is sensitive to the instantaneousfrequency of the input signal.
• The instantaneous frequency is the first derivative of thephase of input signal.
P. Suresh Venugopal 73Analog Communication - NOISE
Noise in FM Receivers
8/2/2019 Noise Notes
http://slidepdf.com/reader/full/noise-notes 74/89
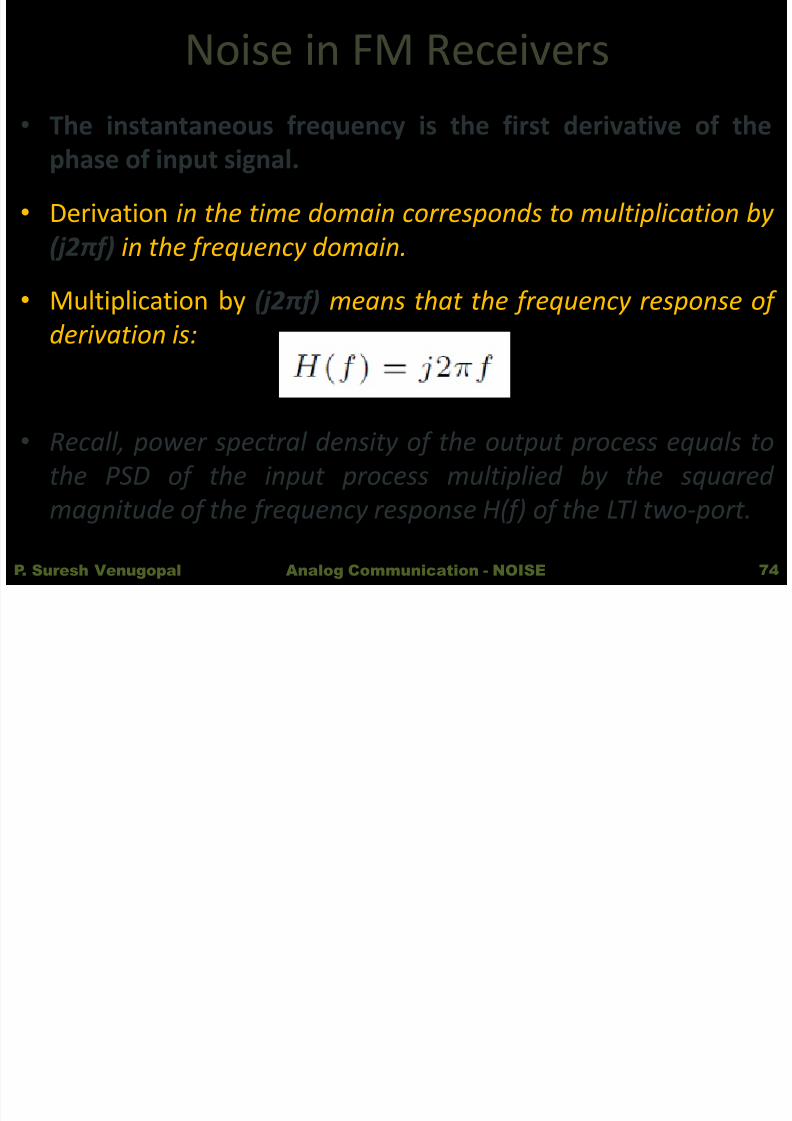
Noise in FM Receivers• The instantaneous frequency is the first derivative of the
phase of input signal.
• Derivation in the time domain corresponds to multiplication by (j2 π f) in the frequency domain.
• Multiplication by (j2 π f) means that the frequency response of derivation is:
• Recall, power spectral density of the output process equals tothe PSD of the input process multiplied by the squared magnitude of the frequency response H(f) of the LTI two-port.
P. Suresh Venugopal 74Analog Communication - NOISE
Noise in FM Receivers
8/2/2019 Noise Notes
http://slidepdf.com/reader/full/noise-notes 75/89
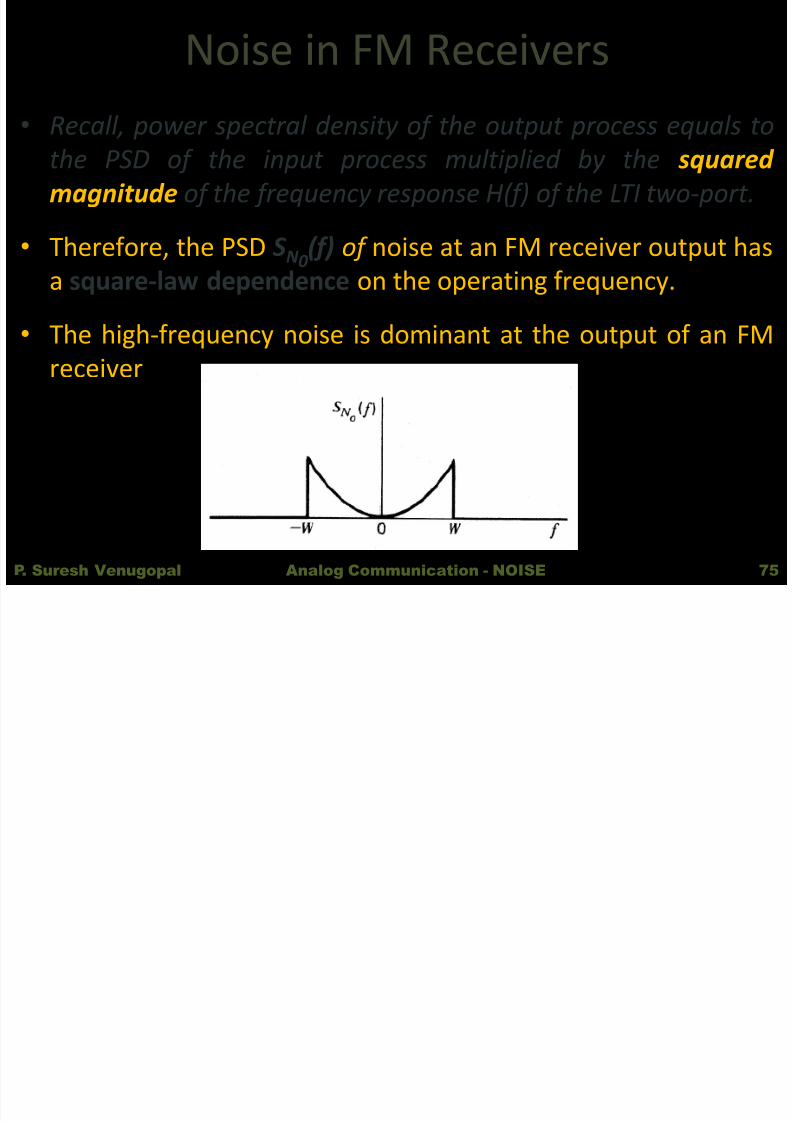
Noise in FM Receivers• Recall, power spectral density of the output process equals to
the PSD of the input process multiplied by the squared magnitude of the frequency response H(f) of the LTI two-port.
• Therefore, the PSD SN 0 (f) of noise at an FM receiver output has
a square-law dependence on the operating frequency.• The high-frequency noise is dominant at the output of an FM
receiver
P. Suresh Venugopal 75Analog Communication - NOISE
Noise in FM Receivers
8/2/2019 Noise Notes
http://slidepdf.com/reader/full/noise-notes 76/89
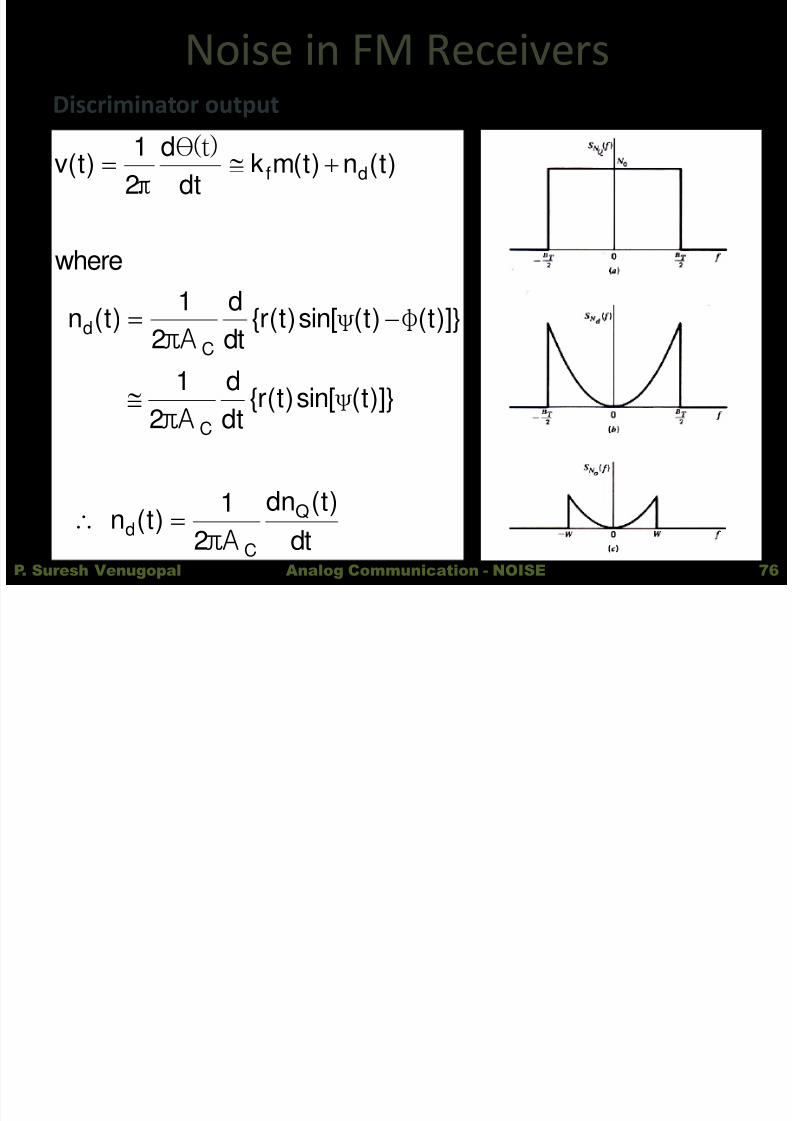
Noise in FM ReceiversDiscriminator output
dt)t(dn
πA21
)t(n
)]}t(sin[)t(r{dt
d
πA2
1
)]}t()t(sin[)t(r{dtd
πA21
)t(n
where
)t(n)t(mkdt
d21)t(v
Q
Cd
C
Cd
df
ψ
φψ
θ(t)π
P. Suresh Venugopal 76Analog Communication - NOISE
8/2/2019 Noise Notes
http://slidepdf.com/reader/full/noise-notes 77/89
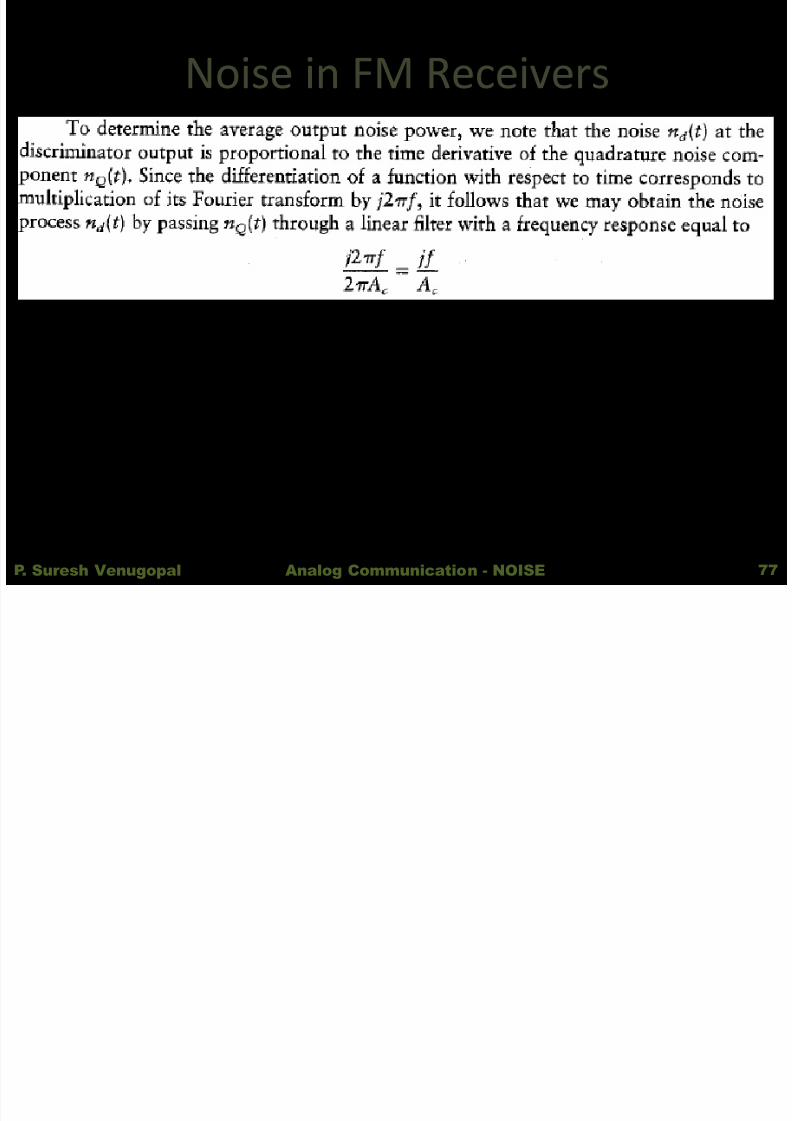
Noise in FM Receivers
P. Suresh Venugopal Analog Communication - NOISE 77
8/2/2019 Noise Notes
http://slidepdf.com/reader/full/noise-notes 78/89
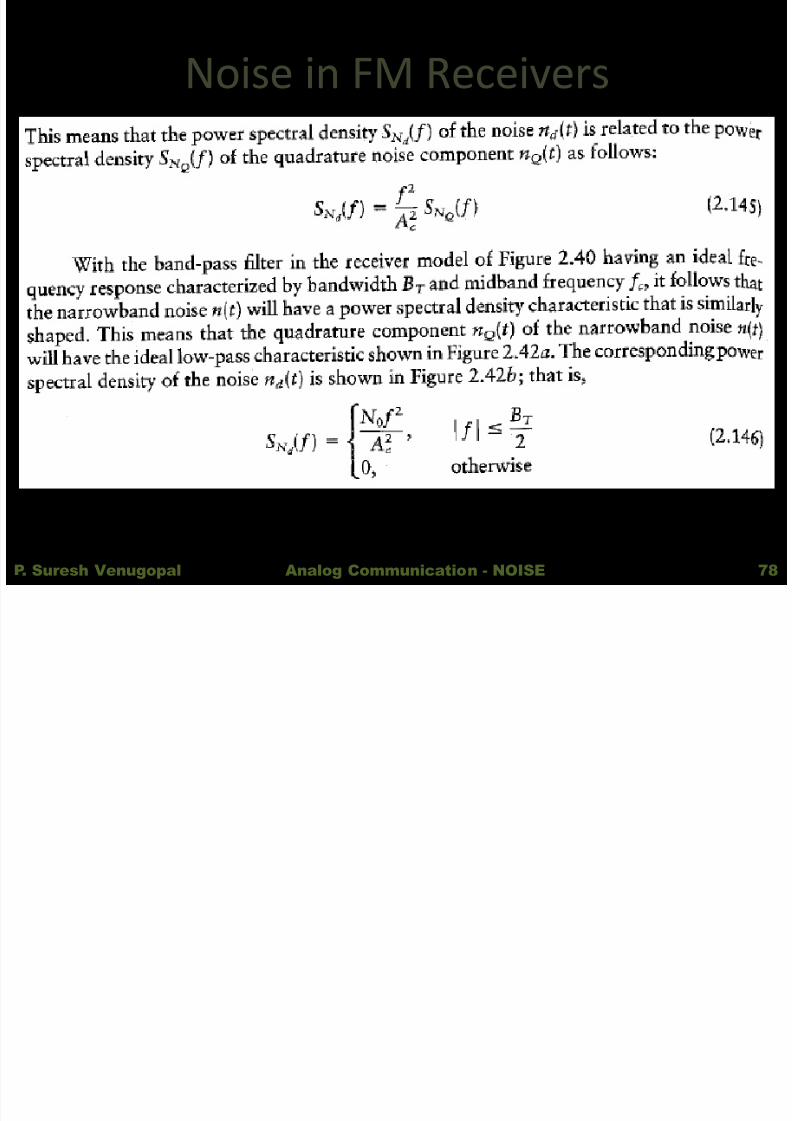
Noise in FM Receivers
P. Suresh Venugopal Analog Communication - NOISE 78
8/2/2019 Noise Notes
http://slidepdf.com/reader/full/noise-notes 79/89
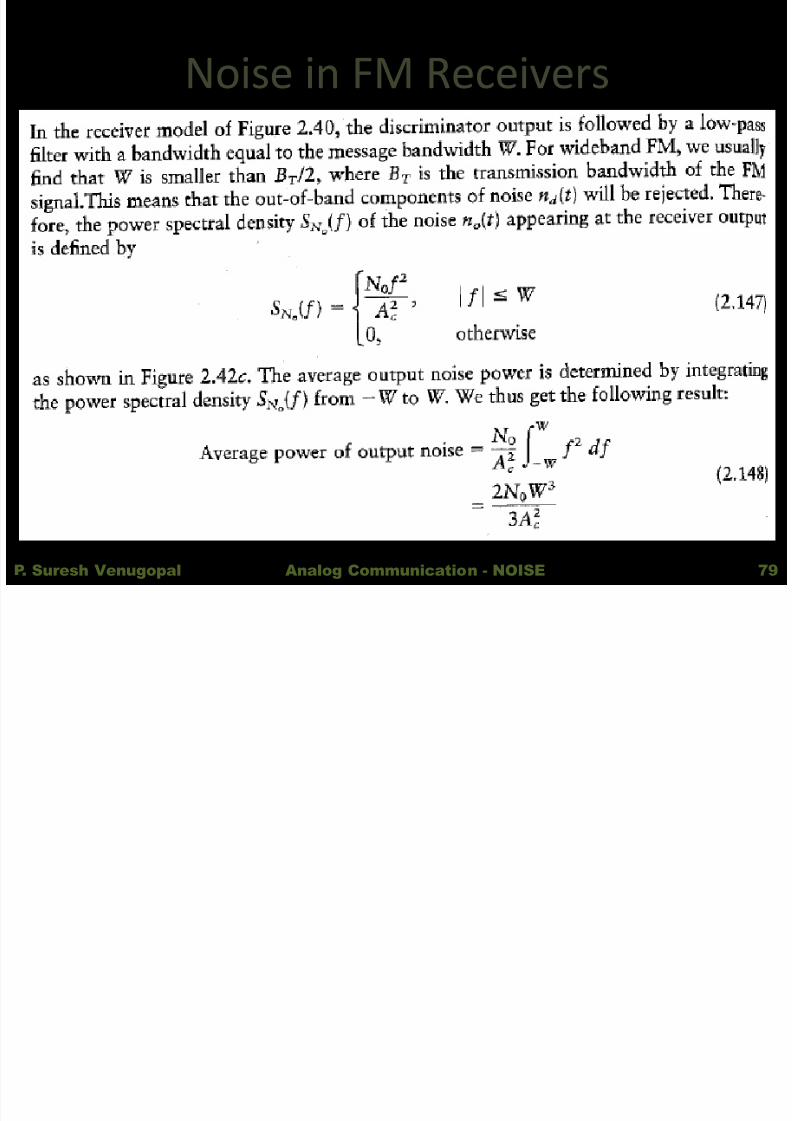
Noise in FM Receivers
P. Suresh Venugopal Analog Communication - NOISE 79
8/2/2019 Noise Notes
http://slidepdf.com/reader/full/noise-notes 80/89
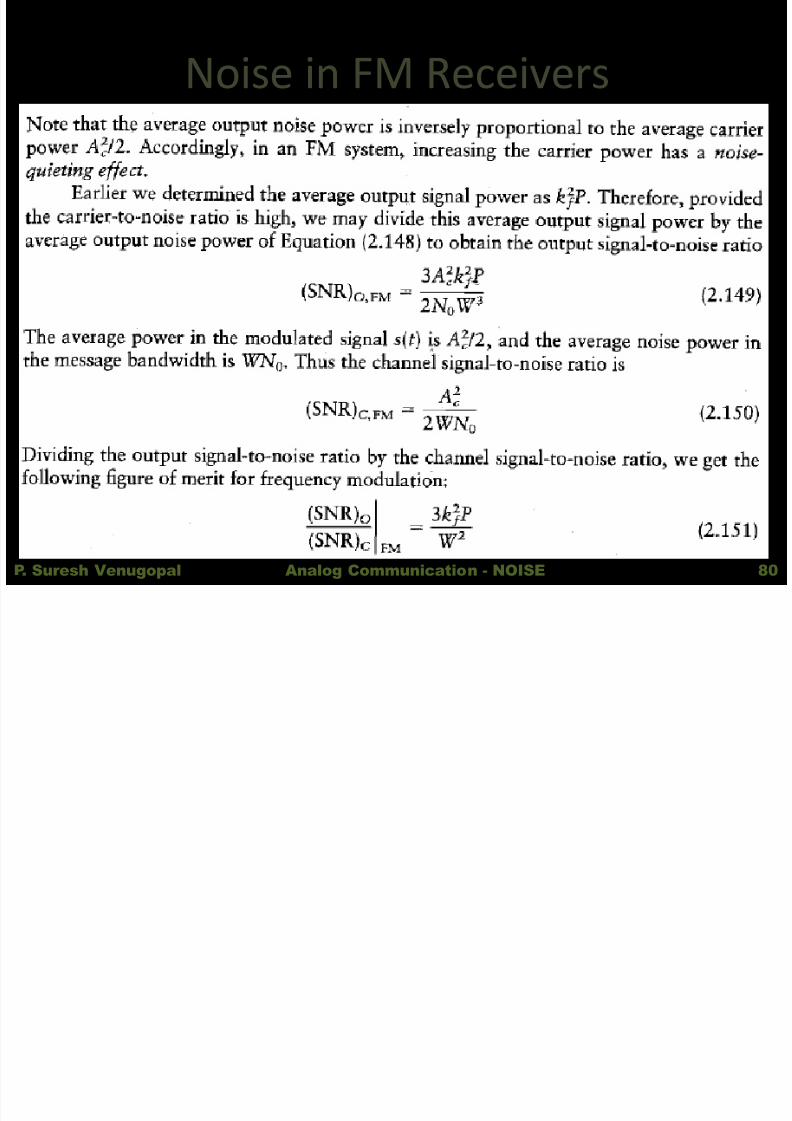
Noise in FM Receivers
P. Suresh Venugopal Analog Communication - NOISE 80
8/2/2019 Noise Notes
http://slidepdf.com/reader/full/noise-notes 81/89
Noise in FM Receivers
8/2/2019 Noise Notes
http://slidepdf.com/reader/full/noise-notes 82/89
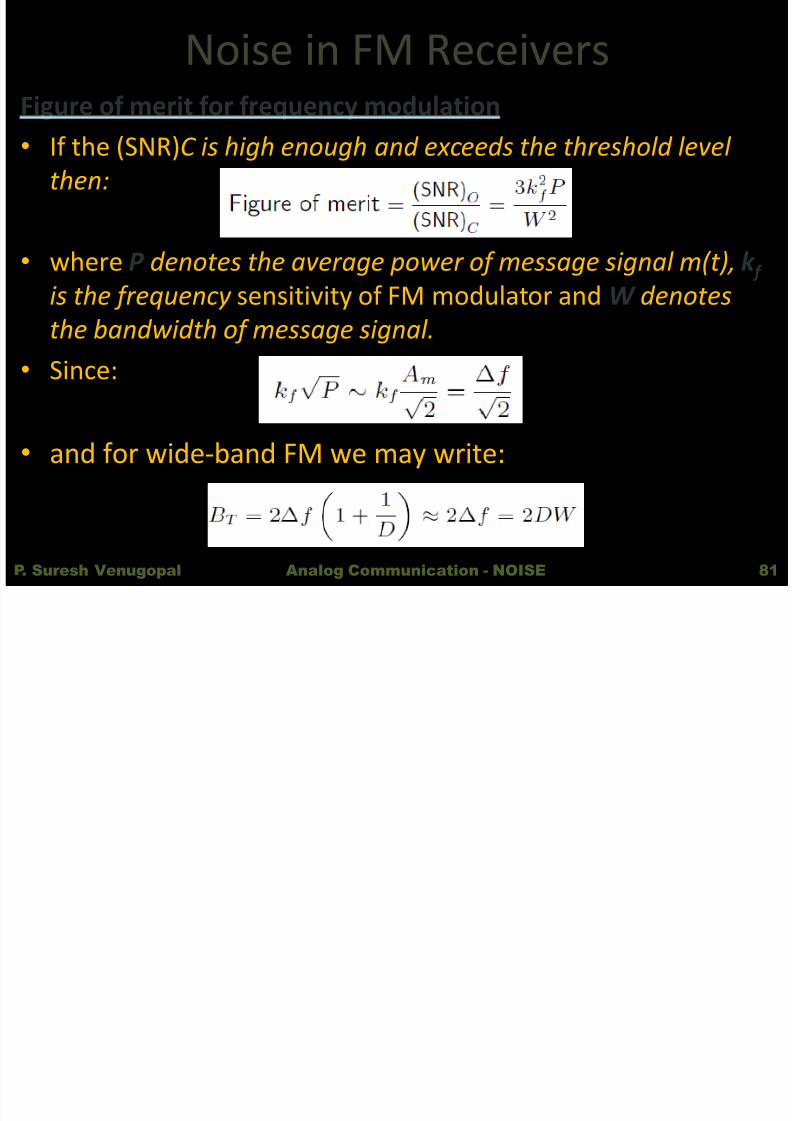
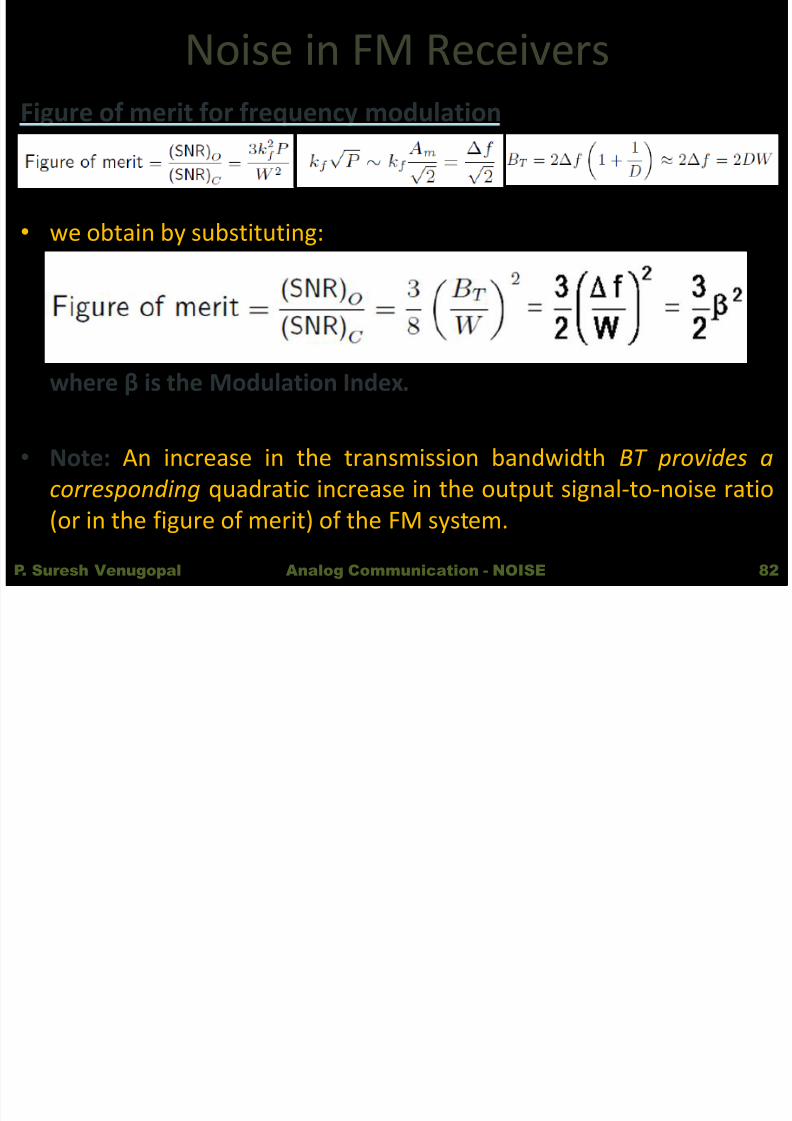
Noise in FM ReceiversFigure of merit for frequency modulation
• we obtain by substituting:
where β is the Modulation Index.
• Note: An increase in the transmission bandwidth BT provides acorresponding quadratic increase in the output signal-to-noise ratio(or in the figure of merit) of the FM system.
P. Suresh Venugopal 82Analog Communication - NOISE
FM h h ld ff
8/2/2019 Noise Notes
http://slidepdf.com/reader/full/noise-notes 83/89
FM threshold effect
• The figure of merit discussed above is valid only if thecarrier-to-noise ratio (SNR)C is high compared with unity .
•
It has been found experimentally that as (SNR)C isdecreased below a threshold , each FM demodulator,either coherent or noncoherent, breaks:
– At first isolated clicks are heard and if the (SNR) C is decreased further, the clicks rapidly merge into a crackling. sound
P. Suresh Venugopal 83Analog Communication - NOISE
FM threshold effect
8/2/2019 Noise Notes
http://slidepdf.com/reader/full/noise-notes 84/89
FM threshold effectA qualitative explanation
• If (SNR)C is small then the noise becomes dominant and the phasor representation and the decomposition of noise into aPM and AM are not valid any more.
• The phase of noise is a random variable and it may take anyvalue.
• Recall, the FM demodulator is sensitive to the derivate of
phase.• When the phase of demodulator input varies suddenly by 2 π
due to the noise then an impulse, i.e., click appears at thereceiver output.
P. Suresh Venugopal 84Analog Communication - NOISE
Pre-emphasis and de-emphasis in FM
8/2/2019 Noise Notes
http://slidepdf.com/reader/full/noise-notes 85/89
Pre emphasis and de emphasis in FMsystems
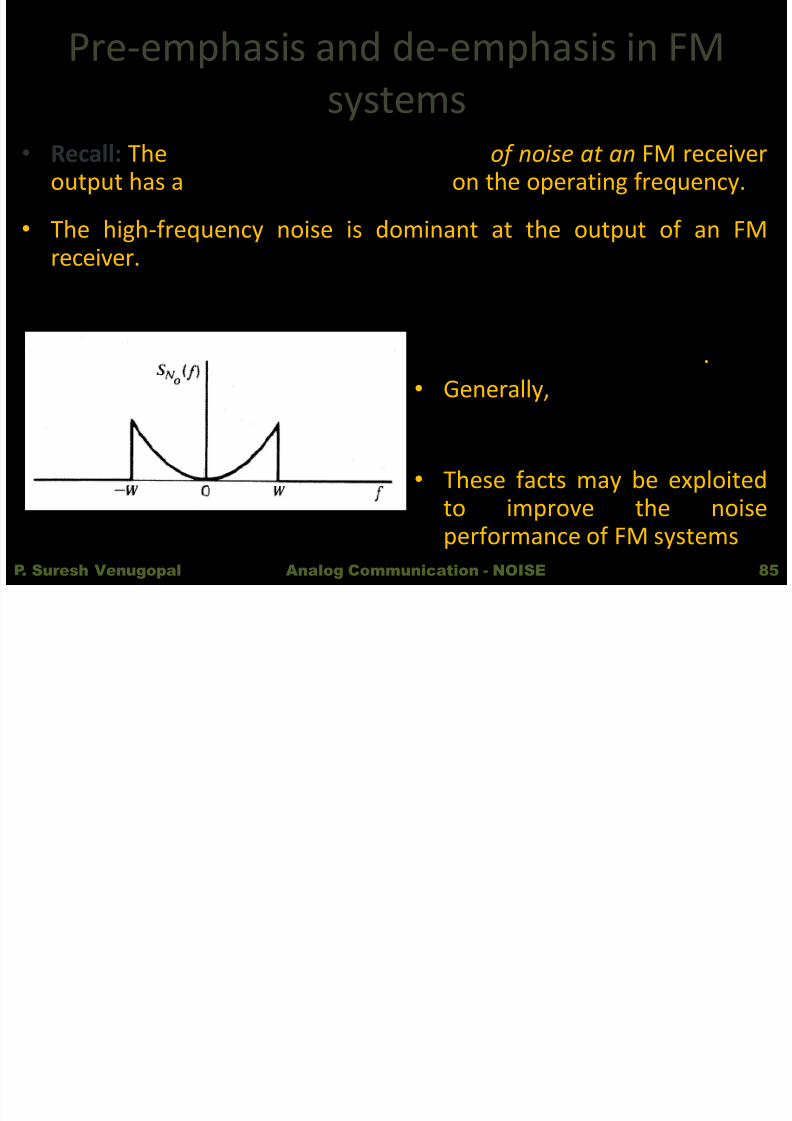
• Recall: The power spectral density SN 0 (f) of noise at an FM receiveroutput has a square law dependence on the operating frequency.
• The high-frequency noise is dominant at the output of an FMreceiver.
• The power spectral density of message signals usually fallsoff at higher frequencies .
• Generally, the most part of a
message signal is in the low-frequency region.• These facts may be exploited
to improve the noiseperformance of FM systems
P. Suresh Venugopal 85Analog Communication - NOISE
Pre-emphasis and de-emphasis in FM
8/2/2019 Noise Notes
http://slidepdf.com/reader/full/noise-notes 86/89
Pre emphasis and de emphasis in FMsystems
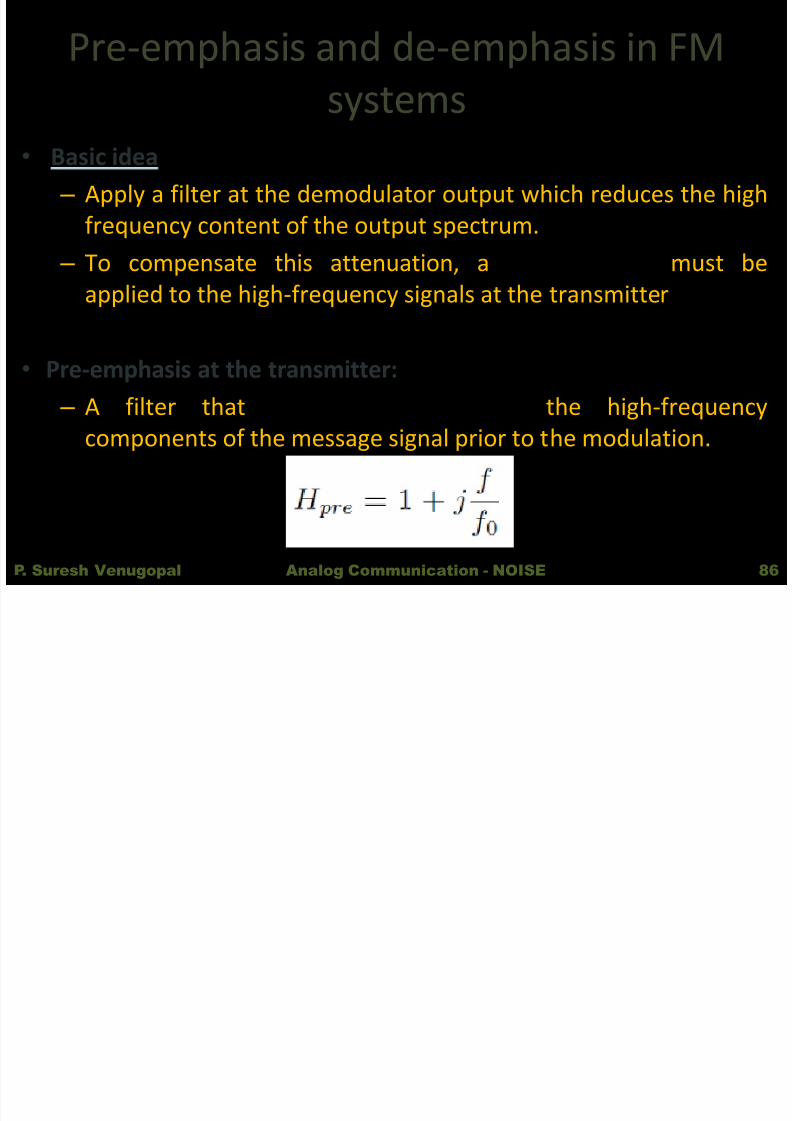
• Basic idea – Apply a filter at the demodulator output which reduces the high
frequency content of the output spectrum. – To compensate this attenuation, a pre-emphasis must be
applied to the high-frequency signals at the transmitter
• Pre-emphasis at the transmitter: – A filter that artificially emphasize the high-frequency
components of the message signal prior to the modulation.
P. Suresh Venugopal 86Analog Communication - NOISE
Pre-emphasis and de-emphasis in FM
8/2/2019 Noise Notes
http://slidepdf.com/reader/full/noise-notes 87/89
e e p as s a d de e p as ssystems
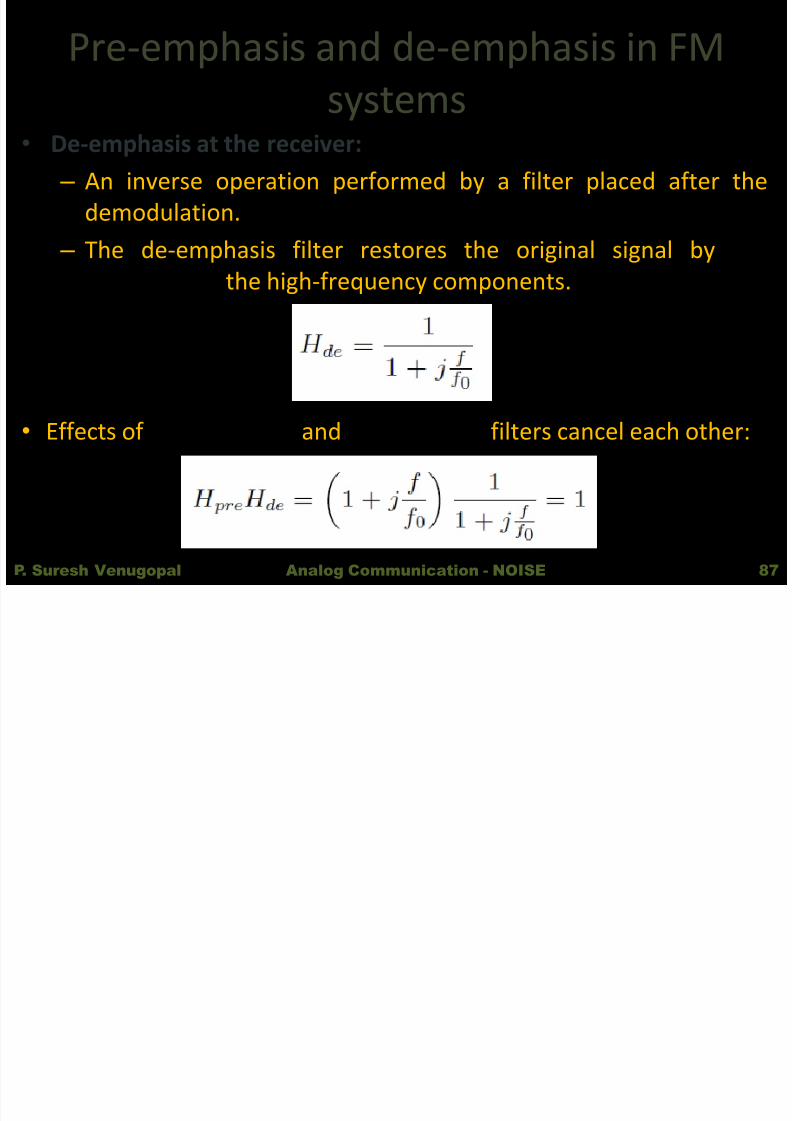
•
De-emphasis at the receiver: – An inverse operation performed by a filter placed after the
demodulation. – The de-emphasis filter restores the original signal by de-
emphasizing the high-frequency components.
• Effects of pre-emphasis and de-emphasis filters cancel each other:
P. Suresh Venugopal 87Analog Communication - NOISE
Use of pre-emphasis and de-emphasis

8/2/2019 Noise Notes
http://slidepdf.com/reader/full/noise-notes 88/89
p p pin an FM system
P. Suresh Venugopal 88Analog Communication - NOISE
Comparison of noise performance of
8/2/2019 Noise Notes
http://slidepdf.com/reader/full/noise-notes 89/89
CW systems
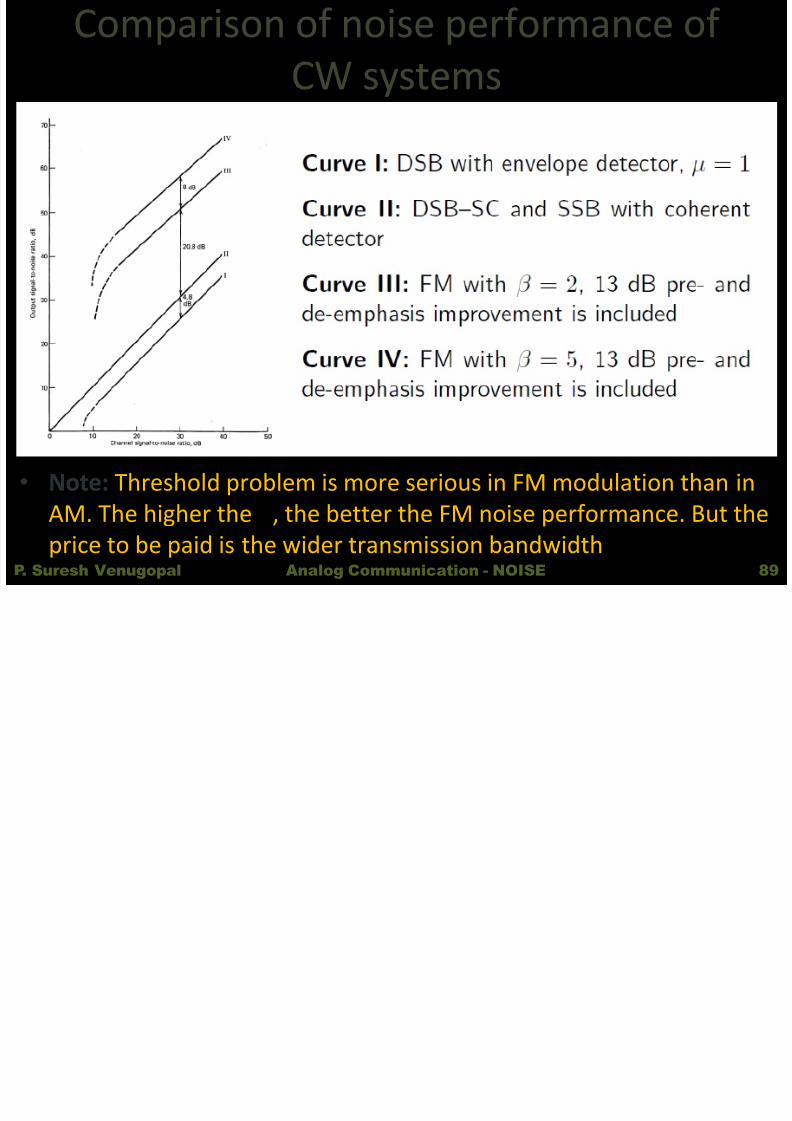
• Note: Threshold problem is more serious in FM modulation than inAM. The higher the β , the better the FM noise performance. But the