Embed Size (px)
Citation preview
Noise reduction in day-care centresby reducing reverberation timeAnalyses and case studies
André L’EspéranceAlex BoudreauFrançois GariépyPhilippe Bacon
REPORT
STUDIES ANDRESEARCH PROJECTS
R-463
Dépôt légalBibliothèque et Archives nationales 2006ISBN 13 : 978-2-89631-047-0 (version imprimée)ISBN 10 : 2-89631-047-9 (version imprimée)ISBN 13 : 978-2-89631-048-7 (PDF)ISBN 10 : 2-89631-048-7 (PDF)Édition originale : ISBN 10 : 2-89631-013-4ISSN : 0820-8395
IRSST – Communications Division505, De Maisonneuve Blvb West Montréal (Québec) H3A 3C2 Telephone: 514 288-1551 Fax: 514 288-7636wwwwww..iirrsssstt..qqcc..ccaaInstitut de recherche Robert Sauvé en santé et en sécurité du travail, July 2006
� To contribute, through research, to the prevention ofindustrial accidents and occupational diseases as wellas to the rehabilitation of affected workers.
� To offer the laboratory services and expertise necessaryfor the activities of the public occupational health andsafety prevention network.
� To disseminate knowledge, and to act as scientificbenchmark and expert.
Funded by the Commission de la santé et de la sécuritédu travail, the IRSST has a board of directors made upof an equal number of employer and worker representa-tives.
Visit our Web site for complete up-to-date informationabout the IRSST. All our publicationscan be downloaded at no charge.www.irsst.qc.ca
To obtain the latest information on the research carriedout or funded by the IRSST, subscribe to Prévention autravail, the free magazine published jointly by theIRSST and the CSST.Subscription: 1-877-221-7046
TO FIND OUT MORE…
MISSION
OUR RESEARCHis working for you!
Established in Québec since 1980, the Institut de recherche Robert-Sauvé en santé et en sécurité du travail (IRSST) is a scientific research organization known for the quality of its work andthe expertise of its personnel.

STUDIES ANDRESEARCH PROJECTS
Noise reduction in day-care centresby reducing reverberation timeAnalyses and case studies
André L’Espérance, Ph.D. Eng., Alex Boudreau, Ph.D. Eng., François Gariépy, Eng. j. and Philippe Bacon, Tech. T.S.O.
Soft dB Inc.
REPORT
This study was financed by the IRSST. The conclusions and recommendations are those of the authors.
This publication is available freeof charge on the Web site.
www.irsst.qc.caClic Research
Disclaimer
The IRSST makes no guaranteeregarding the accuracy, reliabilityor completeness of the informationcontained in this document. In nocase shall the IRSST be heldresponsible for any physical orpsychological injury or materialdamage resulting from the use ofthis information.
Note that the content of the docu-ments is protected by Canadianintellectual property legislation.
The results of the research work published in this document have been peer-reviewed
IN CONFORMITY WITH THE IRSST’S POLICIES
The IRSST wishes to thank the Swedish company Ecophon, which financed the translation of this report.

IRSST - Noise reduction in day-care centres by using acoustic treatments i
SUMMARY
According to various studies, noise levels in day-care centres and play areas are occasionally high, possibly resulting in health repercussions: auditory fatigue and stress being the two main negative effects. Furthermore, high noise levels may lead to irritability, difficulty communicating, reduced intelligibility and even to a reduction in verbal acquisition amongst children.
Several solutions have already been identified and implemented in order to reduce noise levels at day-care centres: cutting down on the number of children at each location, placing tennis balls under chair legs and modifying the choice of activities and toys.
Another way of reducing noise in day-care centres is by adding absorbent acoustic materials. This solution is, however, not very common, probably due to a lack of information on the influence that acoustic materials have on noise levels.
The aim of this study is to examine the relevance and effectiveness of the use of absorbent acoustic materials in day-care centres in reducing noise levels.
To do so, noise levels, reverberation time and the surface radiation factor were measured and analysed in 40 locations at 20 day-care centres in Quebec. Furthermore, dosimetry measurements were carried out on workers at the day-care centres in the study in order to find out the noise doses they were exposed to.
After analysing the results, solutions were suggested and implemented in certain locations around the day-care centres, such as installing an acoustic ceiling and adding a band of acoustic panels at the top of the walls.
These treatments have led noise levels to be reduced by, on average, 6 to 7 dBA. Furthermore, a detailed analysis of the results has revealed that part of this reduction in noise levels is attributable to a change in the children’s behaviour and, consequently, in the childcare workers, who begin to speak more quietly in a less noisy environment.

IRSST - Noise reduction in day-care centres by using acoustic treatments iii
TABLE OF CONTENTS
1. CONTEXT........................................................................................................................................................1
2. AIM OF THE PROJECT................................................................................................................................2
3. NOISE LEVEL VS REVERBERATION TIME RELATIONSHIP (RT60) .................................................3
4. METHODOLOGY ..........................................................................................................................................6
4.1 GENERAL APPROACH.................................................................................................................................6 4.2 ACOUSTIC PARAMETERS AND EQUIPMENT .................................................................................................6
4.2.1 Measuring noise levels ........................................................................................................................6 4.2.2 Measurement of reverberation times ...................................................................................................8 4.2.3 Evaluation of acoustic dispersion on floors ........................................................................................8 4.2.4 Dosimetry measurement ......................................................................................................................9
4.3 CHOICE OF DAY-CARE CENTRE PARTICIPANTS .........................................................................................10 5. SITUATION PRIOR TO INSTALLING THE TREATMENTS ..............................................................11
5.1 EXAMPLE OF DETAILED ANALYSIS OF A DAY-CARE CENTRE ....................................................................11 5.1.1 Sound levels .......................................................................................................................................11 5.1.2 Reverberation time (RT60) ................................................................................................................12 5.1.3 Dosimetry...........................................................................................................................................12 5.1.4 Evaluation of acoustic dispersion of floor.........................................................................................14 5.1.5 Model of effectiveness of acoustic treatments....................................................................................15
5.2 ANALYSIS OF ALL THE RESULTS ..............................................................................................................17 5.2.1 Analysis of the reverberation time (RT60).........................................................................................17 5.2.2 Noise level according to sound power emitted and the dimensions of the location ..........................19 5.2.3 Effect of type of floor covering ..........................................................................................................20 5.2.4 Summary ............................................................................................................................................21
5.3 RESULTS AND ANALYSIS OF DOSIMETRY MEASUREMENTS.......................................................................22 6. RECOMMENDED ACOUSTIC TREATMENTS......................................................................................24
6.1 SELECTION OF DAY-CARE CENTRES CONSIDERED FOR THE TREATMENTS.................................................24 6.2 THEORETICAL EVALUATION OF ACOUSTIC TREATMENTS .........................................................................24
6.2.1 Example of evaluation of location A-1 ..............................................................................................25 6.2.2 Predicted results for all locations......................................................................................................26
7. RESULTS OBTAINED .................................................................................................................................29
7.1 EXAMPLE OF DETAILED ANALYSIS OF LOCATION A-1 ..............................................................................29 7.1.1 Sound levels and noise reduction in location A-1..............................................................................31 7.1.2 Average sound levels and average reduction over two days of measurement...................................32 7.1.3 The estimated noise reduction based on RT60 measurements...........................................................33
7.2 RESULTS OBTAINED FOR ALL THE DAY-CARE CENTRES............................................................................36 7.2.1 Variation in treatments installed .......................................................................................................36 7.2.2 Reductions in RT60 reverberation times for all locations .................................................................38 7.2.3 Reductions in noise levels for all locations .......................................................................................44 7.2.4 Estimate of the reductions in noise levels as a result of the treatments installed..............................47
iv Noise reduction in day-care centres by using acoustic treatments - IRSST
7.2.5 Example of evaluation .......................................................................................................................49 7.2.6 Analysis of costs.................................................................................................................................50
7.3 BENEFICIAL EFFECTS OF LOW RT60 ON LEARNING..................................................................................52 7.4 OTHER CONSIDERATIONS REGARDING INSTALLATION AND MAINTENANCE..............................................52
7.4.1 Installation.........................................................................................................................................52 7.4.2 Maintenance ......................................................................................................................................52
8. CONCLUSION ..............................................................................................................................................54
IRSST - Noise reduction in day-care centres by using acoustic treatments 1
1. CONTEXT
Various studies have shown that noise levels in day-care rooms and play areas1 can be considerable and that these may have negative effects [1-6].
Although studies quantifying the problems caused by significant noise levels in day-care centres are still relatively limited, the following are the effects that can be felt:
1. Momentary high noise levels can lead to auditory fatigue and stress amongst workers [1,3];
2. Noise levels in day-care centres result in childcare workers talking louder in order to be heard2. This problem can lead to difficulty communicating and even to vocal disorders amongst the childcare workers;
3. According to Picard [3], current noise levels in the day-care centres undoubtedly and significantly reduce intelligibility and verbal acquisition amongst children.
The administrators, educators and others working in this environment also stress that noise has long been one of the main factors in causing stress, fatigue and irritability in day-care centres.
Various noise reduction solutions have already been identified [3] and implemented in the day-care centres. Reducing the number of children at each location, the choice of activities, having less noisy toys and placing tennis balls under the feet of the chairs are the main solutions which have allowed noise levels to be reduced.
Adding absorbent acoustic materials has also been identified as another method of reducing noise levels in a location. Until now, however, this solution has rarely been used. Several factors may explain this situation, including lack of information regarding the effect these materials may have on increasing or reducing noise levels.
1 Strictly speaking the term day-care centre refers to the individual recognised to be in charge and who is answerable to the
Ministry, while the term “installation” refers to the location. However, for the sake of simplicity, in this document, we will use the term “locations in the day-care centres” instead of “locations in the day-care centre installations”.
2 In fact, the noise level is between 70 and 80 dBA while a normal voice level is approximately 57 dBA. To ensure that there is a sufficient signal-to-noise ratio to be understood by the children, the childcare workers must speak very loudly, even shouting according to the R. Hétu classification [7].

2 Noise reduction in day-care centres by using acoustic treatments - IRSST
2. AIM OF THE PROJECT
The aim of this study is to provide the COHS (Centre for Occupational Health and Safety) and the ASSTSAS (Association for health and safety in the workplace, social affairs sector) with practical information on the effectiveness and methods of reducing noise levels by using acoustic materials.
More specifically, the aims of this study are:
1. To provide comprehensive information on the effects of acoustic materials and their impact on noise reduction and reverberation time;
2. To give concrete examples of noise reduction obtained through using acoustic treatments in day-care centres;
3. To develop a simple method in order to assess potential noise reductions by using acoustical treatments.
In the end, the results of this work will be set out in a practical guide aimed at the day-care centre administrators and managers.
IRSST - Noise reduction in day-care centres by using acoustic treatments 3
3. NOISE LEVEL VS REVERBERATION TIME (RT60) RELATIONSHIP
Several factors influence noise levels in a day-care centre amongst which are:
1. The number of children in the location and their age group;
2. The type of structured activities (reading, dancing, drawing) or non-structured activities (free play) and the type of toys used;
3. The behaviour of the childcare workers when noise levels increase (lowering their voice, making the children aware of the noise levels) and the mood of the children;
4. The size of the location, the acoustic properties of the materials and the resulting reverberation time.
The first three factors cannot be altered. However, the use of higher performing acoustic materials is a factor that can be modified and quantified. Reverberation time
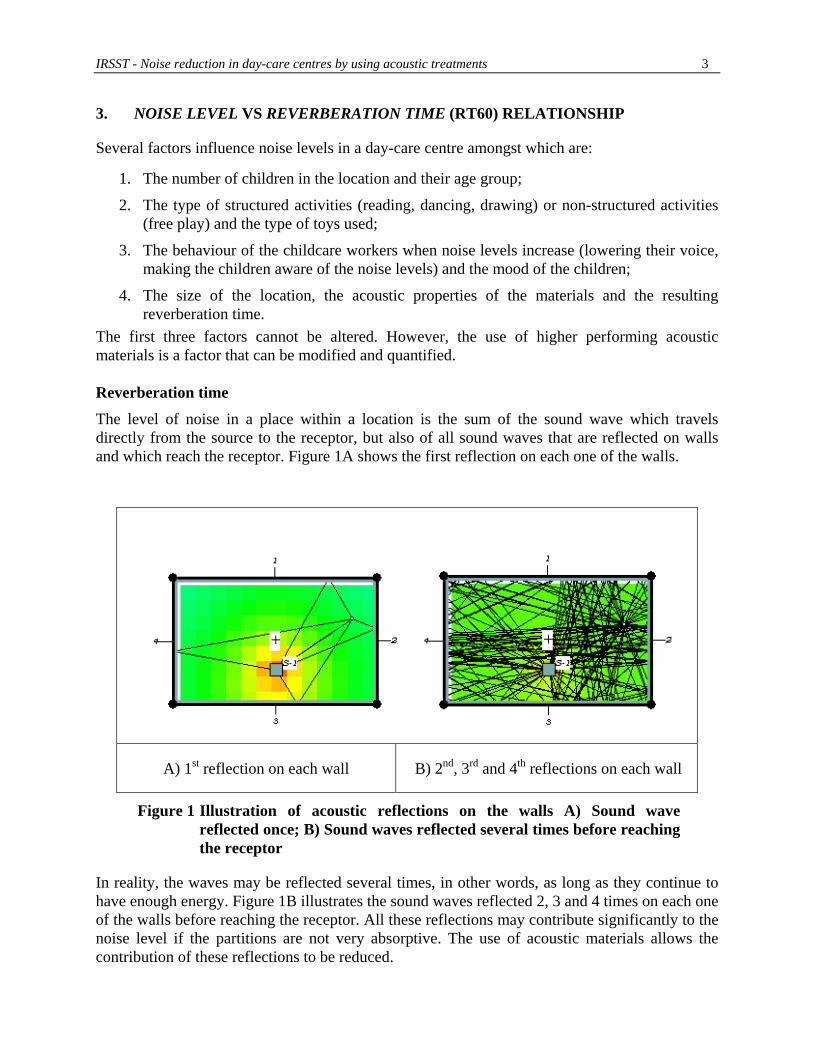
The level of noise in a place within a location is the sum of the sound wave which travels directly from the source to the receptor, but also of all sound waves that are reflected on walls and which reach the receptor. Figure 1A shows the first reflection on each one of the walls.
A) 1st reflection on each wall B) 2nd, 3rd and 4th reflections on each wall
Figure 1 Illustration of acoustic reflections on the walls A) Sound wave reflected once; B) Sound waves reflected several times before reaching the receptor
In reality, the waves may be reflected several times, in other words, as long as they continue to have enough energy. Figure 1B illustrates the sound waves reflected 2, 3 and 4 times on each one of the walls before reaching the receptor. All these reflections may contribute significantly to the noise level if the partitions are not very absorptive. The use of acoustic materials allows the contribution of these reflections to be reduced.
4 Noise reduction in day-care centres by using acoustic treatments - IRSST
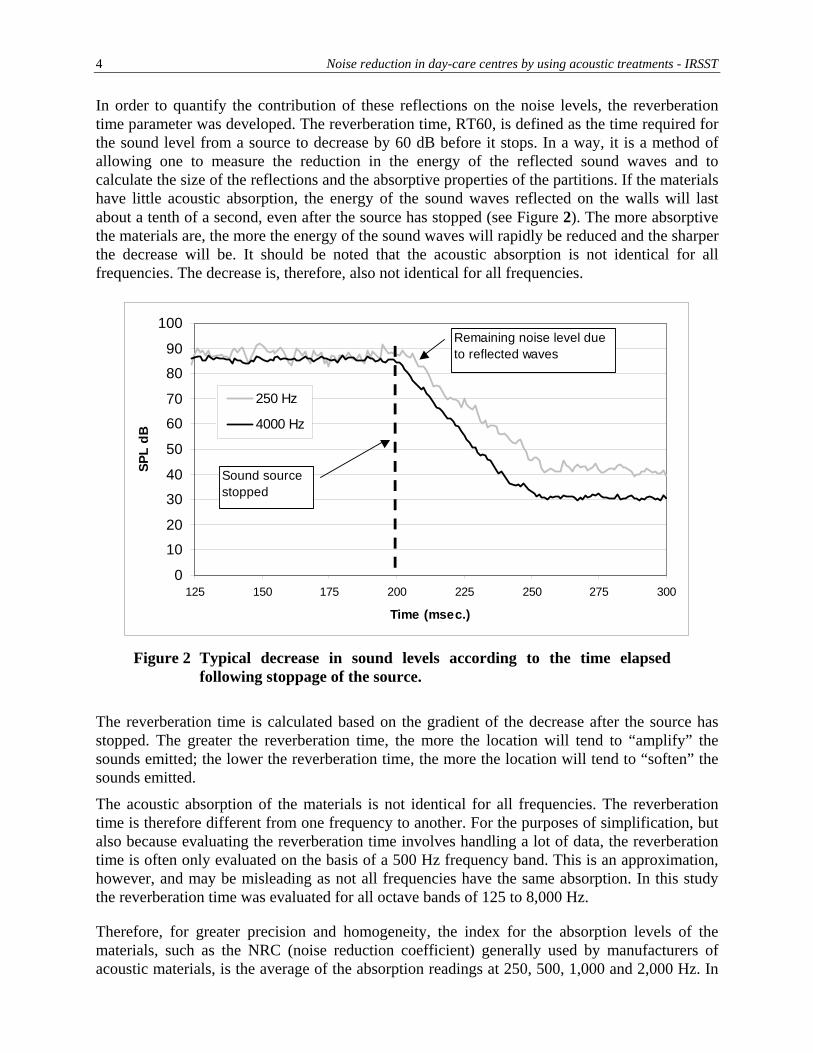
In order to quantify the contribution of these reflections on the noise levels, the reverberation time parameter was developed. The reverberation time, RT60, is defined as the time required for the sound level from a source to decrease by 60 dB before it stops. In a way, it is a method of allowing one to measure the reduction in the energy of the reflected sound waves and to calculate the size of the reflections and the absorptive properties of the partitions. If the materials have little acoustic absorption, the energy of the sound waves reflected on the walls will last about a tenth of a second, even after the source has stopped (see Figure 2). The more absorptive the materials are, the more the energy of the sound waves will rapidly be reduced and the sharper the decrease will be. It should be noted that the acoustic absorption is not identical for all frequencies. The decrease is, therefore, also not identical for all frequencies.
0
10
20
30
40
50
60
70
80
90
100
125 150 175 200 225 250 275 300
Time (msec.)
SPL
dB
250 Hz
4000 Hz
Sound source stopped
Remaining noise level due to reflected waves
Figure 2 Typical decrease in sound levels according to the time elapsed
following stoppage of the source.
The reverberation time is calculated based on the gradient of the decrease after the source has stopped. The greater the reverberation time, the more the location will tend to “amplify” the sounds emitted; the lower the reverberation time, the more the location will tend to “soften” the sounds emitted.
The acoustic absorption of the materials is not identical for all frequencies. The reverberation time is therefore different from one frequency to another. For the purposes of simplification, but also because evaluating the reverberation time involves handling a lot of data, the reverberation time is often only evaluated on the basis of a 500 Hz frequency band. This is an approximation, however, and may be misleading as not all frequencies have the same absorption. In this study the reverberation time was evaluated for all octave bands of 125 to 8,000 Hz.
Therefore, for greater precision and homogeneity, the index for the absorption levels of the materials, such as the NRC (noise reduction coefficient) generally used by manufacturers of acoustic materials, is the average of the absorption readings at 250, 500, 1,000 and 2,000 Hz. In

IRSST - Noise reduction in day-care centres by using acoustic treatments 5
this study, when a single RT60 reading is used to characterise a location, this reading is the average of the RT60s at 250, 500, 1 000 and 2 000 Hz.

6 Noise reduction in day-care centres by using acoustic treatments - IRSST
4. METHODOLOGY
4.1 General approach
The general approach used in order to achieve the objectives of this study were:
1. To evaluate the acoustic conditions in 40 locations at 20 day-care centres (two locations per day-care centre);
2. To identify and recommend treatment solutions for 20 locations (two locations in ten day-care centres);
3. To re-evaluate the acoustic situations after having set up the treatments;
4. To analyse the results in order to ascertain the noise reductions;
5. To develop a simple method allowing one to predict the reductions in reverberation time and noise reductions resulting from the acoustic treatments in a day-care location.
4.2 Acoustic parameters and equipment
The main parameters evaluated were:
1. The noise levels and spectral content (over two 8 hour periods);
2. The reverberation time
3. Noise doses received by the childcare workers (two readings per day-care centre);
4. The acoustic dispersion of the floors.
4.2.1 Measuring noise levels
Given the variation in noise levels at a day-care centre3 and the effectiveness of the acoustic treatments, being the difference between the average noise levels before and after the installation, the method of evaluating the noise levels should be developed in order to obtain the most accurate and revealing results possible.
The method in question involved carrying out ongoing measurements over sufficiently long periods. In each location, continuous measurements were taken over the course of two days.
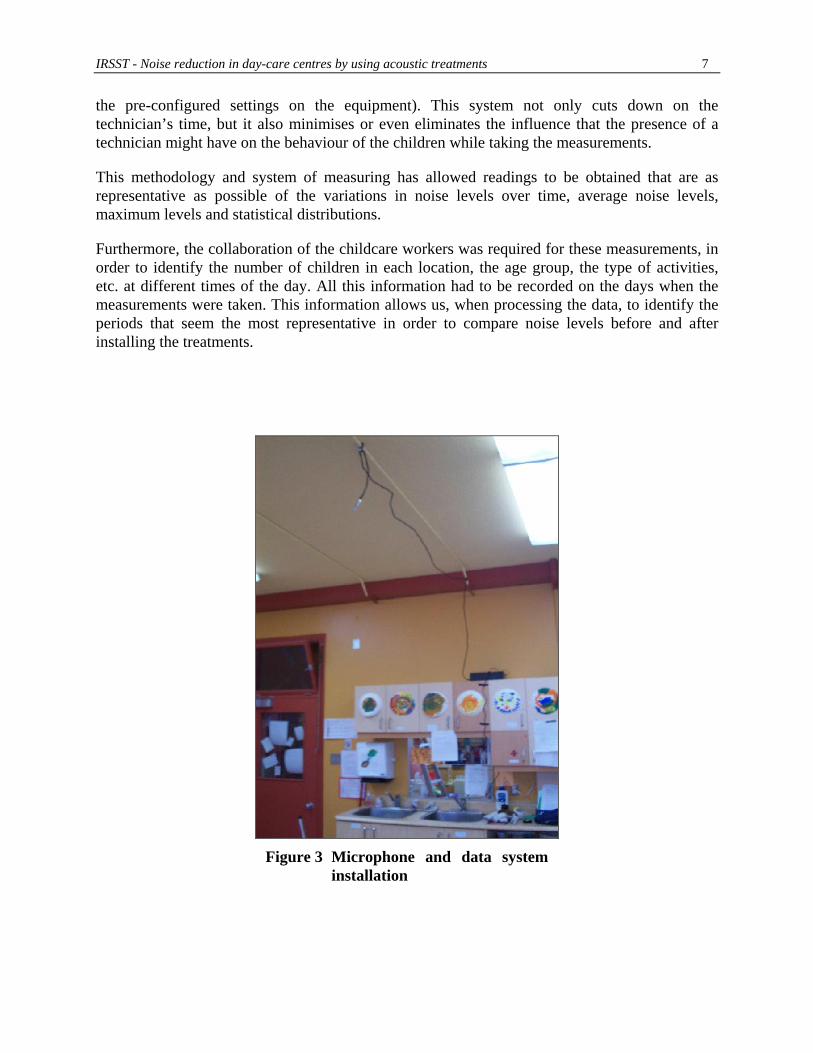
In order to minimise the time required for these measurements, a system was developed for reading these levels and the noise spectrum on an ongoing basis. The system developed is made up of a Signal Ranger data acquisition map, data acquisition software specially developed for this purpose and a memory card which allows the data to be stored. This whole system fits in a box measuring approximately 5 cm x 20 cm x 25 cm. Once the software is downloaded, the system operates completely independently, in other words it runs once it is plugged in (following
3 Depending on the number of children, the size and geometry of the locations, the absorption and acoustic
dispersion of the surfaces, the types of children's activities, their mood and the rules of the childcare workers, etc.
IRSST - Noise reduction in day-care centres by using acoustic treatments 7
the pre-configured settings on the equipment). This system not only cuts down on the technician’s time, but it also minimises or even eliminates the influence that the presence of a technician might have on the behaviour of the children while taking the measurements.
This methodology and system of measuring has allowed readings to be obtained that are as representative as possible of the variations in noise levels over time, average noise levels, maximum levels and statistical distributions.
Furthermore, the collaboration of the childcare workers was required for these measurements, in order to identify the number of children in each location, the age group, the type of activities, etc. at different times of the day. All this information had to be recorded on the days when the measurements were taken. This information allows us, when processing the data, to identify the periods that seem the most representative in order to compare noise levels before and after installing the treatments.
Figure 3 Microphone and data system
installation

8 Noise reduction in day-care centres by using acoustic treatments - IRSST
4.2.2 Measurement of reverberation times
Measurements of reverberation time were carried out using a “Spherical source” type loudspeaker and a Larson-Davis 2900 spectrum analyser adjusted to reading mode at 1/64 of a second. Figure 4 shows an example of the set-up.
Figure 4 Spherical noise source for measuring reverberation time at location 1
in day-care centre C)
4.2.3 Evaluation of acoustic dispersion on floors
The effect of the type of floor covering has often been identified as an element that might influence noise levels in the locations. Specific measurements were taken in order to verify this theory and to try and quantify this effect.
The method used consisted in operating a tapping machine on the surface in order to evaluate and measure the acoustic strength of this system. A Bruel & Kjaer 3207 tapping machine was used for this purpose4.
The acoustic strength was evaluated based on acoustic intensity readings in a hemisphere of 1 metre surrounding the machine and the floor surface area. Note that in order to minimise the
4 During normal operation, this machine taps the surface of the floor by using mechanically-activated hammers.
Acoustic measurements are taken from below in order to obtain a reading of the loss of the tap through transmission.

IRSST - Noise reduction in day-care centres by using acoustic treatments 9
contribution made by noise from the machine’s mechanism in relation to the contribution made by the machine tapping on the floor, the tapping machine was specially soundproofed. Figure 5 demonstrates the typical set-up.
By comparing the acoustic power issued by the tapping on different types of surfaces, we were able to evaluate the acoustic dispersion of different types of floor coverings used in the day-care centres in order to evaluate their effects on noise levels.
Note: Dispersion in measurement location compared to transmission of taps from one location to another.
The evaluation of the dispersed acoustic power by the tapping machine aimed to quantify the effect of the different types of surface on sound levels in the location where the tapping was being carried out. This evaluation did not aim to establish the effects of the coverings on reducing noise transmitted to other locations, in particular to locations on the floor below. In order to evaluate the effect of the coverings on the transmissibility of the noise and tapping from one location to another, other measurements and analyses were required. These areas do not, however, form part of the remit of this study.
Figure 5 Tapping machine with acoustic probe used for dosage measurements
(location 2 in CPE A)
4.2.4 Dosimetry measurement
The dosimetry allows us to evaluate an individual’s degree of exposure to surrounding noise during a normal 8 hour working day. The noise dose is measured using a piece of equipment called a dosimeter, which is attached to a person. The results of these measurements are presented as an average (Leq(8h) in dBA and the dose as a %).
10 Noise reduction in day-care centres by using acoustic treatments - IRSST
Within the general framework of this study, the level of the two childcare workers’ exposure to noise was evaluated in each one of the 20 day-care centres selected. The two childcare workers nominated are the ones most often in the locations being analysed. These childcare workers wore the equipment for two consecutive days.
We should remember that current standard acceptable noise levels in Quebec are 90 dBA, with a Q = 5 bi-section parameter, over a continuous 8 hour period5.
The dosimeters used for these measurements were supplied by IRSST.
4.3 Choice of day-care centre participants
In order to analyse the general situation with regards to noise levels in day-care centres, a sample of 20 day-care centres and 2 locations per day-care centre, in other words a total of 40 locations, were selected. Ms Louise Morissette of ASSTAS presented the project and contacted the day-care centres.
The characteristics of the location would allow the various locations to be classified following parameters such as size, number of children, noise problems identified, etc. This classification allowed relationships to be identified between the various factors that might influence noise levels.
Following an evaluation of these factors, 12 day-care centres underwent more detailed analyses, including simulations and an evaluation of the effectiveness of the acoustic treatments. A report presenting the results of the analyses and recommendations was sent to each one of the day-care centres involved.
The choice of day-care centres was made based on the problems they were encountering, but also because of their commitment to invest approximately €7,100 (CAD 10,000) or €3,550 (CAD 5,000) per location to set up the recommended treatments within a period of a few months.
5 This standard is based on statistical analyses which have demonstrated that more than 25% of people exposed to
levels of 90 dB in an 8 hour day over a period of 30 years suffer significant hearing loss.
IRSST - Noise reduction in day-care centres by using acoustic treatments 11
5. SITUATION PRIOR TO INSTALLING THE TREATMENTS
In order to describe the procedure for the analysis, the next section describes the analyses carried out on one of the 40 locations.
The next section will analyse all of the results obtained.
5.1 Example of detailed analysis of a day-care centre
5.1.1 Sound levels
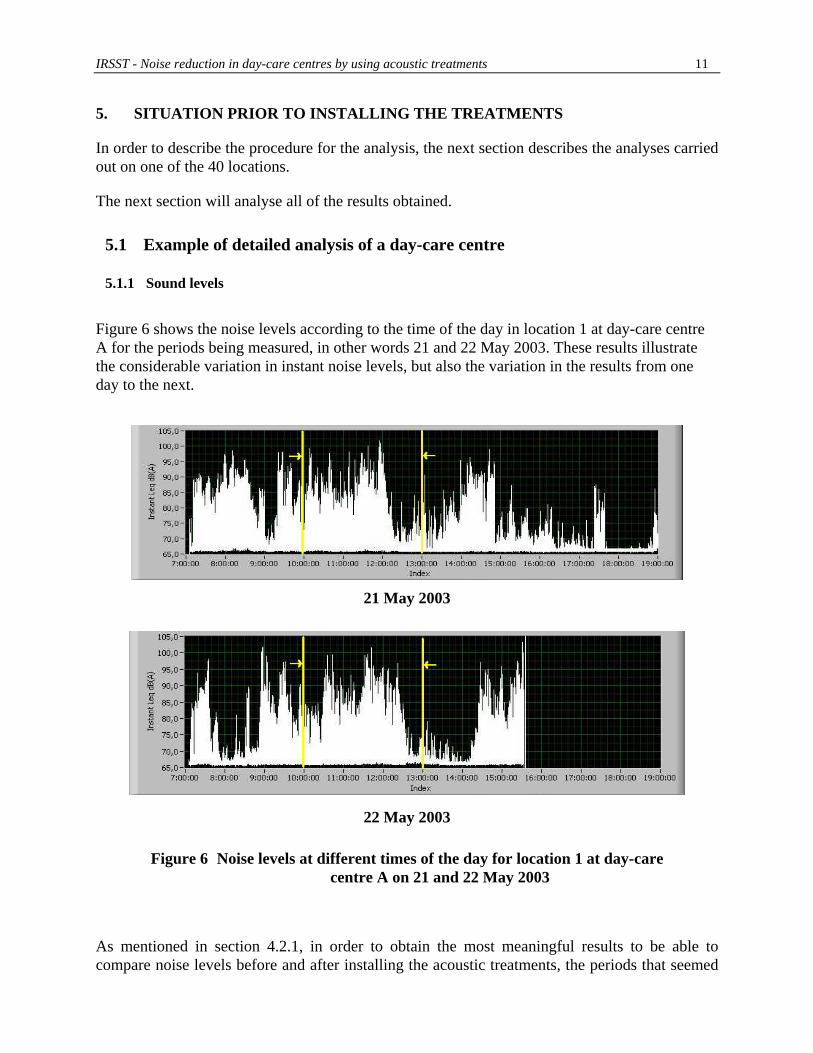
Figure 6 shows the noise levels according to the time of the day in location 1 at day-care centre A for the periods being measured, in other words 21 and 22 May 2003. These results illustrate the considerable variation in instant noise levels, but also the variation in the results from one day to the next.
21 May 2003
22 May 2003
Figure 6 Noise levels at different times of the day for location 1 at day-care centre A on 21 and 22 May 2003
As mentioned in section 4.2.1, in order to obtain the most meaningful results to be able to compare noise levels before and after installing the acoustic treatments, the periods that seemed

12 Noise reduction in day-care centres by using acoustic treatments - IRSST
most representative were selected. The noise levels vary considerably from one period in the day to another. The periods selected which seemed the most representative to us were high activity periods. In the case of location 1 at day-care centre A shown here, these periods were between 10 a.m. and 12 p.m. table 2 shows the noise spectrum corresponding to the frequency band.
Table 1 Average noise levels per frequency band for location A-1
Total 125 Hz 250 Hz 500 Hz 1 000 Hz 2 000 Hz 4 000 Hz 8 000 Hz
Noise spectrum [dBA] 73.8 50.2 56.3 63.6 69.4 70.4 63.7 52.6
Table 2 Average noise levels per frequency band in location A-1
Total 125 Hz 250 Hz 500 Hz 1 000 Hz 2 000 Hz 4 000 Hz 8 000 Hz
Noise spectrum [dBA] 73.8 50.2 56.3 63.6 69.4 70.4 63.7 52.6
5.1.2 Reverberation time (RT60)
table 3 shows the RT60 for each octave band as well as the average for the 250 to 2,000 Hz bands, in other words 0.65 sec.
Table 3 RT60 readings per frequency band for location A-1
Average
250-2 000 Hz 125 Hz 250 Hz 500 Hz 1 000 Hz 2 000 Hz 4 000 Hz 8 000 Hz
RT60 [second] 0.65 0.49 0.53 0.66 0.74 0.67 0.66 0.55
5.1.3 Dosimetry
The dosimetry is a measurement of total acoustic energy received by a worker (in our case, a childcare worker) over a full working day. In Quebec, a dose of 100% corresponds to an exposure of 90 dBA over 8 hours.
In order to obtain the noise dose, the measuring equipment, the dosimeter, is installed on the individual and over the period of measurement in question (generally the whole shift), accumulates all the acoustic energy received, referred to as a level equivalent to 8 hours Leq(8h) for an 8 hour shift. (Note that the equivalent level may be calculated over various time periods, according to the length of the shift. Therefore, a Leq(10h) refers to a level calculated over a period of 10 hours.)
IRSST - Noise reduction in day-care centres by using acoustic treatments 13
There are two methods of calculating the total acoustic energy during a period of measurement:
• The first method consists in calculating the levels in the form of energy (in other words a standard method of calculating noise levels). This method is connected to the “bi-section 3” parameter, Q3.
• A second method weighs up the strength of the noise levels measured in terms of their magnitude compared to the benchmark. In practice, this method lends less weight (importance) to the top level of 90 dBA and more weight to the lower level at 90 dBA. This method is connected to the “bi-section 5” parameter, Q5.
The bi-section parameter to be used is set out in the legislation. In Canada, as well as in the United States, this parameter is 5. In Europe, a criterion of 3 is generally used.
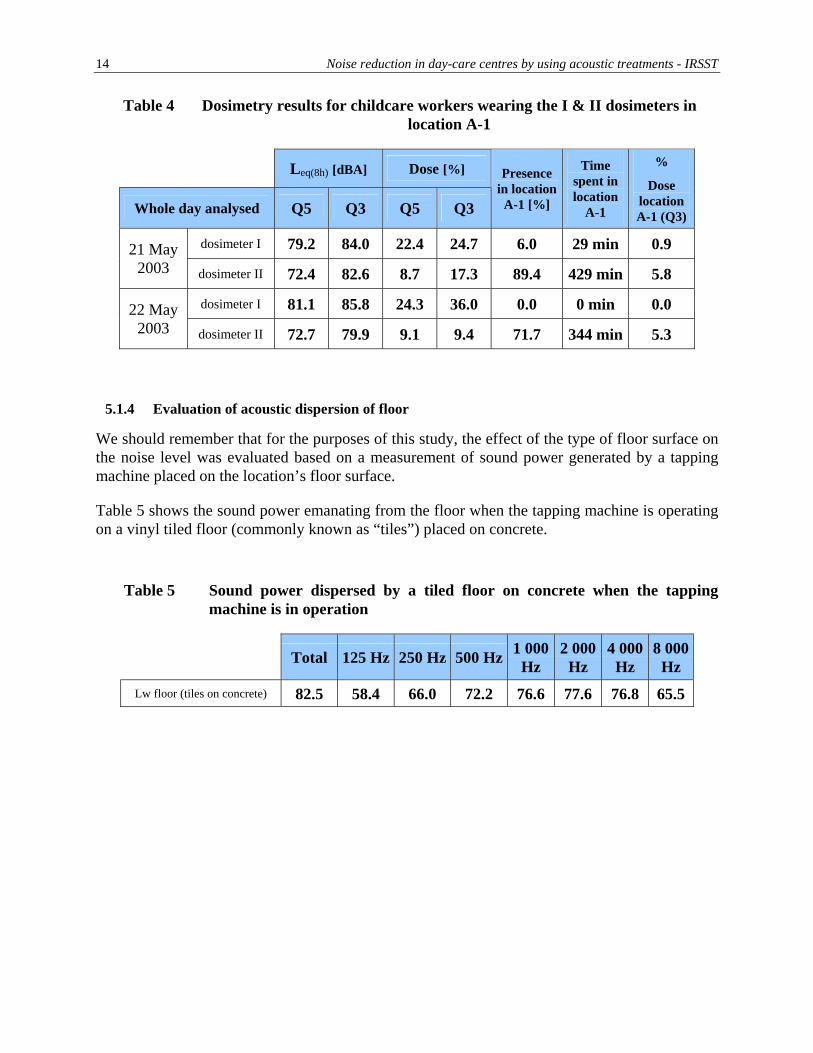
Dosimetry measurements were carried out on two childcare workers during the two days of measurements. The Table 4 Dosimetry results for childcare workers wearing the I & II dosimeters in location A-1 shows the Leq(8h) and total noise doses received by each childcare worker (I and II). Although the recommended parameter is 5 in Quebec, the Leq(8h) values were calculated using the two bi-section factors, Q3 and Q5. (It should be noted that the Leq (8h)s calculated using the Q3 factor are generally higher than those calculated with the Q5).
The childcare workers do not remain in the same location all day. They are either in their main location or in other locations around the day-care centre (cafeteria, play area, etc.) or outside. The noise dose received in the locations covered by the study (locations to be treated) should also have been evaluated for each childcare worker, thus giving us the total noise levels during the periods in which the childcare worker was at the location. (This evaluation was possible by using movement registers (to be completed by the childcare workers during the course of the days when the measurements were being taken) and noise levels recorded every second of the day by the dosimeters).
The last two columns of the table therefore give the time spent in each location (estimated based on the movement registers) and the noise level received during each of these periods. For example, in the case of the childcare worker who was wearing dosimeter I, the Leq(8h) received by the childcare worker was 79.2 dBA (using the Q5 bi-section parameter) for a corresponding dose of 22.4 %. If the Leq(8h) calculation is carried out with a Q3 factor, the Leq(8h) level is rather 84.0 and the corresponding dose is 24.7 %.
The time this childcare worker spent in location A-1, however, was no more than 29 minutes, and only 0.9% of the dose was received at this location. The dose received in the location was also marginal and the treatment of this location would therefore only have a very minor effect on the total dose. This last observation was noted in the case of a large majority of childcare workers.
14 Noise reduction in day-care centres by using acoustic treatments - IRSST
Table 4 Dosimetry results for childcare workers wearing the I & II dosimeters in location A-1
Leq(8h) [dBA] Dose [%]
Whole day analysed Q5 Q3 Q5 Q3
Presence in location
A-1 [%]
Time spent in location
A-1
%
Dose location A-1 (Q3)
dosimeter I 79.2 84.0 22.4 24.7 6.0 29 min 0.9 21 May 2003 dosimeter II 72.4 82.6 8.7 17.3 89.4 429 min 5.8
dosimeter I 81.1 85.8 24.3 36.0 0.0 0 min 0.0 22 May 2003 dosimeter II 72.7 79.9 9.1 9.4 71.7 344 min 5.3
5.1.4 Evaluation of acoustic dispersion of floor
We should remember that for the purposes of this study, the effect of the type of floor surface on the noise level was evaluated based on a measurement of sound power generated by a tapping machine placed on the location’s floor surface.
Table 5 shows the sound power emanating from the floor when the tapping machine is operating on a vinyl tiled floor (commonly known as “tiles”) placed on concrete.
Table 5 Sound power dispersed by a tiled floor on concrete when the tapping machine is in operation
Total 125 Hz 250 Hz 500 Hz 1 000
Hz 2 000
Hz 4 000
Hz 8 000
Hz Lw floor (tiles on concrete) 82.5 58.4 66.0 72.2 76.6 77.6 76.8 65.5
IRSST - Noise reduction in day-care centres by using acoustic treatments 15
5.1.5 Model of effectiveness of acoustic treatments
In order to evaluate the effectiveness of potential acoustic treatments, each location included in the study was modelled using acoustics prediction software, OUÏE 20006. The model consists in reproducing the location in simulation software using its physical dimensions, the type of materials on each surface as well as the furniture and objects in the location. The model is then calibrated using reverberation time measurements at each frequency. This calibration consists in adjusting the absorption coefficients of the partitions and the clutter factor of the location in order to obtain a theoretical reverberation time for the model that is similar to the one measured in the location.
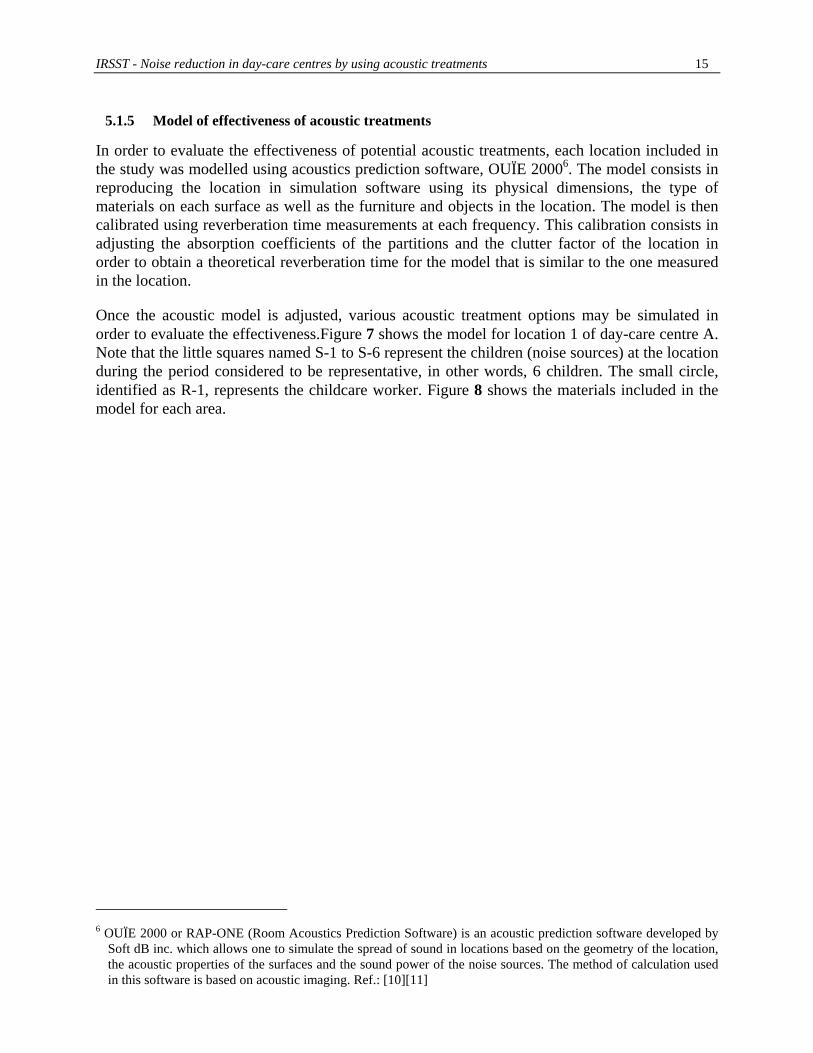
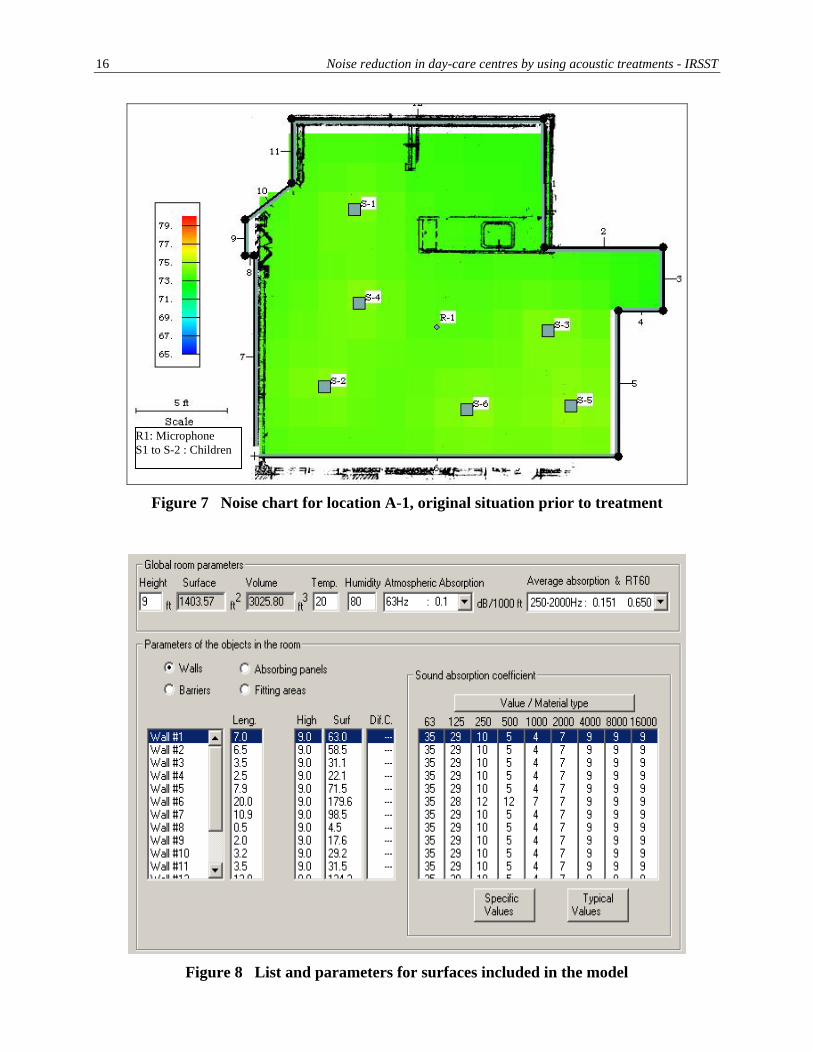
Once the acoustic model is adjusted, various acoustic treatment options may be simulated in order to evaluate the effectiveness.Figure 7 shows the model for location 1 of day-care centre A. Note that the little squares named S-1 to S-6 represent the children (noise sources) at the location during the period considered to be representative, in other words, 6 children. The small circle, identified as R-1, represents the childcare worker. Figure 8 shows the materials included in the model for each area.
6 OUÏE 2000 or RAP-ONE (Room Acoustics Prediction Software) is an acoustic prediction software developed by
Soft dB inc. which allows one to simulate the spread of sound in locations based on the geometry of the location, the acoustic properties of the surfaces and the sound power of the noise sources. The method of calculation used in this software is based on acoustic imaging. Ref.: [10][11]
16 Noise reduction in day-care centres by using acoustic treatments - IRSST
R1: Microphone S1 to S-2 : Children
Figure 7 Noise chart for location A-1, original situation prior to treatment
Figure 8 List and parameters for surfaces included in the model
IRSST - Noise reduction in day-care centres by using acoustic treatments 17
5.2 Analysis of all the results
5.2.1 Analysis of the reverberation time (RT60)
5.2.1.1 Average sound level according to the reverberation time (RT60)
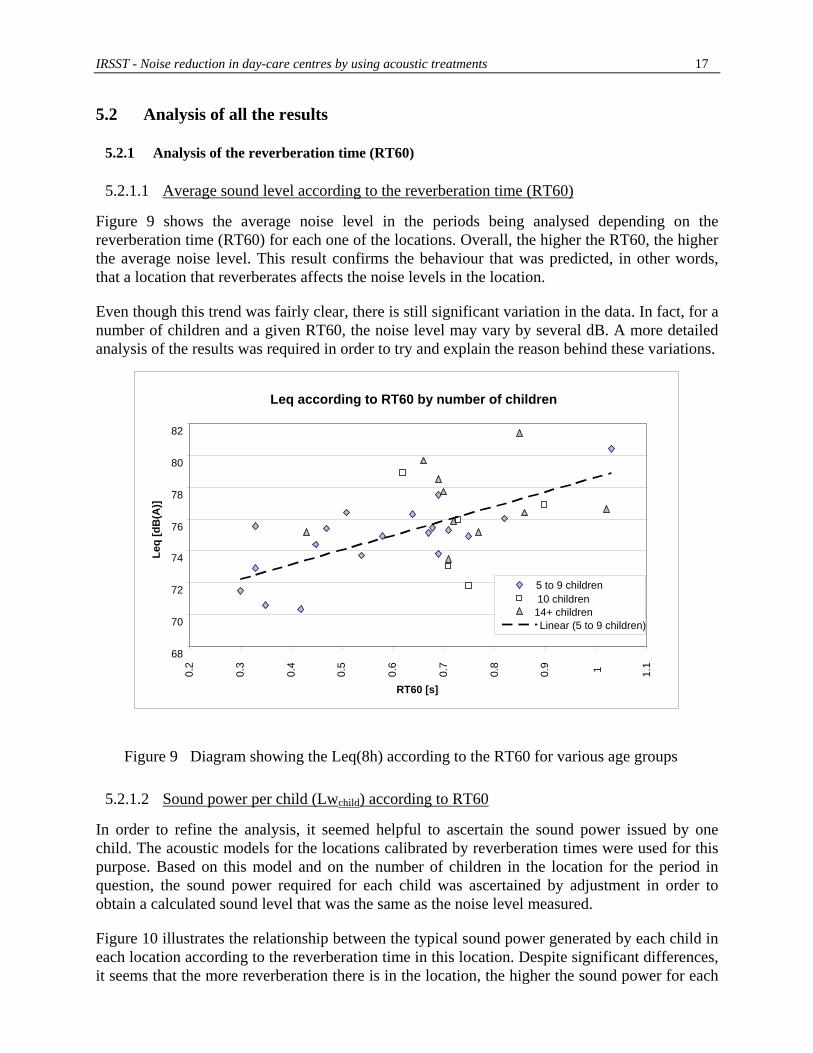
Figure 9 shows the average noise level in the periods being analysed depending on the reverberation time (RT60) for each one of the locations. Overall, the higher the RT60, the higher the average noise level. This result confirms the behaviour that was predicted, in other words, that a location that reverberates affects the noise levels in the location.
Even though this trend was fairly clear, there is still significant variation in the data. In fact, for a number of children and a given RT60, the noise level may vary by several dB. A more detailed analysis of the results was required in order to try and explain the reason behind these variations.
Leq according to RT60 by number of children
68
70
72
74
76
78
80
82
0.2
0.3
0.4
0.5
0.6
0.7
0.8
0.9 1 1.1
RT60 [s]
Leq
[dB
(A)]
5 to 9 children 10 children
14+ children Linear (5 to 9 children)
Figure 9 Diagram showing the Leq(8h) according to the RT60 for various age groups
5.2.1.2 Sound power per child (Lwchild) according to RT60
In order to refine the analysis, it seemed helpful to ascertain the sound power issued by one child. The acoustic models for the locations calibrated by reverberation times were used for this purpose. Based on this model and on the number of children in the location for the period in question, the sound power required for each child was ascertained by adjustment in order to obtain a calculated sound level that was the same as the noise level measured.
Figure 10 illustrates the relationship between the typical sound power generated by each child in each location according to the reverberation time in this location. Despite significant differences, it seems that the more reverberation there is in the location, the higher the sound power for each

18 Noise reduction in day-care centres by using acoustic treatments - IRSST
child, in other words, the noisier the children are. This discovery leads to the theory that the more a location reverberates, the higher the noise levels and the more the children will tend to talk loudly or to shout.
As an initial approximation, the results obtained allow us to estimate that for the size of the typical locations included here (between 71 and 255 m3 or between 2,000 and 9,000 ft²), a 0.1 second reduction in reverberation time translated into approximately a 0.3 dB reduction in the noise level made by the children as the result of the change in their behaviour. Therefore, a 0.5 second reduction in reverberation time would seem to translate into a 1.5 dB reduction in noise made by the children.
Lw(child) according to RT60
68.0
70.0
72.0
74.0
76.0
78.0
80.0
82.0
0.20 0.40 0.60 0.80 1.00 RT60 [s]
Lw (c
hild
) [dB
(A)]
Lw (Child)Linear (Lw (Child))
Figure 10 Diagram showing the Lwchild according to the RT60
5.2.1.3 Level of noise made by each child according to the number of children
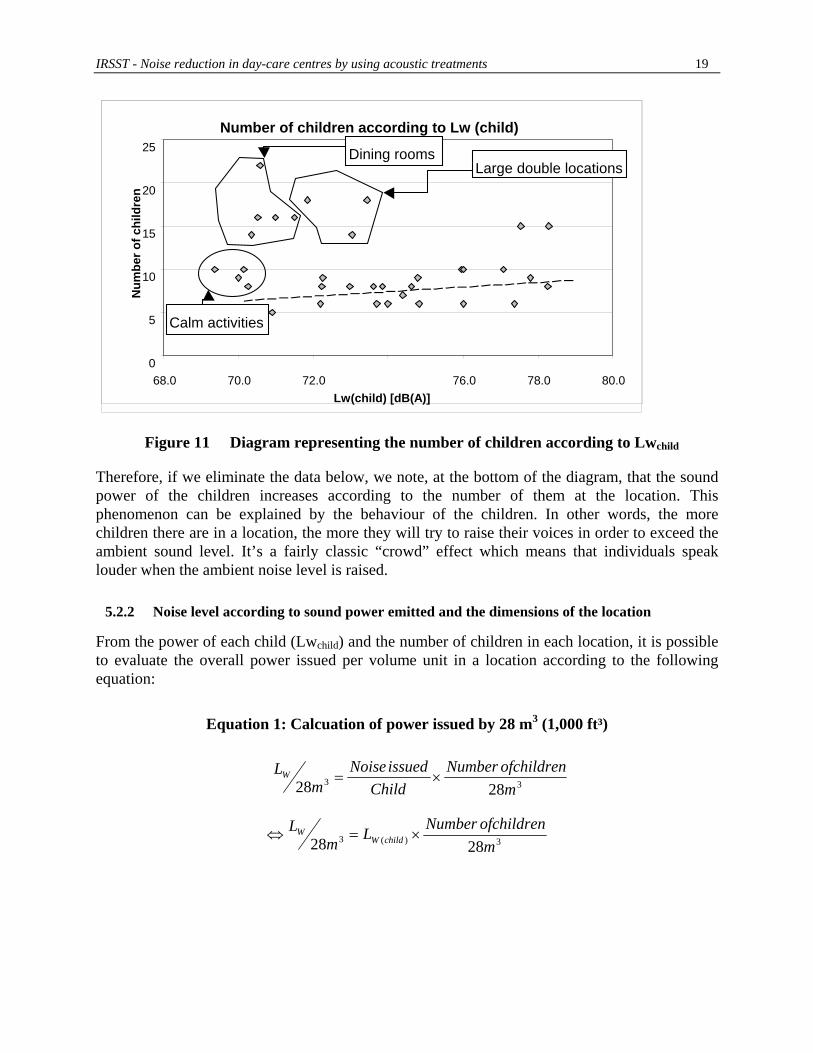
Figure 11 shows the relationship between the number of children and the typical sound power of a child in each one of the locations. Examine all the cases, there does not appear to be a trend. However, the main data taken apart from the rest is for situations where a large number of children have generated relatively lower noise levels. In the first place, we are in a location where calm activities take place, which explains the children’s low sound power during these activities. In the second place, there are several dining-rooms, where they have lunch or their snack-time and these are grouped together. During mealtimes, the noise levels are slightly above average, but when there are a lot of children, the sound power for each child is lowered, even below average. Finally, there is the case of large locations occupied at lunch time by two groups simultaneously, therefore by a lot of children. One might expect high levels, but the dispersion of the children and the type of activity results in levels that are roughly average.
IRSST - Noise reduction in day-care centres by using acoustic treatments 19
Number of children according to Lw (child)
0
5
10
Num
ber o
f chi
ldre
n
15
20
dB(A)]
25
68.0 70.0 72.0 76.0 78.0 80.0Lw(child) [
Dining rooms
Calm a
ctivities
Large double locations
Figure 11 Diagram representing the number of children according to Lwchild
Therefore, if we eliminate the data below, we note, at the bottom of the diagram, that the sound power of the children increases according to the number of them at the location. This phenomenon can be explained by the behaviour of the children. In other words, the more children there are in a location, the more they will try to raise their voices in order to exceed the ambient sound level. It’s a fairly classic “crowd” effect which means that individuals speak louder when the ambient noise level is raised.
5.2.2 Noise level according to sound power emitted and the dimensions of the location
From the power of each child (Lwchild) and the number of children in each location, it is possible to evaluate the overall power issued per volume unit in a location according to the following equation:
Equation 1: Calcuation of power issued by 28 m3 (1,000 ft³)
33 2828 mofchildrenNumber
ChildissuedNoise
mLW ×=
3)(3 2828 mofchildrenNumberLm
LchildW
W ×=⇔

20 Noise reduction in day-care centres by using acoustic treatments - IRSST
As demonstrated in Figure 12, there is clearly a strong link between the energy-equivalent level (Leq(8h)) and the sound power issued by 28 m3 (Lw/28 m3).
This diagram also demonstrates the relationship between the noise level and the RT60, locations with lower RT60s generally having lower average noise levels for the same sound power per volume unit.
Figure 12 Noise level according to the sound power by volume unit
5.2.3 Effect of type of floor covering
In the 40 locations measured, the vast majority (90%) of floor coverings were vinyl tiles. Other surfaces were however evaluated (cushioned linoleum, hardwood and specialist coverings such as “Mundo”)
Figure 13 shows the sound level measured in the location during busy periods according to the sound power generated by the tapping machine on the floor at this location. This result demonstrates that, in principle, there is no link between the type of surface at the location and the sound level generated in this location. This result leads us to conclude that the sound level in the location comes mainly from the children’s voices (and possibly from noise made by the toys) and that the contribution of the tapping noise on the floor to the overall noise level is relatively marginal.
Leq according to Lw/28 cubic metre
68.0
70.0
72.0
74.0
76.0
78.0
80.0
82.0
78.0 80.0 82.0 84.0 86.0 88.0 90.0Lw/28 cubic metre[dB(A)]
Leq
[dB
(A)]
RT60 < 0.4 sec
RT60 0.4-0.8 sec
RT60 > 0.8 sec
Linear (RT60 0.4-0.8 sec

IRSST - Noise reduction in day-care centres by using acoustic treatments 21
65 67
69
7Soun
d le
vel d
BA
1
73
75
77
79
81
83
85
75.0 80.0 85.0 90.0 95.0 100.0 105.0 110.0 115.0
Lw tapping machine dBA
Figure 13 Average sound level measured in the location during busy periods
according to the sound power generated by the tapping machine on the floor at this location.
Note:
The methodology, the analyses and the results carried out here aim to evaluate the effect of the floor coverings on the noise levels generated at the location where the floor covering is located. In order to evaluate the effect of the coverings on the transmissibility of the noise and the tapping from one location to another (for example, a location on a lower floor), other measurements and analyses were required. These aspects do not, however, form part of the remit of this study.
5.2.4 Summary
The main trends obtained demonstrate that:
• A location with a high reverberation time (RT60) will have higher sound levels (see section 5.2.1);
• A location where the reverberation time (RT60) is high tends to mean that the children make more noise (see section 5.2.1.2);
• The higher the number of children in each location, the more the noise level issued by each child tends to increase (5.2.1.3).
• The type of floor covering in a location seems to have little impact on the level of noise in the location (surface). (The effect of these floor coverings on noise transmitted in other locations has not been analysed.)

22 Noise reduction in day-care centres by using acoustic treatments - IRSST
Increase in RT60
Increase in noise made by each child
Increase in noise level
Increase in number of children
Figure 14 Diagram of the interrelation between acoustic phenomena
5.3 Results and analysis of dosimetry measurements
Table 6 shows the averages of the results of the dosimetry measurements for all the childcare workers evaluated. The results are given according to North-American regulations (90 dBA criteria and Q=5 bi-section parameter) and according to European regulations (85 dBA criteria and Q=3 bi-section parameter). Note that the bi-section parameter (which defines the method for calculating the levels during the exposure period) and the maximum acceptable dose criterion (90 or 85 dBA – defined according to the country’s legislation) are 2 independent parameters. It is therefore possible to use the Q3 method of calculation and a maximum acceptable dose of 90 dBA.
Table 6 Results: averages for all dosimetries
Leq(8h) [dBA] Dose [%]
(criteria 90 dBA 8 hr)
Dose [%]
(criteria 85 dBA 8 hr)
Q5 Q3 Q5 Q3 Q5 Q3
78.1 82.6 22.4 29.7 - 87.9
Table 6 shows the differences between the dosimetry results according to the method of calculation used. This table indicates that all of the 38 childcare workers received, on average, 22.4% of the total dose calculated according to the 90 dBA and Q=5 standard and that they received 87.9% of the total dose calculated according to the 85 dBA and Q=3 standard.
The results of the individual dosimetry measurements are set out in Appendix B. A detailed examination of this table reveals that under North American regulations (90 dBA, Q=5), no childcare worker has been exposed to an average sound level of more than 90 dBA, while according to the European standard (85 dBA, Q=3), 30% of the childcare workers were exposed to an average sound level more than or equal to 85 dBA.

IRSST - Noise reduction in day-care centres by using acoustic treatments 23
It should be noted that the overall level is not the only indicator of a harmful noise environment. Rapid variations in sound, such as taps and shouts, also affect hearing. These variations could be observed on the noise level diagrams in the locations where the sampling period is 1/10 of a second. The current regulations do not meanwhile provide any specific indication on the effect that these variations have on the tiredness of the workers subjected to this type of variation in noise levels. The impact of this phenomenon cannot therefore be evaluated. It would be interesting to carry out psychoacoustic studies on this.

24 Noise reduction in day-care centres by using acoustic treatments - IRSST
6. RECOMMENDED ACOUSTIC TREATMENTS
6.1 Selection of day-care centres considered for the treatments
Amongst the 20 day-care centres where the readings were taken, 12 day-care centres were selected for installing the treatments. The day-care centres were selected for the greatest possible diversity in locations in terms of size and geometric configuration, but also according to their geographic location. The aim of this last criterion was to install the treatments in as many regions across Quebec as possible, in order to allow and facilitate access by other day-care centres in various regions to an example of an actual installation. The regions where they were installed were Hull, Gatineau, Chambly, Boucherville, Dorval, Jonquière, Thetford Mines, Québec, Sainte-Foy and Lévis.
It should be noted that amongst the 12 day-care centres selected and for which reports with recommendations were issued, 9 proceeded to install the treatments before the end of this project.
6.2 Theoretical evaluation of acoustic treatments
Several treatments were planned and then simulated for each one of the locations in the 12 day-care centres selected.
In general terms, an analysis of the results of these simulations allowed one to establish that the acoustic treatments providing the best performance in terms of price were the installation of:
An acoustic ceiling across the entire surface of the existing ceiling;
Absorbent panels at the top of the wall.
The average absorption coefficient in these simulations was 80%.
The absorption coefficient of a material describes its capacity to absorb sound. The absorption coefficient of the materials is expressed in percentage terms and varies between 0 and 100 according to whether the material absorbs the sound completely or not at all. Generally speaking, the harder and more non-porous the material is to air (for example, terrazzo), the less it absorbs and therefore reflects. The more porous and flexible it is (such as glass wool or fabric), the more absorbent it is.
Furthermore, the acoustic absorption of a material varies according to the frequency. To simplify this, the absorption coefficient of materials is often represented by the NRC (Noise Reduction Coefficient). The NRC is the average of the absorption readings at 250, 500, 1,000 and 2,000 Hz.

IRSST - Noise reduction in day-care centres by using acoustic treatments 25
The NRC is the typical reading for each acoustic product. This reading is normally provided by the manufacturer of acoustic ceiling tiles and acoustic wall panels. It should be noted that the readings supplied by the manufacturers are often underestimated by approximately 20 to 30 %, because of the method of measurement generally used7 (Method of measurement of the acoustic absorption coefficient in reverberating room, ANSI S1.7-1970), by the manufacturers in order to determine the NRC of their materials.
6.2.1 Example of evaluation of location A-1
As an example, the Figure 7 shows the predicted noise chart for location 1 at day-care centre A when the treatment is applied (see Figure 7 for the case without treatment). In this simulation, an acoustic material with an average absorption coefficient of 80% was considered for the ceiling, in other words, 32 m2 (340 ft²). For the walls, a band of acoustic panels 60 cm (2 ft) high were used to surround the whole location. In this instance, the perimeter was 16 m² (170 ft²).
Figure 15 Map of predicted noise in location A-1 with the recommended treatments
Table 7 shows the predicted noise levels with and without treatment for the period being represented.
7 “In fact, for highly absorbant matérial computed values of α may exceed unity by as much as 20 to 30 %”, ref. [9], section 4.
26 Noise reduction in day-care centres by using acoustic treatments - IRSST
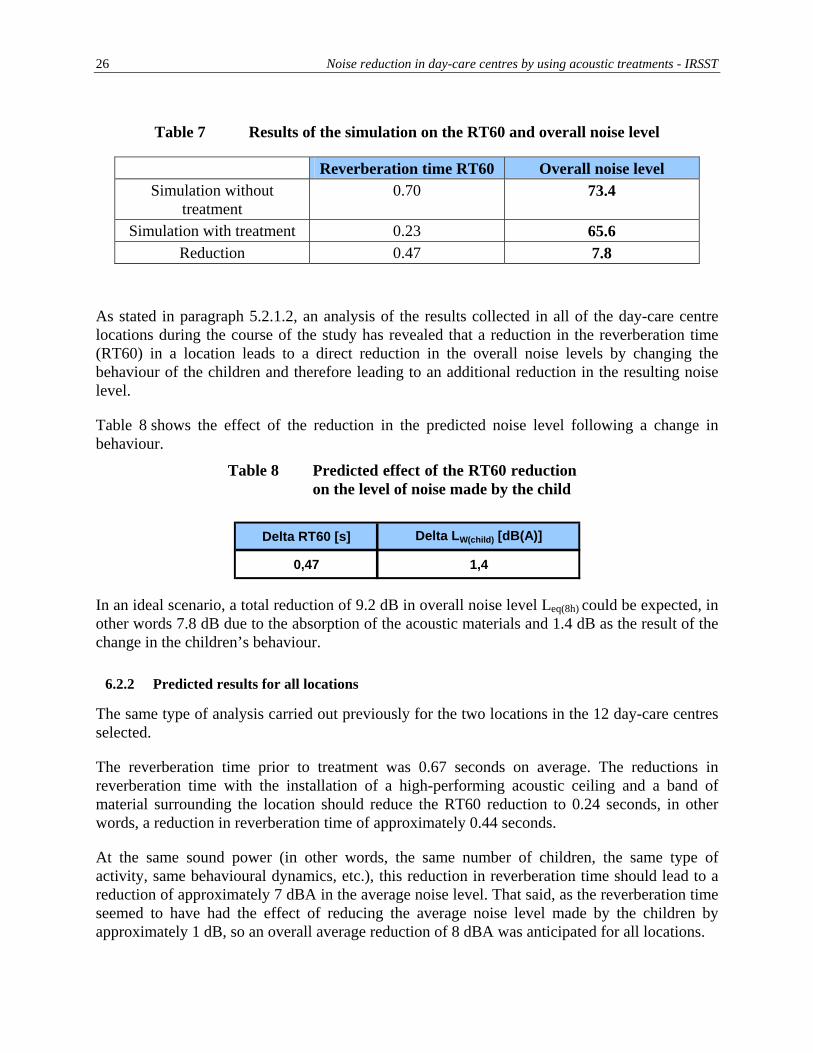
Table 7 Results of the simulation on the RT60 and overall noise level
Reverberation time RT60 Overall noise level Simulation without
treatment 0.70 73.4
Simulation with treatment 0.23 65.6 Reduction 0.47 7.8
As stated in paragraph 5.2.1.2, an analysis of the results collected in all of the day-care centre locations during the course of the study has revealed that a reduction in the reverberation time (RT60) in a location leads to a direct reduction in the overall noise levels by changing the behaviour of the children and therefore leading to an additional reduction in the resulting noise level.
Table 8 shows the effect of the reduction in the predicted noise level following a change in behaviour.
Table 8 Predicted effect of the RT60 reduction on the level of noise made by the child
Delta RT60 [s] Delta LW(child) [dB(A)]
0,47 1,4
In an ideal scenario, a total reduction of 9.2 dB in overall noise level Leq(8h) could be expected, in other words 7.8 dB due to the absorption of the acoustic materials and 1.4 dB as the result of the change in the children’s behaviour.
6.2.2 Predicted results for all locations
The same type of analysis carried out previously for the two locations in the 12 day-care centres selected.
The reverberation time prior to treatment was 0.67 seconds on average. The reductions in reverberation time with the installation of a high-performing acoustic ceiling and a band of material surrounding the location should reduce the RT60 reduction to 0.24 seconds, in other words, a reduction in reverberation time of approximately 0.44 seconds.
At the same sound power (in other words, the same number of children, the same type of activity, same behavioural dynamics, etc.), this reduction in reverberation time should lead to a reduction of approximately 7 dBA in the average noise level. That said, as the reverberation time seemed to have had the effect of reducing the average noise level made by the children by approximately 1 dB, so an overall average reduction of 8 dBA was anticipated for all locations.

IRSST - Noise reduction in day-care centres by using acoustic treatments 27
Table shows the average characteristics for the 20 locations in question, the reverberation time (RT60) and the average noise level before treatment, as well as the RT60 and predicted noise level with the recommended treatments (theoretical results).
Table 9 Average characteristics and variations in the locations
Average value Variation
Total surface area (wall and ceiling)
158 m2 (1,700 ft²) 106 to 288 m2 (1,140 to 3,100 ft²)
Ceiling surface area 41 m2 (440 ft²) 25 to 72 m2 (265 to 770 ft²)
Height of ceiling 90% between 2.44 et 2.74 metres (8 to 9 feet)
2.44 to 3.66 metres (8 to 12 feet)
Total volume 381 m3 (4,100 ft³) 223 to 855 m3 (2,400 to 9,200 ft³)
Type of wall Gypsum wall with window Glass and other hard surfaces such as plaster
Ceiling surface Gypsum Other hard surfaces (such as plaster, three locations
with standard ceiling tiles) Noise level before treatment (average over two days) 74 dBA 77.6 to 71.5 dBA
Reverberation time before treatment RT60 = 0.67 sec. RT60 = 0.99 to 0.43 sec.
Predicted reverberation time with recommended treatments (wall and ceiling with material with an NRC > 0.85)
RT60 = 0.24 sec. RT60 = 0.20 to 0.32 sec.
Predicted noise reduction (with the recommended treatments (wall and ceiling with material with NRC > 0.85)
7 dBA* 4 to 8 dBA*
*Excluding reductions due to the change in behaviour of the children
Appendix A summarises the results obtained for each one of the day-care centres included.
A specific analysis report was sent to each one of the day-care centres in July 2003 in order for them to proceed with the work.

28 Noise reduction in day-care centres by using acoustic treatments - IRSST
As mentioned above, nine of these twelve day-care centres undertook the work. Some of the day-care centres began the work in Autumn 2003, but the majority was carried out in Spring and Summer 2004 and the last at the end of Autumn 2004 and in January 20058.
8 Various reasons were behind these delays such as authorisations regarding the types of acoustic materials
authorised (due to hygiene problems), architect’s plans and approval from the Ministry of the Family, the Elderly and the Female Condition.

IRSST - Noise reduction in day-care centres by using acoustic treatments 29
7. RESULTS OBTAINED
In order to evaluate the effectiveness of the treatments used, noise level and reverberation time, measurements were taken in each day-care centre.
Information was collected in order to find out the quality and quantity of materials installed in each day-care centre, which was required in order to analyse the results as these would have a clear determining impact on the results obtained.
We must remember that, as with the measurements prior to installing the treatments and due to a significant variation in sound levels in the same day-care centre location (number of children, type of activities, mood of the children, etc.), the acoustic readings were taken on an ongoing basis over two consecutive days. For each day, a period of a few hours corresponding to high activity periods was used in order to compare these to the levels without treatment. The aim of this method was to be able to keep as separate as possible noise levels that were the result of changes in activities or the behaviour of the children.
The sound readings were processed in order to obtain the average sound level following treatment and to compare these results with the average sound levels measured prior to the installation of the treatments.
The RT60 measurements were taken in order to ascertain the lowering of the RT60 following the installation of acoustic materials and to calibrate the acoustic models of the locations in order to calculate the noise reductions attributable to this RT60 reduction.
7.1 Example of detailed analysis of location A-1
In order to describe the analysis process carried out, we present as an example the analyses carried out for location 1 at day-care centre A. For this location, all the recommendations made to reduce noise levels were installed, in other words:
The installation of an acoustic ceiling with an NRC of 0.90;
The installation of a sixty centimetre (two feet) band of acoustic panels on the upper part of the walls, with an NRC of 0.95.
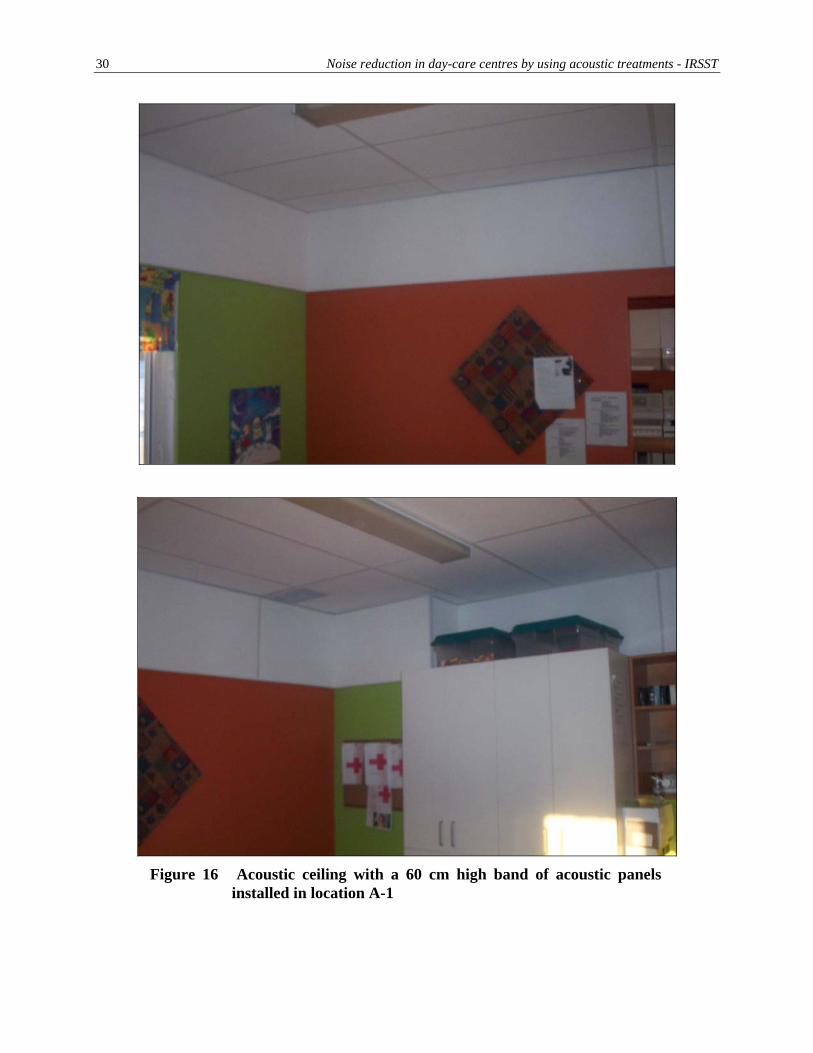
Figure 16 shows the treatments installed in the day-care centre.
30 Noise reduction in day-care centres by using acoustic treatments - IRSST
Figure 16 Acoustic ceiling with a 60 cm high band of acoustic panels
installed in location A-1
IRSST - Noise reduction in day-care centres by using acoustic treatments 31
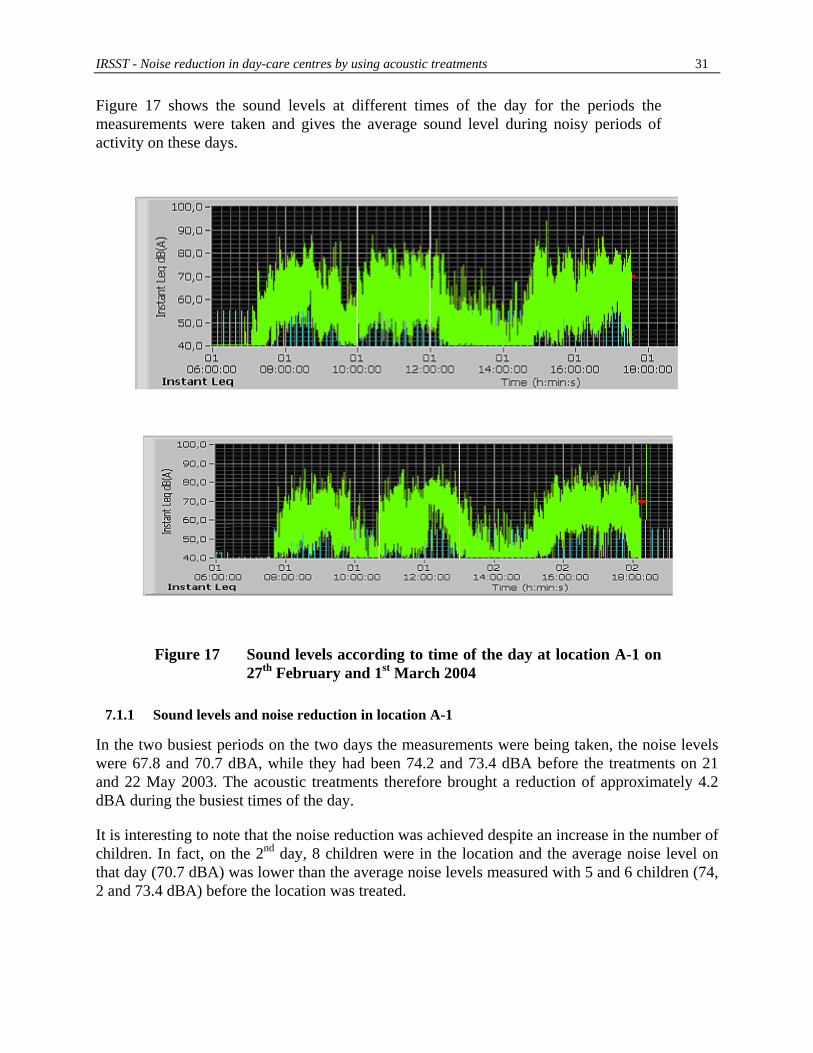
Figure 17 shows the sound levels at different times of the day for the periods the measurements were taken and gives the average sound level during noisy periods of activity on these days.
Figure 17 Sound levels according to time of the day at location A-1 on
27th February and 1st March 2004
7.1.1 Sound levels and noise reduction in location A-1
In the two busiest periods on the two days the measurements were being taken, the noise levels were 67.8 and 70.7 dBA, while they had been 74.2 and 73.4 dBA before the treatments on 21 and 22 May 2003. The acoustic treatments therefore brought a reduction of approximately 4.2 dBA during the busiest times of the day.
It is interesting to note that the noise reduction was achieved despite an increase in the number of children. In fact, on the 2nd day, 8 children were in the location and the average noise level on that day (70.7 dBA) was lower than the average noise levels measured with 5 and 6 children (74, 2 and 73.4 dBA) before the location was treated.

32 Noise reduction in day-care centres by using acoustic treatments - IRSST
Table 10 Average sound level for the sole busy periods in location A-1
Before treatment 21 May 2003 22 May 2003 Average
Leq(8h) Type (dBA) 74.2 73.4 73.8
No. of children (average) 5 6 6
After treatment 27 February 2004 1 March 2004 Average
Leq(8h) Type (dBA) 67.8 70.7 69.6
No. of children (average) 5 8 7
Average measured reduction 4.2
Selecting the “noisiest periods of activity” has in practice proved to be rather subjective as these noisy periods of activity do not always appear clearly on diagrams of time-related sound levels. These periods do not necessarily appear at the same time of the day and do not necessarily last the same amount of time, as was thought when the analysis methodology was developed at the start of the project.
7.1.2 Average sound levels and average reduction over two days of measurement
As the selection of busy periods seemed somewhat arbitrary, it also seemed necessary to evaluate the average sound levels over two whole days in order to validate the importance of noise reductions obtained.
The average sound levels over two days of measurements were also evaluated before and after installing the treatments Table 11 shows these results. The average noise level after treatment was 66.5 dBA while it was 72.2 dBA before treatment. The average noise level reduction across the two days of measurements was 5.7 dBA.
Table 11 Average sound level for both days the measurements were being taken in location A-1
dBA level
Average Lp before treatment 72.2
Average Lp after treatment 66.5
Reduction 5.7

IRSST - Noise reduction in day-care centres by using acoustic treatments 33
The noise reduction evaluated based on sound levels measured in the location is still approximate, the average noise levels made by the children are not necessarily identical before and after the treatment. The type of activity, the general mood of the children, their number and age and the dynamics of the childcare worker, etc. led to variations in sound power made by the children.
One of the methods of evaluating the noise reductions brought about by the acoustic treatments by separating these from the possible variations in noise levels made by the children is to carry out simulations by using calibrated models with reverberation time measurements (or RT60).
7.1.3 The estimated noise reduction based on RT60 measurements
The lower the reverberation time of a location, the lower the average sound level generated in this location by a given source will be. Also, by using two acoustic models from the location with reverberation times that correspond respectively to the reverberation time measured before and after installing the treatments and by using the sources with the same sound power, it is possible, fairly accurately, to evaluate the reduction in noise level brought about by these treatments.
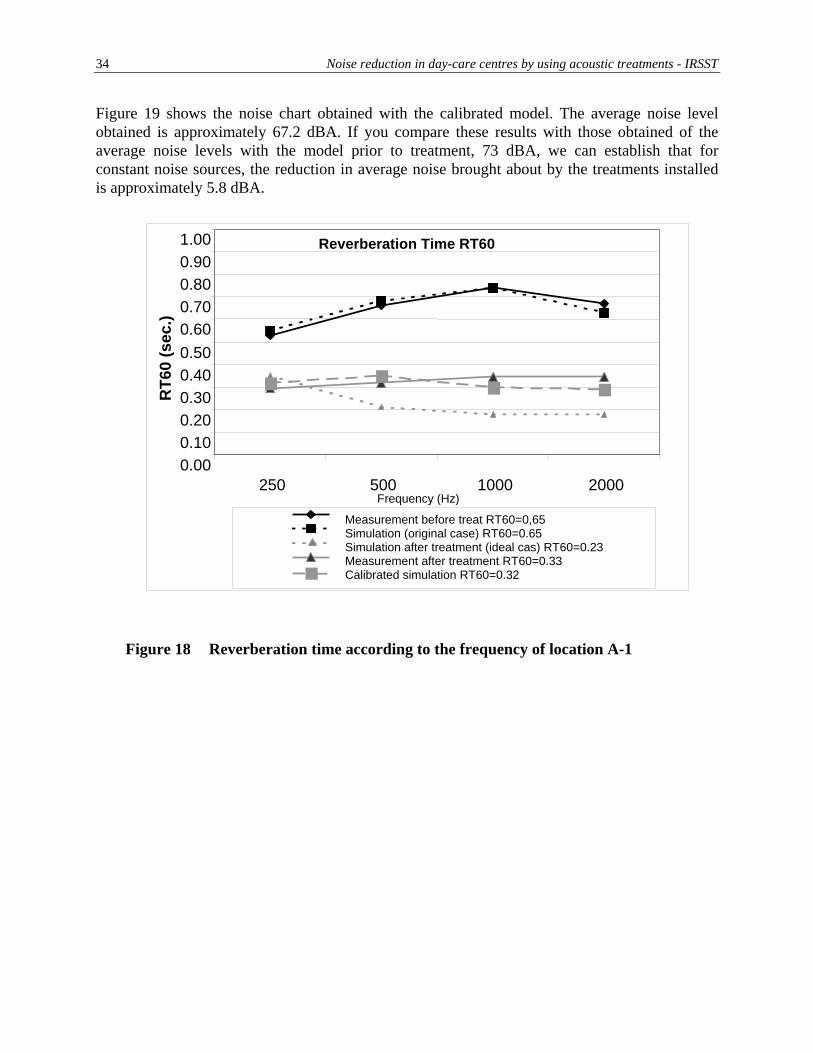
The reverberation time measured before and after installing the acoustic treatments was therefore used in order to calibrate the acoustic models. Figure 18 shows the reverberation time according to the frequency measured before (RT60 = 0.65) and after (RT60 = 0.33) installing the treatments. This figure also gives the RT60 computer models (dotted lines) for the scenario before and the anticipated RT60 if the recommended acoustic treatments had been installed (RT60 = 0.23 sec.).
As we can see, the installation of the acoustic treatments has allowed the RT60 in the location to be reduced significantly (from 0.65 to 0.33 sec.). This reduction has nevertheless been slightly less than the one predicted with the recommended treatments (RT60 – 0.23 sec.).
In order to evaluate the reduction in the noise level brought about by the acoustic treatments when they were installed, the absorption coefficients of the ceiling acoustic tiles (and panels installed on the walls, if applicable) used in the computer models were adjusted in order to obtain a theoretical reverberation time corresponding to the reverberation time measured as an experiment. The RT60 curve, obtained with the calibrated model, corresponds to the “calibrated simulation" curve in Figure 18.
After having obtained the RT60 curve corresponding to the RT60 measured, the model was used in order to evaluate the effectiveness of the acoustic treatments. This evaluation is carried out by calculating the noise generated by X noise sources (representing the X children in the location) with the acoustic treatments. This noise chart can, then, be compared with the one obtained prior to treatment for the same X noise sources. Between the two cases, only the conditions by which noise was spread in the location were different (the number and sound power of the X sources remained strictly the same), the difference between the two simulations corresponded solely with the reduction in average noise following acoustic treatments in the location.
34 Noise reduction in day-care centres by using acoustic treatments - IRSST
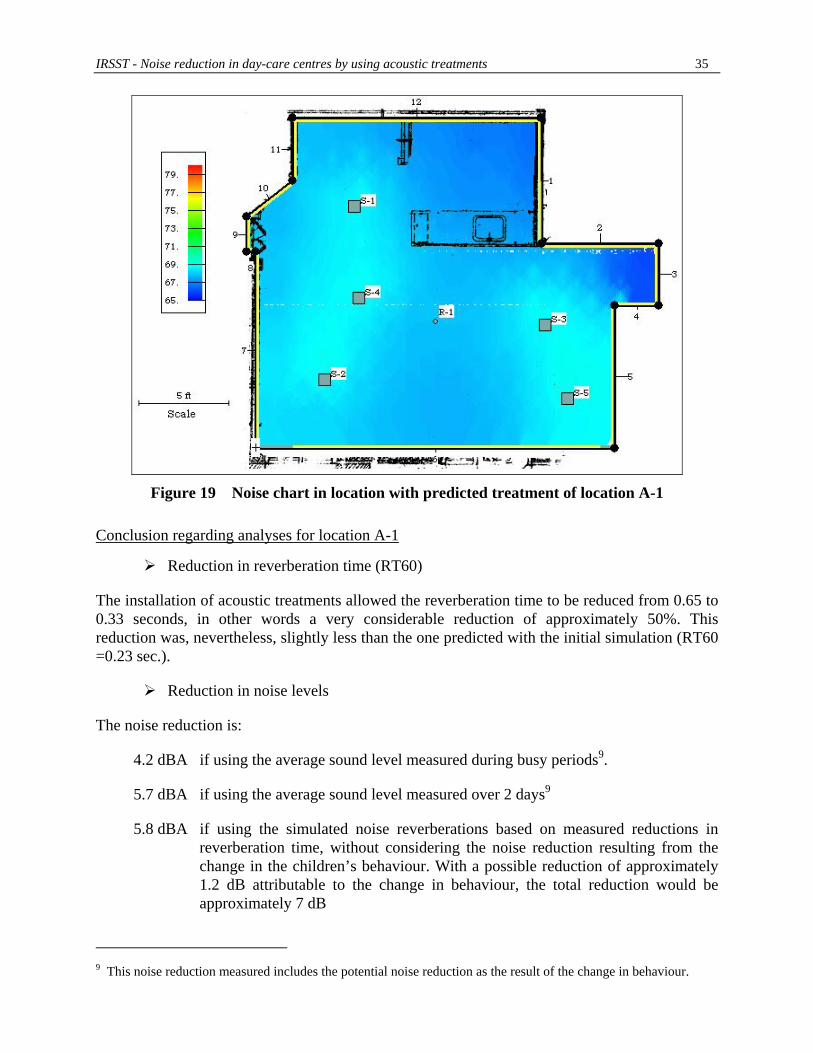
Figure 19 shows the noise chart obtained with the calibrated model. The average noise level obtained is approximately 67.2 dBA. If you compare these results with those obtained of the average noise levels with the model prior to treatment, 73 dBA, we can establish that for constant noise sources, the reduction in average noise brought about by the treatments installed is approximately 5.8 dBA.
Reverberation Time RT60
20001000500Frequency (Hz)
2500.100.200.300.400.500.600.700.800.900
1.00
.00
RT6
0 (s
ec.)
Measurement before treat RT60=0,65 Simulation (original case) RT60=0.65 Simulation after treatment (ideal cas) RT60=0.23 Measurement after treatment RT60=0.33 Calibrated simulation RT60=0.32
Figure 18 Reverberation time according to the frequency of location A-1
IRSST - Noise reduction in day-care centres by using acoustic treatments 35
Figure 19 Noise chart in location with predicted treatment of location A-1
Conclusion regarding analyses for location A-1
Reduction in reverberation time (RT60)
The installation of acoustic treatments allowed the reverberation time to be reduced from 0.65 to 0.33 seconds, in other words a very considerable reduction of approximately 50%. This reduction was, nevertheless, slightly less than the one predicted with the initial simulation (RT60 =0.23 sec.).
Reduction in noise levels
The noise reduction is:
4.2 dBA if using the average sound level measured during busy periods9.
5.7 dBA if using the average sound level measured over 2 days9
5.8 dBA if using the simulated noise reverberations based on measured reductions in reverberation time, without considering the noise reduction resulting from the change in the children’s behaviour. With a possible reduction of approximately 1.2 dB attributable to the change in behaviour, the total reduction would be approximately 7 dB
9 This noise reduction measured includes the potential noise reduction as the result of the change in behaviour.

36 Noise reduction in day-care centres by using acoustic treatments - IRSST
These noise reductions obtained were significant, but less than those predicted by the simulation at the start, 7.8 dBA, excluding the reduction as the result of the change in behaviour and 9.2 dB, including this change in behaviour.
Several reasons may explain these differences in the results, including a variation in noise sources (children) from one day to the next, the accuracy of the information regarding the absorption coefficients of the acoustic materials installed and the limitations of the simulation models.
The analysis of all the results obtained at 18 locations treated allows certain trends to be confirmed and therefore the effects of the suggested acoustic treatments to be determined.
7.2 Results obtained for all the day-care centres.
7.2.1 Variation in treatments installed
In fact, the quantity and acoustic quality of the materials used for the installations vary from one day-care centre to another. Some day-care centres have opted for materials with an optimum noise reduction coefficient (NRC) of 1.0 and other day-care centres have chosen materials with a NRC of 0.95; 0.90; 0.85; 0.75 and even 0.55 for the ceiling. On the other hand, as regards the recommended treatments to the upper part of the walls, some day-care centres carried out the recommended work, while others only completed part of it or not at all.
Table 12 summarises the quantity and acoustic quality of the materials installed in the various day-care centres. The first five columns show the NRC and the surface area of the acoustic materials installed on the ceiling and on the top part of the walls. The last column shows the Sabine absorption installed, Sab installed, in each room. The Sabine absorption corresponds to the amount of absorption added in each location, in other words, the m2 surface area of the new materials multiplied by the absorption difference between the new and old materials:
Sab added =
m2 surface area (installed on ceiling) x [NRC (acoustic panel) – NRC (former ceiling)] + m2 surface area (installed on walls) x [NRC (acoustic panel)- NRC (initial wall)]
Note:
For information purposes, the penultimate column on Table 12 provides the Sabine absorption Sab installed, the absorption of the new materials installed, without including the absorption of the materials removed or recovered by these new materials. Also, note that the various RT60 measurements and simulations carried out within the framework of this study have shown that the NRC of the gypsum walls and ceiling can be estimated to be NRC=0.13.

IRSST - Noise reduction in day-care centres by using acoustic treatments 37
Table 12 Quantity and acoustic quality of materials installed in the locations treated
Locations Ceiling
NRC
Ceiling surface
area m2
Wall NRC
Wall recommended surface area
m2
Wall installed surface
area m2
Sab Installed
Sab Added
A-1 0.90 29.7 0.95 15.0 15.0 41 35 A-2 0.90 34.6 0.95 14.6 14.7 45 39 B-1 0.90 27.2 0.75 11.7 1.9 26 22 B-2 0.90 31.4 0.75 11.1 4.1 31 27 C-1 0.95 42.7 0.75 15.6 4.8 44 38
C-2(1) 0.95 0.75 D-1 1.00 27.2 1.00 11.5 5.9 33 29 D-2 1.00 31.9 11.5 32 28 E-1 0.85 50.2 0.80 16.7 16.7 56 47 E-2 0.85 60.4 0.80 17.7 17.7 65 55 F-1 0.90 39.2 0.75 13.3 2.2 37 32 F-2 0.90 33.0 0.75 13.0 3.7 32 28 G-1 0.95 27.9 9.3 26 23 G-2 0.95 65.0 9.3 62 53
H-1(2) 0.55 55.3 18.8 30 3
H-2(2) 0.55 55.3 19.5 30 3
I-1(2) 0.85 27.9 0.85 11.1 7.9 30 15 I-2 0.85 40.2 0.85 16.3 9.2 42 36
(1) Location C-2, included in the study, was not treated. Instead of C-2, another location, C-3, was treated.
(2) There was already a standard acoustic tile on the ceiling (with an estimated NRC of 0.50) in these 3 locations before the new treatments were installed. Furthermore, the new acoustic tiles installed on the ceiling of locations H-1 and H-2 only have an NRC of 0.55.
As shown in the analyses below, the large variation in the quality and quantity of the treatments installed during the course of this project has clearly demonstrated the effect of the quality of an installation on the final result.
38 Noise reduction in day-care centres by using acoustic treatments - IRSST
7.2.2 Reductions of the RT60 for all locations
The reverberation times measured before and after installing the acoustic treatments were given in Table 13 and Table 14. The RT60 measurements are given in the last column on each table. The average reverberation time is 0.70 sec prior to the installation of the treatments. Following the installation of the treatments, the average reverberation time is 0.35 sec. It is therefore a 50% reduction in reverberation time.
An examination of the results reveals that before the treatment, the majority of the RT60s was between 0.99 sec. and 0.50 sec. Only three locations had reverberation times of less than 0.5 sec. Two of these already had acoustic tiles (H-2 and I-1). The results following treatment indicate RT60s of less than 0.5 sec.
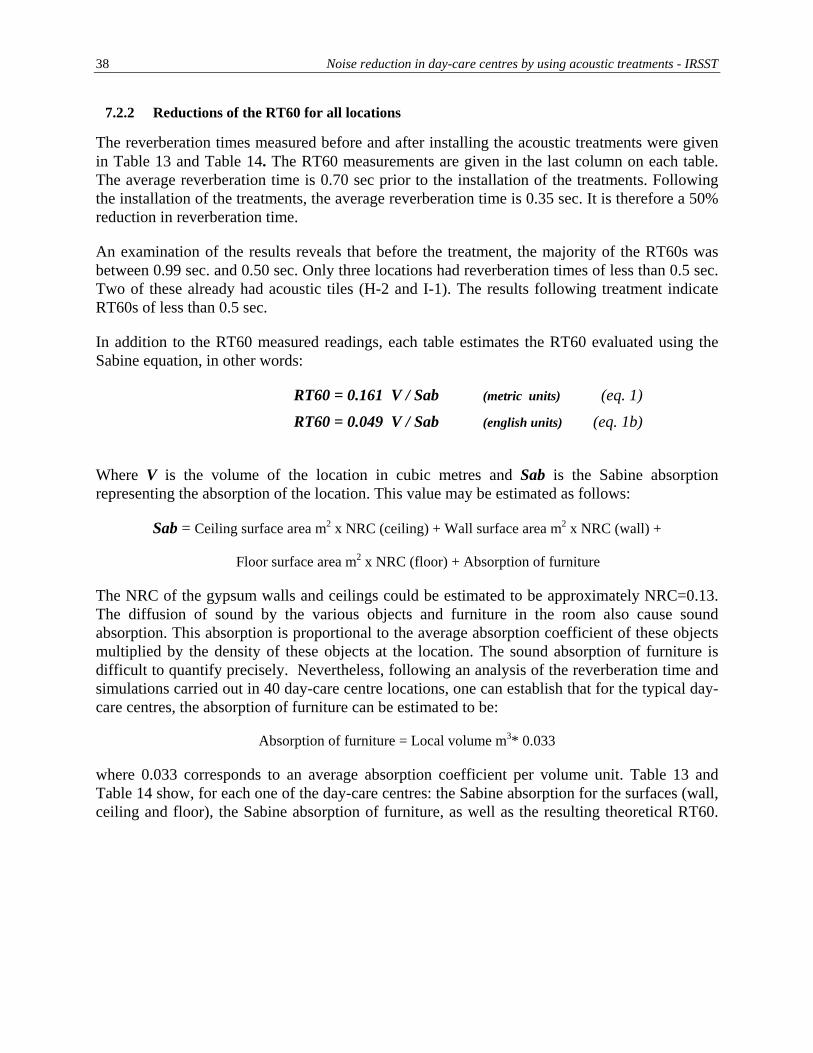
In addition to the RT60 measured readings, each table estimates the RT60 evaluated using the Sabine equation, in other words:
RT60 = 0.161 V / Sab (metric units) (eq. 1)
RT60 = 0.049 V / Sab (english units) (eq. 1b)
Where V is the volume of the location in cubic metres and Sab is the Sabine absorption representing the absorption of the location. This value may be estimated as follows:
Sab = Ceiling surface area m2 x NRC (ceiling) + Wall surface area m2 x NRC (wall) +
Floor surface area m2 x NRC (floor) + Absorption of furniture
The NRC of the gypsum walls and ceilings could be estimated to be approximately NRC=0.13. The diffusion of sound by the various objects and furniture in the room also cause sound absorption. This absorption is proportional to the average absorption coefficient of these objects multiplied by the density of these objects at the location. The sound absorption of furniture is difficult to quantify precisely. Nevertheless, following an analysis of the reverberation time and simulations carried out in 40 day-care centre locations, one can establish that for the typical day-care centres, the absorption of furniture can be estimated to be:
Absorption of furniture = Local volume m3* 0.033
where 0.033 corresponds to an average absorption coefficient per volume unit. Table 13 and Table 14 show, for each one of the day-care centres: the Sabine absorption for the surfaces (wall, ceiling and floor), the Sabine absorption of furniture, as well as the resulting theoretical RT60.

IRSST - Noise reduction in day-care centres by using acoustic treatments 39
Table 13 Reverberation time BEFORE installing the treatments: measured and estimated according to the Sabine formula
Locations Vol. m3
Height metres
Surface area of ceiling
m2
Surface area of
wall m2
Sab estimated
for surface (Average
alpha=0.13)
Sab estimated for objects (Vol * 0.033)
Total estimated Sab before treatment
Estimated RT60 (Eq.1)
RT60 measured
before treatment
A-1 86,0 2.74 31.21 67.91 16,9 2,8 19,7 0.70 0.65 A-2 90,6 2.74 33.07 69.86 17,7 2,9 20,6 0.71 0.69 B-1 72,5 2.44 29.36 58.25 15,2 2,4 17,6 0.66 0.54 B-2 76,9 2.44 31.49 55.18 15,4 2,5 17,9 0.69 0.64 C-1 124,4 2.44 45.34 78.59 22,0 4,0 26,1 0.77 0.96 D-1 67,7 2.74 24.62 56.76 13,8 2,2 16,0 0.68 0.67 D-2 89,4 2.74 32.33 65.12 16,9 2,9 19,8 0.73 0.68 E-1 142,7 2.74 51.37 83.05 24,2 4,6 28,8 0.80 0.66 E-2 173,6 2.74 63.27 88.16 27,9 5,6 33,6 0.83 0.72 F-1 94,0 2.44 38.56 65.87 18,6 3,1 21,6 0.70 0.59 F-2 86,5 2.44 35.45 60.57 17,1 2,8 19,9 0.70 0.99 G-1 99,6 3.20 31.12 72.00 17,5 3,2 20,7 0.77 0.66 G-2 260,5 3.66 71.23 145.57 37,4 8,5 45,9 0.91 0.84 H-1 177,1 3.20 55.28 97.73 47,5 5,8 53,3 0.53 0.53 H-2 177,1 3.20 55.28 97.73 47,5 5,8 53,3 0.53 0.46 I-1 72,4 2.44 29.71 56.39 26,0 2,4 28,4 0.41 0.43 I-2 83,1 2.44 34.09 79.99 19,3 2,7 22,0 0.61 0.56
Average 0.69 0.70 * The H-1, H-2 and I-1 locations already had a standard acoustic tile on the ceiling prior to the installation of the new treatments. Furthermore, the new acoustic
tiles installed on the ceiling of locations H-1 and H-2 only have an NRC of 0.55.

40 Noise reduction in day-care centres by using acoustic treatments - IRSST
Table 14 Reverberation time AFTER installing the treatments: measured and estimated according to the Sabine formula
Sabine absorption (Sab) in the treated
room RT60
Locations Vol. m3
Height m
Surface area of ceiling
m2
Surface area of wall
m2
Sab of new material installed
Sab of other
surfaces
Sabine due to furniture
Total Sab before
treatment
Estimated according to Sabine Eq.
measured
A-1 86,0 2,7 31,2 67,9 41,1 10,9 2,8 54,9 0.25 0.33 A-2 90,6 2,7 33,1 69,9 45,1 11,6 2,9 59,7 0.24 0.36 B-1 72,5 2,4 29,4 58,3 25,9 11,2 2,4 39,4 0.30 0.28 B-2 76,9 2,4 31,5 55,2 31,4 10,8 2,5 44,6 0.28 0.28 C-1 124,4 2,4 45,3 78,6 44,3 15,5 4,0 63,8 0.31 0.34 D-1 67,7 2,7 24,6 56,8 33,2 9,8 2,2 45,2 0.24 0.35 D-2 89,4 2,7 32,3 65,1 31,9 12,7 2,9 47,5 0.30 0.39 E-1 142,7 2,7 51,4 83,1 56,1 15,3 4,6 76,1 0.30 0.34 E-2 173,6 2,7 63,3 88,1 65,5 17,4 5,6 88,6 0.32 0.40 F-1 94,0 2,4 38,6 65,8 37,0 13,3 3,1 53,4 0.28 0.31 F-2 86,5 2,4 35,5 60,5 32,5 12,0 2,8 47,3 0.29 0.44 G-1 99,6 3,2 31,1 72,0 26,5 13,4 3,2 43,2 0.37 0.32 G-2 260,5 3,7 71,2 145,5 61,9 28,2 8,5 98,6 0.43 0.44 H-1 177,1 3,2 55,3 97,7 30,4 19,9 5,8 56,1 0.51 0.46 H-2 177,1 3,2 55,3 97,7 30,4 19,9 5,8 56,1 0.51 0.42 I-1 72,4 2,4 29,7 56,3 30,4 10,2 2,4 43,0 0.27 0.27 I-2 83,1 2,4 34,1 80,0 42,1 13,7 2,7 58,4 0.23 0.27
Average 0.32 0.35* Location H-2 was divided into two during the renovations. The reverberation times before and after the renovations are therefore not directly comparable.
The results of the measurements are therefore only presented for information purposes.
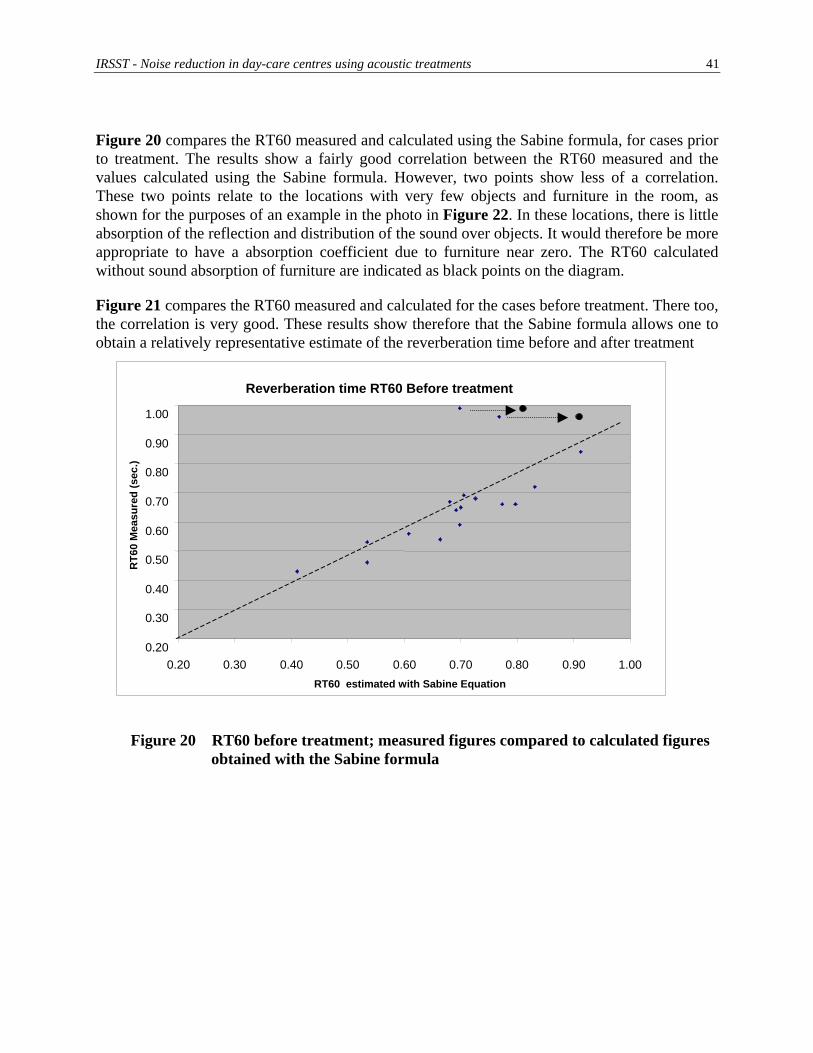
IRSST - Noise reduction in day-care centres using acoustic treatments 41
Figure 20 compares the RT60 measured and calculated using the Sabine formula, for cases prior to treatment. The results show a fairly good correlation between the RT60 measured and the values calculated using the Sabine formula. However, two points show less of a correlation. These two points relate to the locations with very few objects and furniture in the room, as shown for the purposes of an example in the photo in Figure 22. In these locations, there is little absorption of the reflection and distribution of the sound over objects. It would therefore be more appropriate to have a absorption coefficient due to furniture near zero. The RT60 calculated without sound absorption of furniture are indicated as black points on the diagram.
Figure 21 compares the RT60 measured and calculated for the cases before treatment. There too, the correlation is very good. These results show therefore that the Sabine formula allows one to obtain a relatively representative estimate of the reverberation time before and after treatment
Reverberation time RT60 Before treatment
0.20
0.30
0.40
0.50
0.60
0.70
0.80
0.90
1.00
0.20 0.30 0.40 0.50 0.60 0.70 0.80 0.90 1.00RT60 estimated with Sabine Equation
RT6
0 M
easu
red
(sec
.)
Figure 20 RT60 before treatment; measured figures compared to calculated figures
obtained with the Sabine formula

42 Noise reduction in day-care centres by using acoustic treatments - IRSST
Reverberation time RT60 After treatment
0.20
0.30
0.40
0.50
0
0
0
RT6
0 M
easu
red
.60
.70
.80
0.90
1.00
0.20 0.30 0.40 0.50 0.60 0.70 0.80 0.90 1.00 RT60 estimated with Sabine equation
Figure 21 RT60 after treatment; measured figures compared to calculated
figures obtained with the Sabine formula
Figure 22 Photo of F-1 location, a location with few objects and absorbent
surfaces
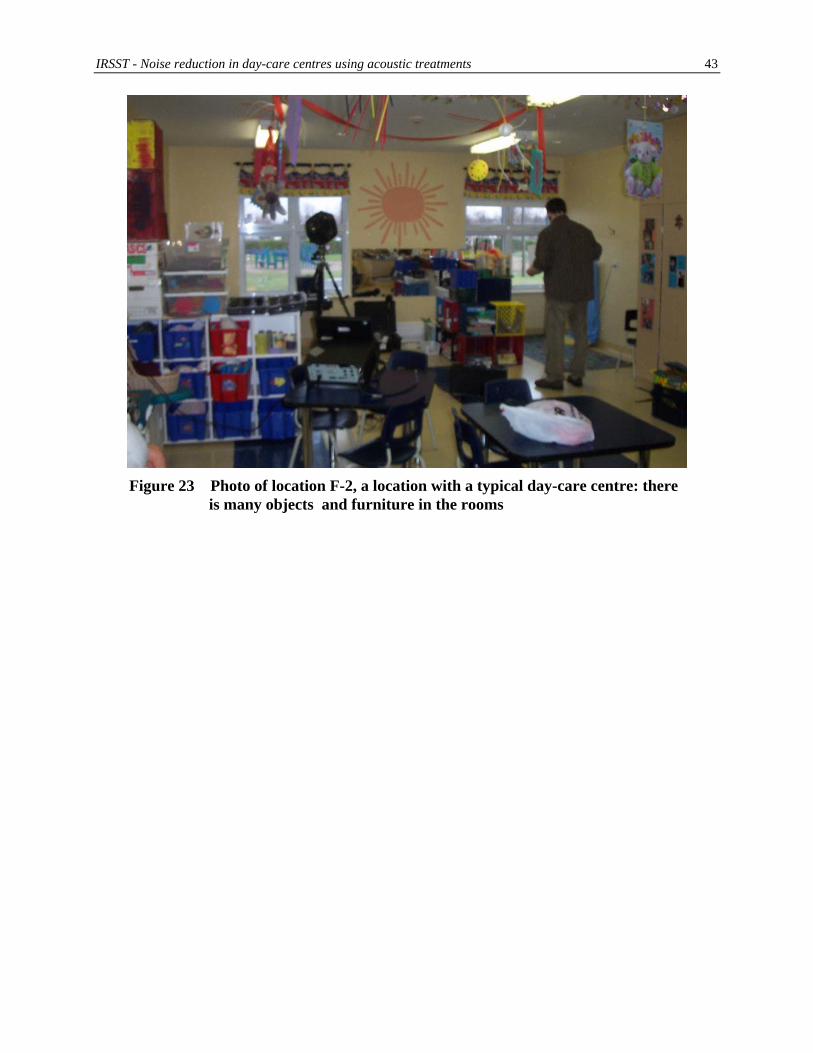
IRSST - Noise reduction in day-care centres using acoustic treatments 43
Figure 23 Photo of location F-2, a location with a typical day-care centre: there
is many objects and furniture in the rooms
44 Noise reduction in day-care centres using acoustic treatments - IRSST
7.2.3 Reductions in noise levels for all locations
For each one of the locations treated, the estimate of the noise reductions was carried out as above, in other words:
1. Based on the average sound levels for busy periods;
2. Based on the average sound levels measured over a period of two days;
3. Through simulations using calibrated models based on reverberation times measured.
Table summarises the results obtained for each one of the locations. These results indicate, without any doubt, that the acoustic treatments installed provided significant reductions in noise levels.
The last line of the table shows the average readings obtained for all locations, excluding the three cases that have been greyed out (locations H-1, H-2, and I-1), which represent specific situations10. The average noise levels measured in all the day-care centres went from approximately 76-75 to 69-68 dBA.
According to the method of evaluation, the noise reductions obtained are a little different:
1. 7.5 dBA (evaluation based on measurements taken during busy periods)
2. 5.9 dBA (evaluation based on the average noise level measured over two days)
3. 4.3 dBA (evaluation based on the reduction in the reverberation time)
The reduction in average noise, estimated based on the reverberation time (4.3 dB), appears to be less than 1.6dB than the noise reduction measured over two days (5.9 dB) and more than 3 dB compared to the average noise reduction measured during busy periods (7.5 dB).
That said, the noise reductions measured show significant variations from one location to another (between 1 to 13 dB depending on the case), variations that cannot simply be explained by the various acoustic treatments installed. In fact, a large part of these variations is the result of other factors: changes in the number of children, the type of activity, the behaviour of the children, etc. Therefore, the average reduction obtained for all locations is undoubtedly significant, even if the noise reductions in each location, obtained specifically based on measurements taken before and after the treatment, are not necessarily representative despite all the measures during this evaluation (duration of measurements, analyses of busy periods, etc.).
10 All 3 locations had standard acoustic tiles. Furthermore, the new acoustic tiles installed on the ceiling of locations
H-1 and H-2 only have an NRC of 0.55.
IRSST - Noise reduction in day-care centres using acoustic treatments 45
The reductions calculated based on the reverberation time are in principle more representative of the effect of the various treatments installed in each location, as this evaluation has been obtained with a calibrated and controlled noise source.
The reductions estimated for this method range from 3.3 to 5.8 dB (excluding the specific cases in locations H-1, H-2 and I-1), variations that, as seen in section 7.2.4, are explained by the differences in the treatments used.
The reduction in average noise (4.3 dB) calculated based on the reverberation time is, however, 1.5 to 3 dB less than the reductions measured in the locations. The results tend to confirm that the reduction in reverberation time not only has a physical effect on the reduction in the spread of sound in the location, but that the RT60 reduction also has an effect on the behaviour of the children (see section 5.2.1.2).
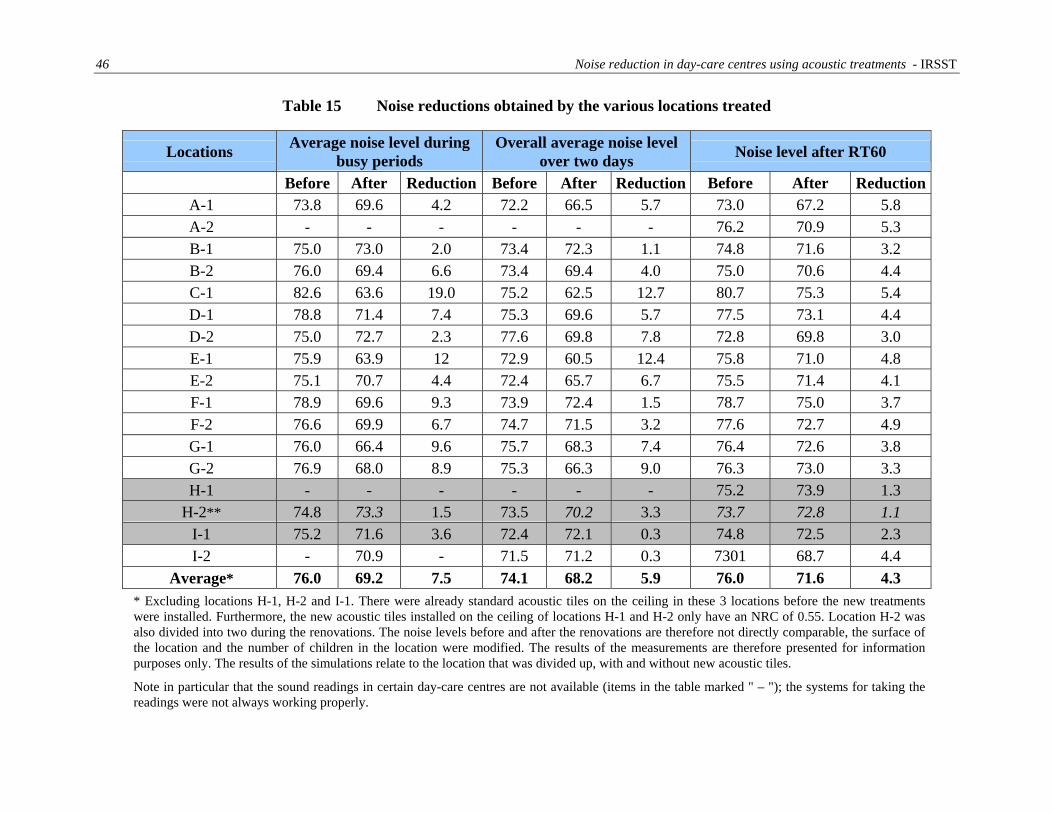
46 Noise reduction in day-care centres using acoustic treatments - IRSST
Table 15 Noise reductions obtained by the various locations treated
Locations Average noise level during busy periods
Overall average noise level over two days Noise level after RT60
Before After Reduction Before After Reduction Before After Reduction A-1 73.8 69.6 4.2 72.2 66.5 5.7 73.0 67.2 5.8 A-2 - - - - - - 76.2 70.9 5.3 B-1 75.0 73.0 2.0 73.4 72.3 1.1 74.8 71.6 3.2 B-2 76.0 69.4 6.6 73.4 69.4 4.0 75.0 70.6 4.4 C-1 82.6 63.6 19.0 75.2 62.5 12.7 80.7 75.3 5.4 D-1 78.8 71.4 7.4 75.3 69.6 5.7 77.5 73.1 4.4 D-2 75.0 72.7 2.3 77.6 69.8 7.8 72.8 69.8 3.0 E-1 75.9 63.9 12 72.9 60.5 12.4 75.8 71.0 4.8 E-2 75.1 70.7 4.4 72.4 65.7 6.7 75.5 71.4 4.1 F-1 78.9 69.6 9.3 73.9 72.4 1.5 78.7 75.0 3.7 F-2 76.6 69.9 6.7 74.7 71.5 3.2 77.6 72.7 4.9 G-1 76.0 66.4 9.6 75.7 68.3 7.4 76.4 72.6 3.8 G-2 76.9 68.0 8.9 75.3 66.3 9.0 76.3 73.0 3.3 H-1 - - - - - - 75.2 73.9 1.3
H-2** 74.8 73.3 1.5 73.5 70.2 3.3 73.7 72.8 1.1 I-1 75.2 71.6 3.6 72.4 72.1 0.3 74.8 72.5 2.3 I-2 - 70.9 - 71.5 71.2 0.3 7301 68.7 4.4
Average* 76.0 69.2 7.5 74.1 68.2 5.9 76.0 71.6 4.3 * Excluding locations H-1, H-2 and I-1. There were already standard acoustic tiles on the ceiling in these 3 locations before the new treatments were installed. Furthermore, the new acoustic tiles installed on the ceiling of locations H-1 and H-2 only have an NRC of 0.55. Location H-2 was also divided into two during the renovations. The noise levels before and after the renovations are therefore not directly comparable, the surface of the location and the number of children in the location were modified. The results of the measurements are therefore presented for information purposes only. The results of the simulations relate to the location that was divided up, with and without new acoustic tiles. Note in particular that the sound readings in certain day-care centres are not available (items in the table marked " – "); the systems for taking the readings were not always working properly.

IRSST - Noise reduction in day-care centres using acoustic treatments - 47
7.2.4 Estimate of the reductions in noise levels as a result of the treatments installed
As mentioned in section 7.2.1, the quantity and quality of the acoustic materials installed in the 18 locations treated varied considerably. It is therefore no surprise that the effectiveness of the treatment varied considerably from one location to the next and from one day-care centre to the next.
The results also showed that the acoustic treatment led to two types of reduction:
b. The reduction in the spread of sound by absorption (Rabs)
c. Noise reduction brought about by changes in behaviour (Rbeh)
A) The reduction in the spread of sound by absorption
Various analyses were carried out in order to show a simple, but significant, relationship between the noise reductions obtained and the acoustic treatments installed.
Figure 24 shows one of the results that proved to be the most significant, in other words, noise reduction obtained by the increase in the average absorption coefficient of the location, ∆α. As can be seen, there is a fairly strong relationship between the increase in the average absorption coefficient and the noise reduction obtained, a relationship represented by the dotted line in Figure 24.
The reduction in average noise brought about by an acoustic treatment in a typical day-care centre location may be estimated by the following equation:
Rabs = 18.5 x ∆α dBA (2a)
Note:
The use of the statistical-energetic method based on the Sabine formula may also be used to estimate the noise reduction due to a change in absorption.
Reduction in reverberant field = Lp (reverberant without treatment) - Lp(rev. with treatment)
= 10 * Log10 (4/Sα) -10 * Log10 (4/Sα’)
Rabs = 10 * Log10 ( Sα’/Sα) dBA
Or even Rabs = 10 * Log10 (α+∆α)/α) dBA (2b)
Appendix C compares the experimental and theoretical results obtained with the 2 formulations (formula 2a and 2b). The theory-experience correlation coefficient for formula 2a is 90%, while it is 0.89 with formula 2b. The results are therefore very similar. In order to facilitate the calculations, we suggest using formula 2a, thus avoiding a mathematical function which may be complex for the day-care centre administrators.

48 Noise reduction in day-care centres by using acoustic treatments - IRSST
The increase in the average absorption coefficient ∆α may be estimated by calculating the Sabine absorption Sab installed relating to the quantity of absorption added in the location, in other words:
∆α = (installed Sab + residual Sab) / Total local surface area – α’ (3)
where:
installed Sab = Surface area of ceiling x ceiling tile NRC + Surface area of material on walls x NRC of wall material
residual Sab = sum of untreated surfaces in the location, multiplied by the average absorption coefficient of the whole surface area
Total surface area of location = Surface area of walls, floor and ceiling included
α’ : average absorption coefficient of location before treatment
0.0
1.0
2.0
3
4
dBA
re
.0
.0
5.0
6.0
7.0
0.00 0.05 0.10 0.15 0.20 0.25 0.30
duct
ion
0.35
Increase in absorption coefficient of a location
Figure 24 Reduction in noise level (for a constant source) as the result of the
increase in average absorption coefficient at the location
For the typically rigid surfaces found at day-care centres (gypsum walls, windows, tiled floors), experience has shown that the average absorption coefficient of this type of location is approximately α’ =0.13. Also, for this type of location (that, at the beginning, has no treatment or acoustic material on the walls and/or ceiling), the increase in the average absorption coefficient ∆α may be obtained using:

IRSST - Noise reduction in day-care centres using acoustic treatments 49
∆α = [(installed Sab + (Total surface area of location – Treated surface area) x
0.13) /Total surface area of location] – 0.13 (4) the treated surface area being the surface area of the ceiling and the treated wall, where applicable.
B) Reduction brought about by changes in behaviour, Rbeh
The reduction in the average noise as the result of the change in behaviour cannot be strictly quantified. This reduction depends undoubtedly on various physical parameters (number of children, size of the location, reverberation time ref. 5.2.1.2), but also on human and/or social factors.
In this context, the noise reduction as the result of the change in behaviour is a simple estimate based on the experimental results obtained in this study.
Therefore:
a. The sound power made by the children can vary from 2 to 3 dB according to the reverberation time reading (ref. Figure 10);
b. The reductions in average noise measured (and therefore including the reductions as the result of their behaviour) were 7.5 and 5.9 dB, while the reduction calculated based on the reverberation time (and not including the behavioural effect), was only 4.3 dB (Table).
It seems reasonable to evaluate that an average reduction of 1 dB due to the acoustic absorption should translate into an average reduction of 0.5 dB due to the behaviour.
The total noise reduction can also be estimated by:
Rtotal ≈ Rabs+0.5 x Rabs (5)
Or even:
Rtotal ≈ 27 x ∆α dBA (6)
7.2.5 Example of evaluation
Location F-1, (see Figure 12) where 0.90 acoustic tiles were installed on the ceiling, (surface area of 38.55 m2 or 415 ft²), as well as 2.23 m2 (24 ft²) of an absorbent material at the top of the walls with an NRC of 0.75.
installed Sab = 38.55 x 0.90 + 2.23 x 0.75
= 36.37
Total surface area of location= 142.97 (wall, ceiling and floor)

50 Noise reduction in day-care centres by using acoustic treatments - IRSST
Treated surface area = 38.55 + 2.23 = 40.78
Therefore
∆α = (36.37 + (142.97 – 40.78) x 0.13) / 142.97 – 0.13
∆α = 0.217
The estimated noise reduction as the result of the absorption would be:
Rabs = 18.5 x 0.217
Rabs = 4.0 dB
In fact, the reduction evaluated based on the RT60 measurements was 3.7 dB (ref. Table) The error in the evaluation here is 0.3 dB.
The total noise reduction including the effect of the treatment on the behaviour will be:
Rtotal = 27 x 0.217
= 5.9 dB
7.2.6 Analysis of costs
The project costs were on average approximately €10,800 (CAD 15,000) per day-care centre, to treat both locations. The costs included the materials, installation, but also related costs such as electricity and professional services in the majority of cases (project management and/or project validation by an architect).
With the average of the acoustic surface areas installed being approximately 89.18 m2 (960 ft²) for each day-care centre (at both locations), the average cost of the projects was therefore approximately €140/m2 (CAD 18/ft²).
The average cost of the materials was approximately €4,685 (CAD 6,500) per day-care centre, these materials include acoustic tiles, but also fixing systems and other related items. For an average installed surface area of 89.18 m² (960 ft²) per day-care centre (for two locations), the average material cost was therefore a little more than €50.38/m² (CAD 6.50/ft²).

IRSST - Noise reduction in day-care centres using acoustic treatments 51
Table shows the typical cost of acoustic ceiling tiles according to the noise reduction coefficient (NRC). Even though the cost of a high and even very high quality material (NRC = 1.00) demands a higher investment of approximately €7.75/m2 (CAD 1/ft²) this cost only represents €720 (CAD 1,000) more for the ceilings in two locations (the average surface area of the areas in question being approximately 422 or 450 ft²).
For the example in section 7.2.4, if the NRC of the ceiling and the wall had been 1.00 rather than 0.90 and 0.75 respectively, the reduction as the result of the absorption would have been Rabs = 4.6 rather than 4 dB, and the total reduction (including the reduction as the result of the behaviour) would have been 6.7 dB rather than 6 dB, at a cost increase of approximately €3.88/m2 (CAD 0.50/ft²), in other words probably less than €540 (CAD 750). Considering the total cost of the project (approximately €10,800 (CAD 15,000)), this sum should only have represented a cost increase of 5%, but with an increase in efficiency of approximately 15%.
It should also be noted that certain day-care centres have taken advantage of the work being carried and installed acoustic tiles in several locations. In this case, the costs per m2 were lower.
Relevance of the band of absorbent materials at the top of the walls
During the study, the relevance of using a band of acoustic materials at the top of the walls was raised on several occasions, particularly because of the complexity and the costs related to the installation of this band. The architectural acoustic bands, such as TechniSilence and Corflex, can cost up to €155 and €233 per m2 (CAD 20 and CAD 30 per ft²). Day-care centre A used a ceiling acoustic tile (with an NRC of 0.95) for the band at the top of the walls (see Figure 16). This day-care centre achieved the most significant noise reductions, Rabs reductions of 5.8 and 5.3 dB, on a very low budget (€ 5328 (CAD 7,400) to treat both locations).
If a 60 cm high band of materials with an NRC of 1.00 had been installed around the perimeter of location 1 at day-care centre F (13.38 m2 instead of 2.23 (144 ft² instead of 24)), the reduction as the result of the absorption would have been 5.8 dB and the total reduction would have been approximately 8.5 dB.
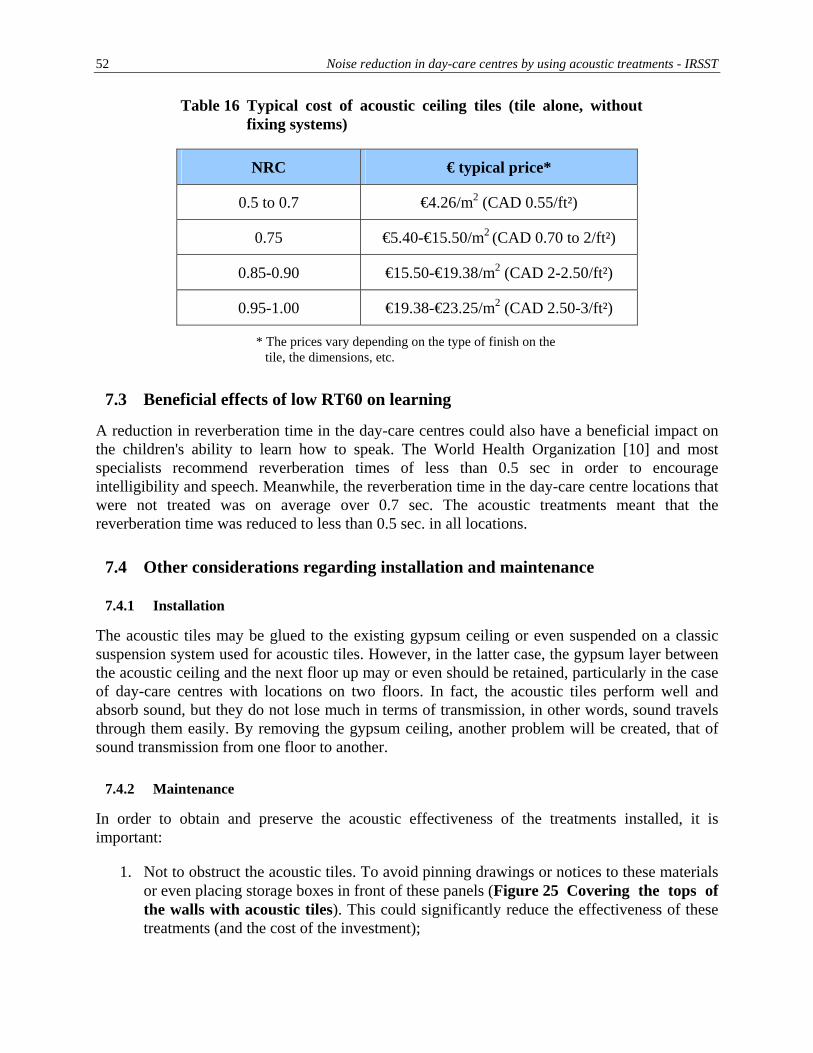
52 Noise reduction in day-care centres by using acoustic treatments - IRSST
Table 16 Typical cost of acoustic ceiling tiles (tile alone, without fixing systems)
NRC € typical price*
0.5 to 0.7 €4.26/m2 (CAD 0.55/ft²)
0.75 €5.40-€15.50/m2 (CAD 0.70 to 2/ft²)
0.85-0.90 €15.50-€19.38/m2 (CAD 2-2.50/ft²)
0.95-1.00 €19.38-€23.25/m2 (CAD 2.50-3/ft²)
* The prices vary depending on the type of finish on the tile, the dimensions, etc.
7.3 Beneficial effects of low RT60 on learning
A reduction in reverberation time in the day-care centres could also have a beneficial impact on the children's ability to learn how to speak. The World Health Organization [10] and most specialists recommend reverberation times of less than 0.5 sec in order to encourage intelligibility and speech. Meanwhile, the reverberation time in the day-care centre locations that were not treated was on average over 0.7 sec. The acoustic treatments meant that the reverberation time was reduced to less than 0.5 sec. in all locations.
7.4 Other considerations regarding installation and maintenance
7.4.1 Installation
The acoustic tiles may be glued to the existing gypsum ceiling or even suspended on a classic suspension system used for acoustic tiles. However, in the latter case, the gypsum layer between the acoustic ceiling and the next floor up may or even should be retained, particularly in the case of day-care centres with locations on two floors. In fact, the acoustic tiles perform well and absorb sound, but they do not lose much in terms of transmission, in other words, sound travels through them easily. By removing the gypsum ceiling, another problem will be created, that of sound transmission from one floor to another.
7.4.2 Maintenance
In order to obtain and preserve the acoustic effectiveness of the treatments installed, it is important:
1. Not to obstruct the acoustic tiles. To avoid pinning drawings or notices to these materials or even placing storage boxes in front of these panels (Figure 25 Covering the tops of the walls with acoustic tiles). This could significantly reduce the effectiveness of these treatments (and the cost of the investment);
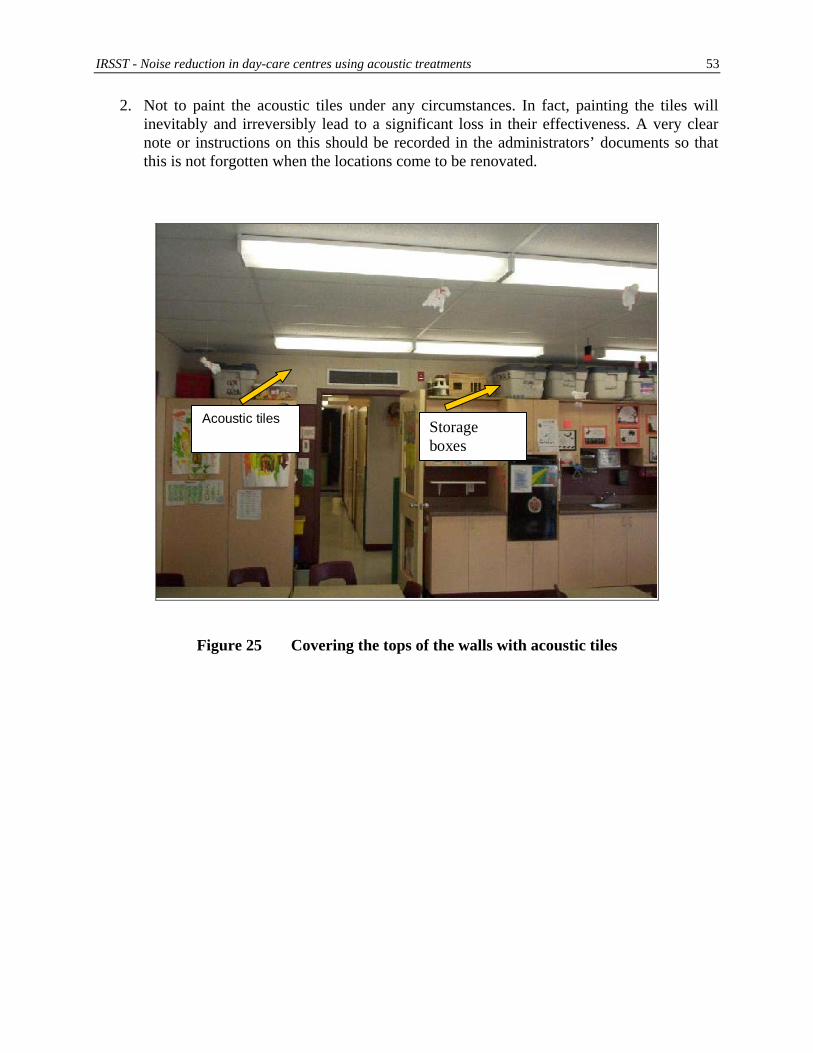
IRSST - Noise reduction in day-care centres using acoustic treatments 53
2. Not to paint the acoustic tiles under any circumstances. In fact, painting the tiles will inevitably and irreversibly lead to a significant loss in their effectiveness. A very clear note or instructions on this should be recorded in the administrators’ documents so that this is not forgotten when the locations come to be renovated.
Acoustic tiles Storage boxes
Figure 25 Covering the tops of the walls with acoustic tiles

54 Noise reduction in day-care centres by using acoustic treatments - IRSST
8. CONCLUSION
The aim of this study was to assess the relevance and effectiveness of noise reduction in day-care centres through the use of acoustic treatments.
1. To carry out this study, the noise levels, reverberation time and surface radiation factor were measured and analysed in 40 locations at 20 day-care centres in Quebec. Dosimetry measurements were also taken of 40 childcare workers. For all the day-care centres, prior to treatment:
The average noise levels over a two-day period were 74 dB;
The average reverberation time was 0.7 of a second;
The dosimetry measurements demonstrated noise doses of approximately 22% compared to current regulations in Quebec;
The type of floor covering did not appear to have any effect on the noise levels in the locations. (The measurements and analyses carried out do not, however, apply to the effect of the floor covering on transmissibility from one location to another).
2. Solutions were identified and recommended for 20 of these locations (two locations out of 10 day-care centres). This solution, applicable to all the childcare centres, consisted in:
• Installing a high-performance acoustic ceiling across the entire existing ceiling;
• A 60 cm band of acoustic panels at the top of the walls.
3. Measurements and analyses were carried out at each one of the locations where the treatments were installed. The acoustic treatments installed allowed the average noise levels to be reduced to less than 69 dBA, in other words, an average reduction in noise levels of approximately 6 to 7 dBA
4. A detailed analysis of the results has shown that part of the reductions obtained were the result of changes in the behaviour of the children and eventually in that of the childcare workers who started to talk more quietly in a less noisy environment.
5. The average cost of the projects was approximately €140 per m2 (CAD 18/ft²) or €10,800 (CAD 15,000) for two normal sized locations. There were significant variations, however, as the result of mechanical problems (lighting, electricity) and professional fees.
6. The results obtained show that the Sabine formula allows us to obtain a fairly accurate estimate of the reverberation time before and after treatment and therefore the reduction in reverberation time (ref. Section (1)).
7. The analysis of the results has allowed us to develop a simple formula in order to estimate the noise reductions that can be obtained for a day-care centre depending on the acoustic
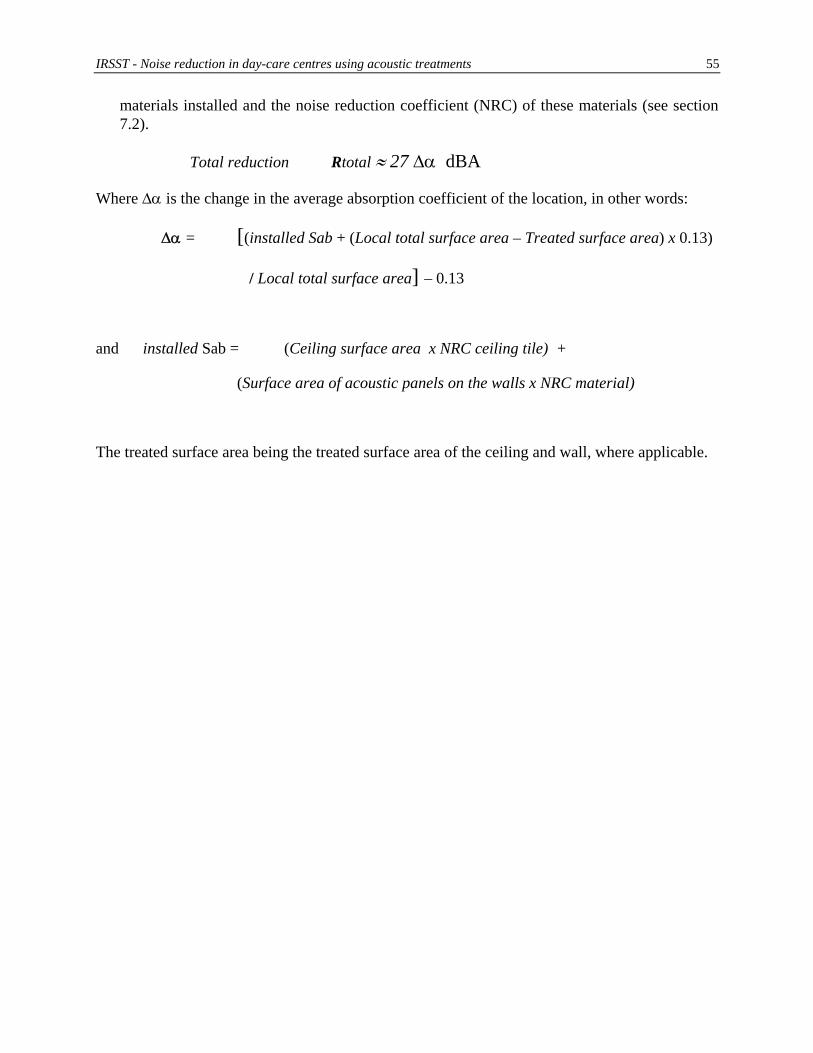
IRSST - Noise reduction in day-care centres using acoustic treatments 55
materials installed and the noise reduction coefficient (NRC) of these materials (see section 7.2).
Total reduction Rtotal ≈ 27 ∆α dBA
Where ∆α is the change in the average absorption coefficient of the location, in other words:
∆α = [(installed Sab + (Local total surface area – Treated surface area) x 0.13)
/ Local total surface area] – 0.13
and installed Sab = (Ceiling surface area x NRC ceiling tile) +
(Surface area of acoustic panels on the walls x NRC material)
The treated surface area being the treated surface area of the ceiling and wall, where applicable.

56 Noise reduction in day-care centres using acoustic treatments - IRSST
FOOTNOTES
1. TRUCHON-GAGNON et R. Hétu. “Noise in day-care center for children”, Noise Control Engineering Journal, 30, 1987, p. 57-64.
2. PICARD et BOUDREAU. “Characteristics of noise found in Day-Care centers”, J. Acous. Soc of Am., Abstract, 105(2), 1999, p.1127.
3. PICARD. “Revisiting Speech Interference in Classrooms”, Audiology, 40, 2001, p. 221-244.
4. MOODLEY. “Acoustic conditions in mainstream classrooms”, J. Br. Assoc. Teachers Deaf, 13, 1989, p. 48-54.
5. LAROCHE, C. Rapport de mesure de bruit à la garderie XXX(confidentiel), Université d’Ottawa, avril 2001.
6. DAVIDSON, P.A. Noise Reduction Study in a Day-Care Center (confidential), Davidson & ass., 1993.
7. HÉTU R. L’interférence du bruit sur la communication, Université de Montréal, 1984
8. MELANÇON, TRUCHON-GAGNON et M. HODGSON. Stratégies architecturales pour éviter les problème de bruit dans les locaux de service de garde à l’enfance, Publication du ministère de la Santé et du Bien-être social.
9. Noise Control For Engineers, Mc Graw –Hill, 1980
10. L’ESPÉRANCE, A. « Sabine’s High Order Method for Acoustical Prediction in Rooms », Inter-Noise 2001, Proc. Paper 575.
11. L'Espérance, A. “Logiciel d'analyse et de gestion du bruit OUIE2000 - Phase 2 : Intégration de mesures expérimentales et évaluation de puissance acoustique type”, Études et recherches / Rapport R-351, 2003, 28 pages. http://www.irsst.qc.ca/en/_projet_3073.html

APPENDIX A TABLE OF DOSIMETRY RESULTS
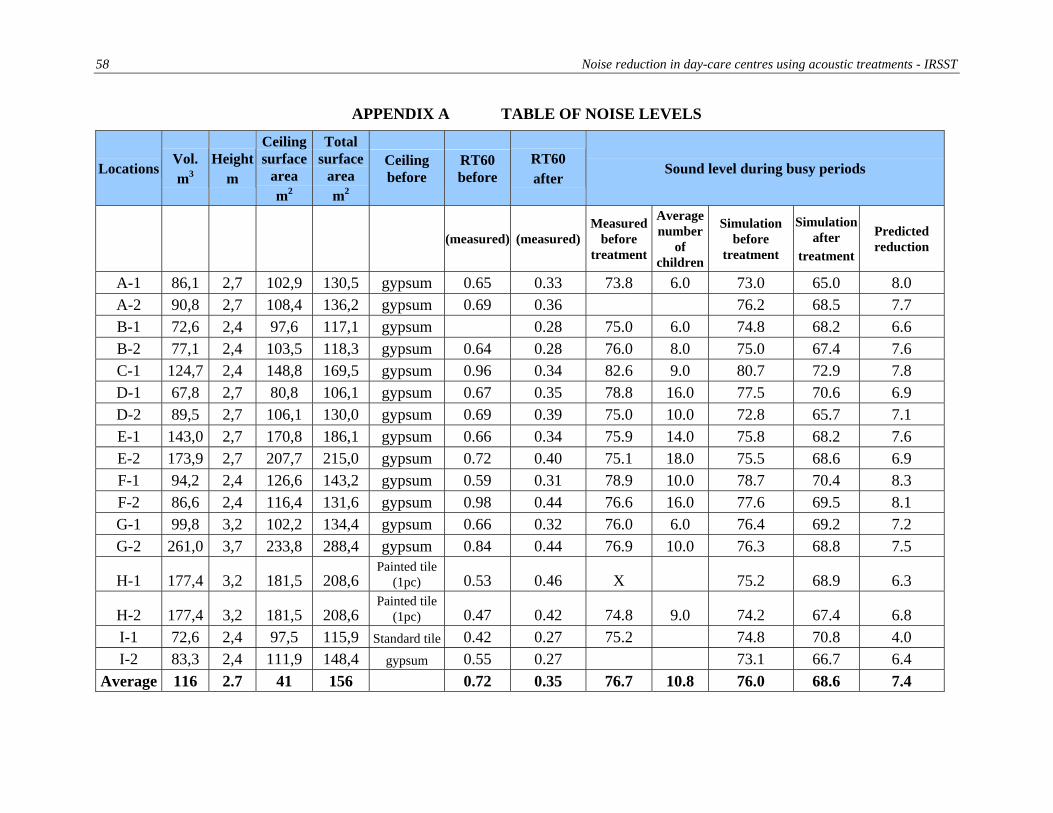
58 Noise reduction in day-care centres using acoustic treatments - IRSST
APPENDIX A TABLE OF NOISE LEVELS
Locations Vol. m3
Height m
Ceiling surface
area m2
Total surface
area m2
Ceiling before
RT60 before
RT60 after
Sound level during busy periods
(measured) (measured)Measured
before treatment
Average number
of children
Simulation before
treatment
Simulation after
treatment
Predicted reduction
A-1 86,1 2,7 102,9 130,5 gypsum 0.65 0.33 73.8 6.0 73.0 65.0 8.0A-2 90,8 2,7 108,4 136,2 gypsum 0.69 0.36 76.2 68.5 7.7B-1 72,6 2,4 97,6 117,1 gypsum 0.28 75.0 6.0 74.8 68.2 6.6B-2 77,1 2,4 103,5 118,3 gypsum 0.64 0.28 76.0 8.0 75.0 67.4 7.6C-1 124,7 2,4 148,8 169,5 gypsum 0.96 0.34 82.6 9.0 80.7 72.9 7.8D-1 67,8 2,7 80,8 106,1 gypsum 0.67 0.35 78.8 16.0 77.5 70.6 6.9D-2 89,5 2,7 106,1 130,0 gypsum 0.69 0.39 75.0 10.0 72.8 65.7 7.1E-1 143,0 2,7 170,8 186,1 gypsum 0.66 0.34 75.9 14.0 75.8 68.2 7.6E-2 173,9 2,7 207,7 215,0 gypsum 0.72 0.40 75.1 18.0 75.5 68.6 6.9F-1 94,2 2,4 126,6 143,2 gypsum 0.59 0.31 78.9 10.0 78.7 70.4 8.3F-2 86,6 2,4 116,4 131,6 gypsum 0.98 0.44 76.6 16.0 77.6 69.5 8.1G-1 99,8 3,2 102,2 134,4 gypsum 0.66 0.32 76.0 6.0 76.4 69.2 7.2G-2 261,0 3,7 233,8 288,4 gypsum 0.84 0.44 76.9 10.0 76.3 68.8 7.5
H-1 177,4 3,2 181,5 208,6Painted tile
(1pc) 0.53 0.46 X 75.2 68.9 6.3
H-2 177,4 3,2 181,5 208,6Painted tile
(1pc) 0.47 0.42 74.8 9.0 74.2 67.4 6.8I-1 72,6 2,4 97,5 115,9 Standard tile 0.42 0.27 75.2 74.8 70.8 4.0I-2 83,3 2,4 111,9 148,4 gypsum 0.55 0.27 73.1 66.7 6.4
Average 116 2.7 41 156 0.72 0.35 76.7 10.8 76.0 68.6 7.4

APPENDIX B TABLE OF DOSIMETRY RESULTS

60 Noise reduction in day-care centres using acoustic treatments - IRSST
childcare workers’ Leq [dB(A)] Total Dose [%] Room #1 Room # 2 Noise Criterion: 90dB Noise Criterion: 85dB Q5 Q3 Q5 Q3 Q5 Q3 Presence [%] Time [min] Dose [%] Presence [%] Time [min] Dose [%]
DCC #1;Work A 80,2 84,9 23,4 30,4 -- 97,7 20,2 97,0 6,0 3,0 14,5 0,5 DCC #1;Work B 72,6 81,3 8,9 13,4 -- 42,0 0,0 0,0 0,0 80,6 386,5 5,6 DCC #2;Work A 69,0 69,9 8,0 2,3 -- 3,1 0,0 0,0 0,0 79,9 394,5 1,7 DCC #2;Work B 80,3 81,6 13,5 14,4 -- 45,6 83,7 173,0 10,2 0,0 0,0 0,0 DCC #3;Work A -- -- -- -- -- -- -- -- -- -- -- --DCC #3;Work B -- -- -- -- -- -- -- -- -- -- -- --DCC #4;Work A 82,9 85,3 38,5 35,6 -- 107,2 74,7 364,5 27,9 0,0 0,0 0,0 DCC #4;Work B 79,3 80,7 24,0 11,5 -- 37,0 0,0 0,0 0,0 83,4 412,0 10,0 DCC #5;Work A 77,8 80,0 20,0 10,7 -- 31,5 57,6 280,0 5,2 0,0 0,0 0,0 DCC #5;Work B 80,9 83,3 32,5 23,5 -- 67,5 0,0 0,0 0,0 54,8 265,0 16,7 DCC #6;Work A 79,0 84,3 25,3 39,3 -- 85,1 50,1 240,5 26,3 0,0 0,0 0,0 DCC #6;Work B 81,8 86,0 32,0 56,1 -- 124,5 1,1 5,0 4,8 67,4 323,5 26,5 DCC #7;Work A 76,2 83,1 14,7 20,1 -- 63,7 84,5 405,5 19,1 0,0 0,0 0,0 DCC #7;Work B 81,6 85,8 31,9 38,8 -- 118,9 0,0 0,0 0,0 73,0 350,5 31,8 DCC #8;Work A 78,9 83,9 21,4 24,8 -- 77,6 0,0 0,0 0,0 30,7 147,0 4,6 DCC #8;Work B 76,7 82,8 17,1 20,6 -- 60,2 65,4 314,0 17,8 37,2 178,5 7,8 DCC #9;Work A 80,4 85,1 26,2 31,8 -- 101,2 18,8 44,5 5,2 0,0 0,0 0,0 DCC #9;Work B 73,7 79,7 10,5 8,9 -- 29,4 10,6 51,0 0,8 19,8 95,0 0,9 DCC #10;Work A 76,5 82,5 15,6 17,5 -- 55,5 77,0 369,5 9,6 0,0 0,0 0,0 DCC #10;Work B 69,5 77,6 5,5 5,2 -- 17,9 0,0 0,0 0,0 41,6 199,5 2,2 DCC #11;Work A 72,3 81,3 9,3 17,7 -- 42,0 93,7 449,5 17,4 0,0 0,0 0,0 DCC #11;Work B 72,7 79,7 9,3 9,0 -- 29,4 0,0 0,0 0,0 69,8 335,0 7,1 DCC #12;Work A 78,4 84,6 20,7 29,0 -- 91,2 33,8 167,0 5,7 0,0 0,0 0,0 DCC #12;Work B 77,4 80,3 11,2 11,9 -- 33,8 0,8 3,5 0,0 61,3 294,0 8,7 DCC #13;Work A 84,7 90,3 48,4 120,3 -- 340,3 77,9 374,0 72,4 0,0 0,0 0,0 DCC #13;Work B 82,2 86,3 33,6 43,4 -- 135,0 0,0 0,0 0,0 16,6 79,5 8,3 DCC #14;Work A 80,1 83,2 27,0 20,6 -- 66,0 0,0 0,0 0,0 95,7 473,0 20,5 DCC #14;Work B 62,1 62,5 0,0 0,2 -- 0,6 100,0 13,0 0,2 0,0 0,0 0,0 DCC #15;Work A 80,7 85,1 23,9 32,3 -- 102,3 66,4 270,0 30,3 0,0 0,0 0,0 DCC #15;Work B 83,6 87,4 40,9 55,0 -- 174,1 0,0 0,0 0,0 82,1 394,0 48,3 DCC #16;Work A 80,5 85,7 27,5 39,4 -- 117,6 0,0 0,0 0,0 58,9 282,5 9,8 DCC #16;Work B 83,7 87,6 42,2 57,8 -- 182,3 81,0 388,5 38,4 0,0 0,0 0,0 DCC #17;Work A 73,2 74,5 8,5 4,2 -- 8,8 0,0 0,0 0,0 87,8 346,5 3,2 DCC #17;Work B 76,8 78,5 14,0 7,1 -- 22,3 79,9 341,0 5,1 0,0 0,0 0,0 DCC #18;Work A 80,0 84,9 26,7 -- -- 96,6 23,7 113,5 -- 22,6 108,5 --DCC #18;Work B 79,6 84,5 24,0 -- -- 89,1 7,7 36,5 -- 38,7 185,5 --DCC #19;Work A 79,7 85,6 24,4 40,7 -- 113,6 0,0 0,0 0,0 64,1 307,5 33,3 DCC #19;Work B 79,2 83,4 22,3 21,7 -- 68,3 73,3 351,5 17,9 9,4 45,0 1,2 DCC #20;Work A 80,9 86,8 29,0 57,8 -- 151,6 77,4 371,5 51,0 0,0 0,0 0,0 DCC #20;Work B 83,7 89,9 39,6 96,2 -- 310,2 0,0 0,0 0,0 76,1 365,0 64,8
Mean value 78,1 82,6 22,4 29,7 -- 87,9 33,1 137,5 10,3 33,0 157,4 8,7

IRSST - Noise reduction in day-care centres using acoustic treatments 61
APPENDIX C Noise reduction according to Statistical-Energetic method
The following diagram compares the experimental results with the theoretical results obtained using the formulation based on the Statistical-Energetic methodology and the simplified equation set out in section 7.2.4.
Rabs = 18.5 x ∆α dBA (2a)
Rabs = 10 * Log10 (α+∆α)/α) dBA (2b)
0,0
1,0
2,0
3,0
4,0
5,0
6,0
0,0 1,0 2,0 3,0 4,0 5,0 6,0
Theoretical Noise reduction
Expe
rimen
tal n
oise
redu
ctio
n
Noise reduction according to eq. 2a
Noise reduction according to Sabine formula (eq. 2b)
The theory-experience correlation coefficient for formula 2a is 90%, while it is 0.89 with formula 2b.
The results are therefore very similar. In order to facilitate the calculations, we suggest using formula 2a which allows us to avoid using a mathematical function that may be daunting for the day-care centre administrators.