Embed Size (px)
Citation preview
Article
Noise source identification andlocalization of mechanical systemsbased on an enhanced independentcomponent analysis
Wei Cheng, Zhousuo Zhang, Guanwen Zhu and Zhengjia He
Abstract
In this paper, an enhanced independent component analysis (EICA) is comparatively studied with the traditional fast
independent component analysis algorithm, and a noise source identification and localization method based on the EICA
and spectral correlation analysis is proposed. The EICA selects the optimal separations using clustering analysis from
multiple source separations, and the robustness and effectiveness of the EICA are validated by a numerical case study.
The proposed noise source identification and localization method firstly separates the mixed noise signals measured
outside of a mechanical system, which guarantees an easy and complete measure of all the source information and an
accurate source separation. Secondly, it evaluates the separating performances by time and frequency feature analysis and
waveform correlation analysis. Finally, it adaptively identifies and localizes the noise sources by spectral correlation
analysis and priori information of the mechanical system. The effectiveness of the proposed method is validated by
experimental studies on a test-bed, and this study can be beneficial for vibration and noise monitoring and the control of
mechanical systems.
Keywords
Enhanced independent component analysis, source identification and localization, source separation, spectral correlation
analysis, vibration and noise monitoring and control
1. Introduction
Vibration and noise of mechanical systems can reducethe machining precision, aggravate the fatigue of somekey components, shorten the service life of equipment,and even cause disastrous accidents. For some under-water vehicles, vibration and noise do great harm to thestealth performances of the vehicles and the workingconditions of crews. Therefore, it is important toreduce and control the vibration and noise to improveoperational performances of mechanical systems. Theprimary and most important work for vibration andnoise reduction and control is to identify and localizethe vibration and noise sources.
Generally, there are two key factors of vibration andnoise reduction and control: vibration and noisesources, and the transmission effects of mediums suchas mechanical structures, air, and water. Recently, agreat work has been devoted to analyzing transmissioneffects of vibration and noise. Huang and Nutt (2011)
investigated the effects of sound transmission throughunbounded panels of functionally graded materials.Diaz-Cereceda et al. (2012) proposed a finite layermethod for modeling the sound transmission throughdouble walls. Shimizu et al. (2013) explained the detailsof the analysis for prediction of sound transmission ofdouble-pane windows. Calvo et al. (2013b) built amodel of the underwater sound transmission throughthin soft elastomers containing arrays of pancake voids,and verified the enhanced sound transmission from
State Key Laboratory for Manufacturing Systems Engineering, Xi’an
Jiaotong University, People’s Republic of China
Corresponding author:
Wei Cheng, State Key Laboratory for Manufacturing Systems Engineering,
Xi’an Jiaotong University, 710049, People’s Republic of China.
Email: [email protected]
Received: 18 December 2013; accepted: 3 May 2014
Journal of Vibration and Control
2016, Vol. 22(4) 1128–1142
! The Author(s) 2014
Reprints and permissions:
sagepub.co.uk/journalsPermissions.nav
DOI: 10.1177/1077546314539370
jvc.sagepub.com
at Xi’an Jiaotong University on March 7, 2016jvc.sagepub.comDownloaded from
water to air at low frequencies via experimental studies(Calvo et al., 2013a). Sgard et al. (2013) studied tunnel-ing effects on the sound transmission loss of a flat struc-ture coupled with a porous material. All the abovearticles studied on the sound transmission effectsthrough different structures, and can be beneficial forpassive vibration and noise control through vibrationand noise isolation with designed structures. However,it is a challenge to build a precise model of sound trans-mission for complex structures.
Blind source separation (BSS) (Levin, 2010;Tichavsky and Koldovsky, 2011; Anderson et al.,2012), including independent component analysis(ICA) (Li and Adali, 2010; Nguyen and Zheng, 2011;Loesch and Yang, 2013) can separate multi-channelsignals into several independent components (ICs)without the knowledge of sources and mixing mode,and thus provide a powerful tool to recover thehidden source information from the mixed signalswhich can be easily measured outside of the mechanicalsystems. Many engineering applications have beenbenefited from these methods. Xiong et al. (2010)applied the ICA to order selection and image process-ing of functional magnetic resonance imaging (FMRI)data. Nafta et al. (2013) proposed a multi-tap ICAscheme for blind equalization and phase recovery incoherent optical communication systems. De Mouraet al. (2010) applied ICA for passive sonar signal detec-tion and classification. Lombard et al. (2011) validatedthat broadband ICA can be successfully exploited foracoustic source localization. Yu and Kok Kiong (2010)proposed an approach for decoupling of crossingorders in Vold-Kalman filtering order tracking(VKF_OT). Wang (2010) presented a spatio-temporalextractor for artifact removal from biomedical signals.Cheng et al. (2011) applied ICA for vibration sourceseparation and vibration source identification (Chenget al., 2013), vibration source number estimation(Cheng et al., 2012a), and vibration source contributionevaluation (Cheng et al., 2012b) of mechanical systems.All these engineering applications have proved thatBSS or ICA can solve many source separation workproblems, and reveal the hidden source informationjust based on measured mixed signals.
This paper proposes a noise source identification andlocalization method based on an EICA and spectralcorrelation analysis. By using clustering analysis andoptimal selection strategy from multiple source separ-ations, the EICA improves the effectiveness and robust-ness of the source separation algorithms. The proposednoise source identification and localization method sep-arates the mixed noise signals measured from the soundpressure sensors, and evaluates the separating perform-ances of the EICA by waveform correlation analysis,and then adaptively identifies and localizes the noise
sources by spectral correlation analysis. In the numer-ical case study, the separating performances of theEICA are comparatively studied with the fast ICAalgorithm, which is a very famous ICA algorithm pro-posed by Hyvarinen (Hyvarinen, 1999; Hyvarinen andOja, 2000; Hyvarinen et al., 2001). In the experimentalstudies, a test-bed with two noise sources by two loud-speakers and one noise source by a motor is con-structed, and the effectiveness of the proposed noisesource identification and localization method is vali-dated by the noise source separation, identificationand localization. According to noise source identifica-tion and localization, this study can reveal the sourcesof the major components in the measured mixed sig-nals, and provide important information for vibrationand noise monitoring and control of mechanicalsystems.
The remainder of this paper is organized as follows.Section 2 introduces the basic theory of ICA and EICA.Section 3 is designed to validate the robustness andseparating performances of the EICA. In Section 4,the EICA is applied to separate the noise sourcesfrom the mixed signals of a test-bed, and the effective-ness of the proposed method is validated. Section 5summarizes the authors’ work and gives theconclusions.
2. Enhanced independent componentanalysis
2.1. Basic model of independent componentanalysis (ICA)
Assume that n sources S ¼ s1, . . . , sn½ �T are available,
and m mixed signals X ¼ x1, . . . , xm½ �T linearly com-
posed by these sources are measured in different loca-tions. These linearly mixed signals can be described as
xi ¼Xnj¼1
aijsj þ ni i ¼ 1, . . . ,m
X ¼ ASþN ðin a matrix formÞ,
ð1Þ
where xi is the ith mixed signal measured from thesensor i, sj is the jth source signal, aij is the mixingcoefficient, A is the mixing matrix, andN ¼ n1, n2, . . . , nm½ � is the noise matrix.
Independent component analysis calculates a separ-ating matrix W, and estimates source informationY ¼ y1, . . . , yn½ �
T¼WX from the mixed signals X,
given the following assumptions:
1. Each source signal sj ð j ¼ 1, . . . , nÞ is zero mean andrandom variable, and all the source signals are stat-istically independent.
Cheng et al. 1129
at Xi’an Jiaotong University on March 7, 2016jvc.sagepub.comDownloaded from
2. The number of source signals should be no morethan that of mixed signals (n � m).
3. At most one source is allowed to follow a Gaussiandistribution.
Under these assumptions, ICA transforms mixedsignals into components which are statistically as inde-pendent from each other as possible (Hyvarinen, 1999).To measure the independence of each component, thenegentropy J from the information theory (Hyvarinenand Oja, 2000) is used:
Jð yÞ ¼ Hð yGaussÞ �Hð yÞ ð2Þ
where H is the information entropy, Hð yÞ ¼ �Rpð yÞ
log pð yÞdy, and yGauss is a signal of Gaussian distribu-tion with the same mean and variance of y, and pð yÞ isthe probability density.
Since pð yÞ is generally unknown, the independenceof each separated component is measured by approxi-mations using non-quadratic functions of F, and theobjective function JGð!Þ is given to find each separatingvector !:
JGð!Þ ¼ E F yGaussð Þ½ � � E F !Tx� �� �� �2
: ð3Þ
Two non-quadratic functions of F are commonlyused:
FðuÞ ¼ log coshðuÞ, ð4Þ
FðuÞ ¼ � expð�u2=2Þ: ð5Þ
Then, the fast ICA algorithm based on negentropycan be applied to find a separating matrixW ¼ !1, . . . ,!n½ �
T by maximizing the negentropies(Hyvarinen and Oja, 1997; Hyvarinen, 1999). As thenegentropies of all the !pð p ¼ 1, . . . , nÞ obtain max-imum values, the mutual information between eachseparated component tends to be a minimum, andthus the separated ICs can be as independent aspossible.
maxW
Xnp¼1
JGð!pÞ
s:t: E !Tp x
� �!Tq x
� �h i¼ �pq ¼
1 if p ¼ q
0 if p 6¼ q
� ð6Þ
By minimizing the mutual information betweenmixed signals, the separating vector of each IC can becalculated in the condition that all the separated com-ponents are independent to each other. Normally, each
separating vector is calculated one by one by the fol-lowing steps:
!p E zF !Tp z
� �h i� E f !T
p z� �h i
!p
!p !p
k!p k2
8<: , ð7Þ
where W ¼ !1, . . . ,!n½ �T, z is a vector of x after whiten-
ing, and f is the derivative of F.Then, the estimation y of source s can be determined
by Y ¼WX. The calculating framework of the fast ICAalgorithm is summarized and shown in Figure 1. Themixed signals X are normalized to have zero means andunit variances, and then whitened using PrincipalComponent Analysis (PCA). This step makes themixed signals uncorrelated to each other, and thuscan reduce the calculation complexity. A separatingvector !p is randomly chosen, and iterated throughequations (7) to numerically find a solution which satis-fies equation (6). The above steps are repeated until itextracts all the separating vectors in W ¼ !1, . . . ,!n½ �
T.The fast ICA algorithm is a computationally and
highly efficient method for performing the estimationof ICA. It uses a fixed point iteration scheme that hasbeen found in independent experiments to be 10–100times faster than conventional gradient descent meth-ods (Hyvarinen, 1999). The detailed theory and algo-rithm of the fast ICA algorithm are in the references(Hyvarinen, 1999; Hyvarinen and Oja, 2000; Hyvarinenet al., 2001).
2.2. The enhanced independent componentanalysis (EICA) algorithm
Although the fast ICA algorithm has shown its signifi-cant performance improvement for linearly mixing sig-nals (Hyvarinen and Oja, 1997), the results cannot beguaranteed and are often different in repeated calcula-tions because of the stochastic characteristics of ICAalgorithms (Himberg and Hyvarinen, 2003; Himberget al., 2004). This is because the measured signals donot strictly comply with ICA assumptions, or the algo-rithm may converge to local optima rather than to theglobal one.
To improve the separating performance and robust-ness of ICA, an enhanced independent component ana-lysis (EICA) is constructed using multiple separationand optimal selection after clustering evaluation.Independent components are firstly extracted usingthe fast ICA algorithm.Multiple runs of fast ICA willbe executed to mitigate inherited uncertainties of thisalgorithm. Then the reliability of these ICs is evaluatedby the clustering method to select the most reliable ICs.Source separation step of the EICA algorithm is shownin Figure 2.
1130 Journal of Vibration and Control 22(4)
at Xi’an Jiaotong University on March 7, 2016jvc.sagepub.comDownloaded from
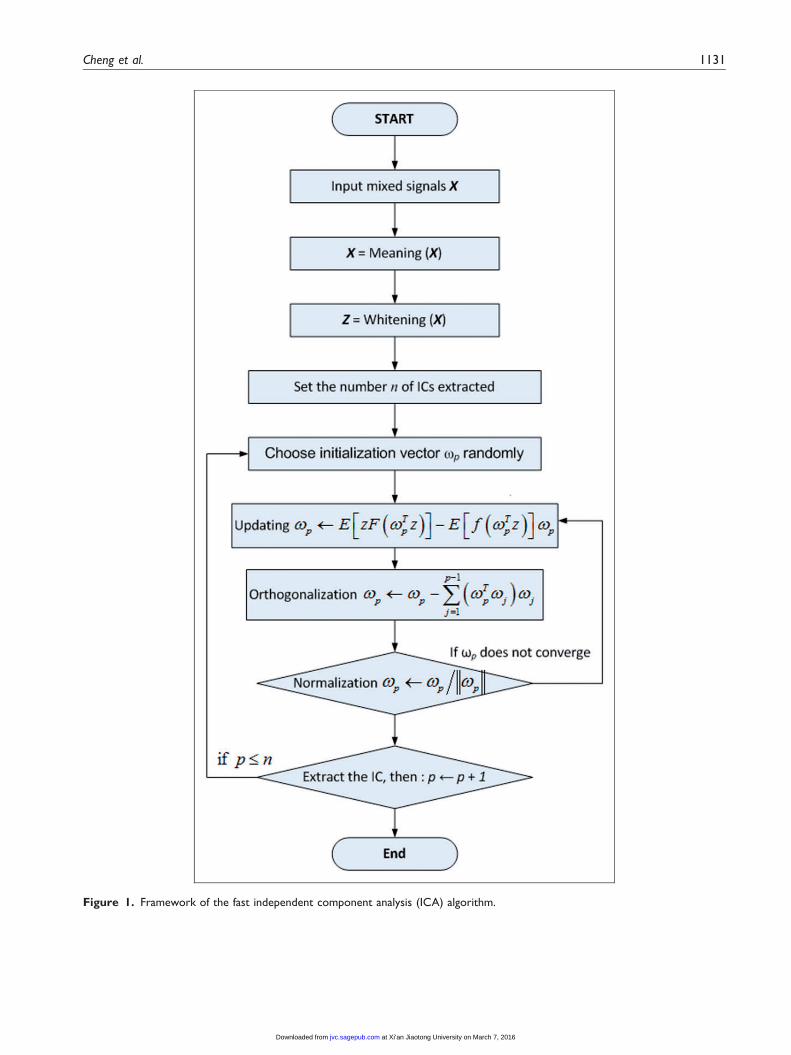
Figure 1. Framework of the fast independent component analysis (ICA) algorithm.
Cheng et al. 1131
at Xi’an Jiaotong University on March 7, 2016jvc.sagepub.comDownloaded from
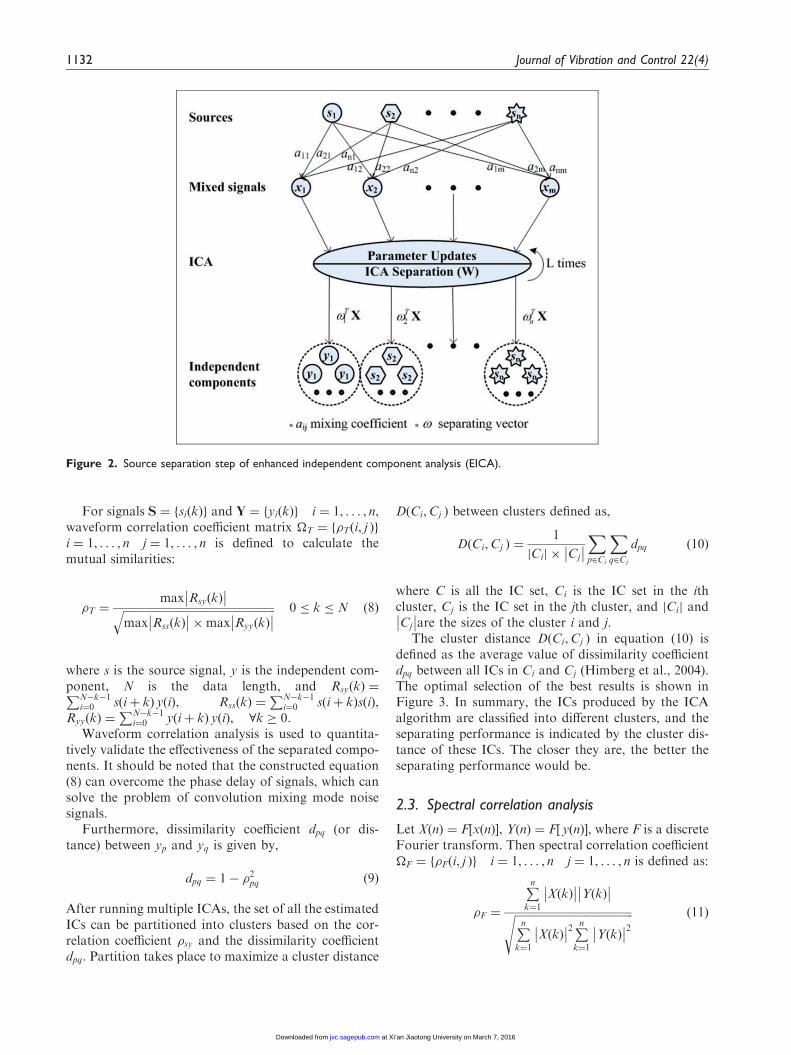
For signals S ¼ fsiðkÞg and Y ¼ fyiðkÞg i ¼ 1, . . . , n,waveform correlation coefficient matrix �T ¼ f�Tði, j Þgi ¼ 1, . . . , n j ¼ 1, . . . , n is defined to calculate themutual similarities:
�T ¼max RsyðkÞ
ffiffiffiffiffiffiffiffiffiffiffiffiffiffiffiffiffiffiffiffiffiffiffiffiffiffiffiffiffiffiffiffiffiffiffiffiffiffiffiffiffiffiffiffiffiffiffiffiffiffiffiffiffiffiffimax RssðkÞ
�max RyyðkÞ q 0 � k � N ð8Þ
where s is the source signal, y is the independent com-ponent, N is the data length, and RsyðkÞ ¼PN�k�1
i¼0 sðiþ kÞ yðiÞ, RssðkÞ ¼PN�k�1
i¼0 sðiþ kÞsðiÞ,RyyðkÞ ¼
PN�k�1i¼0 yðiþ kÞ yðiÞ, 8k � 0.
Waveform correlation analysis is used to quantita-tively validate the effectiveness of the separated compo-nents. It should be noted that the constructed equation(8) can overcome the phase delay of signals, which cansolve the problem of convolution mixing mode noisesignals.
Furthermore, dissimilarity coefficient dpq (or dis-tance) between yp and yq is given by,
dpq ¼ 1� �2pq ð9Þ
After running multiple ICAs, the set of all the estimatedICs can be partitioned into clusters based on the cor-relation coefficient �sy and the dissimilarity coefficientdpq. Partition takes place to maximize a cluster distance
DðCi,Cj Þ between clusters defined as,
DðCi,Cj Þ ¼1
Cij j � Cj
Xp2Ci
Xq2Cj
dpq ð10Þ
where C is all the IC set, Ci is the IC set in the ithcluster, Cj is the IC set in the jth cluster, and Cij j andCj
are the sizes of the cluster i and j.The cluster distance DðCi,Cj Þ in equation (10) is
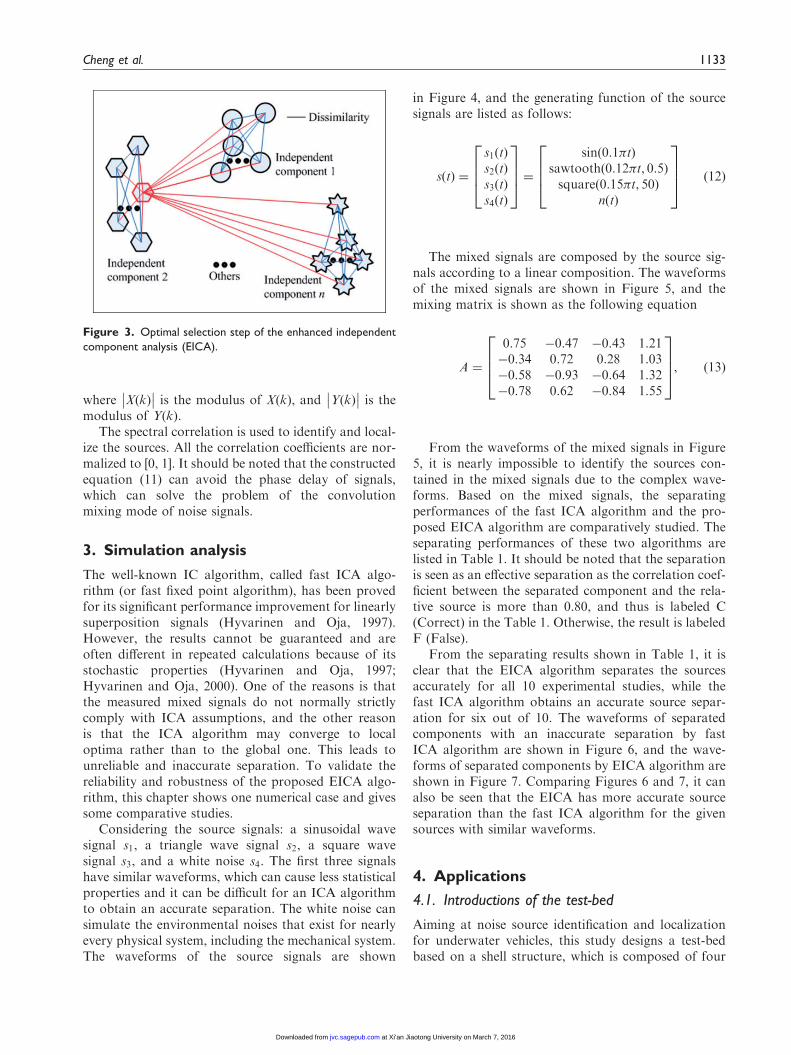
defined as the average value of dissimilarity coefficientdpq between all ICs in Ci and Cj (Himberg et al., 2004).The optimal selection of the best results is shown inFigure 3. In summary, the ICs produced by the ICAalgorithm are classified into different clusters, and theseparating performance is indicated by the cluster dis-tance of these ICs. The closer they are, the better theseparating performance would be.
2.3. Spectral correlation analysis
Let XðnÞ ¼ F½xðnÞ�, YðnÞ ¼ F½ yðnÞ�, where F is a discreteFourier transform. Then spectral correlation coefficient�F ¼ f�Fði, j Þg i ¼ 1, . . . , n j ¼ 1, . . . , n is defined as:
�F ¼
Pnk¼1
XðkÞ YðkÞ
ffiffiffiffiffiffiffiffiffiffiffiffiffiffiffiffiffiffiffiffiffiffiffiffiffiffiffiffiffiffiffiffiffiffiffiffiffiffiffiffiffiffiffiPnk¼1
XðkÞ 2Pn
k¼1
YðkÞ 2s ð11Þ
Figure 2. Source separation step of enhanced independent component analysis (EICA).
1132 Journal of Vibration and Control 22(4)
at Xi’an Jiaotong University on March 7, 2016jvc.sagepub.comDownloaded from
where XðkÞ is the modulus of XðkÞ, and YðkÞ
is themodulus of YðkÞ.
The spectral correlation is used to identify and local-ize the sources. All the correlation coefficients are nor-malized to [0, 1]. It should be noted that the constructedequation (11) can avoid the phase delay of signals,which can solve the problem of the convolutionmixing mode of noise signals.
3. Simulation analysis
The well-known IC algorithm, called fast ICA algo-rithm (or fast fixed point algorithm), has been provedfor its significant performance improvement for linearlysuperposition signals (Hyvarinen and Oja, 1997).However, the results cannot be guaranteed and areoften different in repeated calculations because of itsstochastic properties (Hyvarinen and Oja, 1997;Hyvarinen and Oja, 2000). One of the reasons is thatthe measured mixed signals do not normally strictlycomply with ICA assumptions, and the other reasonis that the ICA algorithm may converge to localoptima rather than to the global one. This leads tounreliable and inaccurate separation. To validate thereliability and robustness of the proposed EICA algo-rithm, this chapter shows one numerical case and givessome comparative studies.
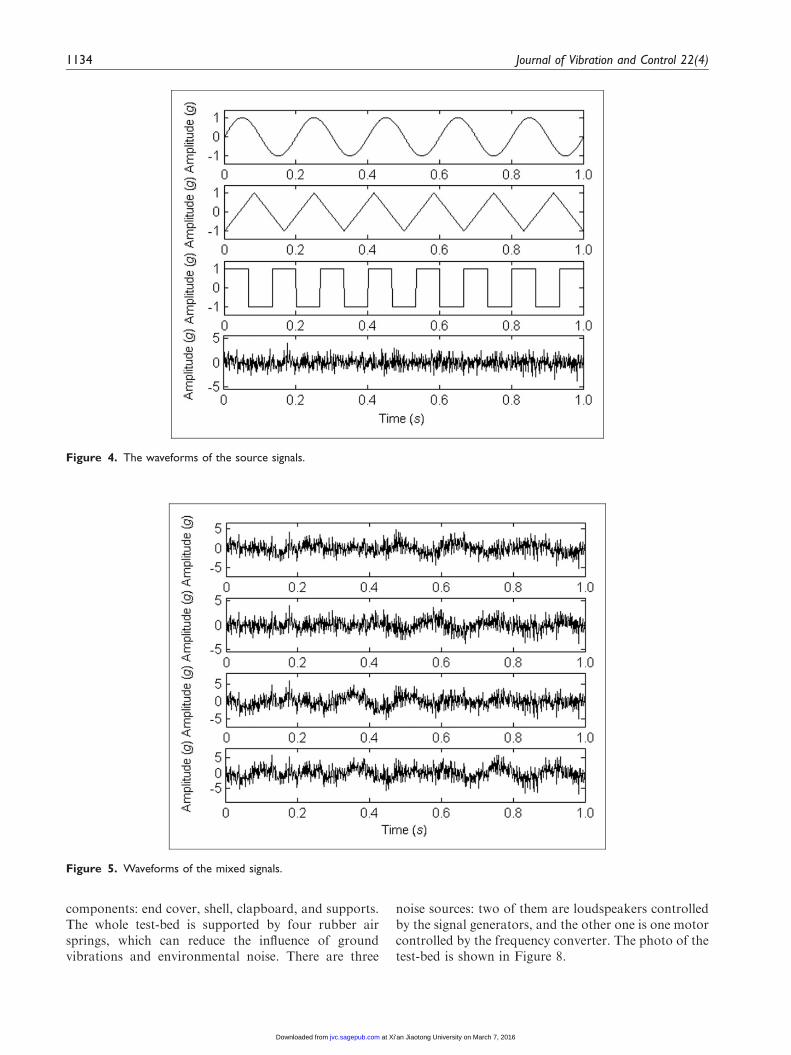
Considering the source signals: a sinusoidal wavesignal s1, a triangle wave signal s2, a square wavesignal s3, and a white noise s4. The first three signalshave similar waveforms, which can cause less statisticalproperties and it can be difficult for an ICA algorithmto obtain an accurate separation. The white noise cansimulate the environmental noises that exist for nearlyevery physical system, including the mechanical system.The waveforms of the source signals are shown
in Figure 4, and the generating function of the sourcesignals are listed as follows:
sðtÞ ¼
s1ðtÞs2ðtÞs3ðtÞs4ðtÞ
2664
3775 ¼
sinð0:1�tÞsawtoothð0:12�t, 0:5Þsquareð0:15�t, 50Þ
nðtÞ
2664
3775 ð12Þ
The mixed signals are composed by the source sig-nals according to a linear composition. The waveformsof the mixed signals are shown in Figure 5, and themixing matrix is shown as the following equation
A ¼
0:75 �0:47 �0:43 1:21�0:34 0:72 0:28 1:03�0:58 �0:93 �0:64 1:32�0:78 0:62 �0:84 1:55
2664
3775, ð13Þ
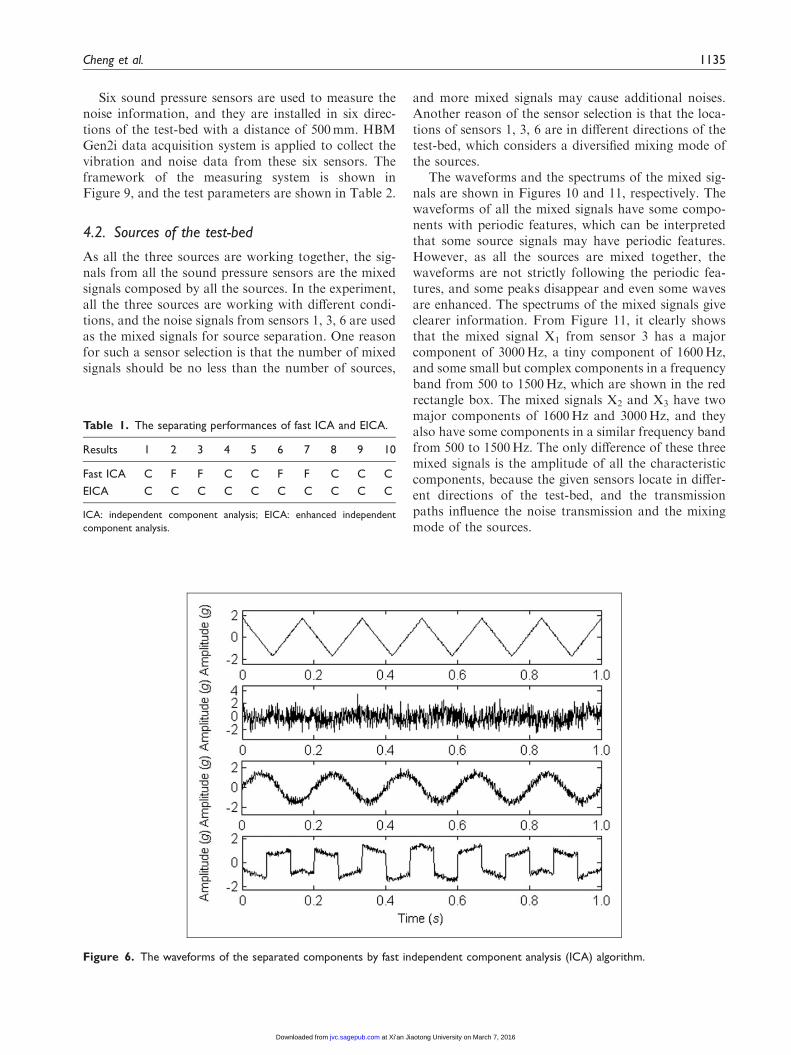
From the waveforms of the mixed signals in Figure5, it is nearly impossible to identify the sources con-tained in the mixed signals due to the complex wave-forms. Based on the mixed signals, the separatingperformances of the fast ICA algorithm and the pro-posed EICA algorithm are comparatively studied. Theseparating performances of these two algorithms arelisted in Table 1. It should be noted that the separationis seen as an effective separation as the correlation coef-ficient between the separated component and the rela-tive source is more than 0.80, and thus is labeled C(Correct) in the Table 1. Otherwise, the result is labeledF (False).
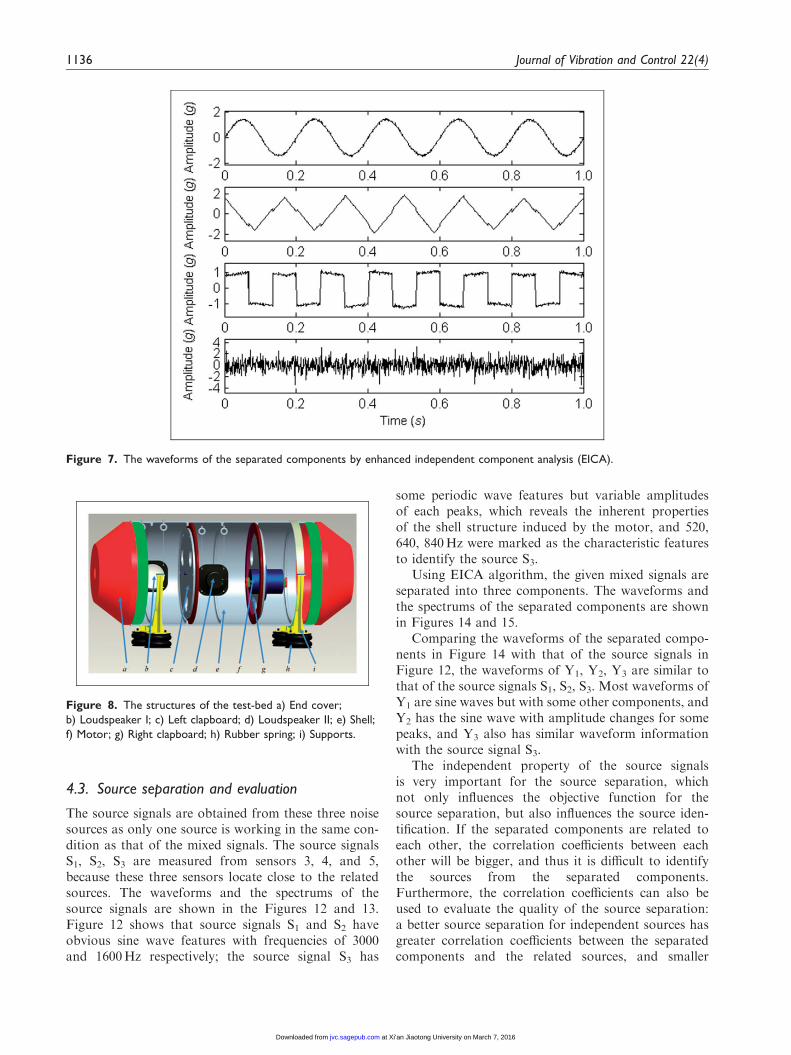
From the separating results shown in Table 1, it isclear that the EICA algorithm separates the sourcesaccurately for all 10 experimental studies, while thefast ICA algorithm obtains an accurate source separ-ation for six out of 10. The waveforms of separatedcomponents with an inaccurate separation by fastICA algorithm are shown in Figure 6, and the wave-forms of separated components by EICA algorithm areshown in Figure 7. Comparing Figures 6 and 7, it canalso be seen that the EICA has more accurate sourceseparation than the fast ICA algorithm for the givensources with similar waveforms.
4. Applications
4.1. Introductions of the test-bed
Aiming at noise source identification and localizationfor underwater vehicles, this study designs a test-bedbased on a shell structure, which is composed of four
Figure 3. Optimal selection step of the enhanced independent
component analysis (EICA).
Cheng et al. 1133
at Xi’an Jiaotong University on March 7, 2016jvc.sagepub.comDownloaded from
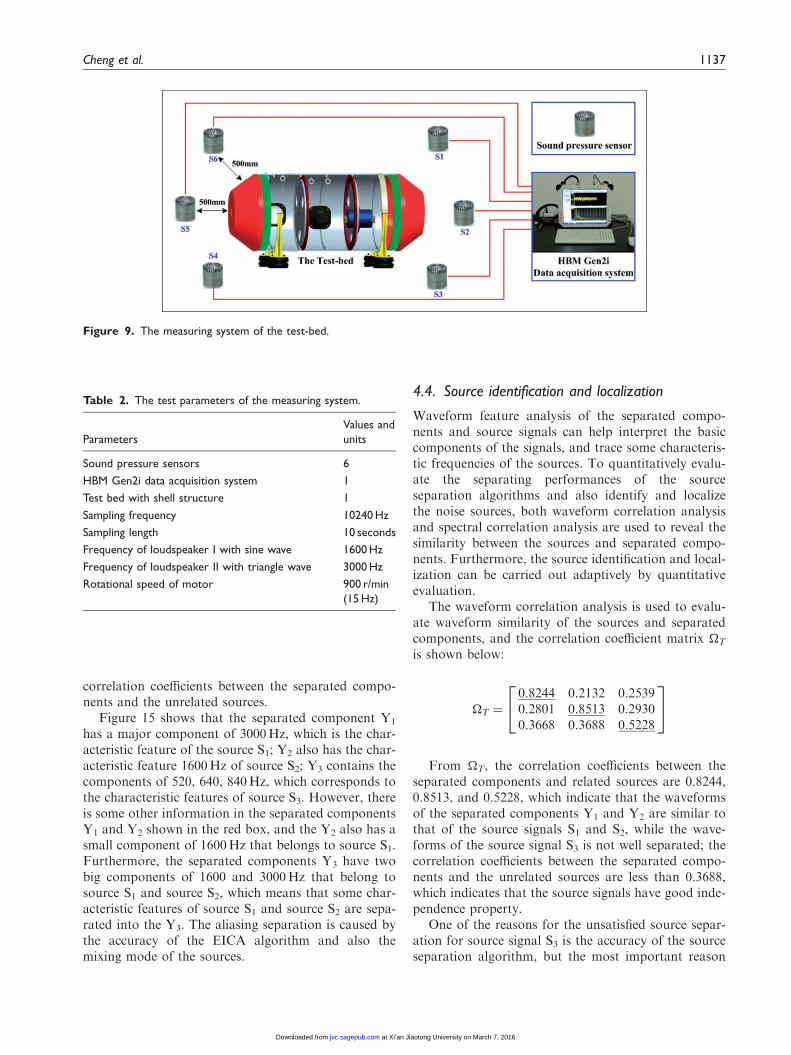
components: end cover, shell, clapboard, and supports.The whole test-bed is supported by four rubber airsprings, which can reduce the influence of groundvibrations and environmental noise. There are three
noise sources: two of them are loudspeakers controlledby the signal generators, and the other one is one motorcontrolled by the frequency converter. The photo of thetest-bed is shown in Figure 8.
Figure 4. The waveforms of the source signals.
Figure 5. Waveforms of the mixed signals.
1134 Journal of Vibration and Control 22(4)
at Xi’an Jiaotong University on March 7, 2016jvc.sagepub.comDownloaded from
Six sound pressure sensors are used to measure thenoise information, and they are installed in six direc-tions of the test-bed with a distance of 500mm. HBMGen2i data acquisition system is applied to collect thevibration and noise data from these six sensors. Theframework of the measuring system is shown inFigure 9, and the test parameters are shown in Table 2.
4.2. Sources of the test-bed
As all the three sources are working together, the sig-nals from all the sound pressure sensors are the mixedsignals composed by all the sources. In the experiment,all the three sources are working with different condi-tions, and the noise signals from sensors 1, 3, 6 are usedas the mixed signals for source separation. One reasonfor such a sensor selection is that the number of mixedsignals should be no less than the number of sources,
and more mixed signals may cause additional noises.Another reason of the sensor selection is that the loca-tions of sensors 1, 3, 6 are in different directions of thetest-bed, which considers a diversified mixing mode ofthe sources.
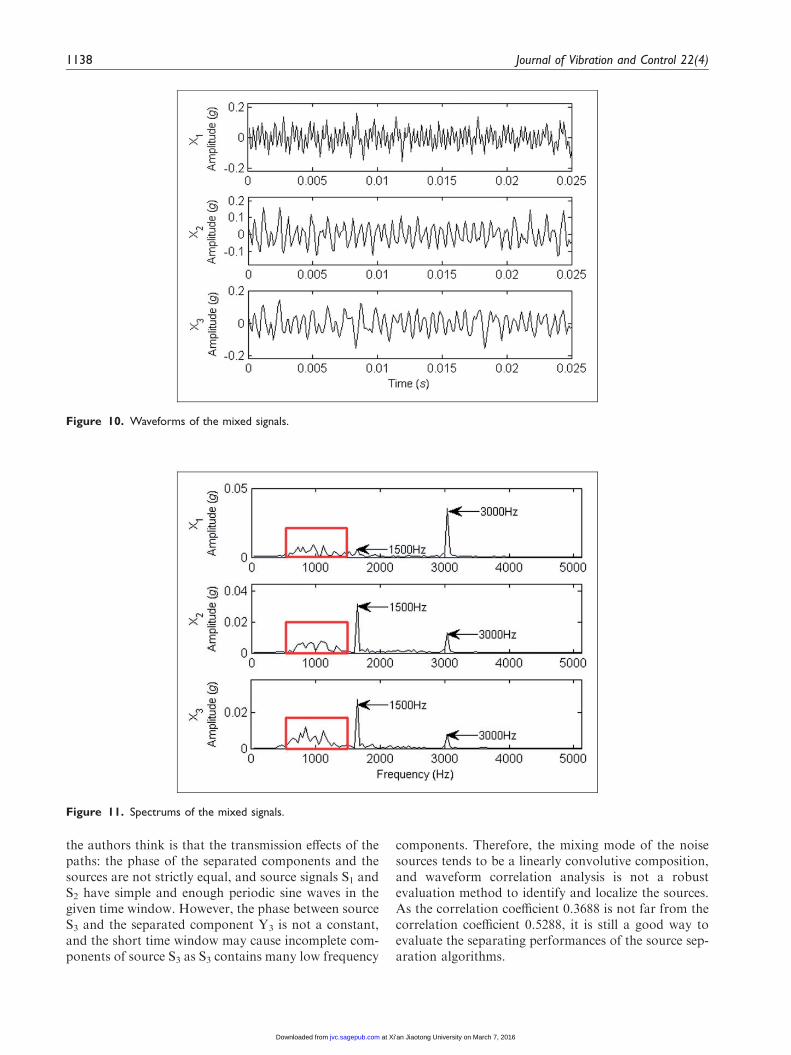
The waveforms and the spectrums of the mixed sig-nals are shown in Figures 10 and 11, respectively. Thewaveforms of all the mixed signals have some compo-nents with periodic features, which can be interpretedthat some source signals may have periodic features.However, as all the sources are mixed together, thewaveforms are not strictly following the periodic fea-tures, and some peaks disappear and even some wavesare enhanced. The spectrums of the mixed signals giveclearer information. From Figure 11, it clearly showsthat the mixed signal X1 from sensor 3 has a majorcomponent of 3000Hz, a tiny component of 1600Hz,and some small but complex components in a frequencyband from 500 to 1500Hz, which are shown in the redrectangle box. The mixed signals X2 and X3 have twomajor components of 1600Hz and 3000Hz, and theyalso have some components in a similar frequency bandfrom 500 to 1500Hz. The only difference of these threemixed signals is the amplitude of all the characteristiccomponents, because the given sensors locate in differ-ent directions of the test-bed, and the transmissionpaths influence the noise transmission and the mixingmode of the sources.
Figure 6. The waveforms of the separated components by fast independent component analysis (ICA) algorithm.
Table 1. The separating performances of fast ICA and EICA.
Results 1 2 3 4 5 6 7 8 9 10
Fast ICA C F F C C F F C C C
EICA C C C C C C C C C C
ICA: independent component analysis; EICA: enhanced independent
component analysis.
Cheng et al. 1135
at Xi’an Jiaotong University on March 7, 2016jvc.sagepub.comDownloaded from
4.3. Source separation and evaluation
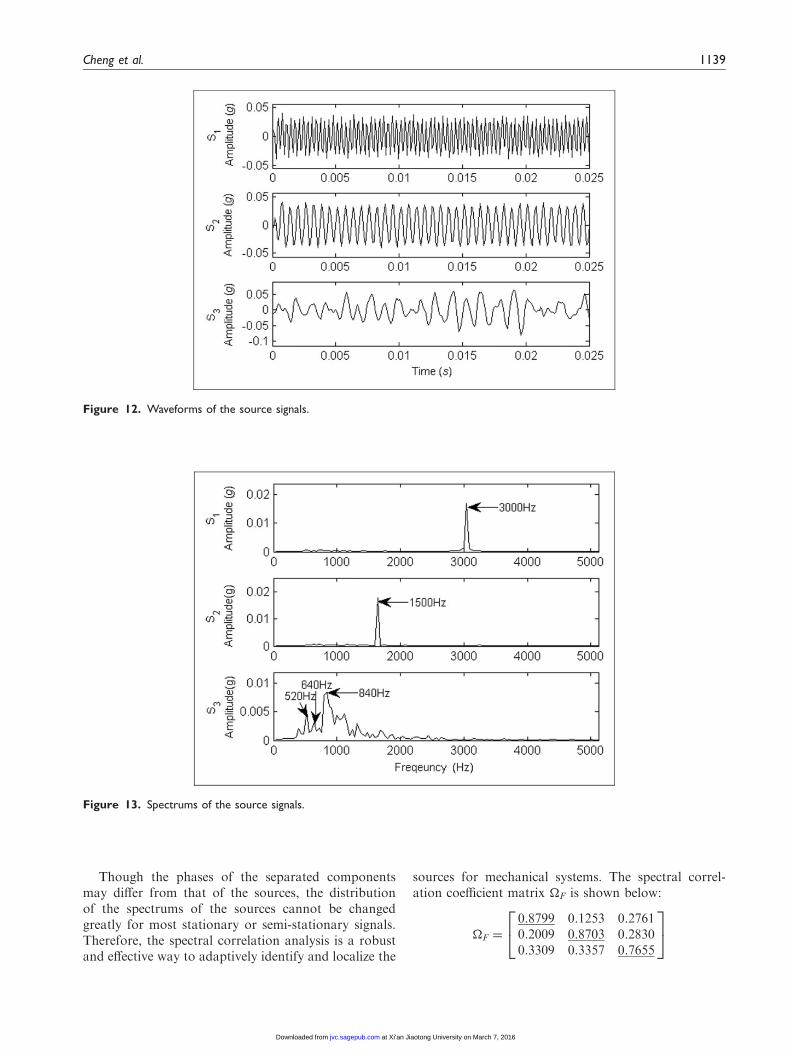
The source signals are obtained from these three noisesources as only one source is working in the same con-dition as that of the mixed signals. The source signalsS1, S2, S3 are measured from sensors 3, 4, and 5,because these three sensors locate close to the relatedsources. The waveforms and the spectrums of thesource signals are shown in the Figures 12 and 13.Figure 12 shows that source signals S1 and S2 haveobvious sine wave features with frequencies of 3000and 1600Hz respectively; the source signal S3 has
some periodic wave features but variable amplitudesof each peaks, which reveals the inherent propertiesof the shell structure induced by the motor, and 520,640, 840Hz were marked as the characteristic featuresto identify the source S3.
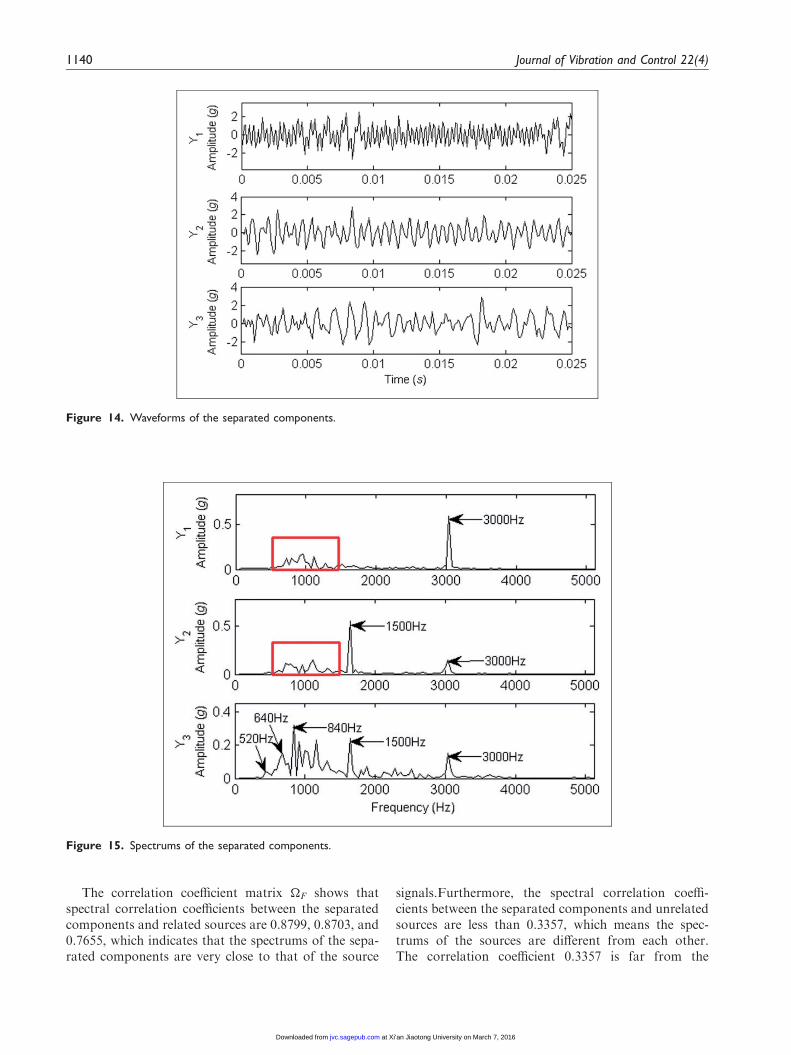
Using EICA algorithm, the given mixed signals areseparated into three components. The waveforms andthe spectrums of the separated components are shownin Figures 14 and 15.
Comparing the waveforms of the separated compo-nents in Figure 14 with that of the source signals inFigure 12, the waveforms of Y1, Y2, Y3 are similar tothat of the source signals S1, S2, S3. Most waveforms ofY1 are sine waves but with some other components, andY2 has the sine wave with amplitude changes for somepeaks, and Y3 also has similar waveform informationwith the source signal S3.
The independent property of the source signalsis very important for the source separation, whichnot only influences the objective function for thesource separation, but also influences the source iden-tification. If the separated components are related toeach other, the correlation coefficients between eachother will be bigger, and thus it is difficult to identifythe sources from the separated components.Furthermore, the correlation coefficients can also beused to evaluate the quality of the source separation:a better source separation for independent sources hasgreater correlation coefficients between the separatedcomponents and the related sources, and smaller
Figure 7. The waveforms of the separated components by enhanced independent component analysis (EICA).
Figure 8. The structures of the test-bed a) End cover;
b) Loudspeaker I; c) Left clapboard; d) Loudspeaker II; e) Shell;
f) Motor; g) Right clapboard; h) Rubber spring; i) Supports.
1136 Journal of Vibration and Control 22(4)
at Xi’an Jiaotong University on March 7, 2016jvc.sagepub.comDownloaded from
correlation coefficients between the separated compo-nents and the unrelated sources.
Figure 15 shows that the separated component Y1
has a major component of 3000Hz, which is the char-acteristic feature of the source S1; Y2 also has the char-acteristic feature 1600Hz of source S2; Y3 contains thecomponents of 520, 640, 840Hz, which corresponds tothe characteristic features of source S3. However, thereis some other information in the separated componentsY1 and Y2 shown in the red box, and the Y2 also has asmall component of 1600Hz that belongs to source S1.Furthermore, the separated components Y3 have twobig components of 1600 and 3000Hz that belong tosource S1 and source S2, which means that some char-acteristic features of source S1 and source S2 are sepa-rated into the Y3. The aliasing separation is caused bythe accuracy of the EICA algorithm and also themixing mode of the sources.
4.4. Source identification and localization
Waveform feature analysis of the separated compo-nents and source signals can help interpret the basiccomponents of the signals, and trace some characteris-tic frequencies of the sources. To quantitatively evalu-ate the separating performances of the sourceseparation algorithms and also identify and localizethe noise sources, both waveform correlation analysisand spectral correlation analysis are used to reveal thesimilarity between the sources and separated compo-nents. Furthermore, the source identification and local-ization can be carried out adaptively by quantitativeevaluation.
The waveform correlation analysis is used to evalu-ate waveform similarity of the sources and separatedcomponents, and the correlation coefficient matrix �T
is shown below:
�T ¼
0:8244 0:2132 0:25390:2801 0:8513 0:29300:3668 0:3688 0:5228
24
35
From �T, the correlation coefficients between theseparated components and related sources are 0.8244,0.8513, and 0.5228, which indicate that the waveformsof the separated components Y1 and Y2 are similar tothat of the source signals S1 and S2, while the wave-forms of the source signal S3 is not well separated; thecorrelation coefficients between the separated compo-nents and the unrelated sources are less than 0.3688,which indicates that the source signals have good inde-pendence property.
One of the reasons for the unsatisfied source separ-ation for source signal S3 is the accuracy of the sourceseparation algorithm, but the most important reason
Figure 9. The measuring system of the test-bed.
Table 2. The test parameters of the measuring system.
Parameters
Values and
units
Sound pressure sensors 6
HBM Gen2i data acquisition system 1
Test bed with shell structure 1
Sampling frequency 10240 Hz
Sampling length 10 seconds
Frequency of loudspeaker I with sine wave 1600 Hz
Frequency of loudspeaker II with triangle wave 3000 Hz
Rotational speed of motor 900 r/min
(15 Hz)
Cheng et al. 1137
at Xi’an Jiaotong University on March 7, 2016jvc.sagepub.comDownloaded from
the authors think is that the transmission effects of thepaths: the phase of the separated components and thesources are not strictly equal, and source signals S1 andS2 have simple and enough periodic sine waves in thegiven time window. However, the phase between sourceS3 and the separated component Y3 is not a constant,and the short time window may cause incomplete com-ponents of source S3 as S3 contains many low frequency
components. Therefore, the mixing mode of the noisesources tends to be a linearly convolutive composition,and waveform correlation analysis is not a robustevaluation method to identify and localize the sources.As the correlation coefficient 0.3688 is not far from thecorrelation coefficient 0.5288, it is still a good way toevaluate the separating performances of the source sep-aration algorithms.
Figure 11. Spectrums of the mixed signals.
Figure 10. Waveforms of the mixed signals.
1138 Journal of Vibration and Control 22(4)
at Xi’an Jiaotong University on March 7, 2016jvc.sagepub.comDownloaded from
Though the phases of the separated componentsmay differ from that of the sources, the distributionof the spectrums of the sources cannot be changedgreatly for most stationary or semi-stationary signals.Therefore, the spectral correlation analysis is a robustand effective way to adaptively identify and localize the
sources for mechanical systems. The spectral correl-ation coefficient matrix �F is shown below:
�F ¼
0:8799 0:1253 0:27610:2009 0:8703 0:28300:3309 0:3357 0:7655
24
35
Figure 13. Spectrums of the source signals.
Figure 12. Waveforms of the source signals.
Cheng et al. 1139
at Xi’an Jiaotong University on March 7, 2016jvc.sagepub.comDownloaded from
The correlation coefficient matrix �F shows thatspectral correlation coefficients between the separatedcomponents and related sources are 0.8799, 0.8703, and0.7655, which indicates that the spectrums of the sepa-rated components are very close to that of the source
signals.Furthermore, the spectral correlation coeffi-cients between the separated components and unrelatedsources are less than 0.3357, which means the spec-trums of the sources are different from each other.The correlation coefficient 0.3357 is far from the
Figure 15. Spectrums of the separated components.
Figure 14. Waveforms of the separated components.
1140 Journal of Vibration and Control 22(4)
at Xi’an Jiaotong University on March 7, 2016jvc.sagepub.comDownloaded from
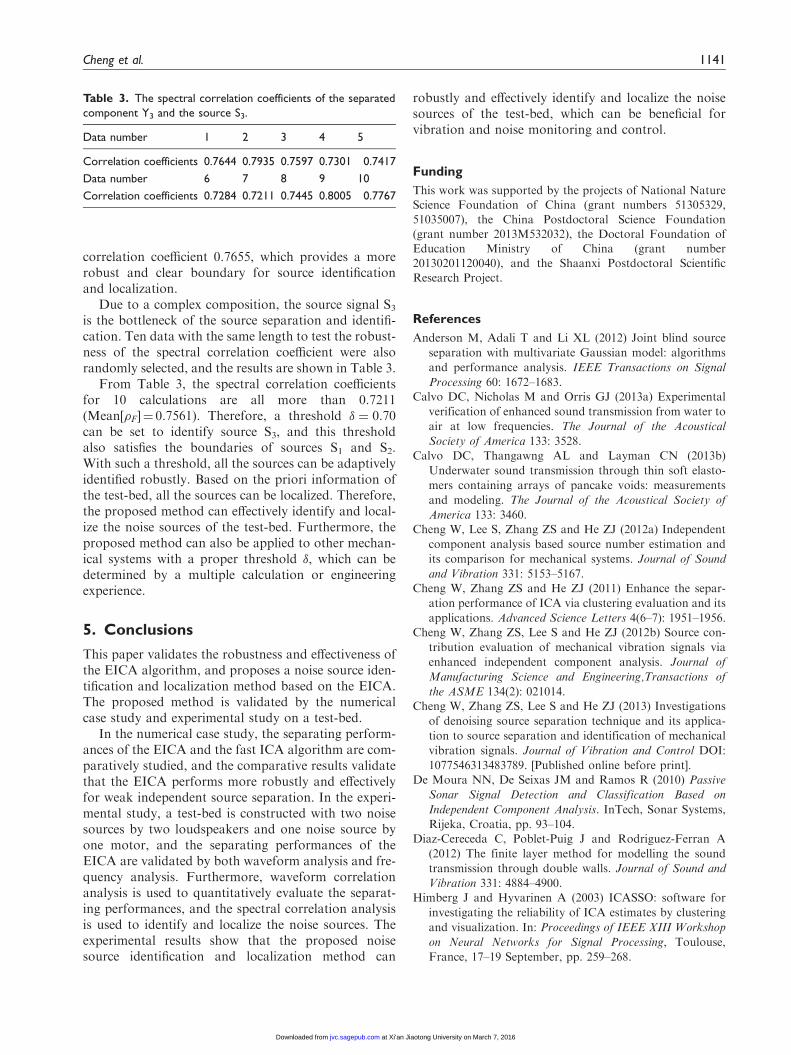
correlation coefficient 0.7655, which provides a morerobust and clear boundary for source identificationand localization.
Due to a complex composition, the source signal S3is the bottleneck of the source separation and identifi-cation. Ten data with the same length to test the robust-ness of the spectral correlation coefficient were alsorandomly selected, and the results are shown in Table 3.
From Table 3, the spectral correlation coefficientsfor 10 calculations are all more than 0.7211(Mean[�F]¼ 0.7561). Therefore, a threshold � ¼ 0:70can be set to identify source S3, and this thresholdalso satisfies the boundaries of sources S1 and S2.With such a threshold, all the sources can be adaptivelyidentified robustly. Based on the priori information ofthe test-bed, all the sources can be localized. Therefore,the proposed method can effectively identify and local-ize the noise sources of the test-bed. Furthermore, theproposed method can also be applied to other mechan-ical systems with a proper threshold �, which can bedetermined by a multiple calculation or engineeringexperience.
5. Conclusions
This paper validates the robustness and effectiveness ofthe EICA algorithm, and proposes a noise source iden-tification and localization method based on the EICA.The proposed method is validated by the numericalcase study and experimental study on a test-bed.
In the numerical case study, the separating perform-ances of the EICA and the fast ICA algorithm are com-paratively studied, and the comparative results validatethat the EICA performs more robustly and effectivelyfor weak independent source separation. In the experi-mental study, a test-bed is constructed with two noisesources by two loudspeakers and one noise source byone motor, and the separating performances of theEICA are validated by both waveform analysis and fre-quency analysis. Furthermore, waveform correlationanalysis is used to quantitatively evaluate the separat-ing performances, and the spectral correlation analysisis used to identify and localize the noise sources. Theexperimental results show that the proposed noisesource identification and localization method can
robustly and effectively identify and localize the noisesources of the test-bed, which can be beneficial forvibration and noise monitoring and control.
Funding
This work was supported by the projects of National NatureScience Foundation of China (grant numbers 51305329,
51035007), the China Postdoctoral Science Foundation(grant number 2013M532032), the Doctoral Foundation ofEducation Ministry of China (grant number
20130201120040), and the Shaanxi Postdoctoral ScientificResearch Project.
References
Anderson M, Adali T and Li XL (2012) Joint blind source
separation with multivariate Gaussian model: algorithms
and performance analysis. IEEE Transactions on Signal
Processing 60: 1672–1683.Calvo DC, Nicholas M and Orris GJ (2013a) Experimental
verification of enhanced sound transmission from water to
air at low frequencies. The Journal of the Acoustical
Society of America 133: 3528.
Calvo DC, Thangawng AL and Layman CN (2013b)
Underwater sound transmission through thin soft elasto-
mers containing arrays of pancake voids: measurements
and modeling. The Journal of the Acoustical Society of
America 133: 3460.Cheng W, Lee S, Zhang ZS and He ZJ (2012a) Independent
component analysis based source number estimation and
its comparison for mechanical systems. Journal of Sound
and Vibration 331: 5153–5167.Cheng W, Zhang ZS and He ZJ (2011) Enhance the separ-
ation performance of ICA via clustering evaluation and its
applications. Advanced Science Letters 4(6–7): 1951–1956.Cheng W, Zhang ZS, Lee S and He ZJ (2012b) Source con-
tribution evaluation of mechanical vibration signals via
enhanced independent component analysis. Journal of
Manufacturing Science and Engineering,Transactions of
the ASME 134(2): 021014.Cheng W, Zhang ZS, Lee S and He ZJ (2013) Investigations
of denoising source separation technique and its applica-
tion to source separation and identification of mechanical
vibration signals. Journal of Vibration and Control DOI:
1077546313483789. [Published online before print].De Moura NN, De Seixas JM and Ramos R (2010) Passive
Sonar Signal Detection and Classification Based on
Independent Component Analysis. InTech, Sonar Systems,
Rijeka, Croatia, pp. 93–104.Diaz-Cereceda C, Poblet-Puig J and Rodriguez-Ferran A
(2012) The finite layer method for modelling the sound
transmission through double walls. Journal of Sound and
Vibration 331: 4884–4900.Himberg J and Hyvarinen A (2003) ICASSO: software for
investigating the reliability of ICA estimates by clustering
and visualization. In: Proceedings of IEEE XIII Workshop
on Neural Networks for Signal Processing, Toulouse,
France, 17–19 September, pp. 259–268.
Table 3. The spectral correlation coefficients of the separated
component Y3 and the source S3.
Data number 1 2 3 4 5
Correlation coefficients 0.7644 0.7935 0.7597 0.7301 0.7417
Data number 6 7 8 9 10
Correlation coefficients 0.7284 0.7211 0.7445 0.8005 0.7767
Cheng et al. 1141
at Xi’an Jiaotong University on March 7, 2016jvc.sagepub.comDownloaded from
Himberg J, Hyvarinen A and Esposito F (2004) Validatingthe independent components of neuroimaging time seriesvia clustering and visualization. NeuroImage 22:
1214–1222.Huang CZ and Nutt S (2011) An analytical study of sound
transmission through unbounded panels of functionallygraded materials. Journal of Sound and Vibration 330:
1153–1165.Hyvarinen A (1999) Fast and robust fixed point algorithms
for independent component analysis. IEEE Transactions
on Neural Networks 10: 626–634.Hyvarinen A and Oja E (1997) A fast fixed-point algorithm
for independent component analysis. Neural Computation
9: 1483–1492.Hyvarinen A and Oja E (2000) Independent component ana-
lysis: algorithms and applications. Neural Networks 13:
411–430.Hyvarinen A, Karhunen J and Oja E (2001) Independent
Component Analysis. New York: John Wiley and Sons.Levin DN (2010) Performing nonlinear blind source separ-
ation with signal invariants. IEEE Transactions on SignalProcessing 58: 2131–2140.
Li XL and Adali T (2010) Independent component analysis
by entropy bound minimization. IEEE Transactions onSignal Processing 58: 5151–5164.
Loesch B and Yang B (2013) Cramer-Rao bound for circular
and noncircular complex independent component analysis.IEEE Transactions on Signal Processing 61: 365–379.
Lombard A, Zheng YH, Buchner H and Kellermann W(2011) TDOA estimation for multiple sound sources in
noisy and reverberant environments using broadbandindependent component analysis. IEEE Transactions onAudio Speech and Language Processing 19: 1490–1503.
Nafta A, Johannisson P and Shtaif M (2013) Blind equaliza-
tion in optical communications using independent compo-
nent analysis. Journal of Lightwave Technology 31:
2043–2049.Nguyen H and Zheng R (2011) Binary independent compo-
nent analysis with OR mixtures. IEEE Transactions on
Signal Processing 59: 3168–3181.
Sgard FC, Atalla N, Gholami M and Nelisse H (2013)
Tunneling effect on the sound transmission loss of a flat
structure coupled with a porous material. The Journal of
the Acoustical Society of America 133: 3241.Shimizu T, Toyoda M, Takahashi D and Kawai Y (2013)
Numerical analysis of the influence of acoustic resonance
in air cavities between windowpanes on sound transmis-
sion loss. Applied Acoustics 74: 1010–1017.
Tichavsky P and Koldovsky Z (2011) Weight adjusted tensor
method for blind separation of underdetermined mixtures
of nonstationary sources. IEEE Transactions on Signal
Processing 59: 1037–1047.Wang HX (2010) Temporally local maximum signal
fraction analysis for artifact removal from biomedical sig-
nals. IEEE Transactions on Signal Processing 58:
4919–4925.Xiong W, Li HL, Adali T, Li Yo and Calhoun VD (2010) On
entropy rate for the complex domain and its application to
I.I.D sampling. IEEE Transactions on Signal Processing
58: 2409–2414.
Yu G and Kok Kiong T (2010) High efficient crossing-order
decoupling in Vold-Kalman filtering order tracking based
on independent component analysis. Mechanical Systems
and Signal Processing 24: 1756–1766.
1142 Journal of Vibration and Control 22(4)
at Xi’an Jiaotong University on March 7, 2016jvc.sagepub.comDownloaded from