Embed Size (px)
Citation preview
Noise Suppression of Underexpanded Sonic Jet by Finite Tube
Attachment
By Mohammed K. IBRAHIM1,2), Nobuhiro MIYA3), Takaaki YUMITORI3), and Yoshiaki NAKAMURA4)
1) Associate Professor, Aerospace Engineering Department, Collage of Engineering Sciences, King Fahd University of Petroleumand Minerals (KFUPM) B.O. BOX 398, Dhahran 31261, Kingdom of Saudi Arabia.
2) Associate Professor, Aerospace Engineering Department, Faculty of Engineering, University of Cairo, Giza 12613, Egypt.
3) Graduate student. Aerospace Engineering Department, Graduate School of Engineering, Nagoya University, Furo-cho,Chikusa-ku, Nagoya 464-8603, Japan.
4) Professor, Aerospace Engineering Department, Graduate School of Engineering, Nagoya University, Furo-cho, Chikusa-ku,Nagoya 464-8603, Japan.
Abstract
In the present study, experiments were conducted to investigate the interaction of a tube attached to the exitof the nozzle producing-underexapned sonic jet on both the flowfield and acoustic field. The effect of varyingthe tube length, L, and diameter, D, were investigated. The most pronounced noise reduction was observedat D/Dj = 2.2 at jet Nozzle Pressure Ratio (NPR) of 5 where the noise emission is reduced by approximately30 dB compared with the baseline jet. Considerable Sound Pressure Level (SPL) reduction over the measuredfrequency range is observed and the screech tone was completely suppressed. The schlieren photographs revealedthat the shock-cell structure of the baseline jet is disappear at D/Dj = 1.9 as well as for higher values of D/Dj
outside the tube. Detailed experimental and numerical investigations were carried out to explain the reductionin the radiated noise at D/Dj = 2.2. From these results, it was made clear that the Mach disk for the case ofD/Dj = 2.2 extend up to the tube inner surface and the entire flowfield downstream of the Mach disk becomessubsonic. This was not observed for other cases of D/Dj where the time average flowfield is characterized bya repeated shock-cell structure inside or outside the tube. The effect of varying the jet Nozzle Pressure Ratio(NPR), tube clearance and tube wall porosity on noise emission, flowfield and the associated thrust loss arereported.
Key Words: Under-expanded sonic jet, Noise suppression, Perforated tube, Screech tone
Nomenclature
γ : specific heat ratioψ : the polar angle of the microphone with
respect to jet axisDAQ : Data AcquisitionFFT : Fast Fourier TransformGPIB : General Purpose Interface BusMUSCL : Monotonic Upwind Scheme for Conserva-
tion LawNPR : Nozzle Pressure Ratio, Pt/p∞OASPL : Overall Sound Pressure LevelPIV : Particle Image VelocimetrySPL : Sound Pressure LevelSST : Super-Sonic Transport aircraftTCC : Transparent Collimating CylinderD : tube diameterDj : jet or nozzle diameterfs : screech frequencyL : tube lengthM : Mach number
Mj : fully-expanded Mach numberp∞ : ambient pressurePt : pressure inside the plenum chamberR : jet radiusSTOV L : Short Take-Off and Vertical LandingU(r) : jet exit velocity profileUexit : jet exit velocityX,Y, Z : Cartesian coordinates
1 Introduction
With the interest in the design of more viable Super-Sonic Transport aircraft (SST), the topic of super-sonic jet noise has received much attention in recentyears. Improved methods of jet noise suppressionneed to be developed in order to reduce the noiseradiated from the propulsion system to acceptablelevels. In the underexpanded jet, shock-cell structureis formed outside the nozzle. The passage of the flow
1
fluctuations through such shock-cell structure resultsin the generation of shock associated broadband noiseand a feedback-induced screech noise. The screech isa loud discrete tone emitted by a supersonic jet whenoperated under off-design conditions. The noise isproduced by periodical, coherent turbulent jet struc-ture, which propagate upstream through a system ofshocks and expansions formed by the jet flow, andimplant new disturbances into the shear layer nearthe nozzle lip. These disturbances travel downstreamand grow, producing a jet instability mode. Repeti-tion of this process results in a feedback loop, leadingto the screech tone1. Understanding the screech andits effect on nearby structures is important, for exam-ple, for the design of advanced aircraft, because thescreech can cause sonic fatigue failure2. In aeronau-tics and space sciences there are many applicationswhich involve the impingement of an under-expandedjet on a solid boundary or object, such as multistagerocket separation, deep-space docking, space-modulealtitude-control thruster operation, lunar and plan-etary landing and take-off, jet engine exhaust im-pingement of STOVL (Short Take-Off and VerticalLanding) aircraft, gas-turbine blade failure, and gun-muzzle blast impingement3.
Lamont and Hunt3 extensively studied the flowfield for single jet impingement on a flat plate at dif-ferent angles examining the mean pressure on the flatplate surface, as well as via shadowgraph visualiza-tions. However, noise emission was not treated intheir study. Ahuja et al.4 and Kibens et al.5 ex-perimentally examined noise and instability waves insupersonic round jets in the proximity of a flat plateas well as a cylindrical wall. They clarified the ef-fect of varying jet-plate separation distance on noisespectra using single point SPL measurements. Seinerand Manning6 studied the problem of jet-plate inter-action for a rectangular jet.
The recent research by Alvi et al.7 deals with theflow field and noise characteristics of supersonic jetimpingement on a perpendicular flat plate in STOVLapplications. They used more advanced measurementtechniques such as PIV (Particle Image Velocimetry).Lift loss due to the jet interaction is also reported intheir study.Ibrahim et al.8 investigated experimentally the in-
teraction of an underexpanded sonic jet with a flatplate, which was placed parallel to the jet axis. It isfound that screech tone vanishes when the flat platecomes close to the jet axis. However, there is anazimuthal directivity in its propagation, which de-pends on jet-plate separation distance. In addition,the highly oscillating baseline jet flow is suppressedby the jet-plate interaction, and screech tone com-pletely disappears when the jet-plate separation dis-tance becomes less than 0.61 of the jet diameter.
Khan et al.9, investigated the acoustic performanceof perforated tube attached to the underexpandedsonic jet nozzle. The diameter of the investigatedperforated tube was equal to the nozzle exit diame-ter. Their investigations showed that the shock-cellstructure of the underexpanded jet was vanished andthe screech tone was suppressed. The effect of NozzlePressure Ratio (NPR) on the noise emission and thethrust loss were reported in their study.
In the present study, experiments were conductedto investigate the effect of using a tube attached tothe exit of the nozzle on both the flowfield and acous-tic field of the underexapned sonic jet. The effectof varying the tube length, L, and diameter, D, thejet Nozzle Pressure Ratio (NPR), tube clearance andtube wall porosity on noise emission, flowfield and theassociated thrust loss are reported.
2 Experimental Setup
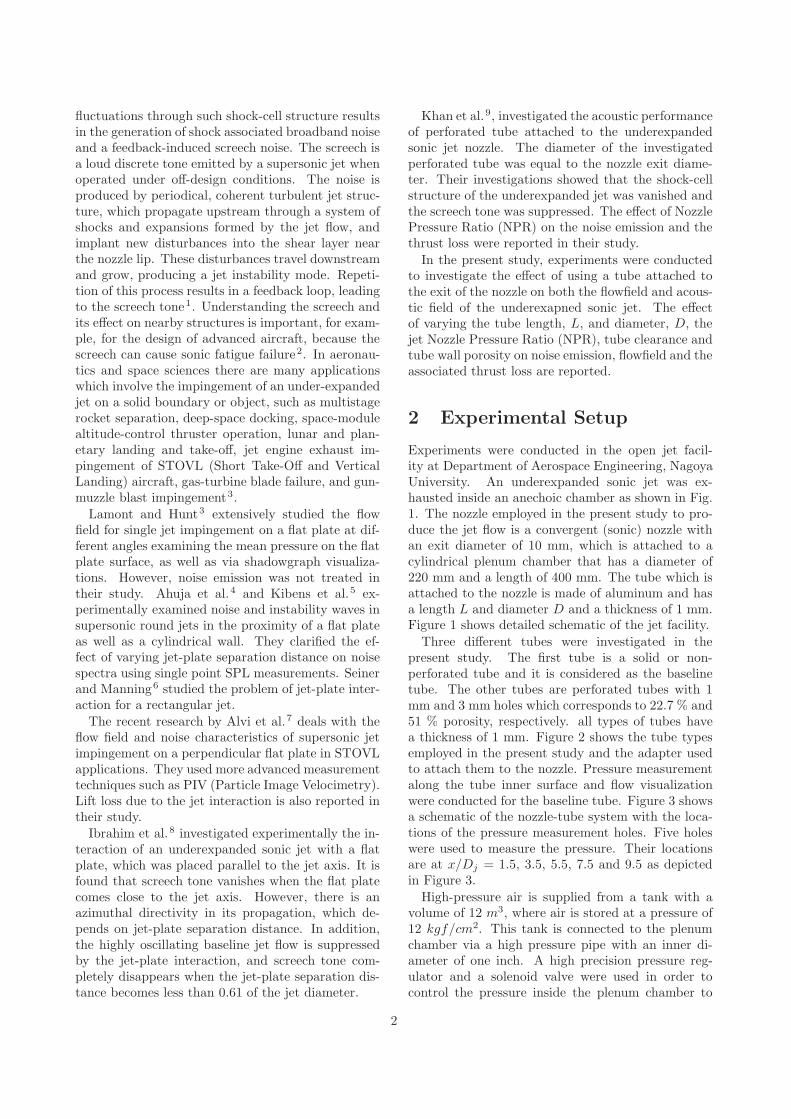
Experiments were conducted in the open jet facil-ity at Department of Aerospace Engineering, NagoyaUniversity. An underexpanded sonic jet was ex-hausted inside an anechoic chamber as shown in Fig.1. The nozzle employed in the present study to pro-duce the jet flow is a convergent (sonic) nozzle withan exit diameter of 10 mm, which is attached to acylindrical plenum chamber that has a diameter of220 mm and a length of 400 mm. The tube which isattached to the nozzle is made of aluminum and hasa length L and diameter D and a thickness of 1 mm.Figure 1 shows detailed schematic of the jet facility.
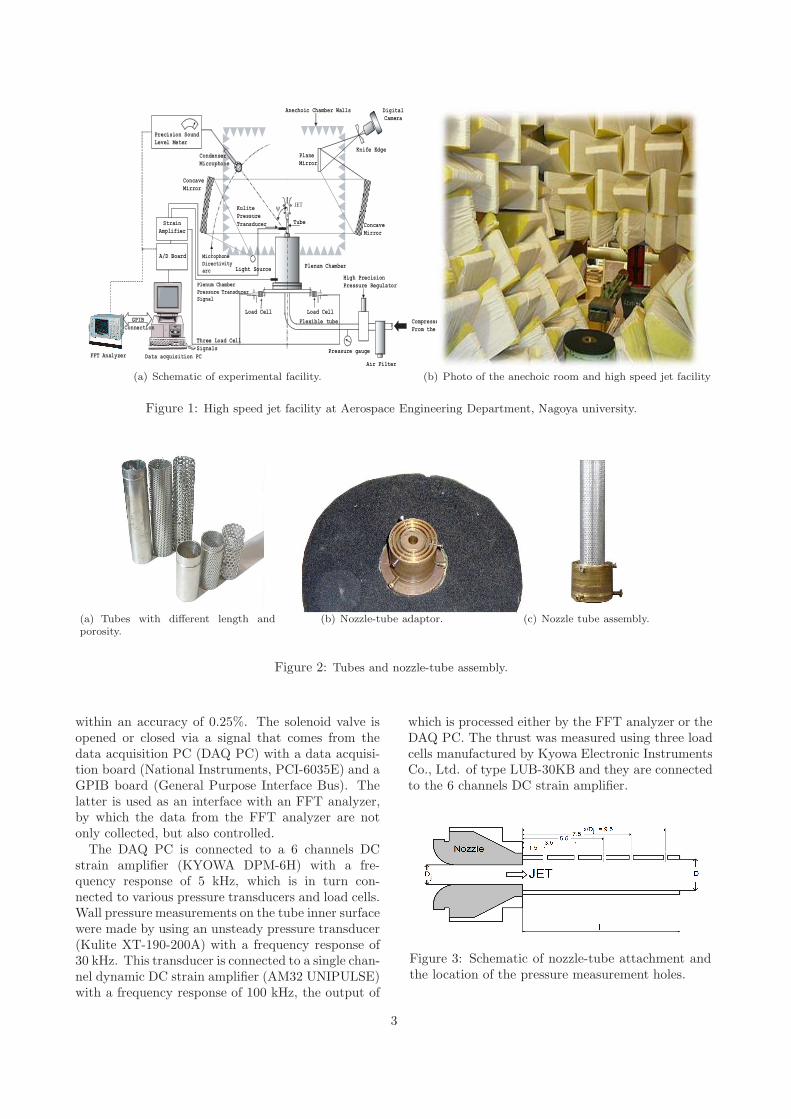
Three different tubes were investigated in thepresent study. The first tube is a solid or non-perforated tube and it is considered as the baselinetube. The other tubes are perforated tubes with 1mm and 3 mm holes which corresponds to 22.7 % and51 % porosity, respectively. all types of tubes havea thickness of 1 mm. Figure 2 shows the tube typesemployed in the present study and the adapter usedto attach them to the nozzle. Pressure measurementalong the tube inner surface and flow visualizationwere conducted for the baseline tube. Figure 3 showsa schematic of the nozzle-tube system with the loca-tions of the pressure measurement holes. Five holeswere used to measure the pressure. Their locationsare at x/Dj = 1.5, 3.5, 5.5, 7.5 and 9.5 as depictedin Figure 3.
High-pressure air is supplied from a tank with avolume of 12 m3, where air is stored at a pressure of12 kgf/cm2. This tank is connected to the plenumchamber via a high pressure pipe with an inner di-ameter of one inch. A high precision pressure reg-ulator and a solenoid valve were used in order tocontrol the pressure inside the plenum chamber to
2
JET
Plenum Chamber
A/D Board
Strain
Amplifier
Data acquisition PC
Digital
Camera
Knife Edge
Light Source
Condenser
Microphone
Plane
Mirror
Concave
Mirror
Concave
Mirror
Plenum Chamber
Pressure Transducer Signal
Precision Sound
Level Meter
ψ
Load Cell Load Cell
Three Load Cell
Signals
GPIB
Connection
FFT Analyzer
Anechoic Chamber Walls
High Precision
Pressure Regulator
Air Filter
Flexible tube
Pressure gauge
Compressed Air
From the Main Tank
Tube
Kulite
Pressure
Transducer
(a) Schematic of experimental facility. (b) Photo of the anechoic room and high speed jet facility
Figure 1: High speed jet facility at Aerospace Engineering Department, Nagoya university.
(a) Tubes with different length andporosity.
(b) Nozzle-tube adaptor. (c) Nozzle tube assembly.
Figure 2: Tubes and nozzle-tube assembly.
within an accuracy of 0.25%. The solenoid valve isopened or closed via a signal that comes from thedata acquisition PC (DAQ PC) with a data acquisi-tion board (National Instruments, PCI-6035E) and aGPIB board (General Purpose Interface Bus). Thelatter is used as an interface with an FFT analyzer,by which the data from the FFT analyzer are notonly collected, but also controlled.The DAQ PC is connected to a 6 channels DC
strain amplifier (KYOWA DPM-6H) with a fre-quency response of 5 kHz, which is in turn con-nected to various pressure transducers and load cells.Wall pressure measurements on the tube inner surfacewere made by using an unsteady pressure transducer(Kulite XT-190-200A) with a frequency response of30 kHz. This transducer is connected to a single chan-nel dynamic DC strain amplifier (AM32 UNIPULSE)with a frequency response of 100 kHz, the output of
which is processed either by the FFT analyzer or theDAQ PC. The thrust was measured using three loadcells manufactured by Kyowa Electronic InstrumentsCo., Ltd. of type LUB-30KB and they are connectedto the 6 channels DC strain amplifier.
Figure 3: Schematic of nozzle-tube attachment andthe location of the pressure measurement holes.
3
A microphone (RION UC-29 1/4 inch condensermicrophone) was employed for sound pressure level(SPL) measurements, which has a maximum resolu-tion frequency of 100 kHz and a maximum SPL of 164dB. This microphone can be traversed along an arcthat is placed at a distance of 80 Dj from the nozzleexit, where Dj is the diameter of the nozzle exit. Theangle from the jet axis, ψ, which is referred to as thepolar angle, can be varied from 15o to 110o, wherethe former corresponds to the downstream direction,and the latter the upstream one. This microphoneis connected to both the two channel multi-purposeFFT analyzer (ONO-SOKKI CF-5210) for SPL spec-tra and the DAQ PC via RS 232C serial port foroverall SPL (OASPL) measurements.The flow outside the tube was also visualized by
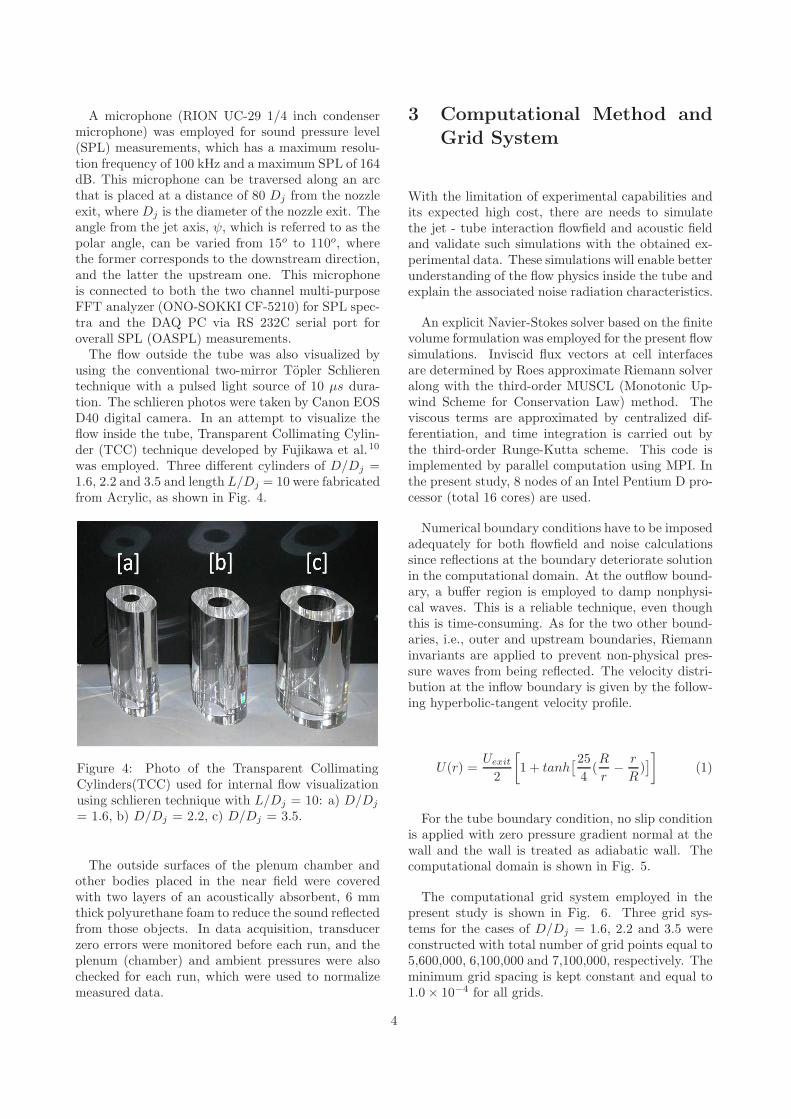
using the conventional two-mirror Topler Schlierentechnique with a pulsed light source of 10 µs dura-tion. The schlieren photos were taken by Canon EOSD40 digital camera. In an attempt to visualize theflow inside the tube, Transparent Collimating Cylin-der (TCC) technique developed by Fujikawa et al.10
was employed. Three different cylinders of D/Dj =1.6, 2.2 and 3.5 and length L/Dj = 10 were fabricatedfrom Acrylic, as shown in Fig. 4.
Figure 4: Photo of the Transparent CollimatingCylinders(TCC) used for internal flow visualizationusing schlieren technique with L/Dj = 10: a) D/Dj
= 1.6, b) D/Dj = 2.2, c) D/Dj = 3.5.
The outside surfaces of the plenum chamber andother bodies placed in the near field were coveredwith two layers of an acoustically absorbent, 6 mmthick polyurethane foam to reduce the sound reflectedfrom those objects. In data acquisition, transducerzero errors were monitored before each run, and theplenum (chamber) and ambient pressures were alsochecked for each run, which were used to normalizemeasured data.
3 Computational Method and
Grid System
With the limitation of experimental capabilities andits expected high cost, there are needs to simulatethe jet - tube interaction flowfield and acoustic fieldand validate such simulations with the obtained ex-perimental data. These simulations will enable betterunderstanding of the flow physics inside the tube andexplain the associated noise radiation characteristics.
An explicit Navier-Stokes solver based on the finitevolume formulation was employed for the present flowsimulations. Inviscid flux vectors at cell interfacesare determined by Roes approximate Riemann solveralong with the third-order MUSCL (Monotonic Up-wind Scheme for Conservation Law) method. Theviscous terms are approximated by centralized dif-ferentiation, and time integration is carried out bythe third-order Runge-Kutta scheme. This code isimplemented by parallel computation using MPI. Inthe present study, 8 nodes of an Intel Pentium D pro-cessor (total 16 cores) are used.
Numerical boundary conditions have to be imposedadequately for both flowfield and noise calculationssince reflections at the boundary deteriorate solutionin the computational domain. At the outflow bound-ary, a buffer region is employed to damp nonphysi-cal waves. This is a reliable technique, even thoughthis is time-consuming. As for the two other bound-aries, i.e., outer and upstream boundaries, Riemanninvariants are applied to prevent non-physical pres-sure waves from being reflected. The velocity distri-bution at the inflow boundary is given by the follow-ing hyperbolic-tangent velocity profile.
U(r) =Uexit
2
[
1 + tanh[25
4(R
r−r
R)]
]
(1)
For the tube boundary condition, no slip conditionis applied with zero pressure gradient normal at thewall and the wall is treated as adiabatic wall. Thecomputational domain is shown in Fig. 5.
The computational grid system employed in thepresent study is shown in Fig. 6. Three grid sys-tems for the cases of D/Dj = 1.6, 2.2 and 3.5 wereconstructed with total number of grid points equal to5,600,000, 6,100,000 and 7,100,000, respectively. Theminimum grid spacing is kept constant and equal to1.0× 10−4 for all grids.
4
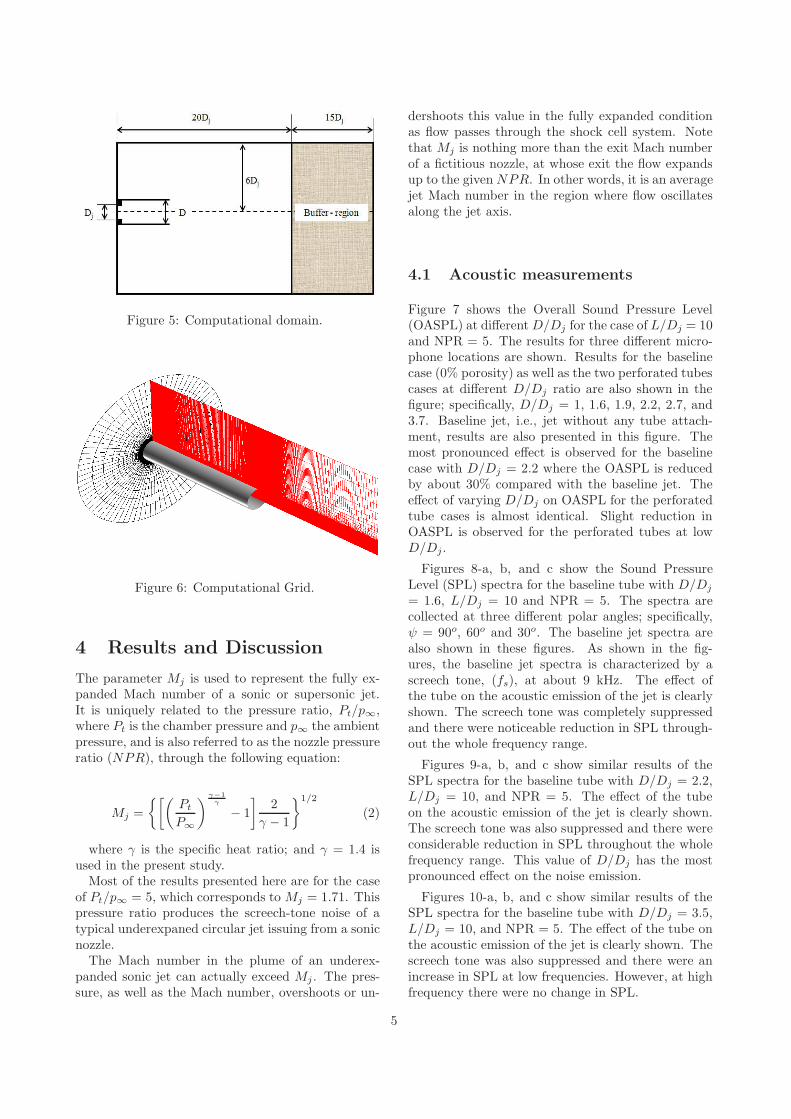
Figure 5: Computational domain.
Figure 6: Computational Grid.
4 Results and Discussion
The parameter Mj is used to represent the fully ex-panded Mach number of a sonic or supersonic jet.It is uniquely related to the pressure ratio, Pt/p∞,where Pt is the chamber pressure and p∞ the ambientpressure, and is also referred to as the nozzle pressureratio (NPR), through the following equation:
Mj =
{[(
Pt
P∞
)
γ−1
γ
− 1
]
2
γ − 1
}1/2
(2)
where γ is the specific heat ratio; and γ = 1.4 isused in the present study.Most of the results presented here are for the case
of Pt/p∞ = 5, which corresponds to Mj = 1.71. Thispressure ratio produces the screech-tone noise of atypical underexpaned circular jet issuing from a sonicnozzle.The Mach number in the plume of an underex-
panded sonic jet can actually exceed Mj . The pres-sure, as well as the Mach number, overshoots or un-
dershoots this value in the fully expanded conditionas flow passes through the shock cell system. Notethat Mj is nothing more than the exit Mach numberof a fictitious nozzle, at whose exit the flow expandsup to the givenNPR. In other words, it is an averagejet Mach number in the region where flow oscillatesalong the jet axis.
4.1 Acoustic measurements
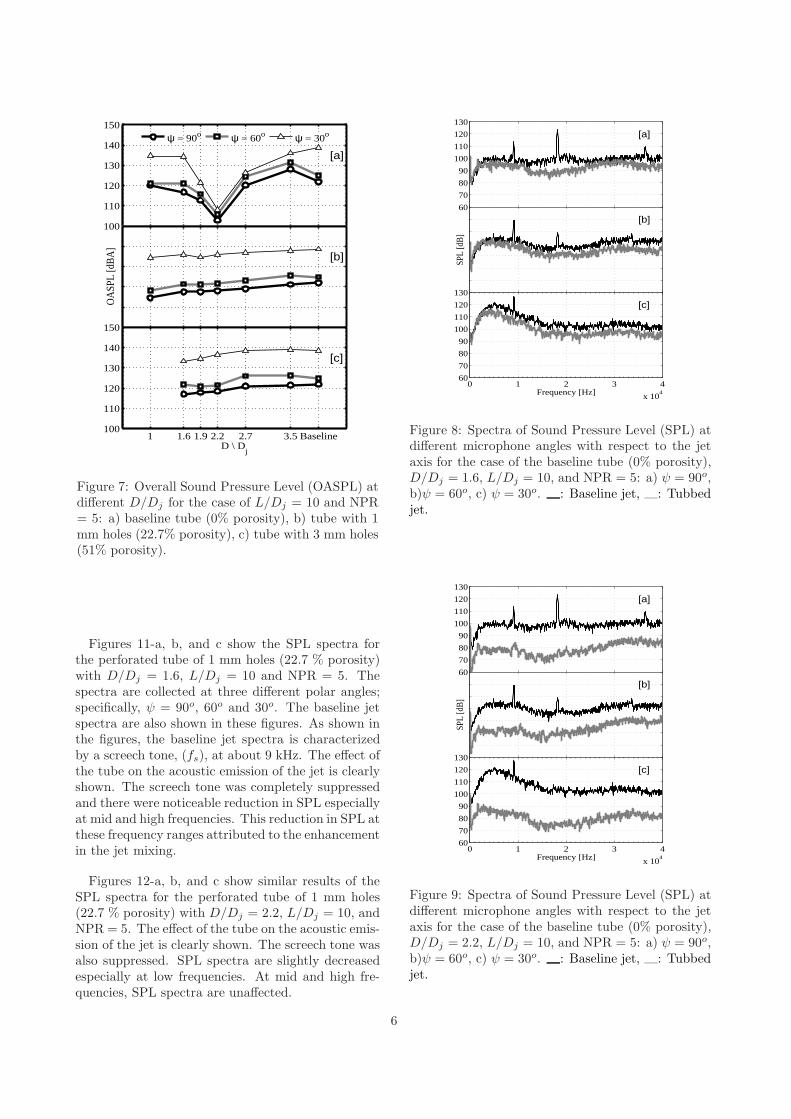
Figure 7 shows the Overall Sound Pressure Level(OASPL) at differentD/Dj for the case of L/Dj = 10and NPR = 5. The results for three different micro-phone locations are shown. Results for the baselinecase (0% porosity) as well as the two perforated tubescases at different D/Dj ratio are also shown in thefigure; specifically, D/Dj = 1, 1.6, 1.9, 2.2, 2.7, and3.7. Baseline jet, i.e., jet without any tube attach-ment, results are also presented in this figure. Themost pronounced effect is observed for the baselinecase with D/Dj = 2.2 where the OASPL is reducedby about 30% compared with the baseline jet. Theeffect of varying D/Dj on OASPL for the perforatedtube cases is almost identical. Slight reduction inOASPL is observed for the perforated tubes at lowD/Dj.
Figures 8-a, b, and c show the Sound PressureLevel (SPL) spectra for the baseline tube with D/Dj
= 1.6, L/Dj = 10 and NPR = 5. The spectra arecollected at three different polar angles; specifically,ψ = 90o, 60o and 30o. The baseline jet spectra arealso shown in these figures. As shown in the fig-ures, the baseline jet spectra is characterized by ascreech tone, (fs), at about 9 kHz. The effect ofthe tube on the acoustic emission of the jet is clearlyshown. The screech tone was completely suppressedand there were noticeable reduction in SPL through-out the whole frequency range.
Figures 9-a, b, and c show similar results of theSPL spectra for the baseline tube with D/Dj = 2.2,L/Dj = 10, and NPR = 5. The effect of the tubeon the acoustic emission of the jet is clearly shown.The screech tone was also suppressed and there wereconsiderable reduction in SPL throughout the wholefrequency range. This value of D/Dj has the mostpronounced effect on the noise emission.
Figures 10-a, b, and c show similar results of theSPL spectra for the baseline tube with D/Dj = 3.5,L/Dj = 10, and NPR = 5. The effect of the tube onthe acoustic emission of the jet is clearly shown. Thescreech tone was also suppressed and there were anincrease in SPL at low frequencies. However, at highfrequency there were no change in SPL.
5
100
110
120
130
140
150
[a]
OA
SPL
[dB
A]
[b]
1 1.6 1.9 2.2 2.7 3.5 Baseline100
110
120
130
140
150
D \ Dj
[c]
ψ = 90o ψ = 60o ψ = 30o
Figure 7: Overall Sound Pressure Level (OASPL) atdifferent D/Dj for the case of L/Dj = 10 and NPR= 5: a) baseline tube (0% porosity), b) tube with 1mm holes (22.7% porosity), c) tube with 3 mm holes(51% porosity).
Figures 11-a, b, and c show the SPL spectra forthe perforated tube of 1 mm holes (22.7 % porosity)with D/Dj = 1.6, L/Dj = 10 and NPR = 5. Thespectra are collected at three different polar angles;specifically, ψ = 90o, 60o and 30o. The baseline jetspectra are also shown in these figures. As shown inthe figures, the baseline jet spectra is characterizedby a screech tone, (fs), at about 9 kHz. The effect ofthe tube on the acoustic emission of the jet is clearlyshown. The screech tone was completely suppressedand there were noticeable reduction in SPL especiallyat mid and high frequencies. This reduction in SPL atthese frequency ranges attributed to the enhancementin the jet mixing.
Figures 12-a, b, and c show similar results of theSPL spectra for the perforated tube of 1 mm holes(22.7 % porosity) with D/Dj = 2.2, L/Dj = 10, andNPR = 5. The effect of the tube on the acoustic emis-sion of the jet is clearly shown. The screech tone wasalso suppressed. SPL spectra are slightly decreasedespecially at low frequencies. At mid and high fre-quencies, SPL spectra are unaffected.
60
70
80
90
100
110
120
130
[a]
SPL
[dB
]
[b]
0 1 2 3 4
x 104
60
70
80
90
100
110
120
130
Frequency [Hz]
[c]
Figure 8: Spectra of Sound Pressure Level (SPL) atdifferent microphone angles with respect to the jetaxis for the case of the baseline tube (0% porosity),D/Dj = 1.6, L/Dj = 10, and NPR = 5: a) ψ = 90o,b)ψ = 60o, c) ψ = 30o. : Baseline jet, : Tubbedjet.
60
70
80
90
100
110
120
130
[a]
SPL
[dB
]
[b]
0 1 2 3 4
x 104
60
70
80
90
100
110
120
130
Frequency [Hz]
[c]
Figure 9: Spectra of Sound Pressure Level (SPL) atdifferent microphone angles with respect to the jetaxis for the case of the baseline tube (0% porosity),D/Dj = 2.2, L/Dj = 10, and NPR = 5: a) ψ = 90o,b)ψ = 60o, c) ψ = 30o. : Baseline jet, : Tubbedjet.
6
60
70
80
90
100
110
120
130
[a]SP
L [d
B]
[b]
0 1 2 3 4
x 104
60
70
80
90
100
110
120
130
Frequency [Hz]
[c]
Figure 10: Spectra of Sound Pressure Level (SPL) atdifferent microphone angles with respect to the jetaxis for the case of the baseline tube (0% porosity),D/Dj = 3.5, L/Dj = 10, and NPR = 5: a) ψ = 90o,b)ψ = 60o, c) ψ = 30o. : Baseline jet, : Tubbedjet.
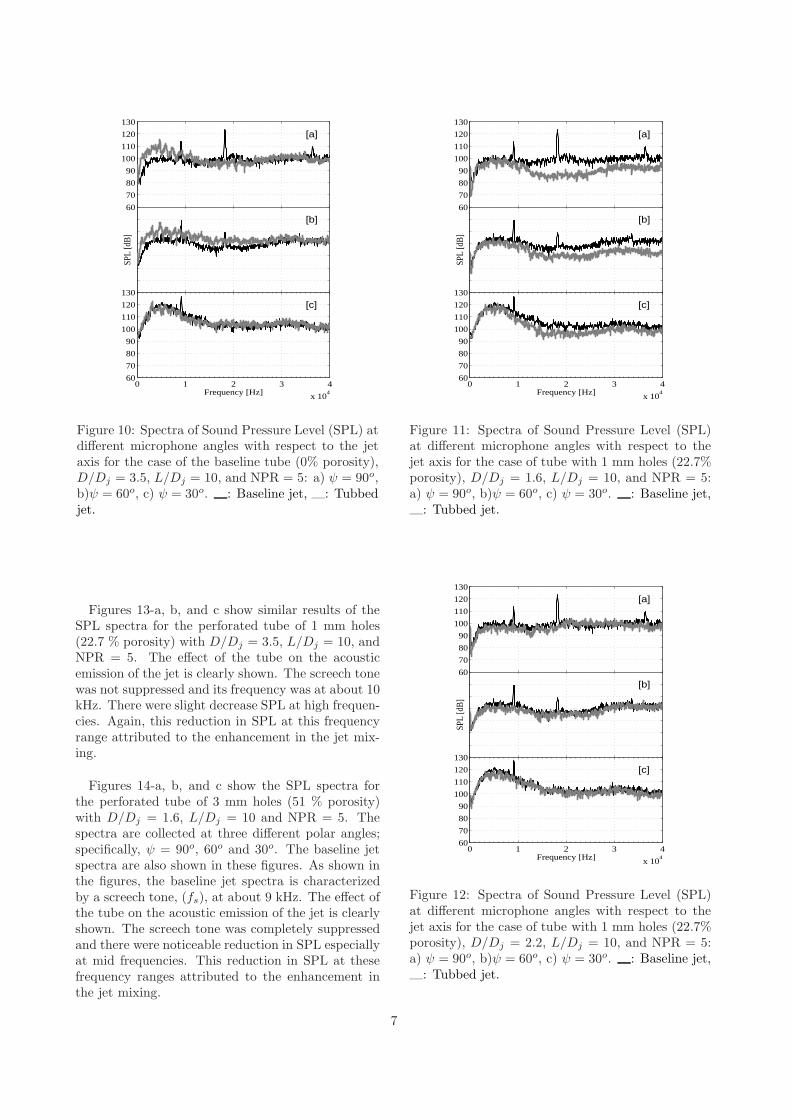
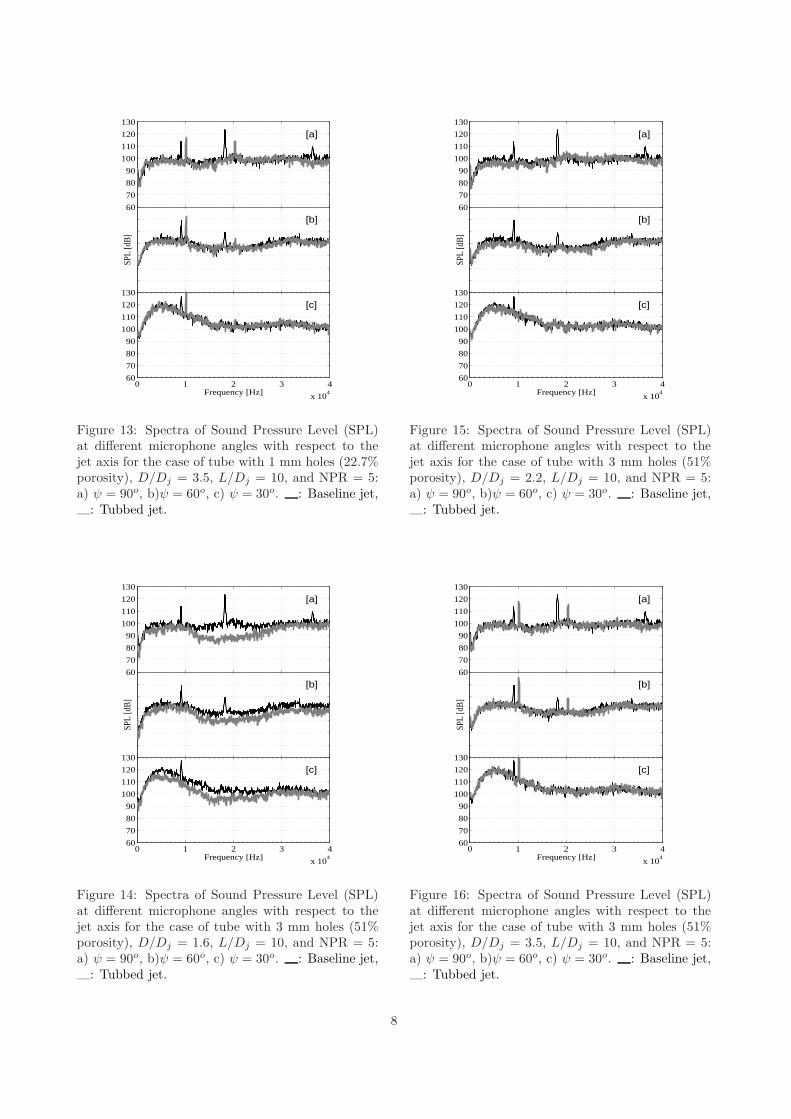
Figures 13-a, b, and c show similar results of theSPL spectra for the perforated tube of 1 mm holes(22.7 % porosity) with D/Dj = 3.5, L/Dj = 10, andNPR = 5. The effect of the tube on the acousticemission of the jet is clearly shown. The screech tonewas not suppressed and its frequency was at about 10kHz. There were slight decrease SPL at high frequen-cies. Again, this reduction in SPL at this frequencyrange attributed to the enhancement in the jet mix-ing.
Figures 14-a, b, and c show the SPL spectra forthe perforated tube of 3 mm holes (51 % porosity)with D/Dj = 1.6, L/Dj = 10 and NPR = 5. Thespectra are collected at three different polar angles;specifically, ψ = 90o, 60o and 30o. The baseline jetspectra are also shown in these figures. As shown inthe figures, the baseline jet spectra is characterizedby a screech tone, (fs), at about 9 kHz. The effect ofthe tube on the acoustic emission of the jet is clearlyshown. The screech tone was completely suppressedand there were noticeable reduction in SPL especiallyat mid frequencies. This reduction in SPL at thesefrequency ranges attributed to the enhancement inthe jet mixing.
60
70
80
90
100
110
120
130
[a]
SPL
[dB
]
[b]
0 1 2 3 4
x 104
60
70
80
90
100
110
120
130
Frequency [Hz]
[c]
Figure 11: Spectra of Sound Pressure Level (SPL)at different microphone angles with respect to thejet axis for the case of tube with 1 mm holes (22.7%porosity), D/Dj = 1.6, L/Dj = 10, and NPR = 5:a) ψ = 90o, b)ψ = 60o, c) ψ = 30o. : Baseline jet,
: Tubbed jet.
60
70
80
90
100
110
120
130
[a]
SPL
[dB
]
[b]
0 1 2 3 4
x 104
60
70
80
90
100
110
120
130
Frequency [Hz]
[c]
Figure 12: Spectra of Sound Pressure Level (SPL)at different microphone angles with respect to thejet axis for the case of tube with 1 mm holes (22.7%porosity), D/Dj = 2.2, L/Dj = 10, and NPR = 5:a) ψ = 90o, b)ψ = 60o, c) ψ = 30o. : Baseline jet,
: Tubbed jet.
7
60
70
80
90
100
110
120
130
[a]SP
L [d
B]
[b]
0 1 2 3 4
x 104
60
70
80
90
100
110
120
130
Frequency [Hz]
[c]
Figure 13: Spectra of Sound Pressure Level (SPL)at different microphone angles with respect to thejet axis for the case of tube with 1 mm holes (22.7%porosity), D/Dj = 3.5, L/Dj = 10, and NPR = 5:a) ψ = 90o, b)ψ = 60o, c) ψ = 30o. : Baseline jet,
: Tubbed jet.
60
70
80
90
100
110
120
130
[a]
SPL
[dB
]
[b]
0 1 2 3 4
x 104
60
70
80
90
100
110
120
130
Frequency [Hz]
[c]
Figure 14: Spectra of Sound Pressure Level (SPL)at different microphone angles with respect to thejet axis for the case of tube with 3 mm holes (51%porosity), D/Dj = 1.6, L/Dj = 10, and NPR = 5:a) ψ = 90o, b)ψ = 60o, c) ψ = 30o. : Baseline jet,
: Tubbed jet.
60
70
80
90
100
110
120
130
[a]
SPL
[dB
]
[b]
0 1 2 3 4
x 104
60
70
80
90
100
110
120
130
Frequency [Hz]
[c]
Figure 15: Spectra of Sound Pressure Level (SPL)at different microphone angles with respect to thejet axis for the case of tube with 3 mm holes (51%porosity), D/Dj = 2.2, L/Dj = 10, and NPR = 5:a) ψ = 90o, b)ψ = 60o, c) ψ = 30o. : Baseline jet,
: Tubbed jet.
60
70
80
90
100
110
120
130
[a]
SPL
[dB
]
[b]
0 1 2 3 4
x 104
60
70
80
90
100
110
120
130
Frequency [Hz]
[c]
Figure 16: Spectra of Sound Pressure Level (SPL)at different microphone angles with respect to thejet axis for the case of tube with 3 mm holes (51%porosity), D/Dj = 3.5, L/Dj = 10, and NPR = 5:a) ψ = 90o, b)ψ = 60o, c) ψ = 30o. : Baseline jet,
: Tubbed jet.
8
1.0 1.6 2.0 2.2 2.8 3.6 BASELINE2.5
3.0
3.5
4.0
4.5
5.0
D/Dj
NP
R
(a) ψ = 30o
1.0 1.6 2.0 2.2 2.8 3.6 BASELINE2.5
3.0
3.5
4.0
4.5
5.0
D/Dj
NP
R
(b) ψ = 60o
1.0 1.6 2.0 2.2 2.8 3.6 BASELINE2.5
3.0
3.5
4.0
4.5
5.0
D/Dj
NP
R
(c) ψ = 90o.
Figure 17: Effect of Nozzle Pressure Ratio (NPR) and D/Dj on OASPL for the case of L/Dj = 10.
Figures 15-a, b, and c show similar results of theSPL spectra for the perforated tube of 3 mm holes(51 % porosity) with D/Dj = 2.2, L/Dj = 10, andNPR = 5. The effect of the tube on the acoustic emis-sion of the jet is clearly shown. The screech tone wasalso suppressed. SPL spectra are slightly decreasedespecially at low frequencies. At mid and high fre-quencies, SPL spectra are unaffected.Figures 16-a, b, and c show similar results of the
SPL spectra for the perforated tube of 3 mm holes (51% porosity) with D/Dj = 3.5, L/Dj = 10, and NPR= 5. The effect of the tube on the acoustic emissionof the jet is clearly shown. The screech tone was notsuppressed and its frequency was at about 10 kHz.There were slight decrease SPL at high frequenciesdetected by the microphone located at ψ = 90o.
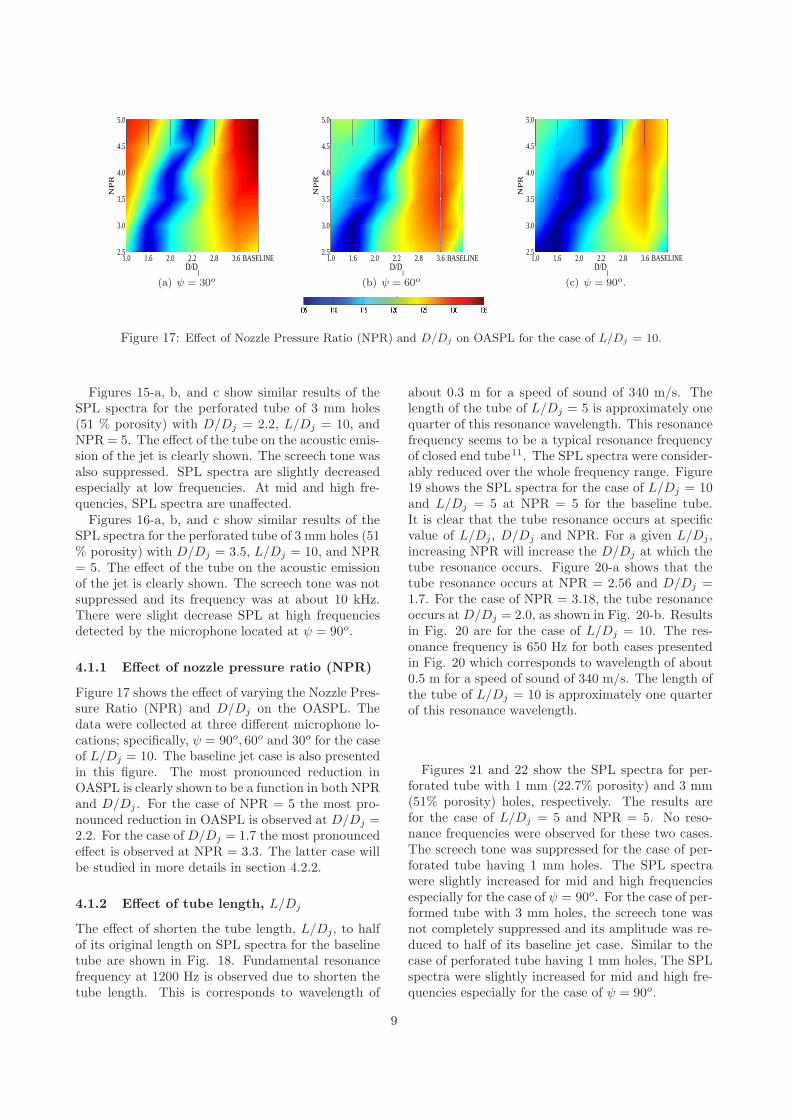
4.1.1 Effect of nozzle pressure ratio (NPR)
Figure 17 shows the effect of varying the Nozzle Pres-sure Ratio (NPR) and D/Dj on the OASPL. Thedata were collected at three different microphone lo-cations; specifically, ψ = 90o, 60o and 30o for the caseof L/Dj = 10. The baseline jet case is also presentedin this figure. The most pronounced reduction inOASPL is clearly shown to be a function in both NPRand D/Dj . For the case of NPR = 5 the most pro-nounced reduction in OASPL is observed at D/Dj =2.2. For the case of D/Dj = 1.7 the most pronouncedeffect is observed at NPR = 3.3. The latter case willbe studied in more details in section 4.2.2.
4.1.2 Effect of tube length, L/Dj
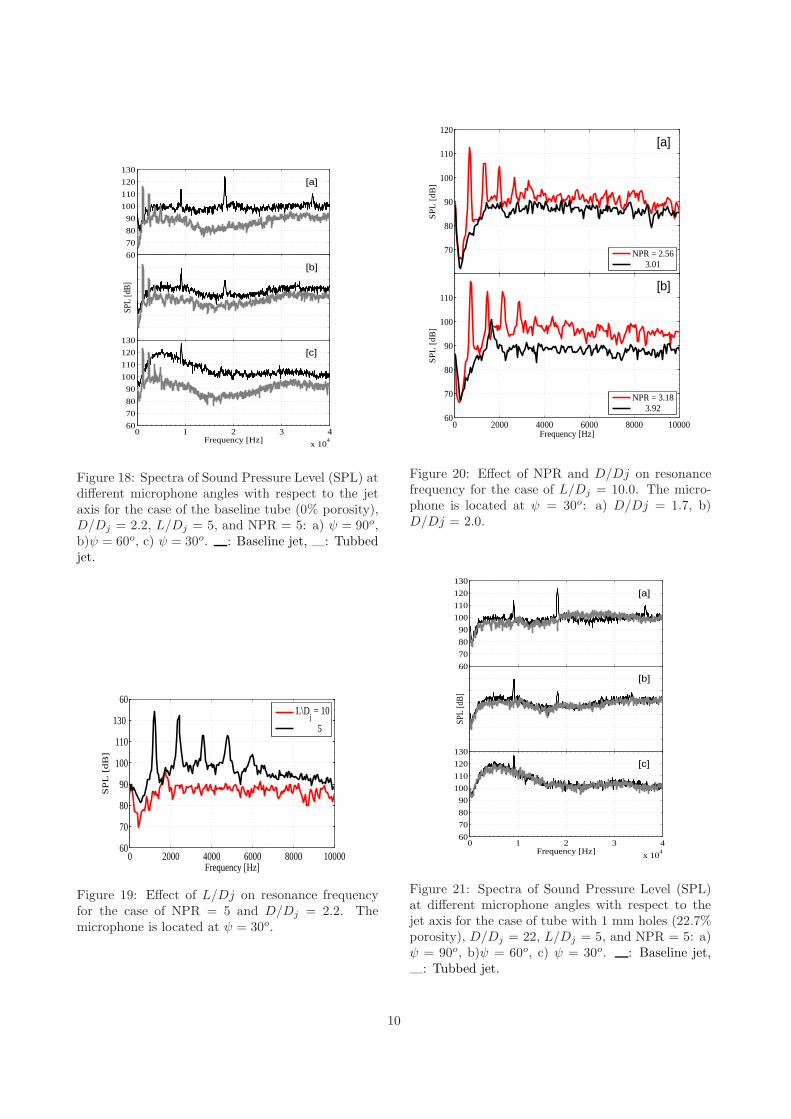
The effect of shorten the tube length, L/Dj, to halfof its original length on SPL spectra for the baselinetube are shown in Fig. 18. Fundamental resonancefrequency at 1200 Hz is observed due to shorten thetube length. This is corresponds to wavelength of
about 0.3 m for a speed of sound of 340 m/s. Thelength of the tube of L/Dj = 5 is approximately onequarter of this resonance wavelength. This resonancefrequency seems to be a typical resonance frequencyof closed end tube11. The SPL spectra were consider-ably reduced over the whole frequency range. Figure19 shows the SPL spectra for the case of L/Dj = 10and L/Dj = 5 at NPR = 5 for the baseline tube.It is clear that the tube resonance occurs at specificvalue of L/Dj, D/Dj and NPR. For a given L/Dj,increasing NPR will increase the D/Dj at which thetube resonance occurs. Figure 20-a shows that thetube resonance occurs at NPR = 2.56 and D/Dj =1.7. For the case of NPR = 3.18, the tube resonanceoccurs at D/Dj = 2.0, as shown in Fig. 20-b. Resultsin Fig. 20 are for the case of L/Dj = 10. The res-onance frequency is 650 Hz for both cases presentedin Fig. 20 which corresponds to wavelength of about0.5 m for a speed of sound of 340 m/s. The length ofthe tube of L/Dj = 10 is approximately one quarterof this resonance wavelength.
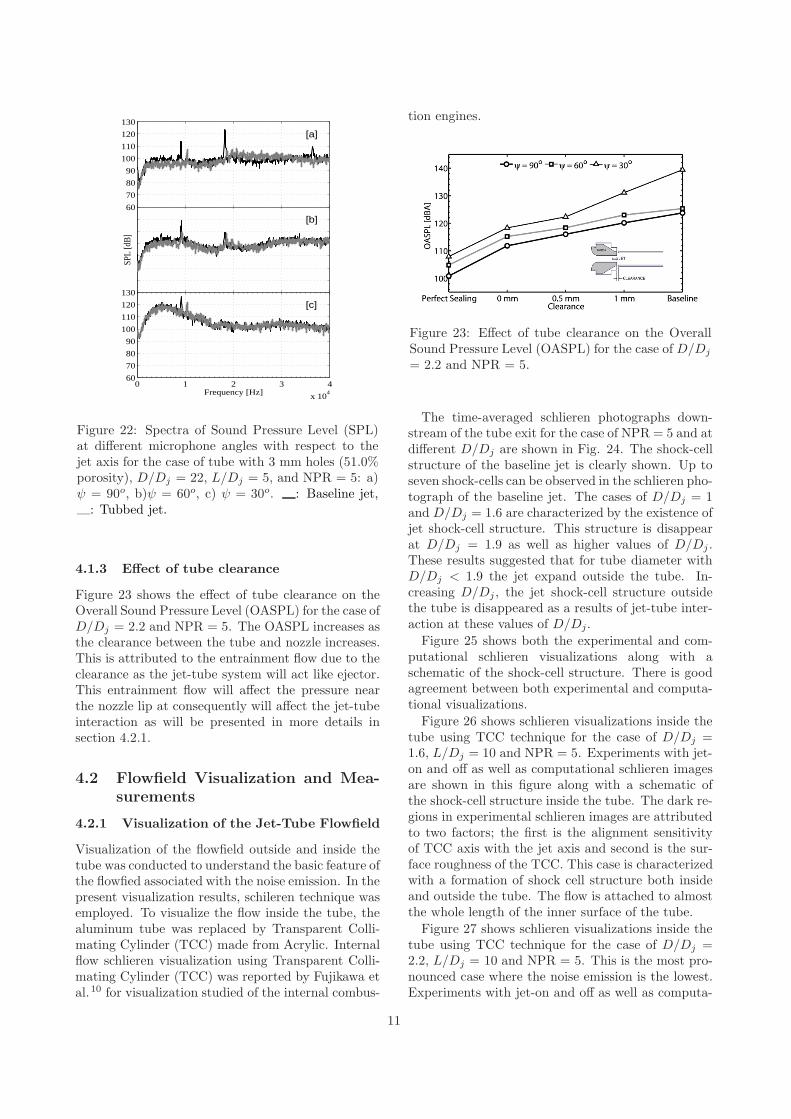
Figures 21 and 22 show the SPL spectra for per-forated tube with 1 mm (22.7% porosity) and 3 mm(51% porosity) holes, respectively. The results arefor the case of L/Dj = 5 and NPR = 5. No reso-nance frequencies were observed for these two cases.The screech tone was suppressed for the case of per-forated tube having 1 mm holes. The SPL spectrawere slightly increased for mid and high frequenciesespecially for the case of ψ = 90o. For the case of per-formed tube with 3 mm holes, the screech tone wasnot completely suppressed and its amplitude was re-duced to half of its baseline jet case. Similar to thecase of perforated tube having 1 mm holes, The SPLspectra were slightly increased for mid and high fre-quencies especially for the case of ψ = 90o.
9
60
70
80
90
100
110
120
130
[a]
SPL
[dB
]
[b]
0 1 2 3 4
x 104
60
70
80
90
100
110
120
130
Frequency [Hz]
[c]
Figure 18: Spectra of Sound Pressure Level (SPL) atdifferent microphone angles with respect to the jetaxis for the case of the baseline tube (0% porosity),D/Dj = 2.2, L/Dj = 5, and NPR = 5: a) ψ = 90o,b)ψ = 60o, c) ψ = 30o. : Baseline jet, : Tubbedjet.
0 2000 4000 6000 8000 1000060
70
80
90
100
110
130
60
SP
L [
dB
]
Frequency [Hz]
L\Dj = 10
5
Figure 19: Effect of L/Dj on resonance frequencyfor the case of NPR = 5 and D/Dj = 2.2. Themicrophone is located at ψ = 30o.
70
80
90
100
110
120
SP
L [
dB]
[a]
0 2000 4000 6000 8000 1000060
70
80
90
100
110
SP
L [
dB]
Frequency [Hz]
[b]
NPR = 2.56 3.01
NPR = 3.18 3.92
Figure 20: Effect of NPR and D/Dj on resonancefrequency for the case of L/Dj = 10.0. The micro-phone is located at ψ = 30o: a) D/Dj = 1.7, b)D/Dj = 2.0.
60
70
80
90
100
110
120
130
[a]
SPL
[dB
]
[b]
0 1 2 3 4
x 104
60
70
80
90
100
110
120
130
Frequency [Hz]
[c]
Figure 21: Spectra of Sound Pressure Level (SPL)at different microphone angles with respect to thejet axis for the case of tube with 1 mm holes (22.7%porosity), D/Dj = 22, L/Dj = 5, and NPR = 5: a)ψ = 90o, b)ψ = 60o, c) ψ = 30o. : Baseline jet,
: Tubbed jet.
10
60
70
80
90
100
110
120
130
[a]SP
L [d
B]
[b]
0 1 2 3 4
x 104
60
70
80
90
100
110
120
130
Frequency [Hz]
[c]
Figure 22: Spectra of Sound Pressure Level (SPL)at different microphone angles with respect to thejet axis for the case of tube with 3 mm holes (51.0%porosity), D/Dj = 22, L/Dj = 5, and NPR = 5: a)ψ = 90o, b)ψ = 60o, c) ψ = 30o. : Baseline jet,
: Tubbed jet.
4.1.3 Effect of tube clearance
Figure 23 shows the effect of tube clearance on theOverall Sound Pressure Level (OASPL) for the case ofD/Dj = 2.2 and NPR = 5. The OASPL increases asthe clearance between the tube and nozzle increases.This is attributed to the entrainment flow due to theclearance as the jet-tube system will act like ejector.This entrainment flow will affect the pressure nearthe nozzle lip at consequently will affect the jet-tubeinteraction as will be presented in more details insection 4.2.1.
4.2 Flowfield Visualization and Mea-
surements
4.2.1 Visualization of the Jet-Tube Flowfield
Visualization of the flowfield outside and inside thetube was conducted to understand the basic feature ofthe flowfied associated with the noise emission. In thepresent visualization results, schileren technique wasemployed. To visualize the flow inside the tube, thealuminum tube was replaced by Transparent Colli-mating Cylinder (TCC) made from Acrylic. Internalflow schlieren visualization using Transparent Colli-mating Cylinder (TCC) was reported by Fujikawa etal.10 for visualization studied of the internal combus-
tion engines.
Figure 23: Effect of tube clearance on the OverallSound Pressure Level (OASPL) for the case of D/Dj
= 2.2 and NPR = 5.
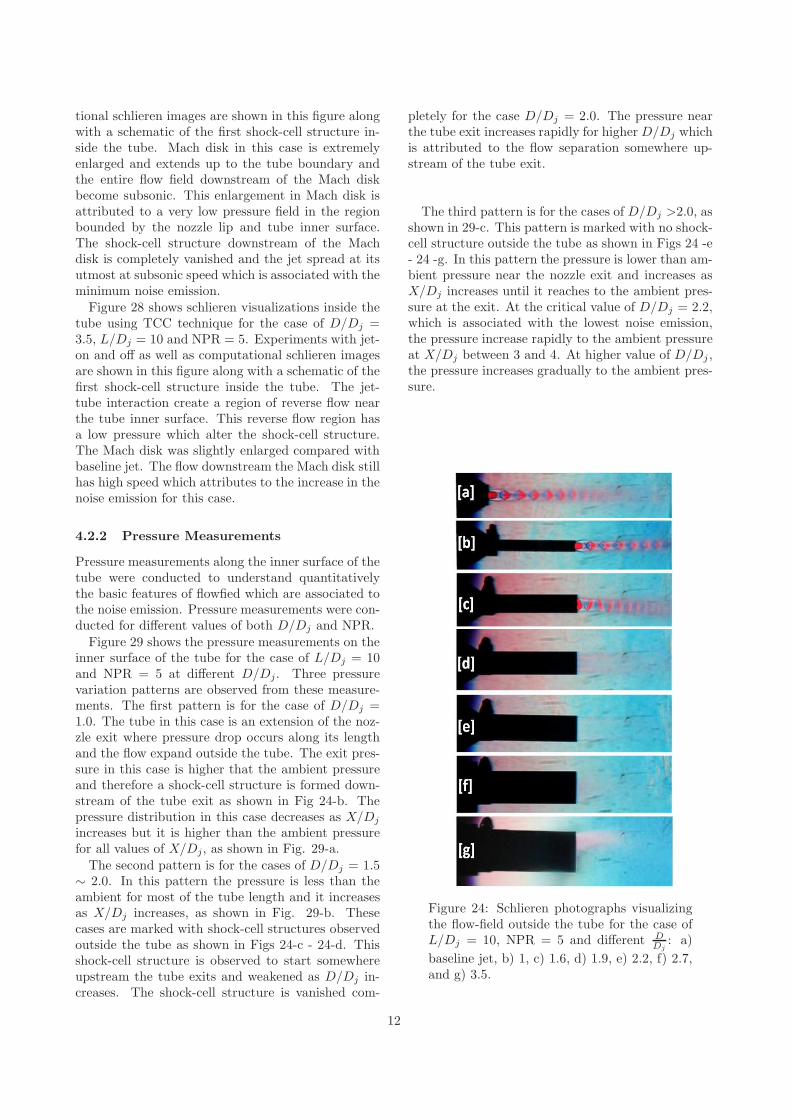
The time-averaged schlieren photographs down-stream of the tube exit for the case of NPR = 5 and atdifferent D/Dj are shown in Fig. 24. The shock-cellstructure of the baseline jet is clearly shown. Up toseven shock-cells can be observed in the schlieren pho-tograph of the baseline jet. The cases of D/Dj = 1and D/Dj = 1.6 are characterized by the existence ofjet shock-cell structure. This structure is disappearat D/Dj = 1.9 as well as higher values of D/Dj .These results suggested that for tube diameter withD/Dj < 1.9 the jet expand outside the tube. In-creasing D/Dj , the jet shock-cell structure outsidethe tube is disappeared as a results of jet-tube inter-action at these values of D/Dj.
Figure 25 shows both the experimental and com-putational schlieren visualizations along with aschematic of the shock-cell structure. There is goodagreement between both experimental and computa-tional visualizations.
Figure 26 shows schlieren visualizations inside thetube using TCC technique for the case of D/Dj =1.6, L/Dj = 10 and NPR = 5. Experiments with jet-on and off as well as computational schlieren imagesare shown in this figure along with a schematic ofthe shock-cell structure inside the tube. The dark re-gions in experimental schlieren images are attributedto two factors; the first is the alignment sensitivityof TCC axis with the jet axis and second is the sur-face roughness of the TCC. This case is characterizedwith a formation of shock cell structure both insideand outside the tube. The flow is attached to almostthe whole length of the inner surface of the tube.
Figure 27 shows schlieren visualizations inside thetube using TCC technique for the case of D/Dj =2.2, L/Dj = 10 and NPR = 5. This is the most pro-nounced case where the noise emission is the lowest.Experiments with jet-on and off as well as computa-
11
tional schlieren images are shown in this figure alongwith a schematic of the first shock-cell structure in-side the tube. Mach disk in this case is extremelyenlarged and extends up to the tube boundary andthe entire flow field downstream of the Mach diskbecome subsonic. This enlargement in Mach disk isattributed to a very low pressure field in the regionbounded by the nozzle lip and tube inner surface.The shock-cell structure downstream of the Machdisk is completely vanished and the jet spread at itsutmost at subsonic speed which is associated with theminimum noise emission.Figure 28 shows schlieren visualizations inside the
tube using TCC technique for the case of D/Dj =3.5, L/Dj = 10 and NPR = 5. Experiments with jet-on and off as well as computational schlieren imagesare shown in this figure along with a schematic of thefirst shock-cell structure inside the tube. The jet-tube interaction create a region of reverse flow nearthe tube inner surface. This reverse flow region hasa low pressure which alter the shock-cell structure.The Mach disk was slightly enlarged compared withbaseline jet. The flow downstream the Mach disk stillhas high speed which attributes to the increase in thenoise emission for this case.
4.2.2 Pressure Measurements
Pressure measurements along the inner surface of thetube were conducted to understand quantitativelythe basic features of flowfied which are associated tothe noise emission. Pressure measurements were con-ducted for different values of both D/Dj and NPR.
Figure 29 shows the pressure measurements on theinner surface of the tube for the case of L/Dj = 10and NPR = 5 at different D/Dj. Three pressurevariation patterns are observed from these measure-ments. The first pattern is for the case of D/Dj =1.0. The tube in this case is an extension of the noz-zle exit where pressure drop occurs along its lengthand the flow expand outside the tube. The exit pres-sure in this case is higher that the ambient pressureand therefore a shock-cell structure is formed down-stream of the tube exit as shown in Fig 24-b. Thepressure distribution in this case decreases as X/Dj
increases but it is higher than the ambient pressurefor all values of X/Dj, as shown in Fig. 29-a.
The second pattern is for the cases of D/Dj = 1.5∼ 2.0. In this pattern the pressure is less than theambient for most of the tube length and it increasesas X/Dj increases, as shown in Fig. 29-b. Thesecases are marked with shock-cell structures observedoutside the tube as shown in Figs 24-c - 24-d. Thisshock-cell structure is observed to start somewhereupstream the tube exits and weakened as D/Dj in-creases. The shock-cell structure is vanished com-
pletely for the case D/Dj = 2.0. The pressure nearthe tube exit increases rapidly for higherD/Dj whichis attributed to the flow separation somewhere up-stream of the tube exit.
The third pattern is for the cases of D/Dj >2.0, asshown in 29-c. This pattern is marked with no shock-cell structure outside the tube as shown in Figs 24 -e- 24 -g. In this pattern the pressure is lower than am-bient pressure near the nozzle exit and increases asX/Dj increases until it reaches to the ambient pres-sure at the exit. At the critical value of D/Dj = 2.2,which is associated with the lowest noise emission,the pressure increase rapidly to the ambient pressureat X/Dj between 3 and 4. At higher value of D/Dj ,the pressure increases gradually to the ambient pres-sure.
Figure 24: Schlieren photographs visualizingthe flow-field outside the tube for the case ofL/Dj = 10, NPR = 5 and different D
Dj: a)
baseline jet, b) 1, c) 1.6, d) 1.9, e) 2.2, f) 2.7,and g) 3.5.
12
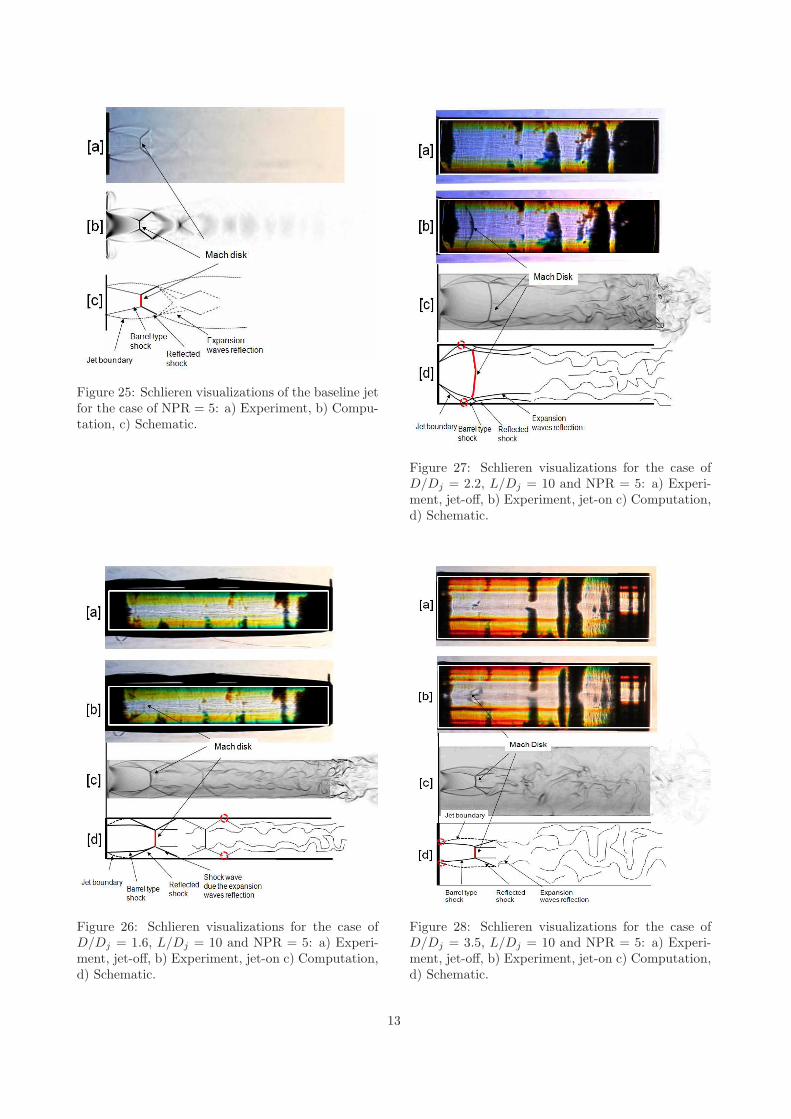
Figure 25: Schlieren visualizations of the baseline jetfor the case of NPR = 5: a) Experiment, b) Compu-tation, c) Schematic.
Figure 26: Schlieren visualizations for the case ofD/Dj = 1.6, L/Dj = 10 and NPR = 5: a) Experi-ment, jet-off, b) Experiment, jet-on c) Computation,d) Schematic.
Figure 27: Schlieren visualizations for the case ofD/Dj = 2.2, L/Dj = 10 and NPR = 5: a) Experi-ment, jet-off, b) Experiment, jet-on c) Computation,d) Schematic.
Figure 28: Schlieren visualizations for the case ofD/Dj = 3.5, L/Dj = 10 and NPR = 5: a) Experi-ment, jet-off, b) Experiment, jet-on c) Computation,d) Schematic.
13
2.5
2.6
2.7
2.8
2.9
3.0
3.1
3.2[a]
0.4
0.5
0.6
0.7
0.8
0.9
p/p
∞
[b]
0 1 2 3 4 5 6 7 8 9 10
0.5
0.6
0.7
0.8
0.9
1.0
x \ Dj
[c]
D/Dj = 1.0
D/Dj = 1.5
1.6 1.7 2.0
D/Dj = 2.2
2.4 2.8 3.8
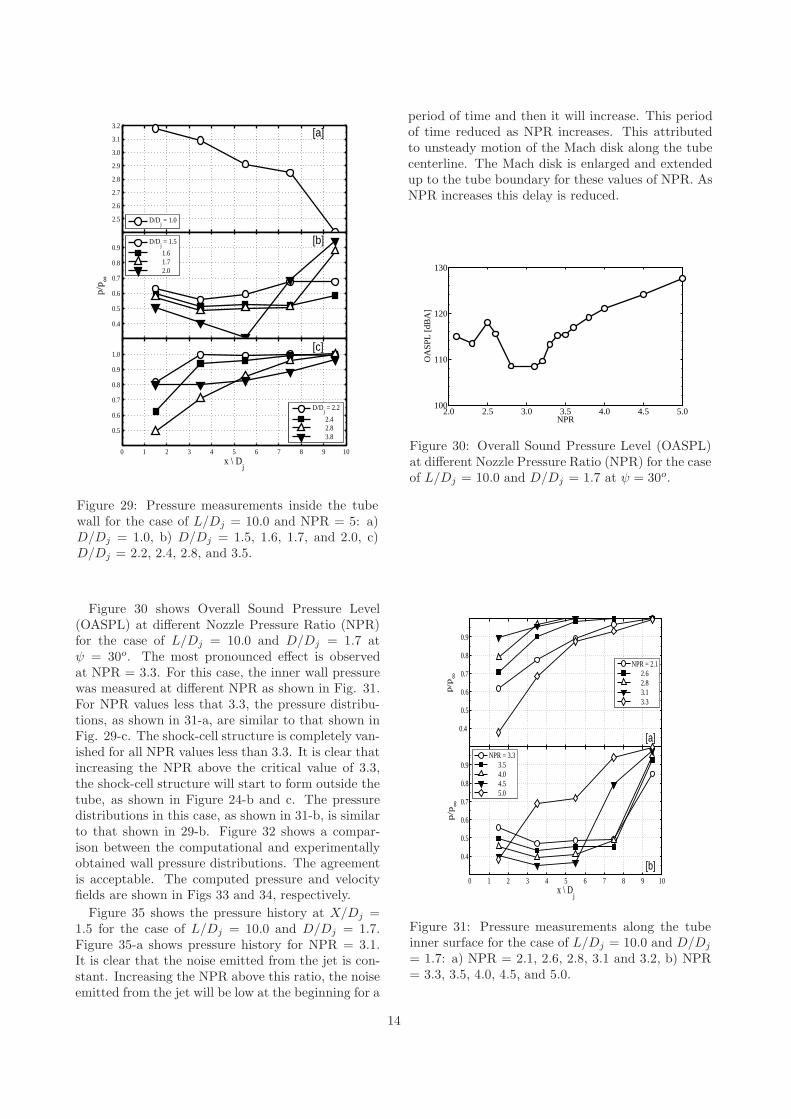
Figure 29: Pressure measurements inside the tubewall for the case of L/Dj = 10.0 and NPR = 5: a)D/Dj = 1.0, b) D/Dj = 1.5, 1.6, 1.7, and 2.0, c)D/Dj = 2.2, 2.4, 2.8, and 3.5.
Figure 30 shows Overall Sound Pressure Level(OASPL) at different Nozzle Pressure Ratio (NPR)for the case of L/Dj = 10.0 and D/Dj = 1.7 atψ = 30o. The most pronounced effect is observedat NPR = 3.3. For this case, the inner wall pressurewas measured at different NPR as shown in Fig. 31.For NPR values less that 3.3, the pressure distribu-tions, as shown in 31-a, are similar to that shown inFig. 29-c. The shock-cell structure is completely van-ished for all NPR values less than 3.3. It is clear thatincreasing the NPR above the critical value of 3.3,the shock-cell structure will start to form outside thetube, as shown in Figure 24-b and c. The pressuredistributions in this case, as shown in 31-b, is similarto that shown in 29-b. Figure 32 shows a compar-ison between the computational and experimentallyobtained wall pressure distributions. The agreementis acceptable. The computed pressure and velocityfields are shown in Figs 33 and 34, respectively.
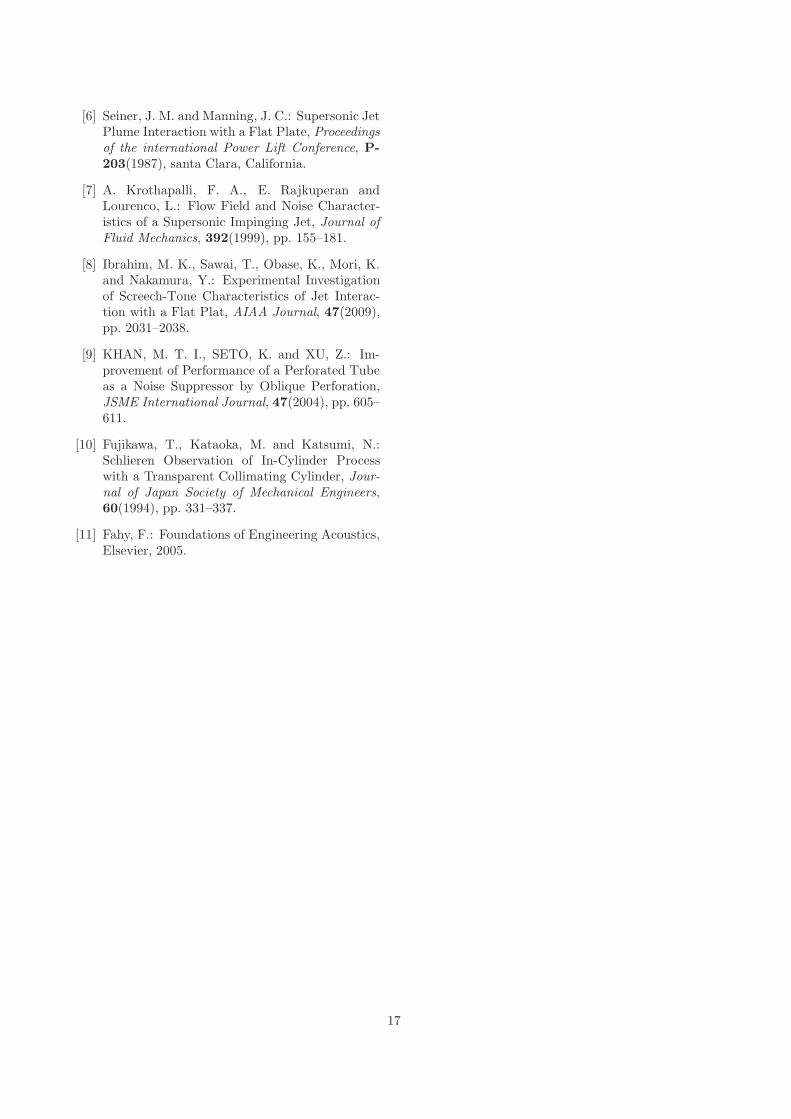
Figure 35 shows the pressure history at X/Dj =1.5 for the case of L/Dj = 10.0 and D/Dj = 1.7.Figure 35-a shows pressure history for NPR = 3.1.It is clear that the noise emitted from the jet is con-stant. Increasing the NPR above this ratio, the noiseemitted from the jet will be low at the beginning for a
period of time and then it will increase. This periodof time reduced as NPR increases. This attributedto unsteady motion of the Mach disk along the tubecenterline. The Mach disk is enlarged and extendedup to the tube boundary for these values of NPR. AsNPR increases this delay is reduced.
2.0 2.5 3.0 3.5 4.0 4.5 5.0100
110
120
130
OA
SPL
[dB
A]
NPR
Figure 30: Overall Sound Pressure Level (OASPL)at different Nozzle Pressure Ratio (NPR) for the caseof L/Dj = 10.0 and D/Dj = 1.7 at ψ = 30o.
0.4
0.5
0.6
0.7
0.8
0.9
p/p
∞
[a]
0 1 2 3 4 5 6 7 8 9 10
0.4
0.5
0.6
0.7
0.8
0.9
p/p
∞
x \ Dj
[b]
NPR = 2.1 2.6 2.8 3.1 3.3
NPR = 3.3 3.5 4.0 4.5 5.0
Figure 31: Pressure measurements along the tubeinner surface for the case of L/Dj = 10.0 and D/Dj
= 1.7: a) NPR = 2.1, 2.6, 2.8, 3.1 and 3.2, b) NPR= 3.3, 3.5, 4.0, 4.5, and 5.0.
14
0.4
0.5
0.6
0.7
0.8
0.9
1.0
[a]
0.4
0.5
0.6
0.7
0.8
0.9
1.0
p/p ∞
[b]
0 1 2 3 4 5 6 7 8 9 10
0.4
0.5
0.6
0.7
0.8
0.9
1.0
x \ Dj
[c]
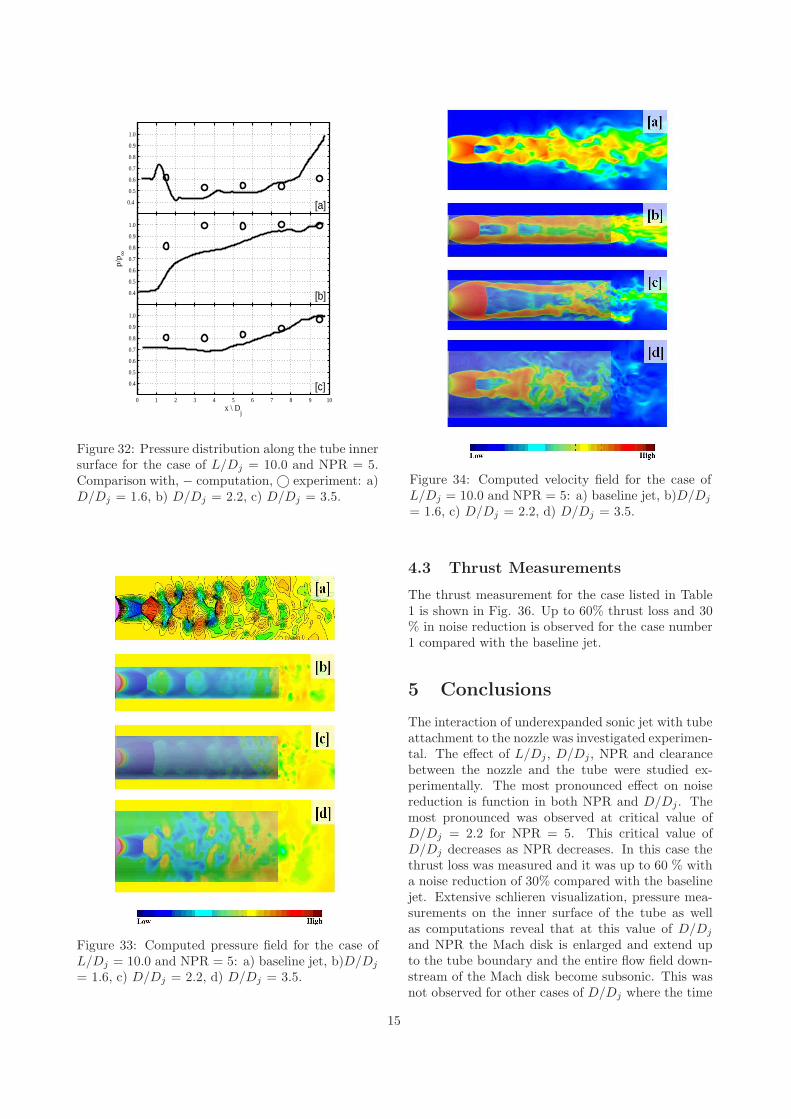
Figure 32: Pressure distribution along the tube innersurface for the case of L/Dj = 10.0 and NPR = 5.Comparison with, − computation, © experiment: a)D/Dj = 1.6, b) D/Dj = 2.2, c) D/Dj = 3.5.
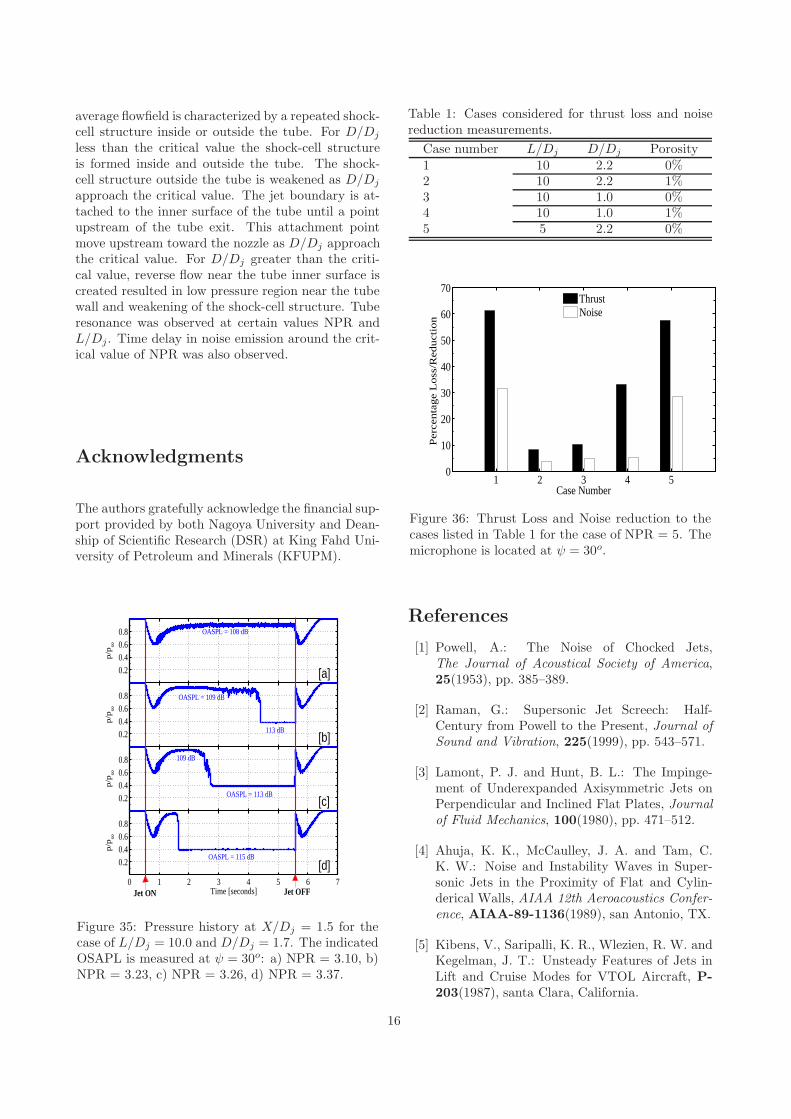
Figure 33: Computed pressure field for the case ofL/Dj = 10.0 and NPR = 5: a) baseline jet, b)D/Dj
= 1.6, c) D/Dj = 2.2, d) D/Dj = 3.5.
Figure 34: Computed velocity field for the case ofL/Dj = 10.0 and NPR = 5: a) baseline jet, b)D/Dj
= 1.6, c) D/Dj = 2.2, d) D/Dj = 3.5.
4.3 Thrust Measurements
The thrust measurement for the case listed in Table1 is shown in Fig. 36. Up to 60% thrust loss and 30% in noise reduction is observed for the case number1 compared with the baseline jet.
5 Conclusions
The interaction of underexpanded sonic jet with tubeattachment to the nozzle was investigated experimen-tal. The effect of L/Dj, D/Dj, NPR and clearancebetween the nozzle and the tube were studied ex-perimentally. The most pronounced effect on noisereduction is function in both NPR and D/Dj. Themost pronounced was observed at critical value ofD/Dj = 2.2 for NPR = 5. This critical value ofD/Dj decreases as NPR decreases. In this case thethrust loss was measured and it was up to 60 % witha noise reduction of 30% compared with the baselinejet. Extensive schlieren visualization, pressure mea-surements on the inner surface of the tube as wellas computations reveal that at this value of D/Dj
and NPR the Mach disk is enlarged and extend upto the tube boundary and the entire flow field down-stream of the Mach disk become subsonic. This wasnot observed for other cases of D/Dj where the time
15
average flowfield is characterized by a repeated shock-cell structure inside or outside the tube. For D/Dj
less than the critical value the shock-cell structureis formed inside and outside the tube. The shock-cell structure outside the tube is weakened as D/Dj
approach the critical value. The jet boundary is at-tached to the inner surface of the tube until a pointupstream of the tube exit. This attachment pointmove upstream toward the nozzle as D/Dj approachthe critical value. For D/Dj greater than the criti-cal value, reverse flow near the tube inner surface iscreated resulted in low pressure region near the tubewall and weakening of the shock-cell structure. Tuberesonance was observed at certain values NPR andL/Dj. Time delay in noise emission around the crit-ical value of NPR was also observed.
Acknowledgments
The authors gratefully acknowledge the financial sup-port provided by both Nagoya University and Dean-ship of Scientific Research (DSR) at King Fahd Uni-versity of Petroleum and Minerals (KFUPM).
0.20.40.60.8
p/p
∞
[a]
0.20.40.60.8
p/p
∞
[b]
0.20.40.60.8
p/p
∞
[c]
0 1 2 3 4 5 6 7
0.20.40.60.8
p/p
∞
Time [seconds]
[d]
OASPL = 108 dB
OASPL = 115 dB
OASPL = 113 dB
109 dB
113 dB
OASPL = 109 dB
Jet ON Jet OFF
Figure 35: Pressure history at X/Dj = 1.5 for thecase of L/Dj = 10.0 and D/Dj = 1.7. The indicatedOSAPL is measured at ψ = 30o: a) NPR = 3.10, b)NPR = 3.23, c) NPR = 3.26, d) NPR = 3.37.
Table 1: Cases considered for thrust loss and noisereduction measurements.
Case number L/Dj D/Dj Porosity1 10 2.2 0%2 10 2.2 1%3 10 1.0 0%4 10 1.0 1%5 5 2.2 0%
1 2 3 4 5 0
10
20
30
40
50
60
70
Case Number
Per
cen
tag
e L
oss
/Red
uct
ion
ThrustNoise
Figure 36: Thrust Loss and Noise reduction to thecases listed in Table 1 for the case of NPR = 5. Themicrophone is located at ψ = 30o.
References
[1] Powell, A.: The Noise of Chocked Jets,The Journal of Acoustical Society of America,25(1953), pp. 385–389.
[2] Raman, G.: Supersonic Jet Screech: Half-Century from Powell to the Present, Journal ofSound and Vibration, 225(1999), pp. 543–571.
[3] Lamont, P. J. and Hunt, B. L.: The Impinge-ment of Underexpanded Axisymmetric Jets onPerpendicular and Inclined Flat Plates, Journalof Fluid Mechanics, 100(1980), pp. 471–512.
[4] Ahuja, K. K., McCaulley, J. A. and Tam, C.K. W.: Noise and Instability Waves in Super-sonic Jets in the Proximity of Flat and Cylin-derical Walls, AIAA 12th Aeroacoustics Confer-
ence, AIAA-89-1136(1989), san Antonio, TX.
[5] Kibens, V., Saripalli, K. R., Wlezien, R. W. andKegelman, J. T.: Unsteady Features of Jets inLift and Cruise Modes for VTOL Aircraft, P-203(1987), santa Clara, California.
16
[6] Seiner, J. M. and Manning, J. C.: Supersonic JetPlume Interaction with a Flat Plate, Proceedingsof the international Power Lift Conference, P-203(1987), santa Clara, California.
[7] A. Krothapalli, F. A., E. Rajkuperan andLourenco, L.: Flow Field and Noise Character-istics of a Supersonic Impinging Jet, Journal ofFluid Mechanics, 392(1999), pp. 155–181.
[8] Ibrahim, M. K., Sawai, T., Obase, K., Mori, K.and Nakamura, Y.: Experimental Investigationof Screech-Tone Characteristics of Jet Interac-tion with a Flat Plat, AIAA Journal, 47(2009),pp. 2031–2038.
[9] KHAN, M. T. I., SETO, K. and XU, Z.: Im-provement of Performance of a Perforated Tubeas a Noise Suppressor by Oblique Perforation,JSME International Journal, 47(2004), pp. 605–611.
[10] Fujikawa, T., Kataoka, M. and Katsumi, N.:Schlieren Observation of In-Cylinder Processwith a Transparent Collimating Cylinder, Jour-nal of Japan Society of Mechanical Engineers,60(1994), pp. 331–337.
[11] Fahy, F.: Foundations of Engineering Acoustics,Elsevier, 2005.
17