Embed Size (px)
DESCRIPTION
nomura
Citation preview

Connecting Markets East & West
See Appendix A-1 for analyst certification, important disclosures and the status of non-US analysts.
Any authors named on this report are research
analysts unless otherwise indicated.
Equity Research
Quantitative Equity Strategy
October 2014
Quantitative Strategy
Inigo Fraser Jenkins – NIplc Alla Harmsworth – NIplc Paul Danis – NIplc Mark Diver – NIplc +44 20 7102 4658 +44 20 7102 2219 +44 20 7102 3406 +44 20 7102 2987 [email protected] [email protected] [email protected] [email protected]
Gerard Alix Guerrini – NIplc Rohit Thombre Robertas Stancikas – NIplc +44 20 7102 8153 +91 22 305 32561 +44 20 7102 3127 [email protected] [email protected] [email protected] Quantitative Solutions Industry Specialists
Ethan Brodie – NSI Bhavik Shah – NIplc Sarah McCarthy – NIplc Norman Pfeifer – NIplc +1 212 667 1076 +44 20 7103 9988 +44 20 7103 9988 +44 20 7103 9988 [email protected] [email protected] [email protected] [email protected]
Rupal Agarwal +91 22 6723 5436 [email protected]
Market outlook
Are earnings growing in Europe?
Global quant equity portfolio:
Tactical factor allocation: Buy growth over income as rates rise
Strategic quant trades
Long horizon concentrated strategies
Sector allocation and current trade ideas
Fund-management strategy
Is passive the new active?
Natural weighting
Cross-asset alternative beta/risk premia investing
EM country selection
Website, recommended strategy portfolio
Introduction
1

Market outlook
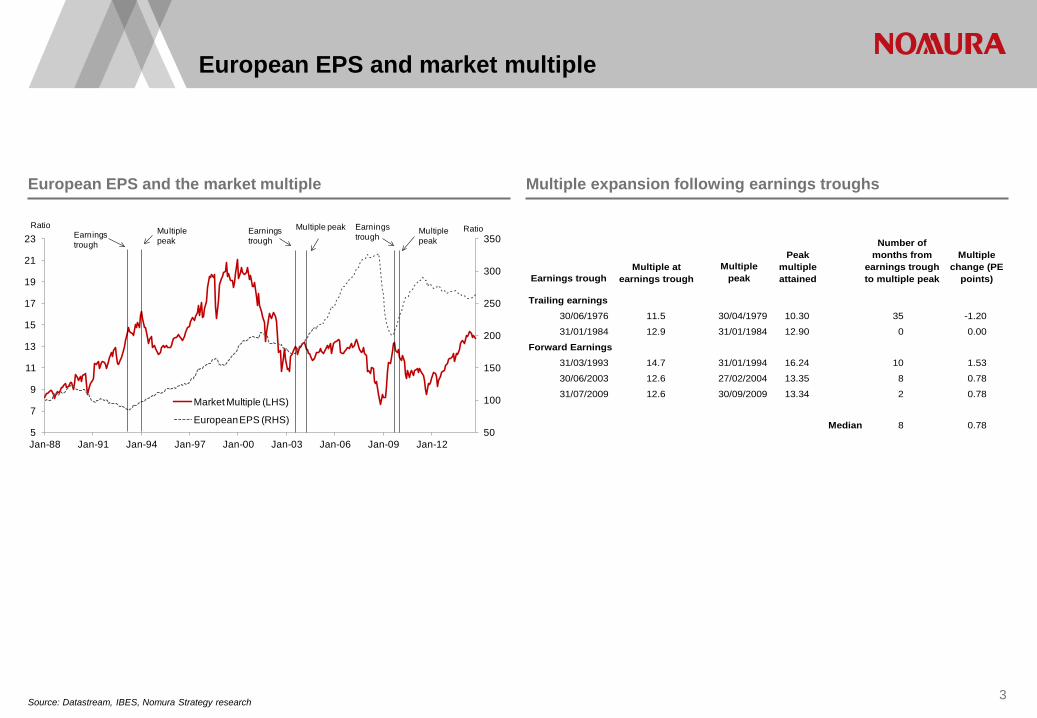
European EPS and market multiple
Source: Datastream, IBES, Nomura Strategy research 3
European EPS and the market multiple Multiple expansion following earnings troughs
Earnings troughMultiple
peak
Trailing earnings30/06/1976 11.5 30/04/1979 10.30 35 -1.20
31/01/1984 12.9 31/01/1984 12.90 0 0.00
Forward Earnings31/03/1993 14.7 31/01/1994 16.24 10 1.53
30/06/2003 12.6 27/02/2004 13.35 8 0.78
31/07/2009 12.6 30/09/2009 13.34 2 0.78
Median 8 0.78
Peak multiple attained
Multiple change (PE
points)Multiple at
earnings trough
Number of months from
earnings trough to multiple peak
50
100
150
200
250
300
350
5
7
9
11
13
15
17
19
21
23
Jan-88 Jan-91 Jan-94 Jan-97 Jan-00 Jan-03 Jan-06 Jan-09 Jan-12
RatioRatio
Market Multiple (LHS)
European EPS (RHS)
Multiple peakMultiple peak
Multiple peak
Earnings trough
Earnings trough
Earnings trough
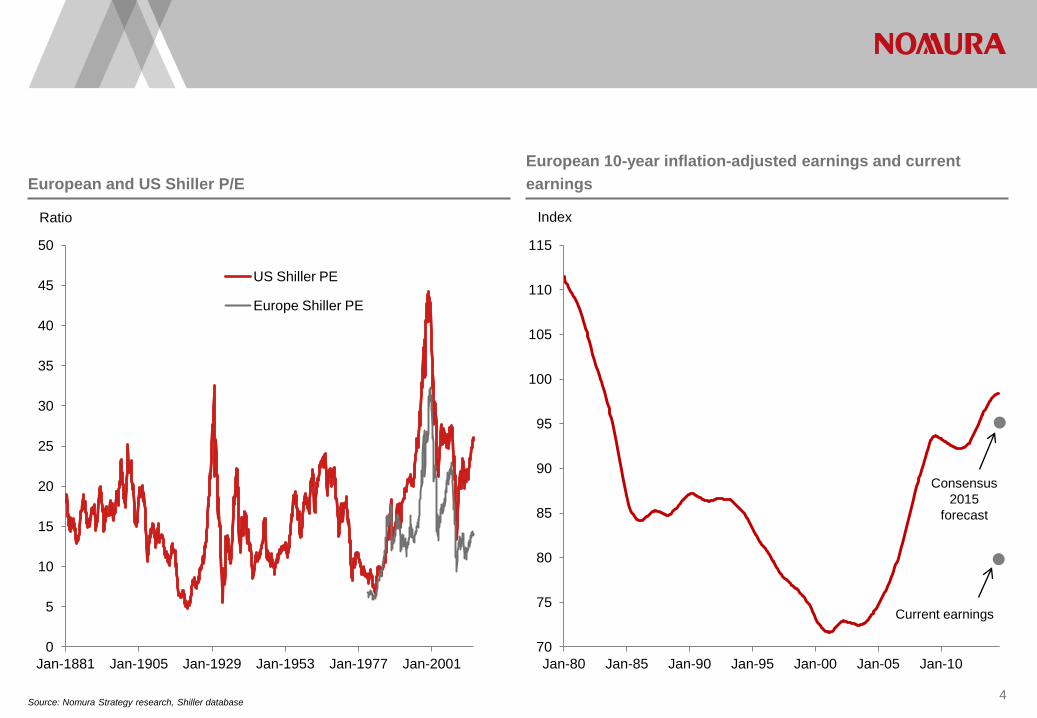
Source: Nomura Strategy research, Shiller database 4
European and US Shiller P/E European 10-year inflation-adjusted earnings and current earnings
0
5
10
15
20
25
30
35
40
45
50
Jan-1881 Jan-1905 Jan-1929 Jan-1953 Jan-1977 Jan-2001
Ratio
US Shiller PE
Europe Shiller PE
70
75
80
85
90
95
100
105
110
115
Jan-80 Jan-85 Jan-90 Jan-95 Jan-00 Jan-05 Jan-10
Index
Current earnings
Consensus 2015
forecast
5
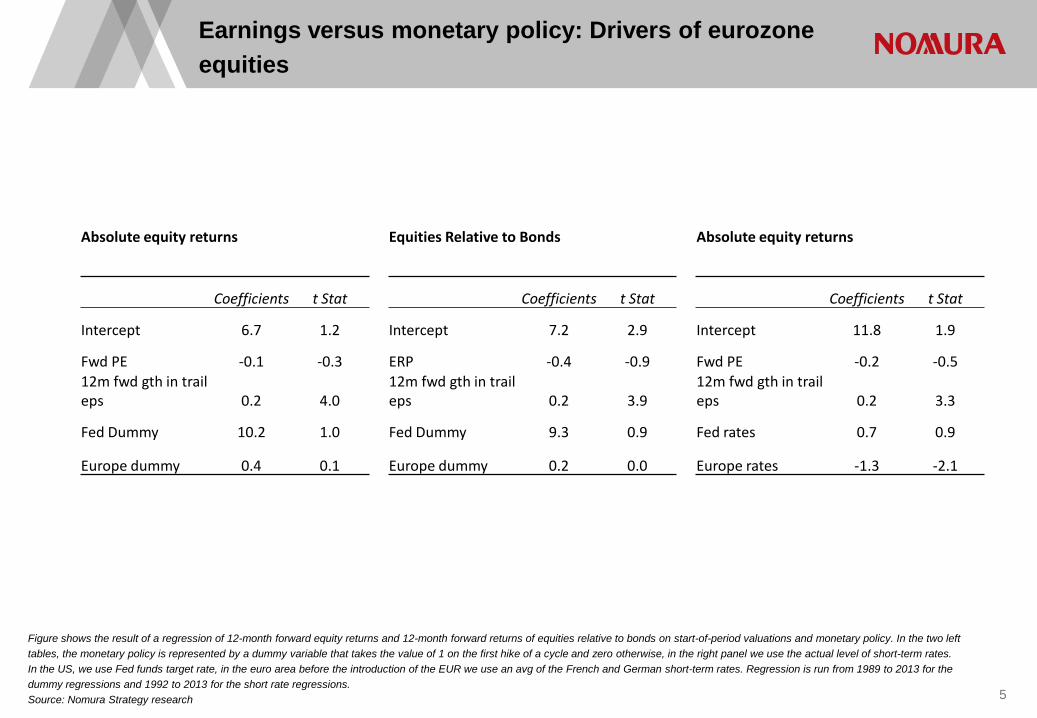
Figure shows the result of a regression of 12-month forward equity returns and 12-month forward returns of equities relative to bonds on start-of-period valuations and monetary policy. In the two left tables, the monetary policy is represented by a dummy variable that takes the value of 1 on the first hike of a cycle and zero otherwise, in the right panel we use the actual level of short-term rates. In the US, we use Fed funds target rate, in the euro area before the introduction of the EUR we use an avg of the French and German short-term rates. Regression is run from 1989 to 2013 for the dummy regressions and 1992 to 2013 for the short rate regressions. Source: Nomura Strategy research
Earnings versus monetary policy: Drivers of eurozone equities
Absolute equity returns Equities Relative to Bonds Absolute equity returns
Coefficients t Stat Coefficients t Stat Coefficients t Stat
Intercept 6.7 1.2 Intercept 7.2 2.9 Intercept 11.8 1.9
Fwd PE -0.1 -0.3 ERP -0.4 -0.9 Fwd PE -0.2 -0.5 12m fwd gth in trail eps 0.2 4.0
12m fwd gth in trail eps 0.2 3.9
12m fwd gth in trail eps 0.2 3.3
Fed Dummy 10.2 1.0 Fed Dummy 9.3 0.9 Fed rates 0.7 0.9
Europe dummy 0.4 0.1 Europe dummy 0.2 0.0 Europe rates -1.3 -2.1
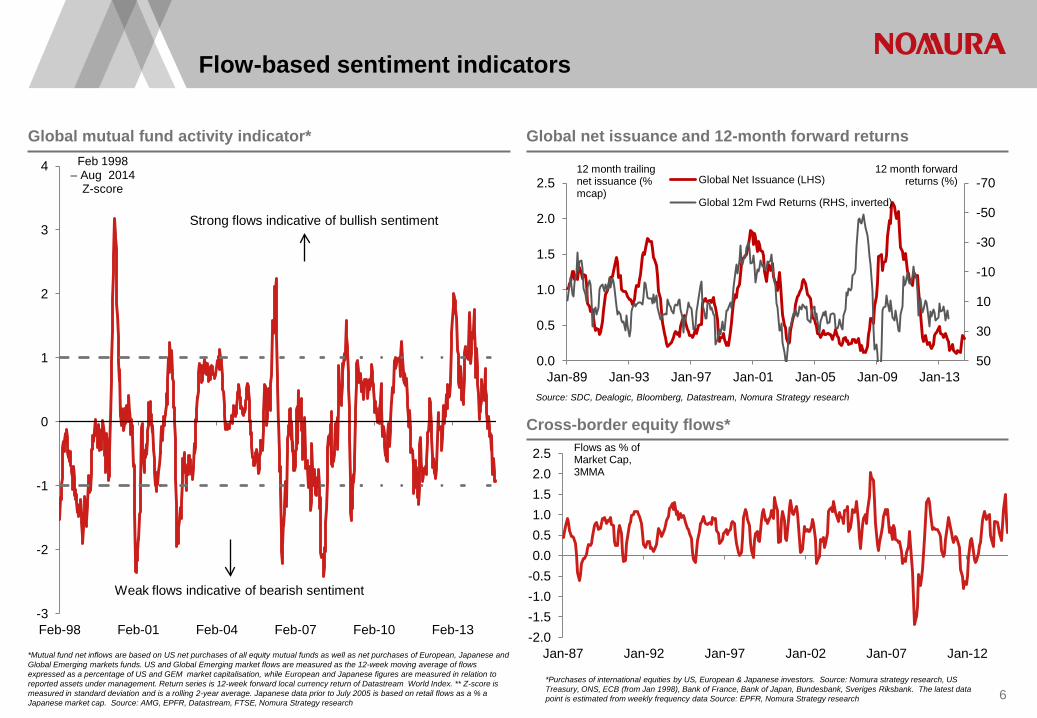
Flow-based sentiment indicators
*Mutual fund net inflows are based on US net purchases of all equity mutual funds as well as net purchases of European, Japanese and Global Emerging markets funds. US and Global Emerging market flows are measured as the 12-week moving average of flows expressed as a percentage of US and GEM market capitalisation, while European and Japanese figures are measured in relation to reported assets under management. Return series is 12-week forward local currency return of Datastream World Index. ** Z-score is measured in standard deviation and is a rolling 2-year average. Japanese data prior to July 2005 is based on retail flows as a % a Japanese market cap. Source: AMG, EPFR, Datastream, FTSE, Nomura Strategy research
-2.0 -1.5 -1.0 -0.5 0.0 0.5 1.0 1.5 2.0 2.5
Jan-87 Jan-92 Jan-97 Jan-02 Jan-07 Jan-12
Flows as % of Market Cap, 3MMA
-3
-2
-1
0
1
2
3
4
Feb-98 Feb-01 Feb-04 Feb-07 Feb-10 Feb-13
Feb 1998 – Aug 2014
Z-score
6
Global mutual fund activity indicator* Global net issuance and 12-month forward returns
Cross-border equity flows*
Strong flows indicative of bullish sentiment
Weak flows indicative of bearish sentiment
*Purchases of international equities by US, European & Japanese investors. Source: Nomura strategy research, US Treasury, ONS, ECB (from Jan 1998), Bank of France, Bank of Japan, Bundesbank, Sveriges Riksbank. The latest data point is estimated from weekly frequency data Source: EPFR, Nomura Strategy research
-70
-50
-30
-10
10
30
50 0.0
0.5
1.0
1.5
2.0
2.5
Jan-89 Jan-93 Jan-97 Jan-01 Jan-05 Jan-09 Jan-13
12 month forward returns (%)
12 month trailing net issuance (% mcap)
Global Net Issuance (LHS)
Global 12m Fwd Returns (RHS, inverted)
Source: SDC, Dealogic, Bloomberg, Datastream, Nomura Strategy research
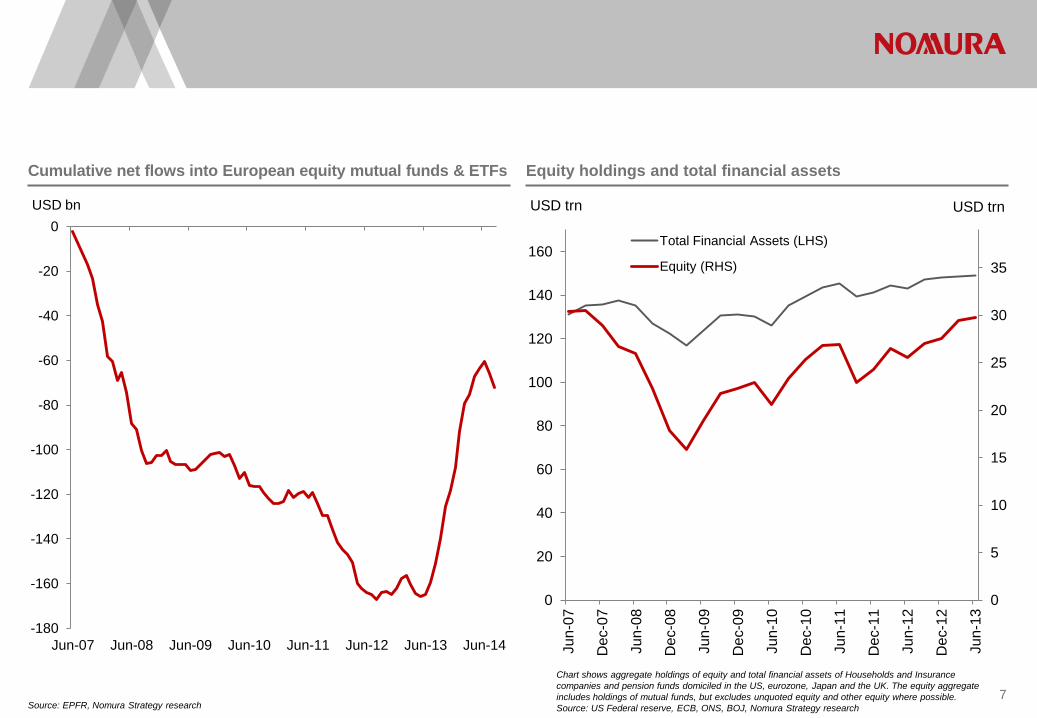
Chart shows aggregate holdings of equity and total financial assets of Households and Insurance companies and pension funds domiciled in the US, eurozone, Japan and the UK. The equity aggregate includes holdings of mutual funds, but excludes unquoted equity and other equity where possible. Source: US Federal reserve, ECB, ONS, BOJ, Nomura Strategy research
Cumulative net flows into European equity mutual funds & ETFs Equity holdings and total financial assets
0
5
10
15
20
25
30
35
0
20
40
60
80
100
120
140
160
Jun-
07
Dec
-07
Jun-
08
Dec
-08
Jun-
09
Dec
-09
Jun-
10
Dec
-10
Jun-
11
Dec
-11
Jun-
12
Dec
-12
Jun-
13
USD trn USD trn
Total Financial Assets (LHS)
Equity (RHS)
Source: EPFR, Nomura Strategy research 7
-180
-160
-140
-120
-100
-80
-60
-40
-20
0
Jun-07 Jun-08 Jun-09 Jun-10 Jun-11 Jun-12 Jun-13 Jun-14
USD bn
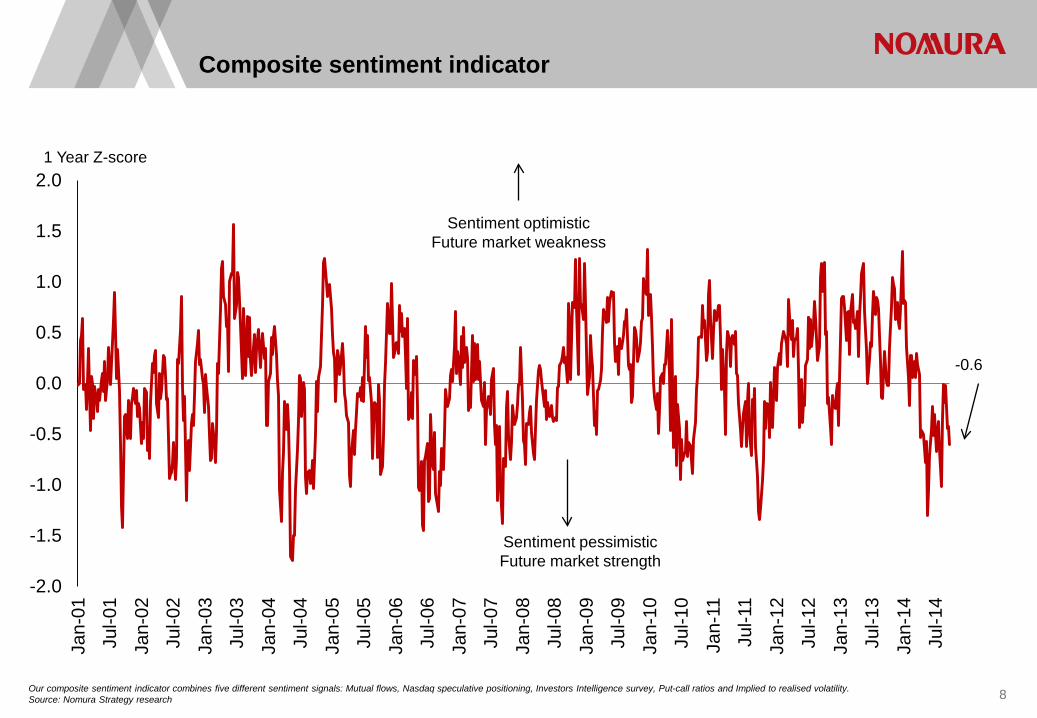
Composite sentiment indicator
Our composite sentiment indicator combines five different sentiment signals: Mutual flows, Nasdaq speculative positioning, Investors Intelligence survey, Put-call ratios and Implied to realised volatility. Source: Nomura Strategy research
-2.0
-1.5
-1.0
-0.5
0.0
0.5
1.0
1.5
2.0
Jan-
01
Jul-0
1
Jan-
02
Jul-0
2
Jan-
03
Jul-0
3
Jan-
04
Jul-0
4
Jan-
05
Jul-0
5
Jan-
06
Jul-0
6
Jan-
07
Jul-0
7
Jan-
08
Jul-0
8
Jan-
09
Jul-0
9
Jan-
10
Jul-1
0
Jan-
11
Jul-1
1
Jan-
12
Jul-1
2
Jan-
13
Jul-1
3
Jan-
14
Jul-1
4
1 Year Z-score
-0.6
Sentiment optimistic Future market weakness
Sentiment pessimistic Future market strength
8
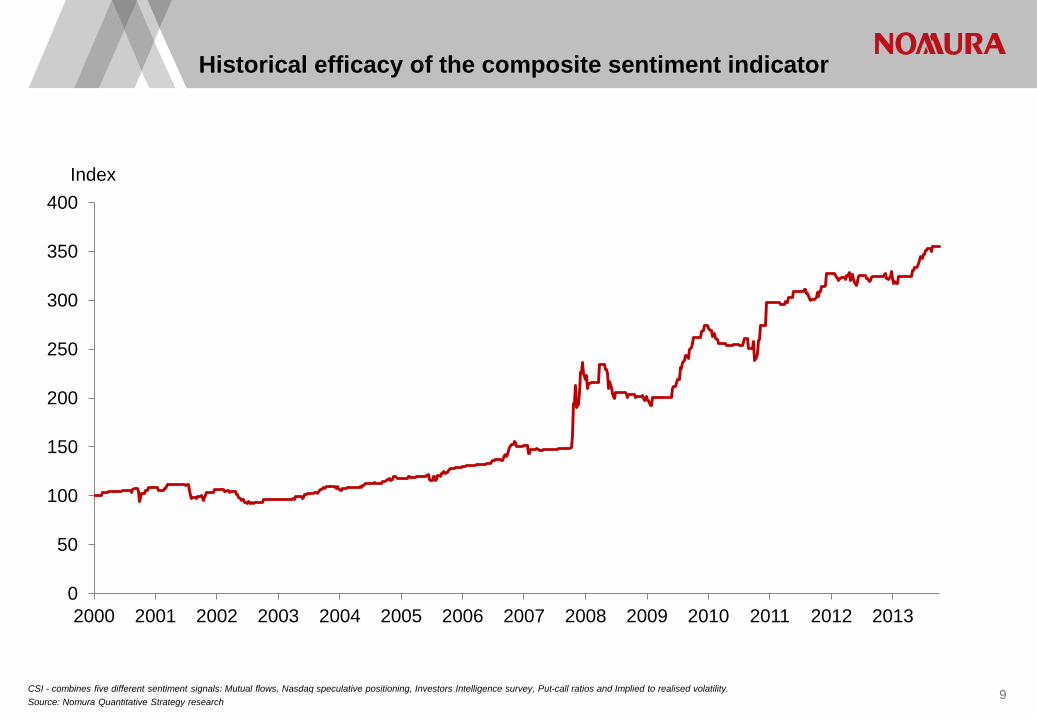
CSI - combines five different sentiment signals: Mutual flows, Nasdaq speculative positioning, Investors Intelligence survey, Put-call ratios and Implied to realised volatility. Source: Nomura Quantitative Strategy research
Historical efficacy of the composite sentiment indicator
9
0
50
100
150
200
250
300
350
400
2000 2001 2002 2003 2004 2005 2006 2007 2008 2009 2010 2011 2012 2013
Index
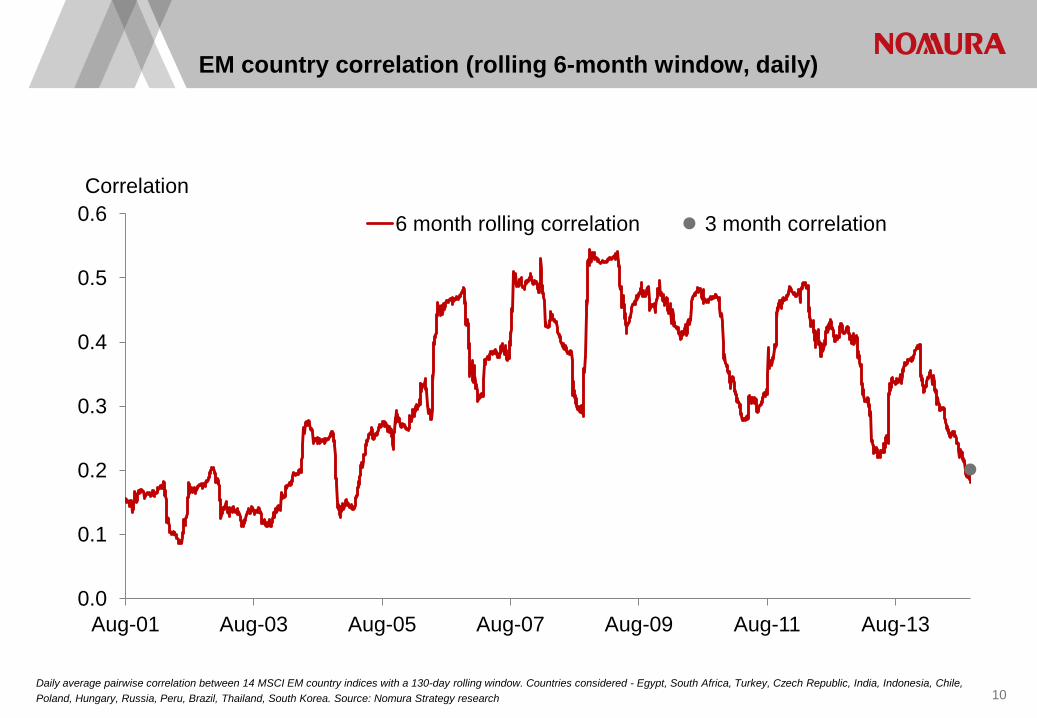
Daily average pairwise correlation between 14 MSCI EM country indices with a 130-day rolling window. Countries considered - Egypt, South Africa, Turkey, Czech Republic, India, Indonesia, Chile, Poland, Hungary, Russia, Peru, Brazil, Thailand, South Korea. Source: Nomura Strategy research
EM country correlation (rolling 6-month window, daily)
10
0.0
0.1
0.2
0.3
0.4
0.5
0.6
Aug-01 Aug-03 Aug-05 Aug-07 Aug-09 Aug-11 Aug-13
Correlation
6 month rolling correlation 3 month correlation
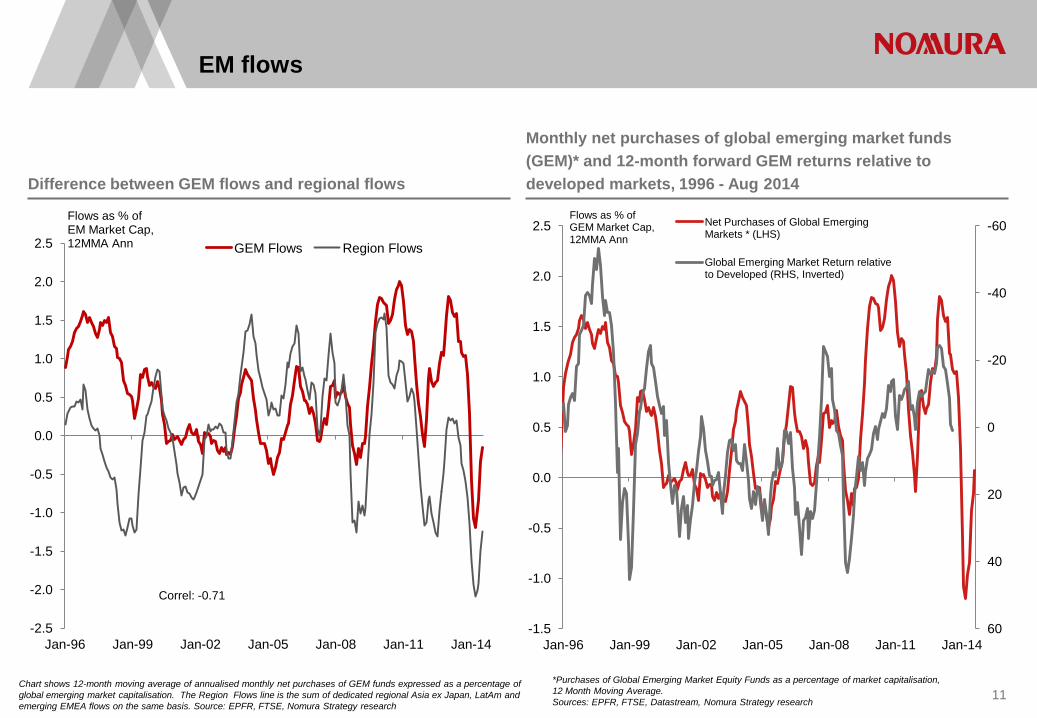
EM flows
Chart shows 12-month moving average of annualised monthly net purchases of GEM funds expressed as a percentage of global emerging market capitalisation. The Region Flows line is the sum of dedicated regional Asia ex Japan, LatAm and emerging EMEA flows on the same basis. Source: EPFR, FTSE, Nomura Strategy research
11
Difference between GEM flows and regional flows
Monthly net purchases of global emerging market funds (GEM)* and 12-month forward GEM returns relative to developed markets, 1996 - Aug 2014
*Purchases of Global Emerging Market Equity Funds as a percentage of market capitalisation, 12 Month Moving Average. Sources: EPFR, FTSE, Datastream, Nomura Strategy research
-2.5
-2.0
-1.5
-1.0
-0.5
0.0
0.5
1.0
1.5
2.0
2.5
Jan-96 Jan-99 Jan-02 Jan-05 Jan-08 Jan-11 Jan-14
Flows as % of EM Market Cap, 12MMA Ann GEM Flows Region Flows
Correl: -0.71
-60
-40
-20
0
20
40
60 -1.5
-1.0
-0.5
0.0
0.5
1.0
1.5
2.0
2.5
Jan-96 Jan-99 Jan-02 Jan-05 Jan-08 Jan-11 Jan-14
Flows as % of GEM Market Cap, 12MMA Ann
Net Purchases of Global Emerging Markets * (LHS)
Global Emerging Market Return relative to Developed (RHS, Inverted)
12 Source: Nomura Quantitative strategy
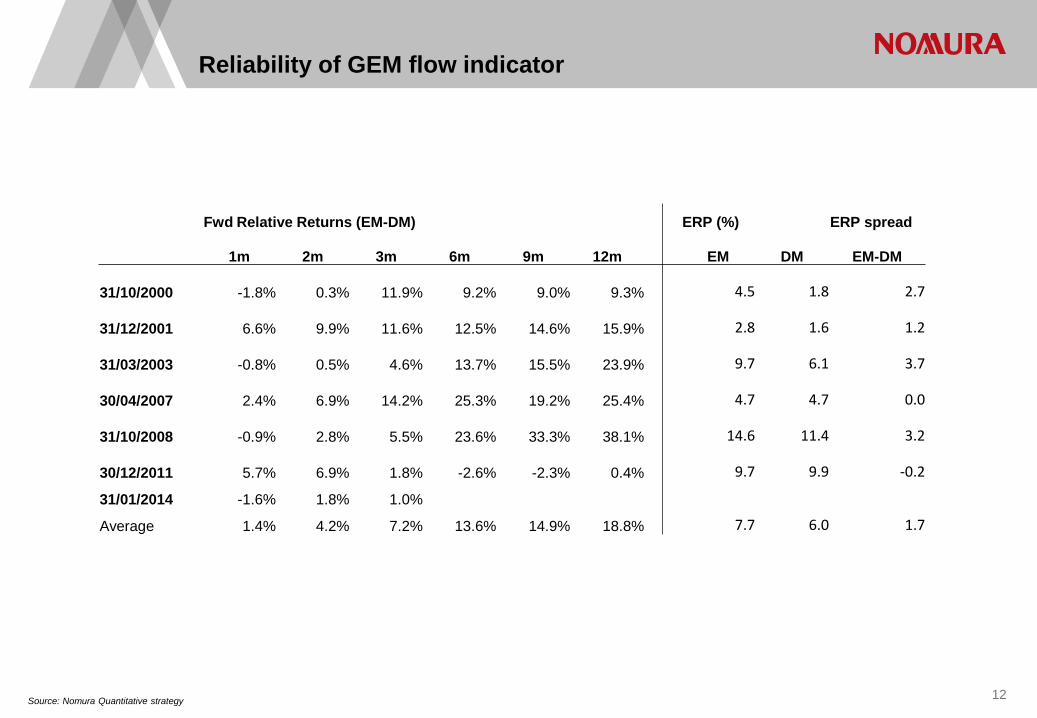
Reliability of GEM flow indicator
Fwd Relative Returns (EM-DM) ERP (%) ERP spread
1m 2m 3m 6m 9m 12m EM DM EM-DM
31/10/2000 -1.8% 0.3% 11.9% 9.2% 9.0% 9.3% 4.5 1.8 2.7
31/12/2001 6.6% 9.9% 11.6% 12.5% 14.6% 15.9% 2.8 1.6 1.2
31/03/2003 -0.8% 0.5% 4.6% 13.7% 15.5% 23.9% 9.7 6.1 3.7
30/04/2007 2.4% 6.9% 14.2% 25.3% 19.2% 25.4% 4.7 4.7 0.0
31/10/2008 -0.9% 2.8% 5.5% 23.6% 33.3% 38.1% 14.6 11.4 3.2
30/12/2011 5.7% 6.9% 1.8% -2.6% -2.3% 0.4% 9.7 9.9 -0.2
31/01/2014 -1.6% 1.8% 1.0%
Average 1.4% 4.2% 7.2% 13.6% 14.9% 18.8% 7.7 6.0 1.7
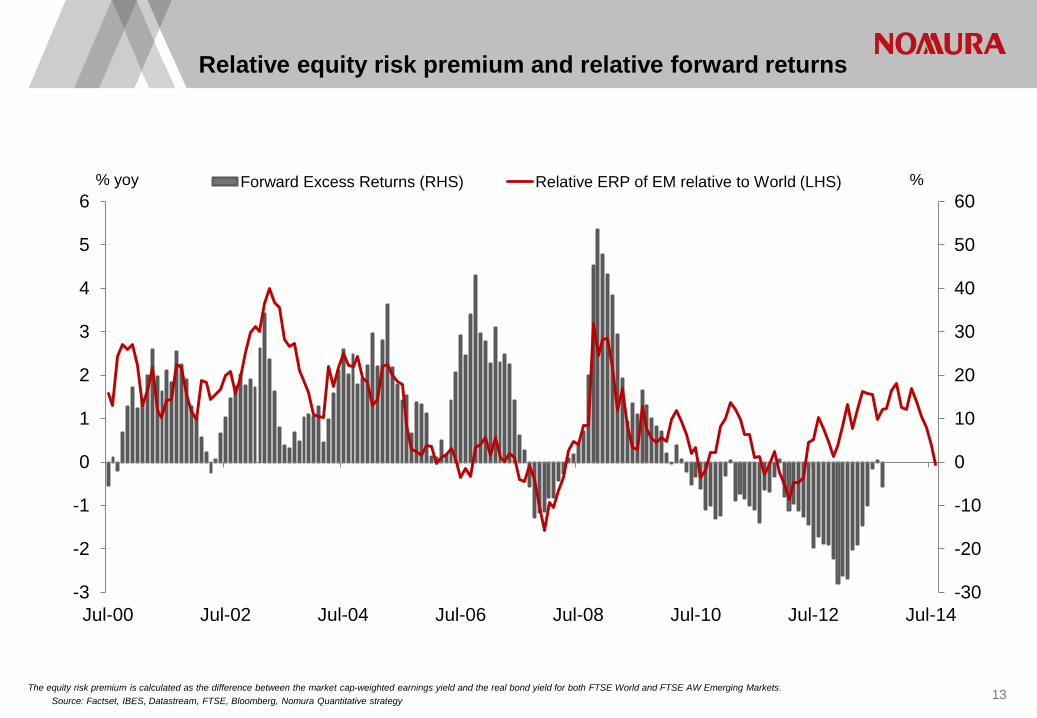
13 The equity risk premium is calculated as the difference between the market cap-weighted earnings yield and the real bond yield for both FTSE World and FTSE AW Emerging Markets. Source: Factset, IBES, Datastream, FTSE, Bloomberg, Nomura Quantitative strategy
Relative equity risk premium and relative forward returns
-30
-20
-10
0
10
20
30
40
50
60
-3
-2
-1
0
1
2
3
4
5
6
Jul-00 Jul-02 Jul-04 Jul-06 Jul-08 Jul-10 Jul-12 Jul-14
% % yoy Forward Excess Returns (RHS) Relative ERP of EM relative to World (LHS)

0.1
0.2
0.3
0.4
0.5
0.6
0.7
Sep-
05
Mar
-06
Sep-
06
Mar
-07
Sep-
07
Mar
-08
Sep-
08
Mar
-09
Sep-
09
Mar
-10
Sep-
10
Mar
-11
Sep-
11
Mar
-12
Sep-
12
Mar
-13
Sep-
13
Mar
-14
Sep-
14
Correlation coefficient
Weekly average of absolute pairwise-correlations between returns of different asset classes over a 90-day rolling window. Asset classes considered - FTSE World Index (proxy for developed equities), FTSE EM Index (proxy for EM equities), dollar spot, gold spot, US govt. 10y bond, commodity index, credit spread indices (investment grade and high yield). Source: Nomura Quantitative strategy
14
Multi-asset correlation (90 day) Index volatility - Factor volatility (Global)
Chart shows 75 day rolling realised volatility of the FTSE World index less the average 75-day rolling volatility of Value, Growth, Momentum, Risk and Quality for a global universe. Note that the underlying factor indices are long-short $-neutral. Source: Nomura Quantitative strategy
-4
-3
-2
-1
0
1
2
3
4
5
6
Jan-
12
Mar
-12
May
-12
Jul-1
2
Sep-
12
Nov
-12
Jan-
13
Mar
-13
May
-13
Jul-1
3
Sep-
13
Nov
-13
Jan-
14
Mar
-14
May
-14
Jul-1
4
Sep-
14
%

Are earnings growing in Europe?
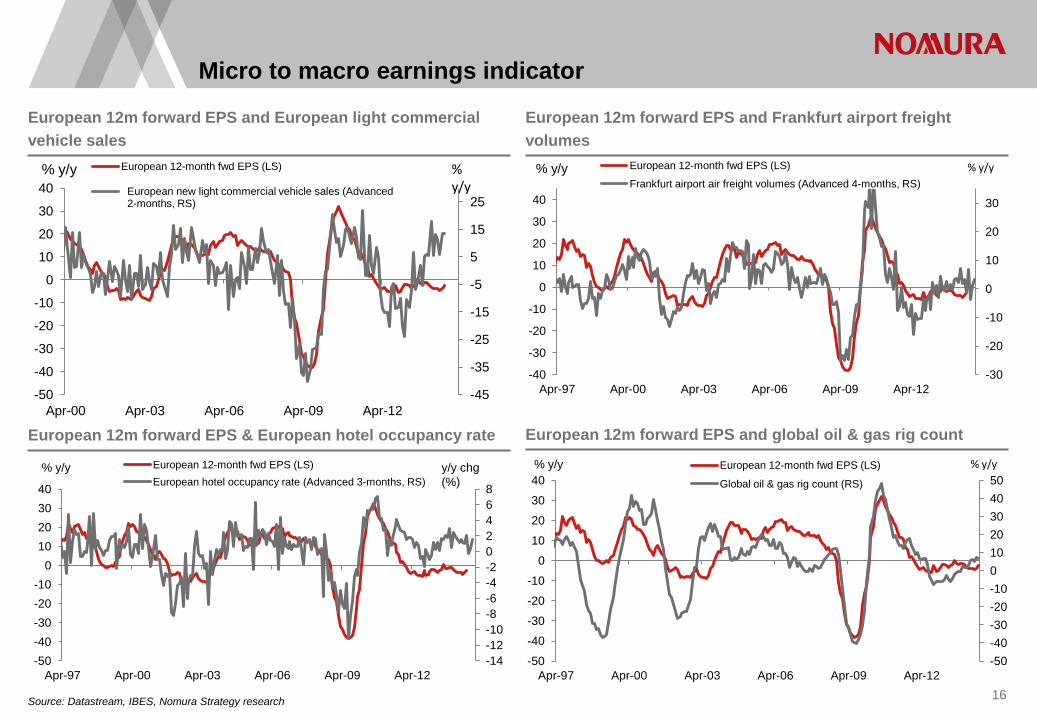
Source: Datastream, IBES, Nomura Strategy research 16
European 12m forward EPS and European light commercial vehicle sales
European 12m forward EPS and Frankfurt airport freight volumes
European 12m forward EPS & European hotel occupancy rate European 12m forward EPS and global oil & gas rig count
Micro to macro earnings indicator
-30
-20
-10
0
10
20
30
-40
-30
-20
-10
0
10
20
30
40
Apr-97 Apr-00 Apr-03 Apr-06 Apr-09 Apr-12
European 12-month fwd EPS (LS)
Frankfurt airport air freight volumes (Advanced 4-months, RS) % y/y % y/y
-14 -12 -10 -8 -6 -4 -2 0 2 4 6 8
-50 -40 -30 -20 -10
0 10 20 30 40
Apr-97 Apr-00 Apr-03 Apr-06 Apr-09 Apr-12
European 12-month fwd EPS (LS) European hotel occupancy rate (Advanced 3-months, RS)
% y/y y/y chg (%)
-50 -40 -30 -20 -10 0 10 20 30 40 50
-50
-40
-30
-20
-10
0
10
20
30
40
Apr-97 Apr-00 Apr-03 Apr-06 Apr-09 Apr-12
European 12-month fwd EPS (LS)
Global oil & gas rig count (RS)
% y/y % y/y
-45
-35
-25
-15
-5
5
15
25
-50
-40
-30
-20
-10
0
10
20
30
40
Apr-00 Apr-03 Apr-06 Apr-09 Apr-12
European 12-month fwd EPS (LS)
European new light commercial vehicle sales (Advanced 2-months, RS)
% y/y % y/y
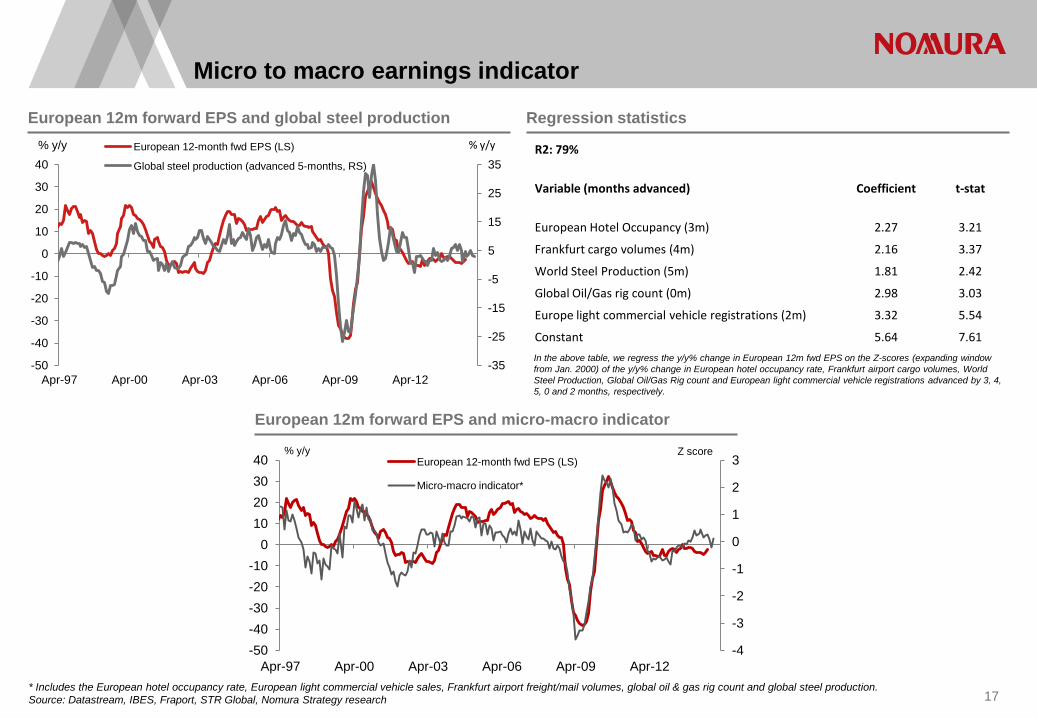
* Includes the European hotel occupancy rate, European light commercial vehicle sales, Frankfurt airport freight/mail volumes, global oil & gas rig count and global steel production. Source: Datastream, IBES, Fraport, STR Global, Nomura Strategy research
European 12m forward EPS and global steel production Regression statistics
R2: 79%
Variable (months advanced) Coefficient t-stat
European Hotel Occupancy (3m) 2.27 3.21
Frankfurt cargo volumes (4m) 2.16 3.37
World Steel Production (5m) 1.81 2.42
Global Oil/Gas rig count (0m) 2.98 3.03
Europe light commercial vehicle registrations (2m) 3.32 5.54
Constant 5.64 7.61 In the above table, we regress the y/y% change in European 12m fwd EPS on the Z-scores (expanding window from Jan. 2000) of the y/y% change in European hotel occupancy rate, Frankfurt airport cargo volumes, World Steel Production, Global Oil/Gas Rig count and European light commercial vehicle registrations advanced by 3, 4, 5, 0 and 2 months, respectively.
European 12m forward EPS and micro-macro indicator
17
Micro to macro earnings indicator
-4
-3
-2
-1
0
1
2
3
-50 -40 -30 -20 -10
0 10 20 30 40
Apr-97 Apr-00 Apr-03 Apr-06 Apr-09 Apr-12
Z score % y/y European 12-month fwd EPS (LS)
Micro-macro indicator*
-35
-25
-15
-5
5
15
25
35
-50
-40
-30
-20
-10
0
10
20
30
40
Apr-97 Apr-00 Apr-03 Apr-06 Apr-09 Apr-12
European 12-month fwd EPS (LS)
Global steel production (advanced 5-months, RS)
% y/y % y/y
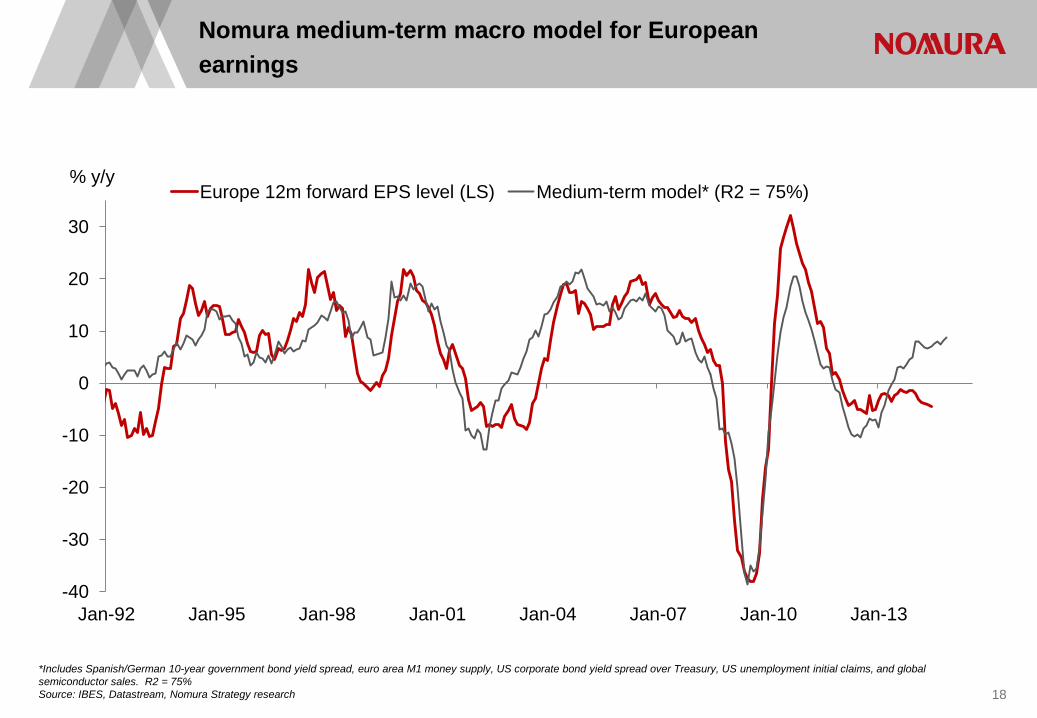
Nomura medium-term macro model for European earnings
18
*Includes Spanish/German 10-year government bond yield spread, euro area M1 money supply, US corporate bond yield spread over Treasury, US unemployment initial claims, and global semiconductor sales. R2 = 75% Source: IBES, Datastream, Nomura Strategy research
-40
-30
-20
-10
0
10
20
30
Jan-92 Jan-95 Jan-98 Jan-01 Jan-04 Jan-07 Jan-10 Jan-13
% y/y Europe 12m forward EPS level (LS) Medium-term model* (R2 = 75%)
19
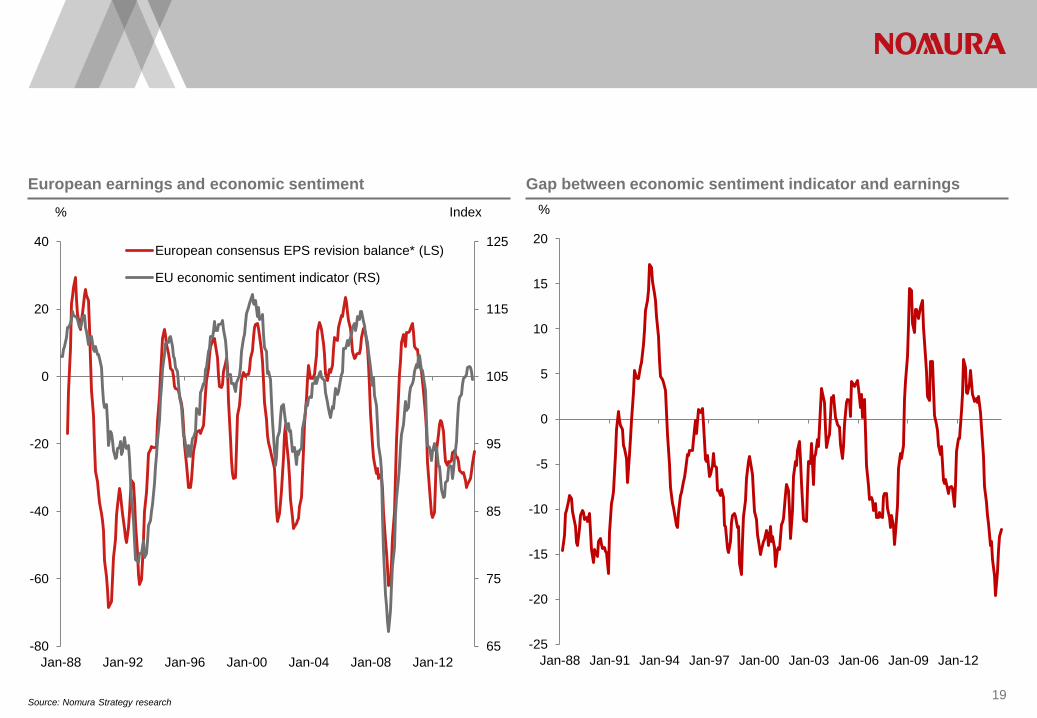
European earnings and economic sentiment Gap between economic sentiment indicator and earnings
Source: Nomura Strategy research
-25
-20
-15
-10
-5
0
5
10
15
20
Jan-88 Jan-91 Jan-94 Jan-97 Jan-00 Jan-03 Jan-06 Jan-09 Jan-12
%
65
75
85
95
105
115
125
-80
-60
-40
-20
0
20
40
Jan-88 Jan-92 Jan-96 Jan-00 Jan-04 Jan-08 Jan-12
European consensus EPS revision balance* (LS)
EU economic sentiment indicator (RS)
% Index
Source: Nomura Strategy research 20
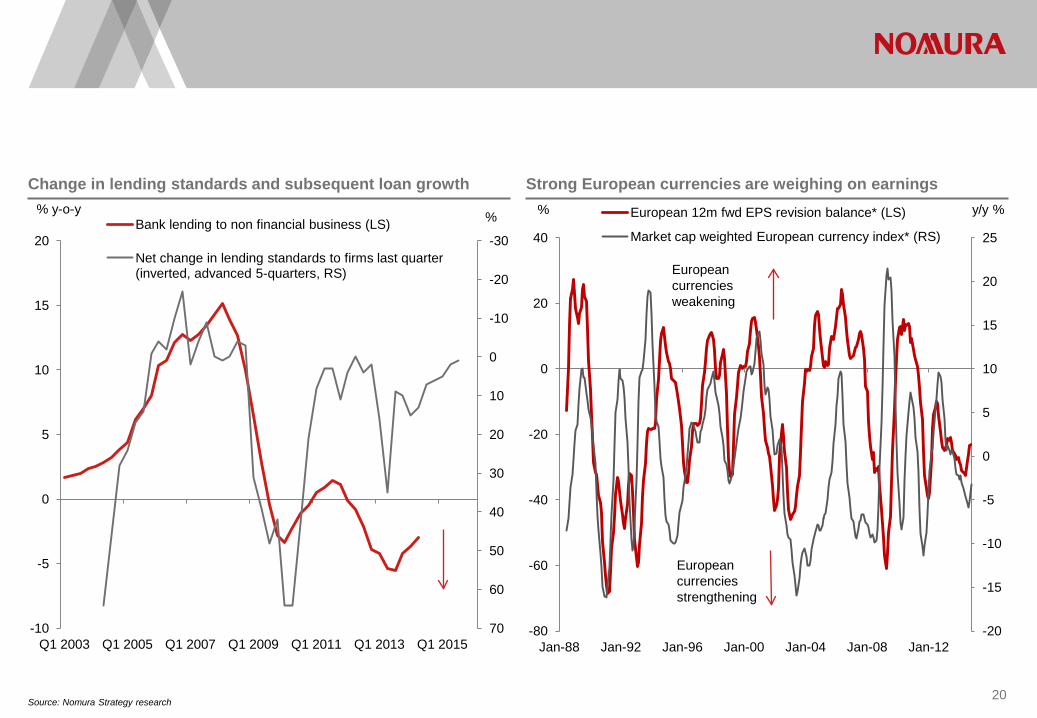
Change in lending standards and subsequent loan growth Strong European currencies are weighing on earnings
-30
-20
-10
0
10
20
30
40
50
60
70 -10
-5
0
5
10
15
20
Q1 2003 Q1 2005 Q1 2007 Q1 2009 Q1 2011 Q1 2013 Q1 2015
% % y-o-y Bank lending to non financial business (LS)
Net change in lending standards to firms last quarter (inverted, advanced 5-quarters, RS)
-20
-15
-10
-5
0
5
10
15
20
25
-80
-60
-40
-20
0
20
40
Jan-88 Jan-92 Jan-96 Jan-00 Jan-04 Jan-08 Jan-12
y/y % % European 12m fwd EPS revision balance* (LS)
Market cap weighted European currency index* (RS)
European currencies strengthening
European currencies weakening
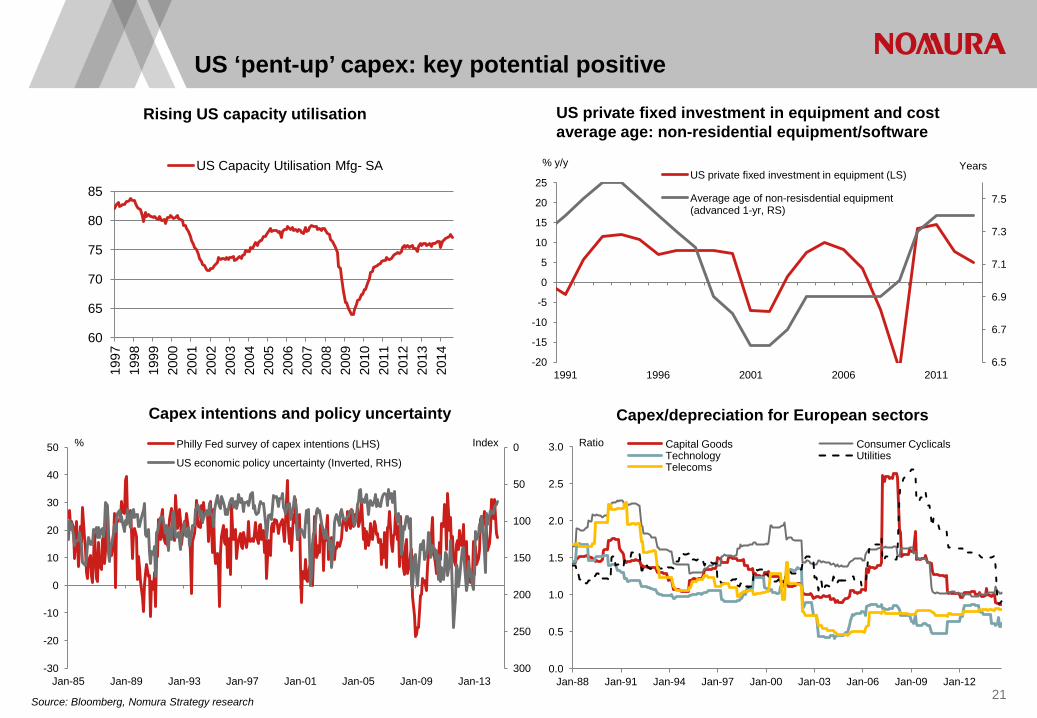
US ‘pent-up’ capex: key potential positive
Source: Bloomberg, Nomura Strategy research
Rising US capacity utilisation US private fixed investment in equipment and cost average age: non-residential equipment/software
21
6.5
6.7
6.9
7.1
7.3
7.5
-20
-15
-10
-5
0
5
10
15
20
25
1991 1996 2001 2006 2011
US private fixed investment in equipment (LS)
Average age of non-resisdential equipment (advanced 1-yr, RS)
Years % y/y
0
50
100
150
200
250
300 -30
-20
-10
0
10
20
30
40
50
Jan-85 Jan-89 Jan-93 Jan-97 Jan-01 Jan-05 Jan-09 Jan-13
Index % Philly Fed survey of capex intentions (LHS)
US economic policy uncertainty (Inverted, RHS)
0.0
0.5
1.0
1.5
2.0
2.5
3.0
Jan-88 Jan-91 Jan-94 Jan-97 Jan-00 Jan-03 Jan-06 Jan-09 Jan-12
Ratio Capital Goods Consumer Cyclicals Technology Utilities Telecoms
Capex/depreciation for European sectors Capex intentions and policy uncertainty
60
65
70
75
80
85
1997
19
98
1999
20
00
2001
20
02
2003
20
04
2005
20
06
2007
20
08
2009
20
10
2011
20
12
2013
20
14
US Capacity Utilisation Mfg- SA
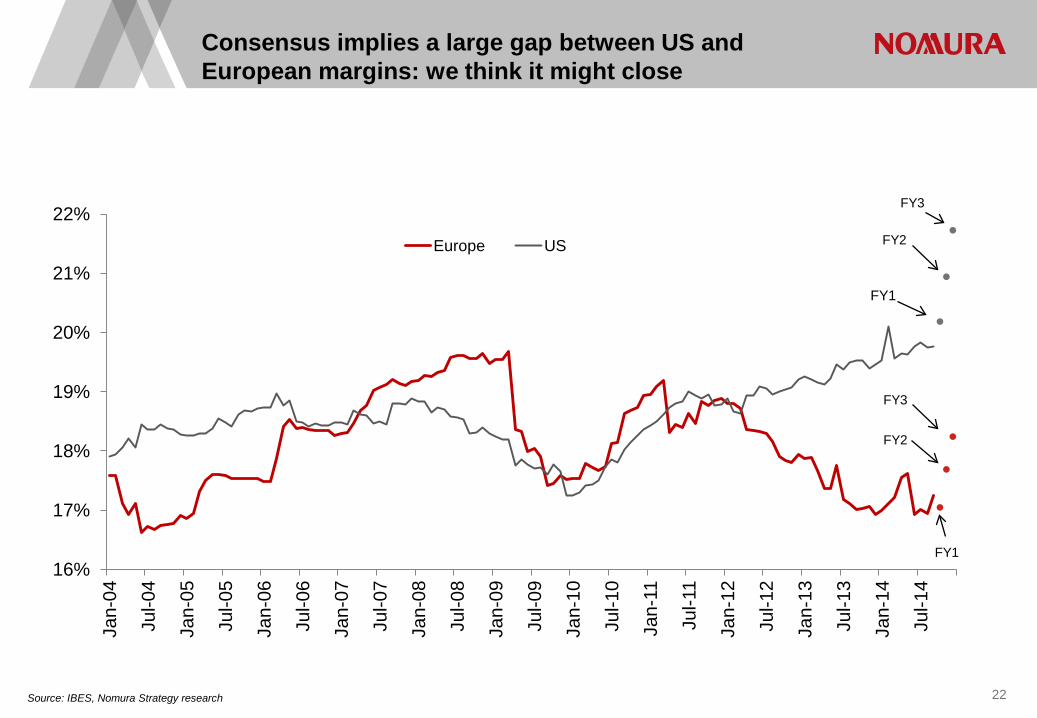
Consensus implies a large gap between US and European margins: we think it might close
22
16%
17%
18%
19%
20%
21%
22%
Jan-
04
Jul-0
4
Jan-
05
Jul-0
5
Jan-
06
Jul-0
6
Jan-
07
Jul-0
7
Jan-
08
Jul-0
8
Jan-
09
Jul-0
9
Jan-
10
Jul-1
0
Jan-
11
Jul-1
1
Jan-
12
Jul-1
2
Jan-
13
Jul-1
3
Jan-
14
Jul-1
4
Europe US FY2
FY3
FY1
FY2
FY3
FY1
Source: IBES, Nomura Strategy research
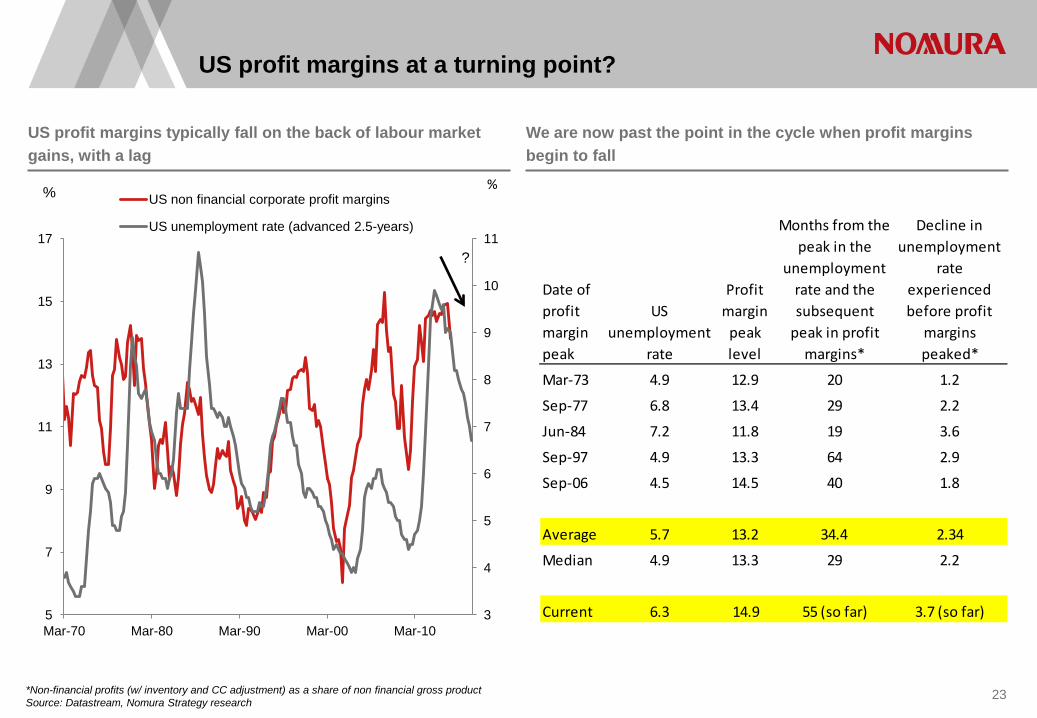
US profit margins at a turning point?
US profit margins typically fall on the back of labour market gains, with a lag
We are now past the point in the cycle when profit margins begin to fall
*Non-financial profits (w/ inventory and CC adjustment) as a share of non financial gross product Source: Datastream, Nomura Strategy research
23
3
4
5
6
7
8
9
10
11
5
7
9
11
13
15
17
Mar-70 Mar-80 Mar-90 Mar-00 Mar-10
US non financial corporate profit margins
US unemployment rate (advanced 2.5-years)
?
% %
Date of profit margin peak
US unemployment
rate
Profit margin
peak level
Months from the peak in the
unemployment rate and the subsequent
peak in profit margins*
Decline in unemployment
rate experienced before profit
margins peaked*
Mar-73 4.9 12.9 20 1.2
Sep-77 6.8 13.4 29 2.2
Jun-84 7.2 11.8 19 3.6
Sep-97 4.9 13.3 64 2.9
Sep-06 4.5 14.5 40 1.8
Average 5.7 13.2 34.4 2.34
Median 4.9 13.3 29 2.2
Current 6.3 14.9 55 (so far) 3.7 (so far)

Factor allocation and global quant equity portfolio
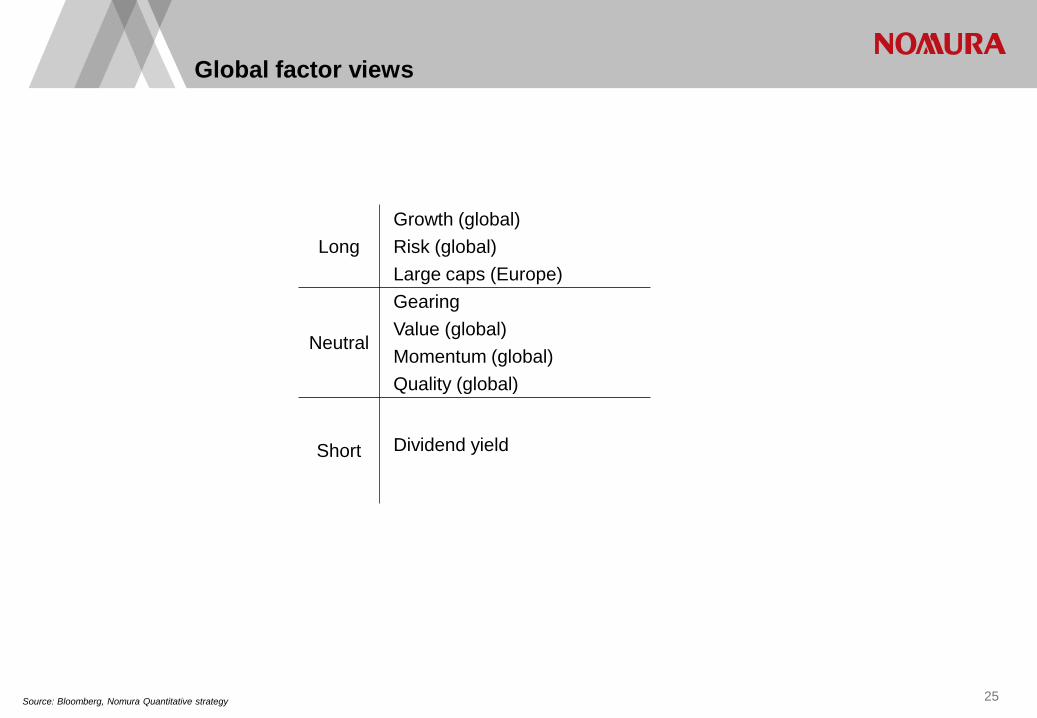
Global factor views
Source: Bloomberg, Nomura Quantitative strategy 25
Long Growth (global) Risk (global) Large caps (Europe)
Neutral
Gearing Value (global) Momentum (global) Quality (global)
Short
Dividend yield
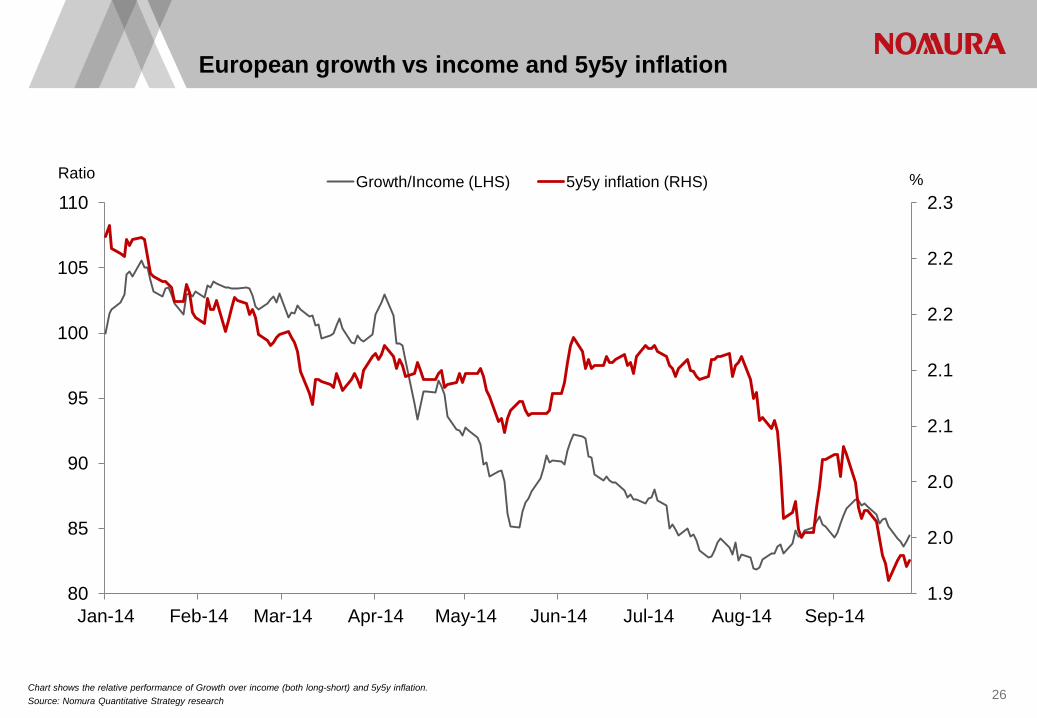
Chart shows the relative performance of Growth over income (both long-short) and 5y5y inflation. Source: Nomura Quantitative Strategy research
European growth vs income and 5y5y inflation
1.9
2.0
2.0
2.1
2.1
2.2
2.2
2.3
80
85
90
95
100
105
110
Jan-14 Feb-14 Mar-14 Apr-14 May-14 Jun-14 Jul-14 Aug-14 Sep-14
% Ratio Growth/Income (LHS) 5y5y inflation (RHS)
26
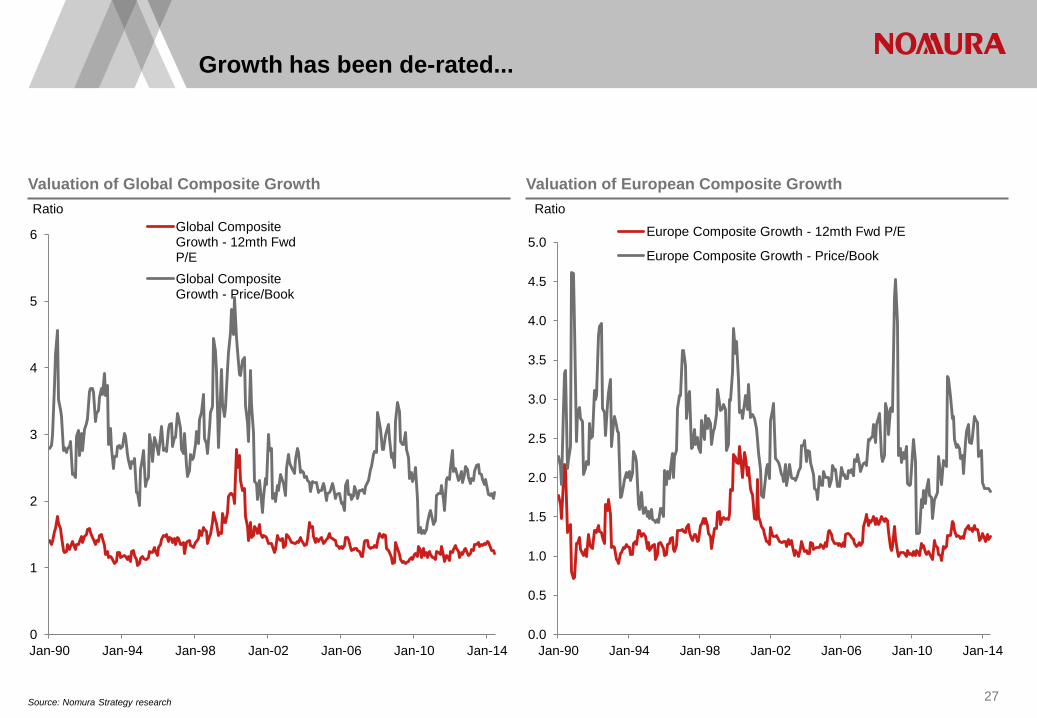
Growth has been de-rated...
Source: Nomura Strategy research
Valuation of Global Composite Growth Valuation of European Composite Growth
0
1
2
3
4
5
6
Jan-90 Jan-94 Jan-98 Jan-02 Jan-06 Jan-10 Jan-14
Ratio Global Composite Growth - 12mth Fwd P/E Global Composite Growth - Price/Book
0.0
0.5
1.0
1.5
2.0
2.5
3.0
3.5
4.0
4.5
5.0
Jan-90 Jan-94 Jan-98 Jan-02 Jan-06 Jan-10 Jan-14
Ratio
Europe Composite Growth - 12mth Fwd P/E
Europe Composite Growth - Price/Book
27
28
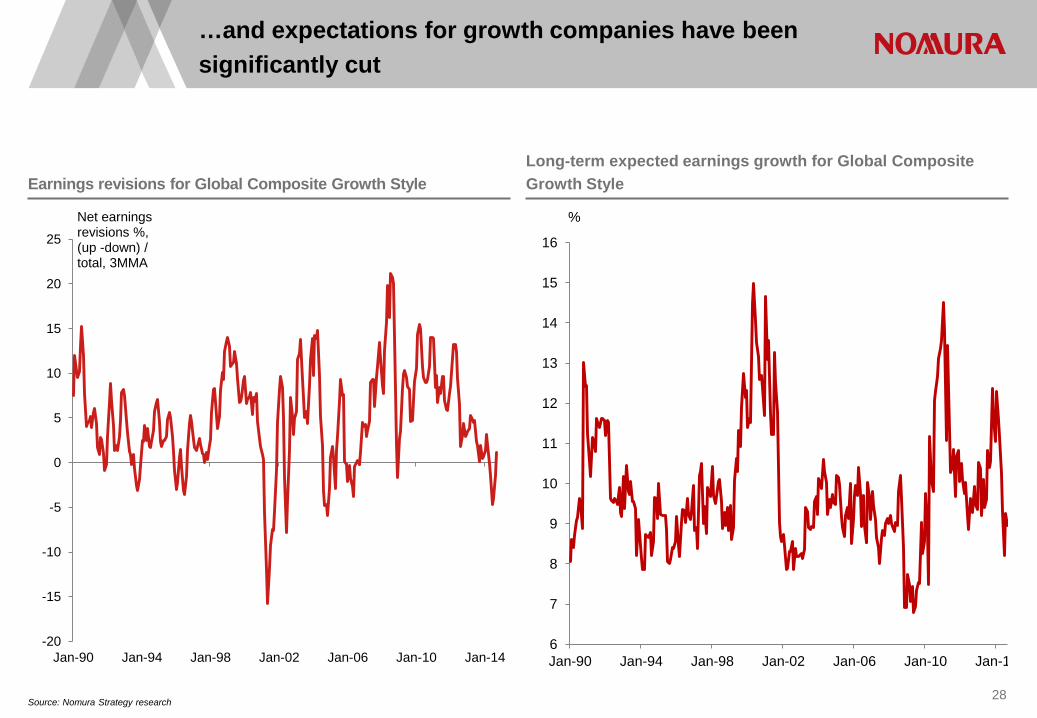
Earnings revisions for Global Composite Growth Style Long-term expected earnings growth for Global Composite Growth Style
6
7
8
9
10
11
12
13
14
15
16
Jan-90 Jan-94 Jan-98 Jan-02 Jan-06 Jan-10 Jan-1
%
Source: Nomura Strategy research
…and expectations for growth companies have been significantly cut
-20
-15
-10
-5
0
5
10
15
20
25
Jan-90 Jan-94 Jan-98 Jan-02 Jan-06 Jan-10 Jan-14
Net earnings revisions %, (up -down) / total, 3MMA
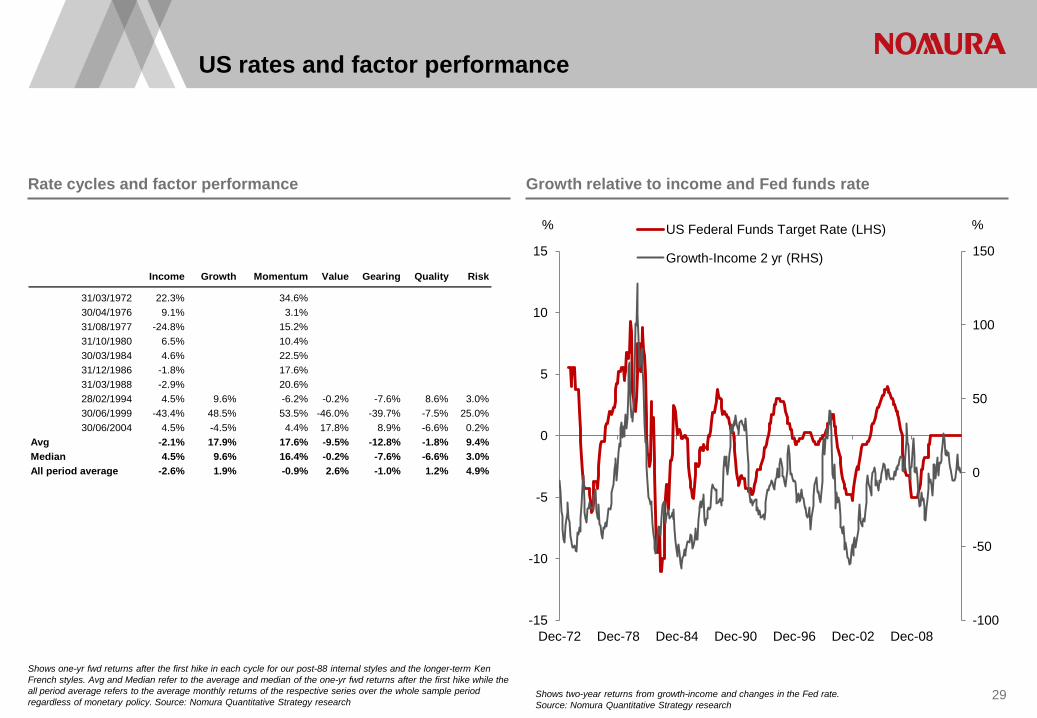
US rates and factor performance
Shows one-yr fwd returns after the first hike in each cycle for our post-88 internal styles and the longer-term Ken French styles. Avg and Median refer to the average and median of the one-yr fwd returns after the first hike while the all period average refers to the average monthly returns of the respective series over the whole sample period regardless of monetary policy. Source: Nomura Quantitative Strategy research 29
Rate cycles and factor performance Growth relative to income and Fed funds rate
Income Growth Momentum Value Gearing Quality Risk
31/03/1972 22.3% 34.6%30/04/1976 9.1% 3.1%31/08/1977 -24.8% 15.2%31/10/1980 6.5% 10.4%30/03/1984 4.6% 22.5%31/12/1986 -1.8% 17.6%31/03/1988 -2.9% 20.6%28/02/1994 4.5% 9.6% -6.2% -0.2% -7.6% 8.6% 3.0%30/06/1999 -43.4% 48.5% 53.5% -46.0% -39.7% -7.5% 25.0%30/06/2004 4.5% -4.5% 4.4% 17.8% 8.9% -6.6% 0.2%
Avg -2.1% 17.9% 17.6% -9.5% -12.8% -1.8% 9.4%Median 4.5% 9.6% 16.4% -0.2% -7.6% -6.6% 3.0%All period average -2.6% 1.9% -0.9% 2.6% -1.0% 1.2% 4.9%
-100
-50
0
50
100
150
-15
-10
-5
0
5
10
15
Dec-72 Dec-78 Dec-84 Dec-90 Dec-96 Dec-02 Dec-08
% % US Federal Funds Target Rate (LHS)
Growth-Income 2 yr (RHS)
Shows two-year returns from growth-income and changes in the Fed rate. Source: Nomura Quantitative Strategy research
US rates and factor performance
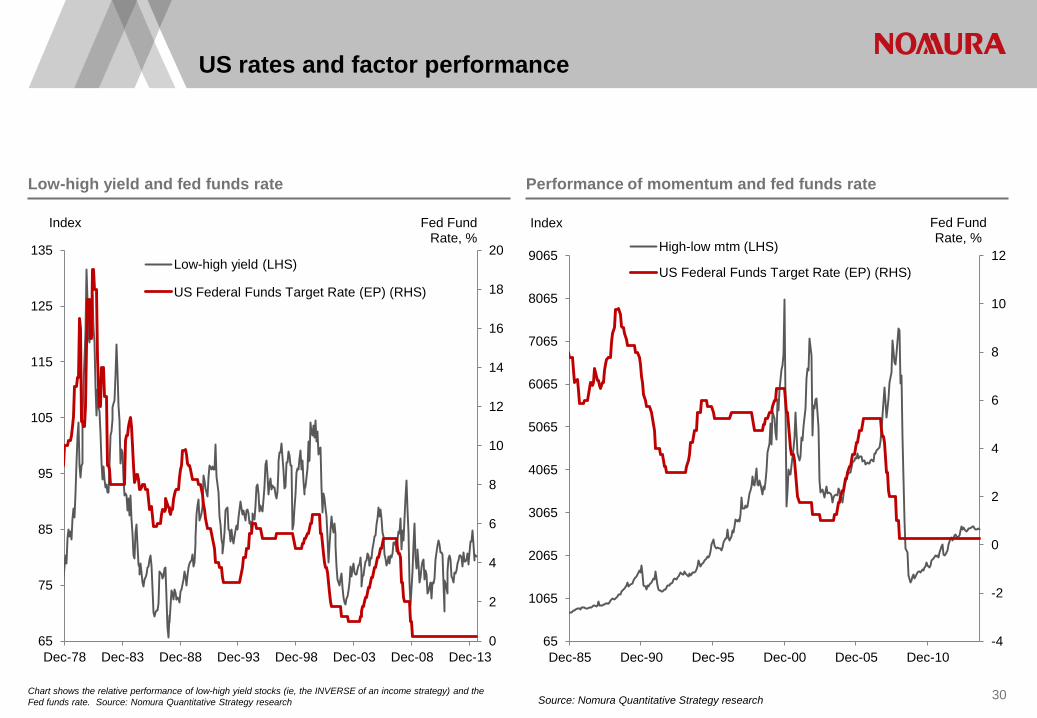
Chart shows the relative performance of low-high yield stocks (ie, the INVERSE of an income strategy) and the Fed funds rate. Source: Nomura Quantitative Strategy research 30
Low-high yield and fed funds rate Performance of momentum and fed funds rate
0
2
4
6
8
10
12
14
16
18
20
65
75
85
95
105
115
125
135
Dec-78 Dec-83 Dec-88 Dec-93 Dec-98 Dec-03 Dec-08 Dec-13
Fed Fund Rate, %
Index
Low-high yield (LHS)
US Federal Funds Target Rate (EP) (RHS)
-4
-2
0
2
4
6
8
10
12
65
1065
2065
3065
4065
5065
6065
7065
8065
9065
Dec-85 Dec-90 Dec-95 Dec-00 Dec-05 Dec-10
Fed Fund Rate, %
Index
High-low mtm (LHS)
US Federal Funds Target Rate (EP) (RHS)
Source: Nomura Quantitative Strategy research
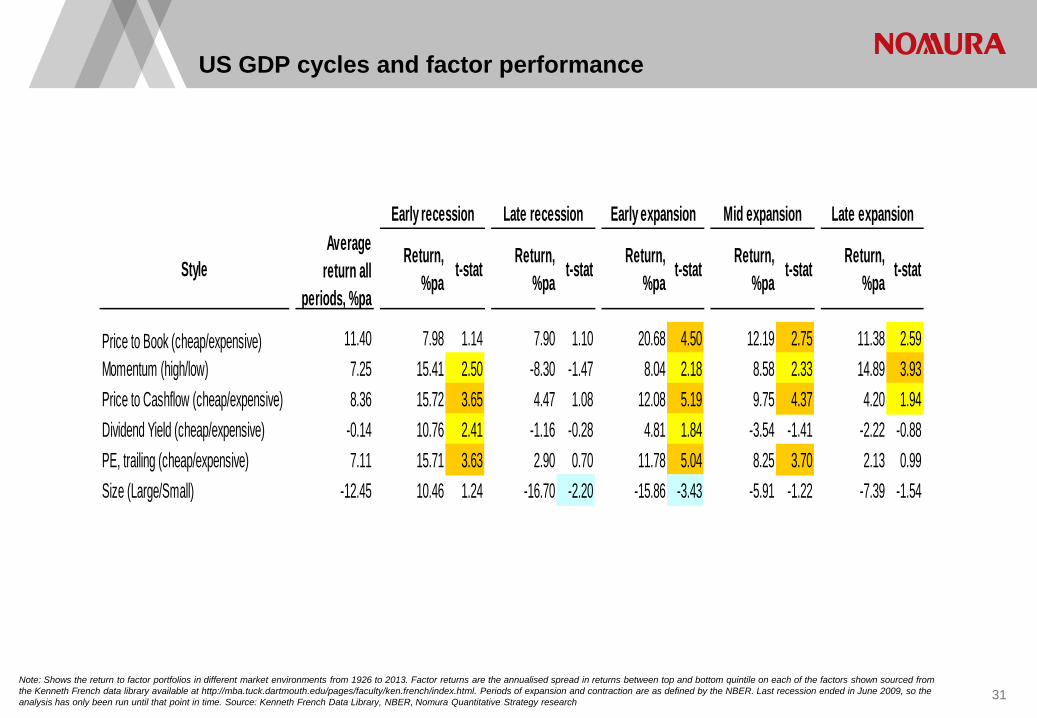
US GDP cycles and factor performance
31 Note: Shows the return to factor portfolios in different market environments from 1926 to 2013. Factor returns are the annualised spread in returns between top and bottom quintile on each of the factors shown sourced from the Kenneth French data library available at http://mba.tuck.dartmouth.edu/pages/faculty/ken.french/index.html. Periods of expansion and contraction are as defined by the NBER. Last recession ended in June 2009, so the analysis has only been run until that point in time. Source: Kenneth French Data Library, NBER, Nomura Quantitative Strategy research
StyleAverage
return all periods, %pa
Return, %pa t-stat Return,
%pa t-stat Return, %pa t-stat Return,
%pa t-stat Return, %pa t-stat
Price to Book (cheap/expensive) 11.40 7.98 1.14 7.90 1.10 20.68 4.50 12.19 2.75 11.38 2.59Momentum (high/low) 7.25 15.41 2.50 -8.30 -1.47 8.04 2.18 8.58 2.33 14.89 3.93Price to Cashflow (cheap/expensive) 8.36 15.72 3.65 4.47 1.08 12.08 5.19 9.75 4.37 4.20 1.94Dividend Yield (cheap/expensive) -0.14 10.76 2.41 -1.16 -0.28 4.81 1.84 -3.54 -1.41 -2.22 -0.88PE, trailing (cheap/expensive) 7.11 15.71 3.63 2.90 0.70 11.78 5.04 8.25 3.70 2.13 0.99Size (Large/Small) -12.45 10.46 1.24 -16.70 -2.20 -15.86 -3.43 -5.91 -1.22 -7.39 -1.54
Early recession Late recession Early expansion Mid expansion Late expansion
32
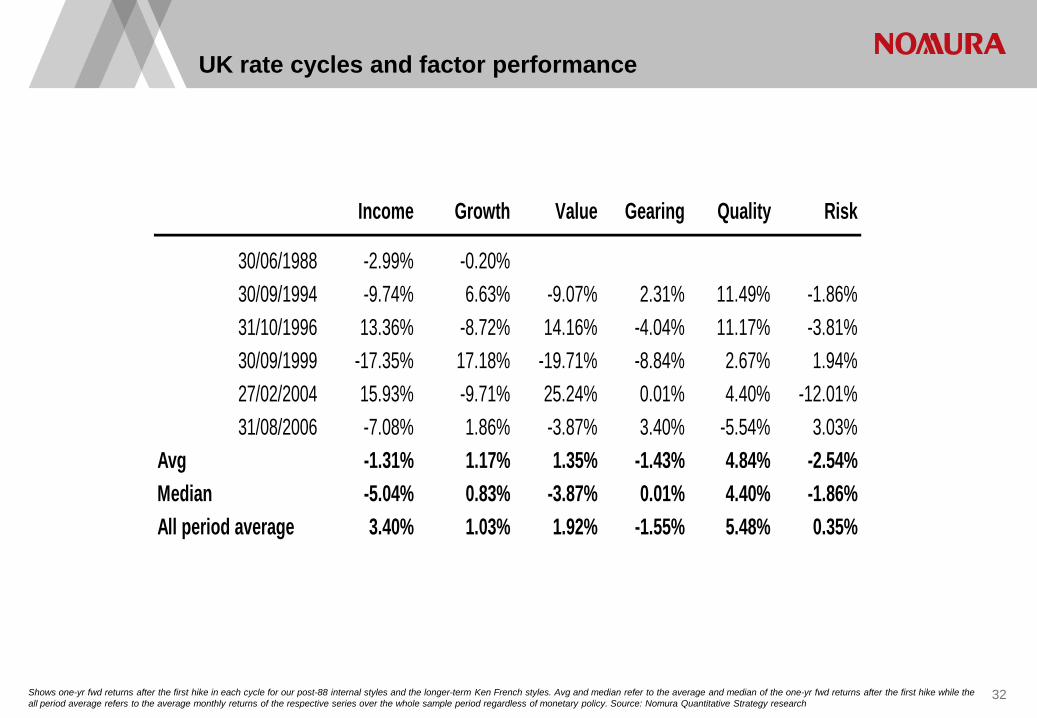
UK rate cycles and factor performance
Income Growth Value Gearing Quality Risk
30/06/1988 -2.99% -0.20%30/09/1994 -9.74% 6.63% -9.07% 2.31% 11.49% -1.86%31/10/1996 13.36% -8.72% 14.16% -4.04% 11.17% -3.81%30/09/1999 -17.35% 17.18% -19.71% -8.84% 2.67% 1.94%27/02/2004 15.93% -9.71% 25.24% 0.01% 4.40% -12.01%31/08/2006 -7.08% 1.86% -3.87% 3.40% -5.54% 3.03%
Avg -1.31% 1.17% 1.35% -1.43% 4.84% -2.54%Median -5.04% 0.83% -3.87% 0.01% 4.40% -1.86%All period average 3.40% 1.03% 1.92% -1.55% 5.48% 0.35%
Shows one-yr fwd returns after the first hike in each cycle for our post-88 internal styles and the longer-term Ken French styles. Avg and median refer to the average and median of the one-yr fwd returns after the first hike while the all period average refers to the average monthly returns of the respective series over the whole sample period regardless of monetary policy. Source: Nomura Quantitative Strategy research
33 Source: Nomura Quantitative Strategy research
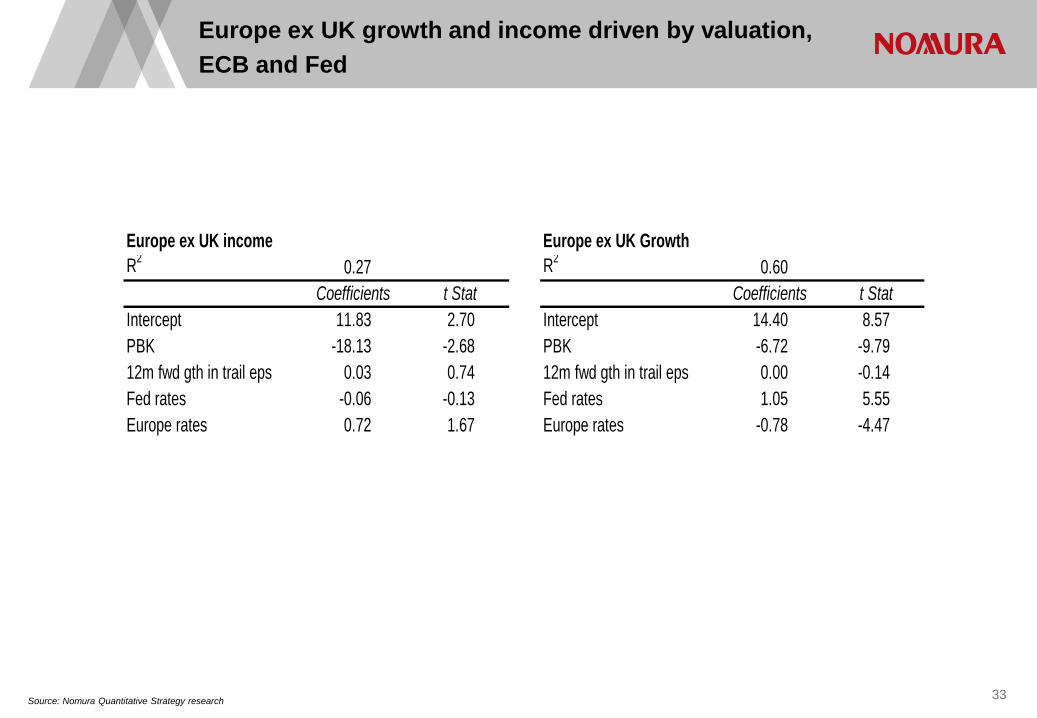
Europe ex UK growth and income driven by valuation, ECB and Fed
Europe ex UK income Europe ex UK GrowthR2 0.27 R2 0.60
Intercept 11.83 2.70 Intercept 14.40 8.57PBK -18.13 -2.68 PBK -6.72 -9.7912m fwd gth in trail eps 0.03 0.74 12m fwd gth in trail eps 0.00 -0.14Fed rates -0.06 -0.13 Fed rates 1.05 5.55Europe rates 0.72 1.67 Europe rates -0.78 -4.47
Coefficients Coefficientst Stat t Stat
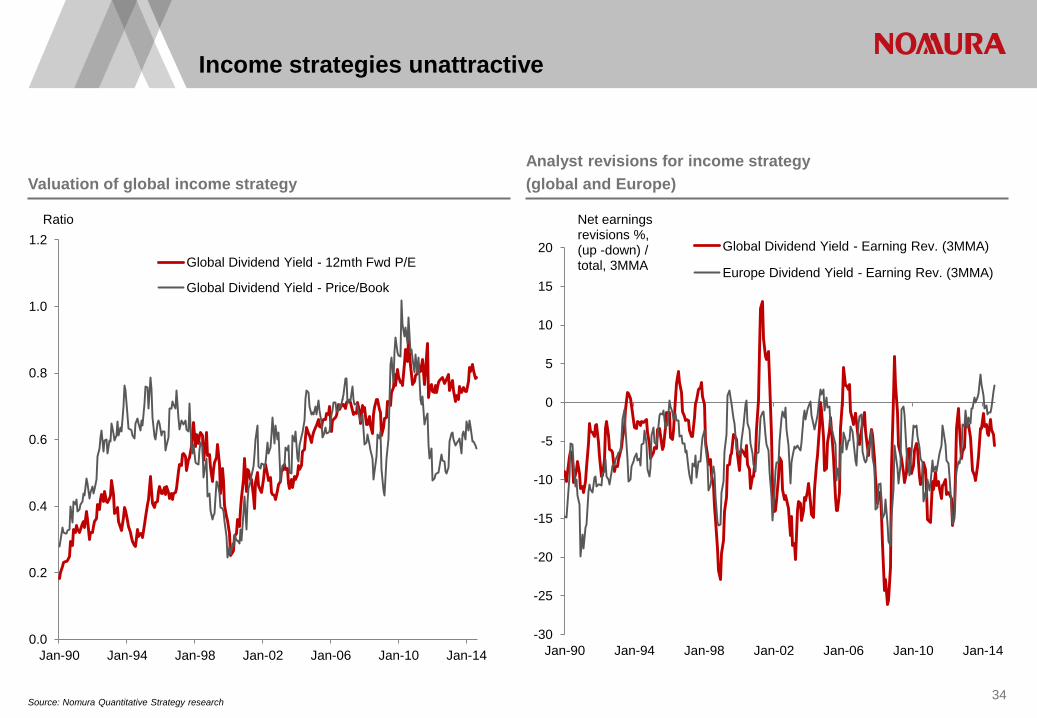
Income strategies unattractive
Source: Nomura Quantitative Strategy research 34
Valuation of global income strategy Analyst revisions for income strategy (global and Europe)
0.0
0.2
0.4
0.6
0.8
1.0
1.2
Jan-90 Jan-94 Jan-98 Jan-02 Jan-06 Jan-10 Jan-14
Ratio
Global Dividend Yield - 12mth Fwd P/E
Global Dividend Yield - Price/Book
-30
-25
-20
-15
-10
-5
0
5
10
15
20
Jan-90 Jan-94 Jan-98 Jan-02 Jan-06 Jan-10 Jan-14
Net earnings revisions %, (up -down) / total, 3MMA
Global Dividend Yield - Earning Rev. (3MMA)
Europe Dividend Yield - Earning Rev. (3MMA)
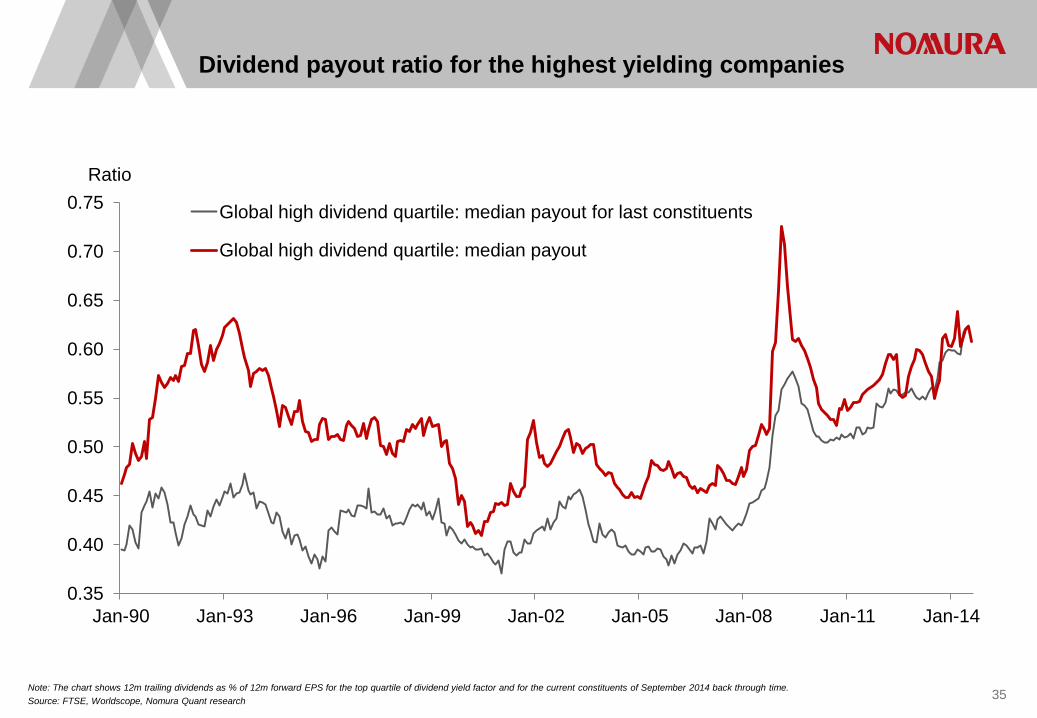
35 Note: The chart shows 12m trailing dividends as % of 12m forward EPS for the top quartile of dividend yield factor and for the current constituents of September 2014 back through time. Source: FTSE, Worldscope, Nomura Quant research
Dividend payout ratio for the highest yielding companies
0.35
0.40
0.45
0.50
0.55
0.60
0.65
0.70
0.75
Jan-90 Jan-93 Jan-96 Jan-99 Jan-02 Jan-05 Jan-08 Jan-11 Jan-14
Ratio
Global high dividend quartile: median payout for last constituents
Global high dividend quartile: median payout
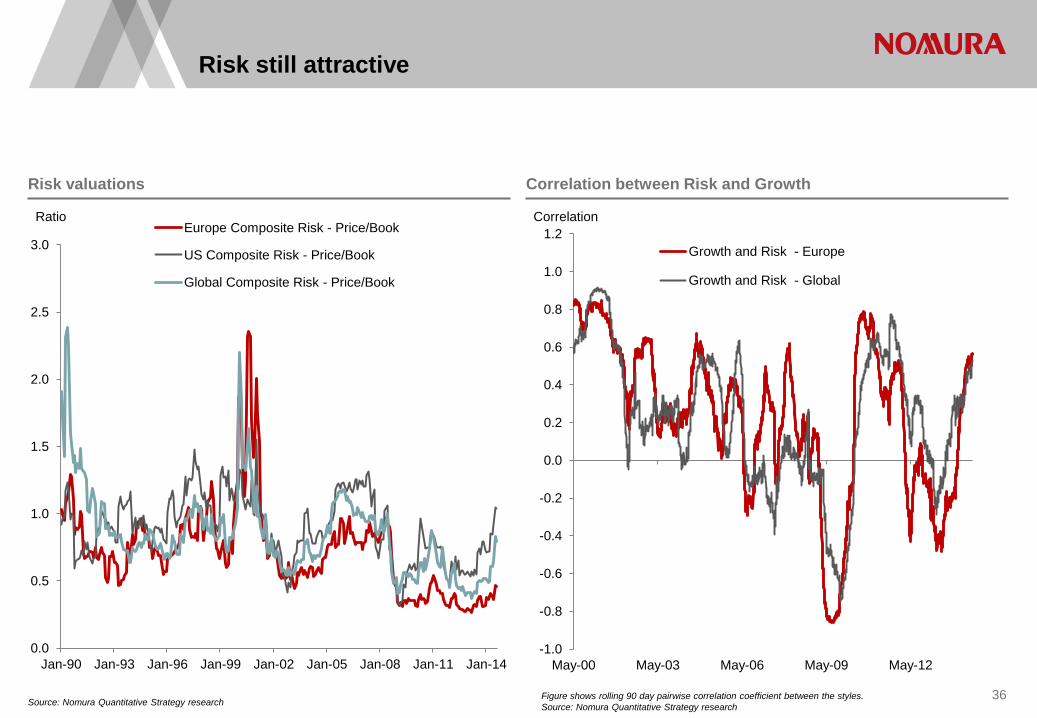
Source: Nomura Quantitative Strategy research 36
Risk valuations Correlation between Risk and Growth
0.0
0.5
1.0
1.5
2.0
2.5
3.0
Jan-90 Jan-93 Jan-96 Jan-99 Jan-02 Jan-05 Jan-08 Jan-11 Jan-14
Ratio Europe Composite Risk - Price/Book
US Composite Risk - Price/Book
Global Composite Risk - Price/Book
-1.0
-0.8
-0.6
-0.4
-0.2
0.0
0.2
0.4
0.6
0.8
1.0
1.2
May-00 May-03 May-06 May-09 May-12
Correlation
Growth and Risk - Europe
Growth and Risk - Global
Figure shows rolling 90 day pairwise correlation coefficient between the styles. Source: Nomura Quantitative Strategy research
Risk still attractive
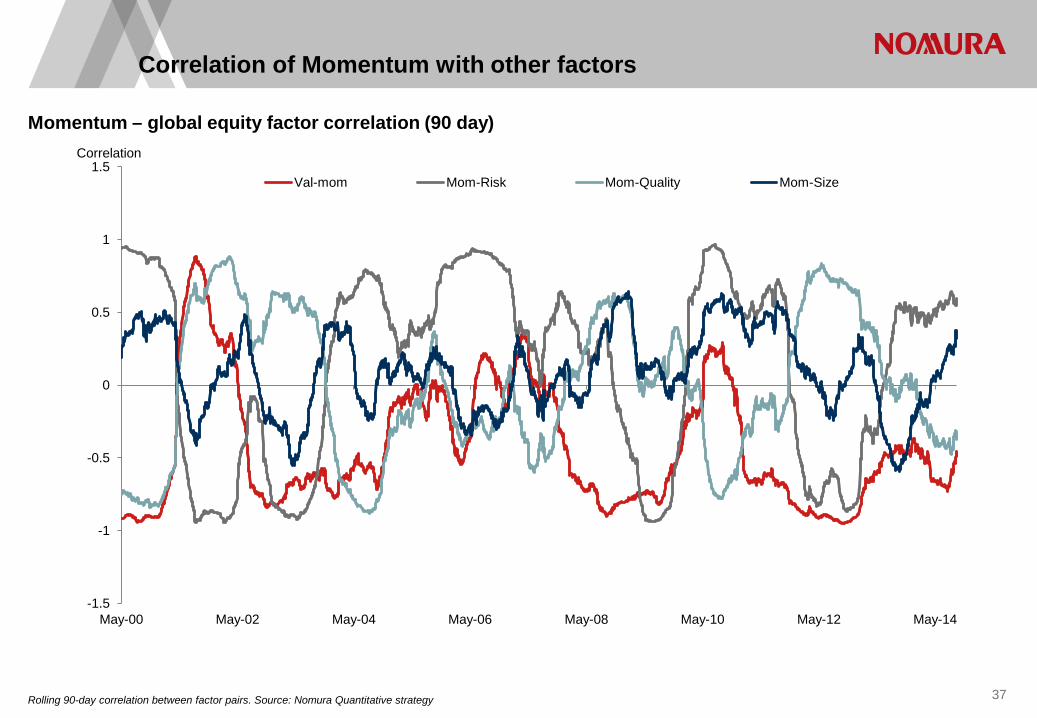
37 Rolling 90-day correlation between factor pairs. Source: Nomura Quantitative strategy
Correlation of Momentum with other factors
Momentum – global equity factor correlation (90 day)
-1.5
-1
-0.5
0
0.5
1
1.5
May-00 May-02 May-04 May-06 May-08 May-10 May-12 May-14
Correlation
Val-mom Mom-Risk Mom-Quality Mom-Size
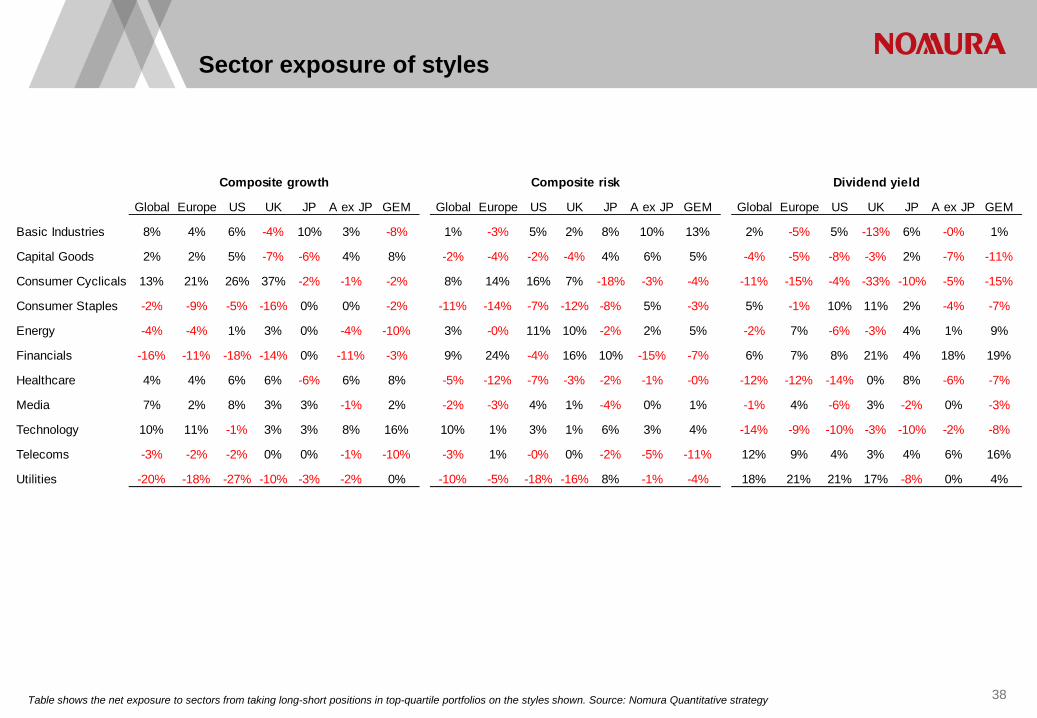
Table shows the net exposure to sectors from taking long-short positions in top-quartile portfolios on the styles shown. Source: Nomura Quantitative strategy
Sector exposure of styles
38
Global Europe US UK JP A ex JP GEM Global Europe US UK JP A ex JP GEM Global Europe US UK JP A ex JP GEM
Basic Industries 8% 4% 6% -4% 10% 3% -8% 1% -3% 5% 2% 8% 10% 13% 2% -5% 5% -13% 6% -0% 1%
Capital Goods 2% 2% 5% -7% -6% 4% 8% -2% -4% -2% -4% 4% 6% 5% -4% -5% -8% -3% 2% -7% -11%
Consumer Cyclicals 13% 21% 26% 37% -2% -1% -2% 8% 14% 16% 7% -18% -3% -4% -11% -15% -4% -33% -10% -5% -15%
Consumer Staples -2% -9% -5% -16% 0% 0% -2% -11% -14% -7% -12% -8% 5% -3% 5% -1% 10% 11% 2% -4% -7%
Energy -4% -4% 1% 3% 0% -4% -10% 3% -0% 11% 10% -2% 2% 5% -2% 7% -6% -3% 4% 1% 9%
Financials -16% -11% -18% -14% 0% -11% -3% 9% 24% -4% 16% 10% -15% -7% 6% 7% 8% 21% 4% 18% 19%
Healthcare 4% 4% 6% 6% -6% 6% 8% -5% -12% -7% -3% -2% -1% -0% -12% -12% -14% 0% 8% -6% -7%
Media 7% 2% 8% 3% 3% -1% 2% -2% -3% 4% 1% -4% 0% 1% -1% 4% -6% 3% -2% 0% -3%
Technology 10% 11% -1% 3% 3% 8% 16% 10% 1% 3% 1% 6% 3% 4% -14% -9% -10% -3% -10% -2% -8%
Telecoms -3% -2% -2% 0% 0% -1% -10% -3% 1% -0% 0% -2% -5% -11% 12% 9% 4% 3% 4% 6% 16%
Utilities -20% -18% -27% -10% -3% -2% 0% -10% -5% -18% -16% 8% -1% -4% 18% 21% 21% 17% -8% 0% 4%
Composite growth Composite risk Dividend yield
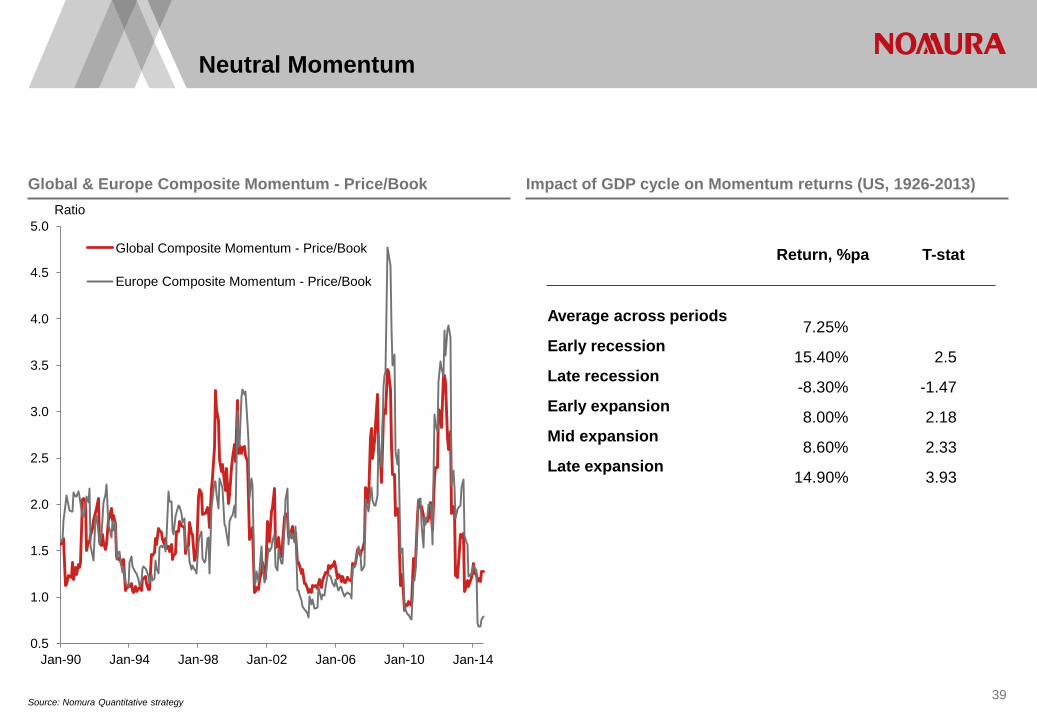
Neutral Momentum
Source: Nomura Quantitative strategy 39
Global & Europe Composite Momentum - Price/Book Impact of GDP cycle on Momentum returns (US, 1926-2013)
0.5
1.0
1.5
2.0
2.5
3.0
3.5
4.0
4.5
5.0
Jan-90 Jan-94 Jan-98 Jan-02 Jan-06 Jan-10 Jan-14
Ratio
Global Composite Momentum - Price/Book
Europe Composite Momentum - Price/Book
Return, %pa T-stat Average across periods
7.25% Early recession
15.40% 2.5 Late recession
-8.30% -1.47 Early expansion
8.00% 2.18 Mid expansion
8.60% 2.33 Late expansion
14.90% 3.93
40 Source: Nomura Quantitative strategy
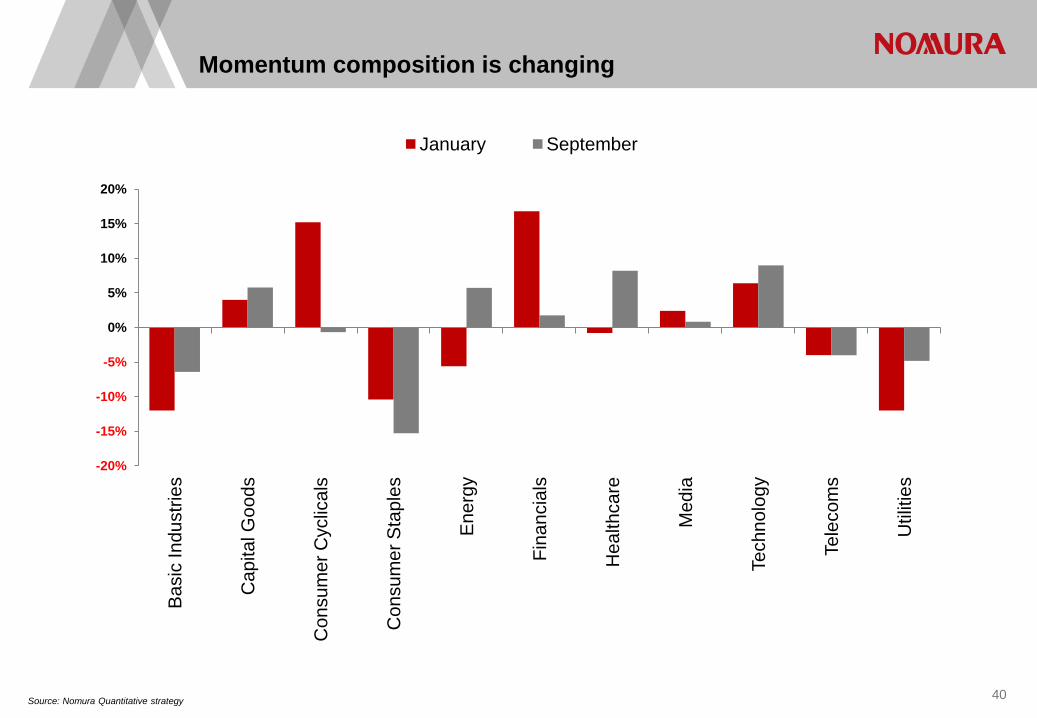
Momentum composition is changing
-20%
-15%
-10%
-5%
0%
5%
10%
15%
20% B
asic
Indu
strie
s
Cap
ital G
oods
Con
sum
er C
yclic
als
Con
sum
er S
tapl
es
Ene
rgy
Fina
ncia
ls
Hea
lthca
re
Med
ia
Tech
nolo
gy
Tele
com
s
Util
ities
January September
41 Relative price/book and PE of cheap/expensive stocks. Source: Nomura Quantitative strategy
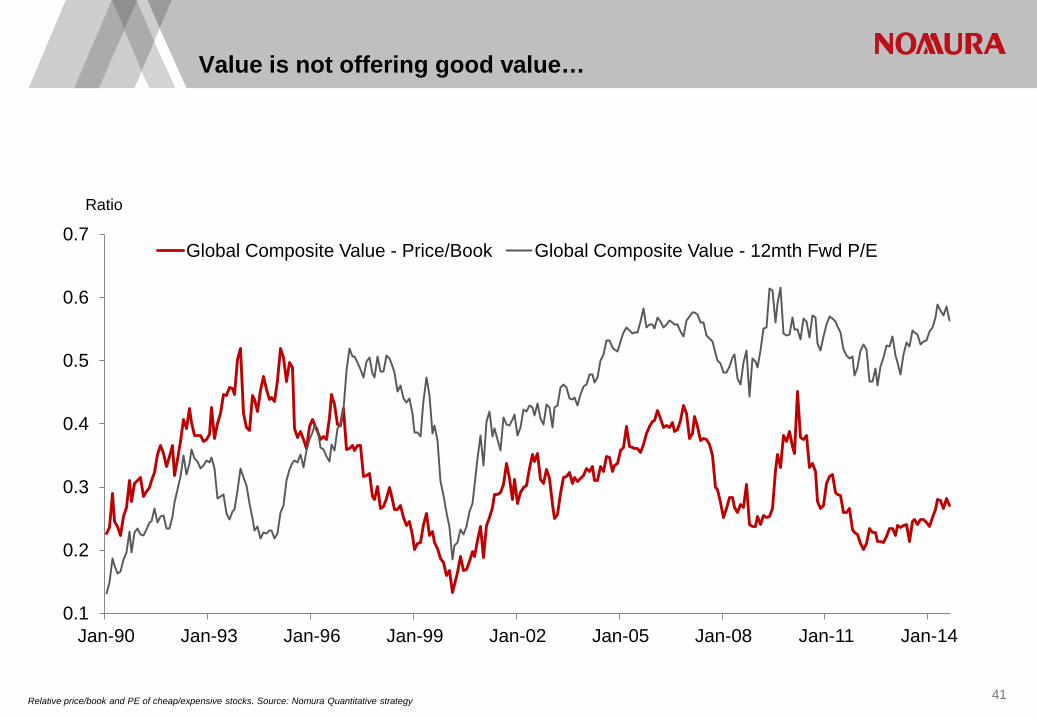
Value is not offering good value…
0.1
0.2
0.3
0.4
0.5
0.6
0.7
Jan-90 Jan-93 Jan-96 Jan-99 Jan-02 Jan-05 Jan-08 Jan-11 Jan-14
Ratio
Global Composite Value - Price/Book Global Composite Value - 12mth Fwd P/E
42 Source: Nomura Quantitative strategy
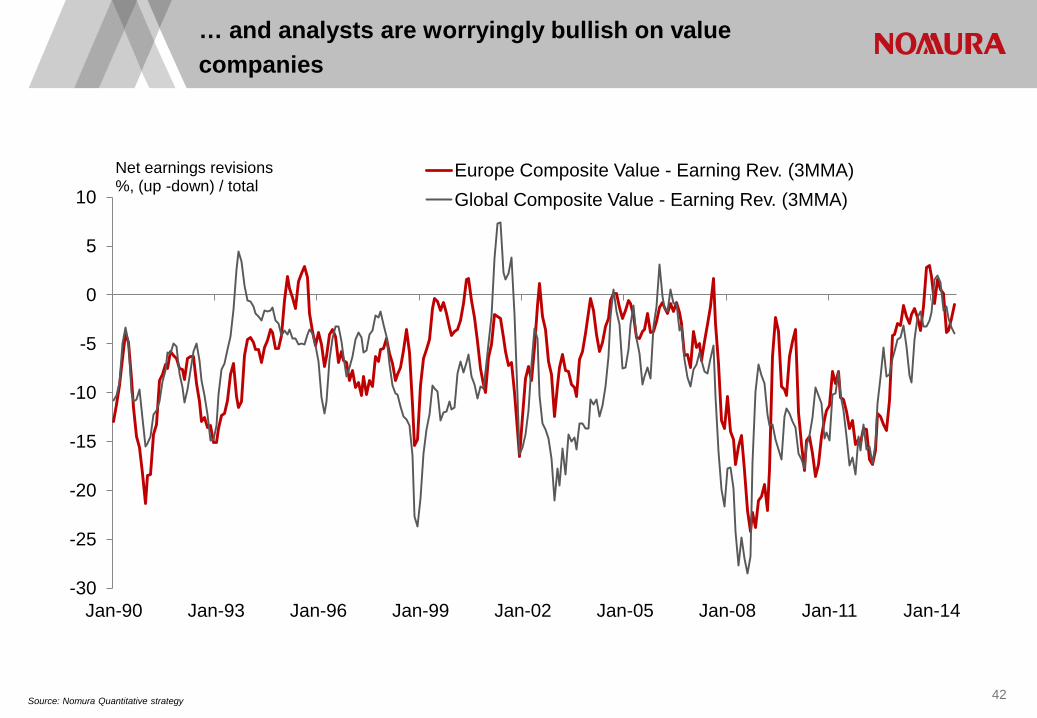
… and analysts are worryingly bullish on value companies
-30
-25
-20
-15
-10
-5
0
5
10
Jan-90 Jan-93 Jan-96 Jan-99 Jan-02 Jan-05 Jan-08 Jan-11 Jan-14
Net earnings revisions %, (up -down) / total
Europe Composite Value - Earning Rev. (3MMA) Global Composite Value - Earning Rev. (3MMA)
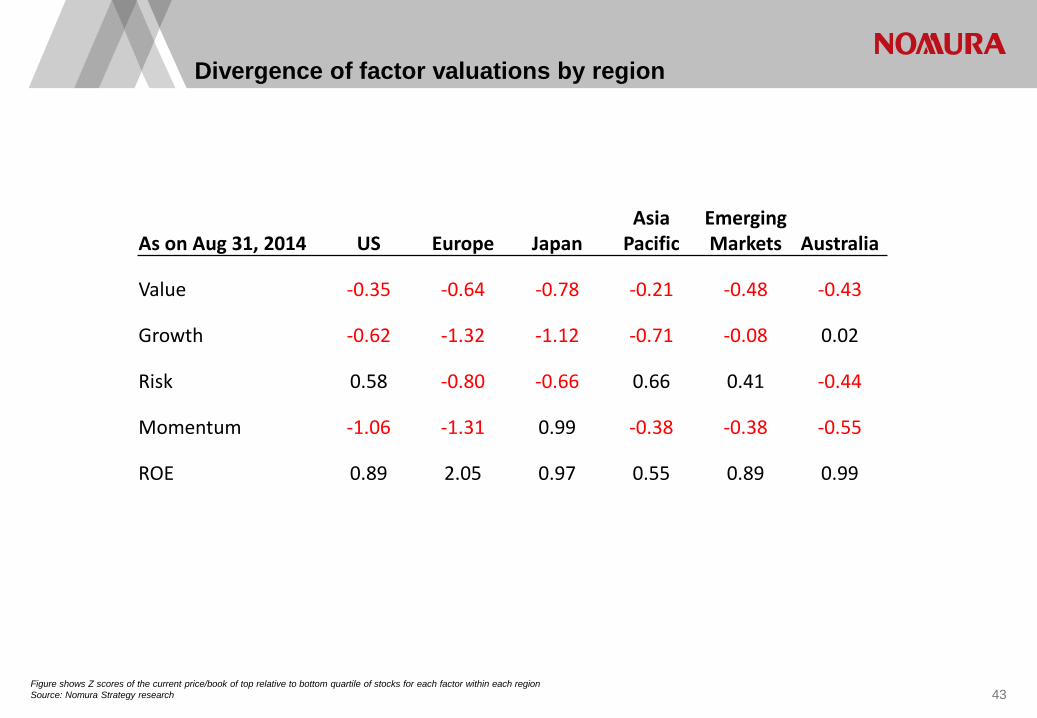
Divergence of factor valuations by region
Figure shows Z scores of the current price/book of top relative to bottom quartile of stocks for each factor within each region Source: Nomura Strategy research 43
As on Aug 31, 2014 US Europe Japan Asia
Pacific Emerging Markets Australia
Value -0.35 -0.64 -0.78 -0.21 -0.48 -0.43
Growth -0.62 -1.32 -1.12 -0.71 -0.08 0.02
Risk 0.58 -0.80 -0.66 0.66 0.41 -0.44
Momentum -1.06 -1.31 0.99 -0.38 -0.38 -0.55
ROE 0.89 2.05 0.97 0.55 0.89 0.99
0.5
1.0
1.5
2.0
2.5
3.0
3.5
4.0
4.5
Jan-90 Jan-94 Jan-98 Jan-02 Jan-06 Jan-10 Jan-14
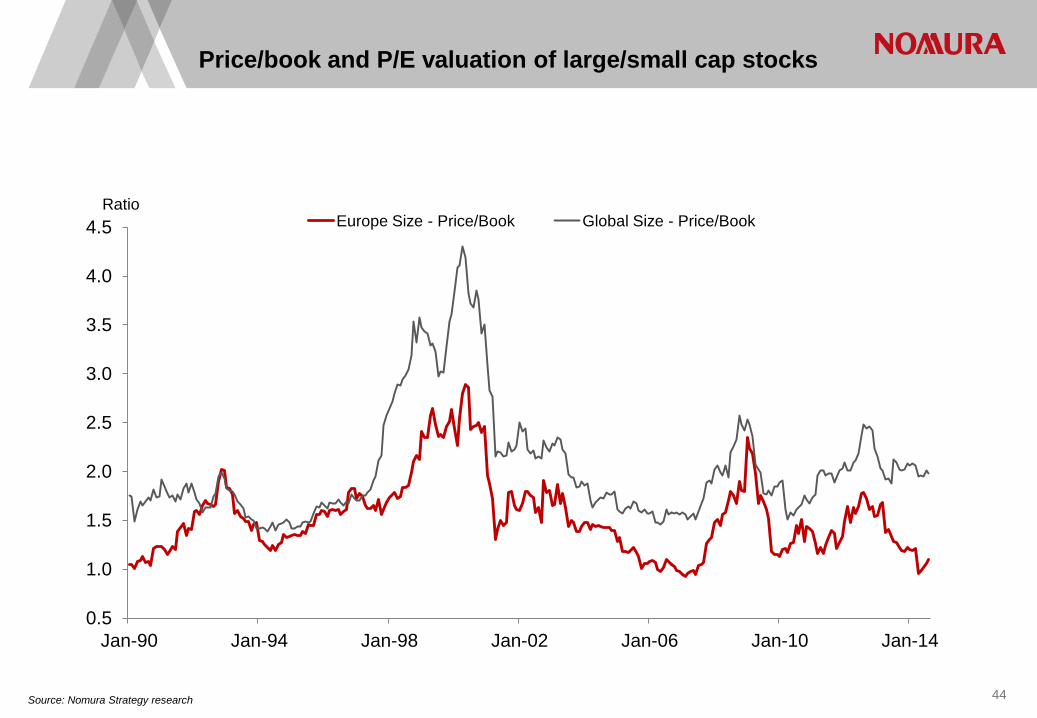
Ratio Europe Size - Price/Book Global Size - Price/Book
44 Source: Nomura Strategy research
Price/book and P/E valuation of large/small cap stocks
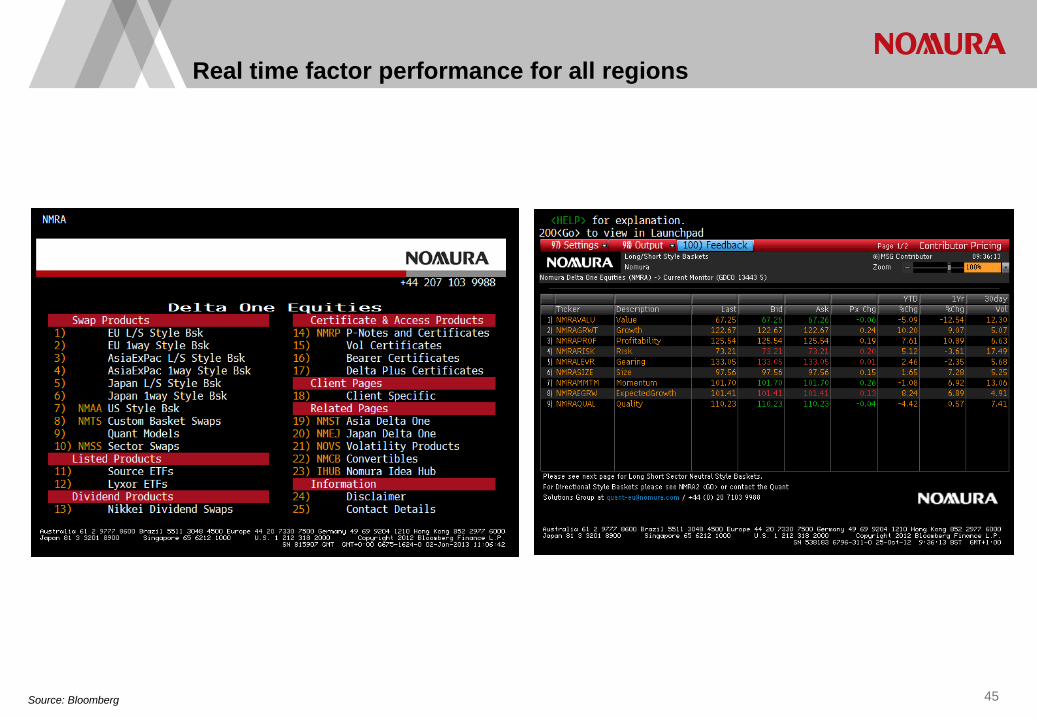
Source: Bloomberg
Real time factor performance for all regions
45

Source: Nomura Quantitative strategy 46
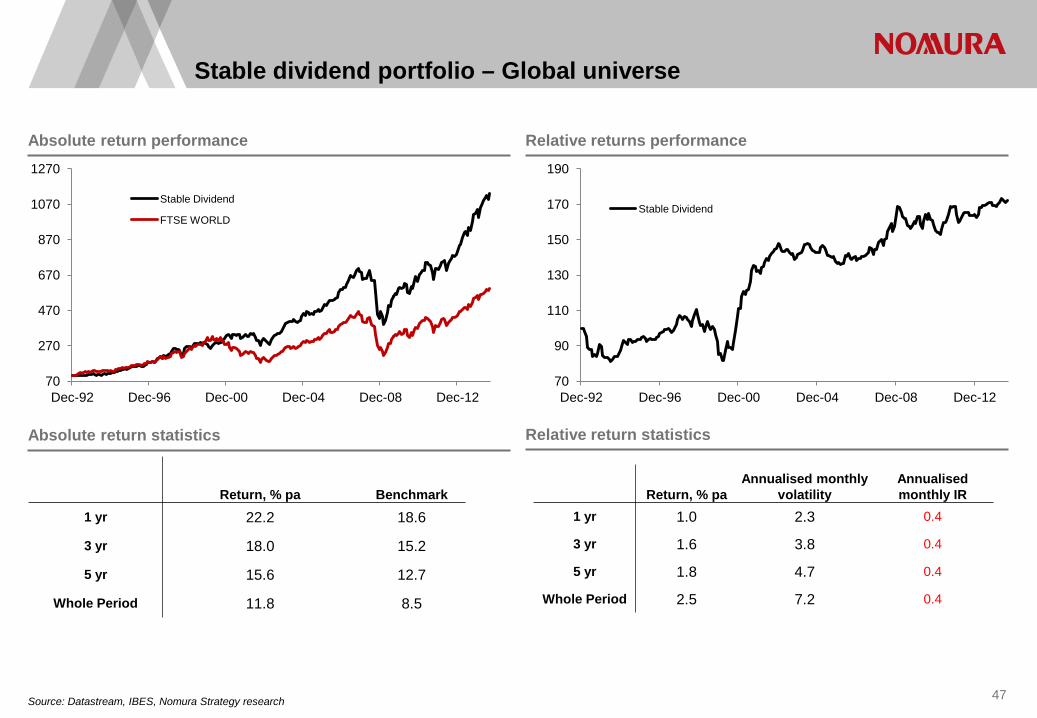
Stable dividend strategy
•There is a ‘hunt for yield’, but simply buying passive equities is not an optimal way to do that and buying the highest yielding equities looks outright unattractive. •Instead we prefer to buy the next tranche of stocks down in terms of yield level, where the dividend is well covered and an analysis of historical dividend policy implies that dividends are likely to grow or be stable. •Purely systematic.
Aim
Methodology
The stocks are ranked on the following five criteria on an equal-weighted composite basis. •Trailing last reported Dividend Yield. •Dividend Growth (Compounded Annual Growth Rate over the past five years), but with a ‘knockout clause’ that the stock gets excluded if in any given year that growth is negative. •Last reported FCF dividend cover. •Standard deviation of the annual dividend growth rate over the past five years. •The five-year Z score of the Fwd P/E. We then create a combined rank and select the stocks that are in the top quartile based on this combination of criteria. The investment universe is the top 500 stocks from the FTSE World and the FTSE Japan for our Japanese version.
Source: Datastream, IBES, Nomura Strategy research 47
Absolute return performance Relative returns performance
Absolute return statistics Relative return statistics
Stable dividend portfolio – Global universe
Return, % pa Benchmark 1 yr 22.2 18.6
3 yr 18.0 15.2
5 yr 15.6 12.7
Whole Period 11.8 8.5
Return, % pa Annualised monthly
volatility Annualised monthly IR
1 yr 1.0 2.3 0.4
3 yr 1.6 3.8 0.4
5 yr 1.8 4.7 0.4
Whole Period 2.5 7.2 0.4
70
270
470
670
870
1070
1270
Dec-92 Dec-96 Dec-00 Dec-04 Dec-08 Dec-12
Stable Dividend
FTSE WORLD
70
90
110
130
150
170
190
Dec-92 Dec-96 Dec-00 Dec-04 Dec-08 Dec-12
Stable Dividend
Source: Nomura Quantitative strategy 48
Global multifactor model
• Our core purely systematic global stock-selection approach. • Has been published and hence live since July 2009, based on an initial European version first
published Sept 2008. • Objective is to find a combination of factors that works smoothly over the cycle, so one does not
need to dynamically allocate between factors. • A key differentiating aspect is that we include a non-linear combination of factors. The economic
interpretation of this is that it measures the level of agreement between factors. • So the model selects stocks that are attractive on factors that have worked within each sector
historically and gives extra score to those where the factors agree. • We choose to let the model use different factors within each sector to better capture different
accounting and business drivers within sectors. • Where possible, we guide the learning process to include at least one component from each of the
value, quality, momentum and growth factor groups.
Aim
Methodology
• We use a learning-based model that identifies which factors are most effective within each sector. This involves an expanding-window panel regression so there is no period that is just in-sample.
• Although the factor coefficients evolve in the learning period, they have been fixed since 2003, so this is a static multifactor model.
• Based on the 500 largest companies in the developed world, it selects the most attractive top/bottom quartiles; the long-only version just selects the top quartile of stocks within each sector.
• The model does not take any sector views.
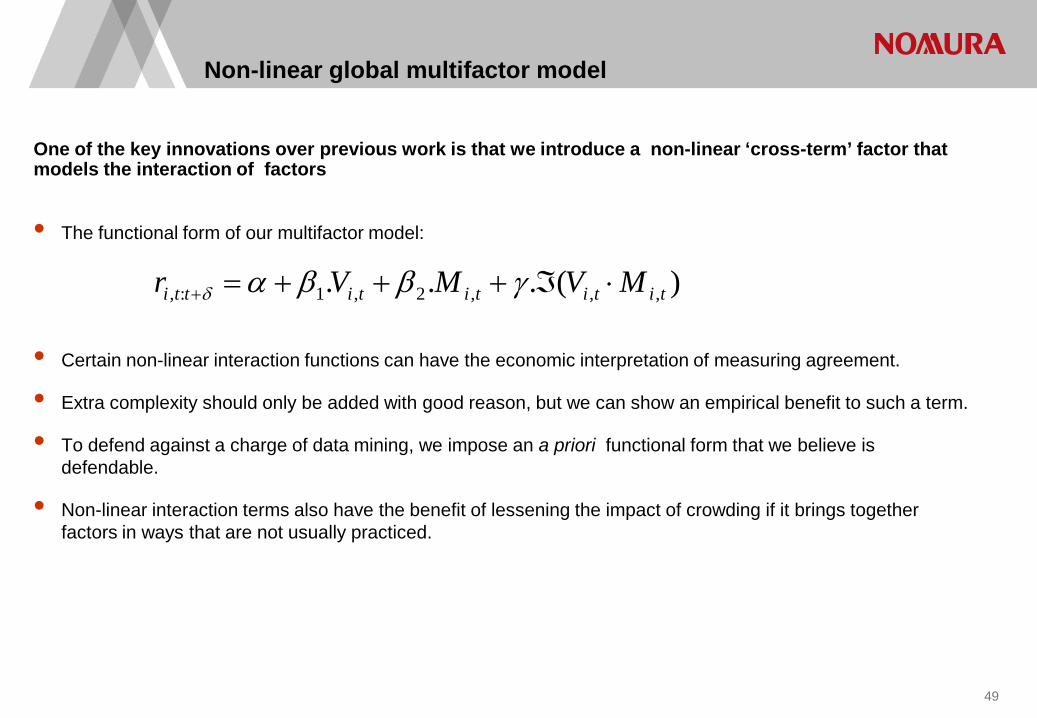
One of the key innovations over previous work is that we introduce a non-linear ‘cross-term’ factor that models the interaction of factors
• The functional form of our multifactor model:
• Certain non-linear interaction functions can have the economic interpretation of measuring agreement.
• Extra complexity should only be added with good reason, but we can show an empirical benefit to such a term.
• To defend against a charge of data mining, we impose an a priori functional form that we believe is defendable.
• Non-linear interaction terms also have the benefit of lessening the impact of crowding if it brings together factors in ways that are not usually practiced.
Non-linear global multifactor model
)(... ,,,2,1:, tititititti MVMVr ⋅ℑ+++=+ γββαδ
49
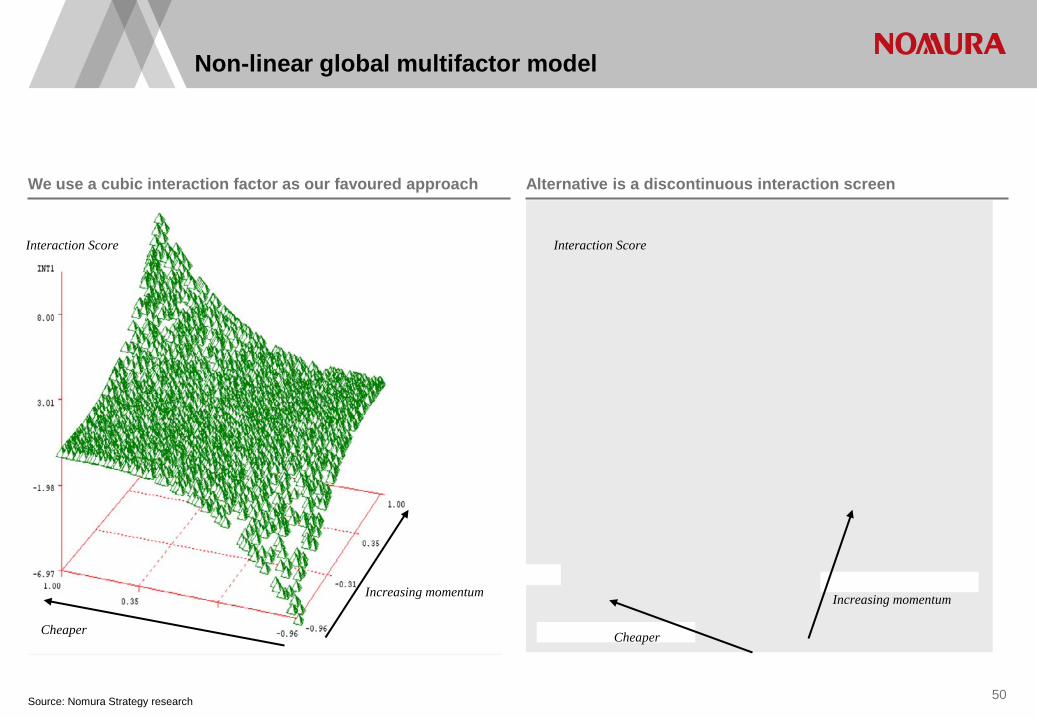
Source: Nomura Strategy research
We use a cubic interaction factor as our favoured approach Alternative is a discontinuous interaction screen
Increasing momentum
Cheaper
Increasing momentum
Cheaper
Interaction Score Interaction Score
50
Non-linear global multifactor model
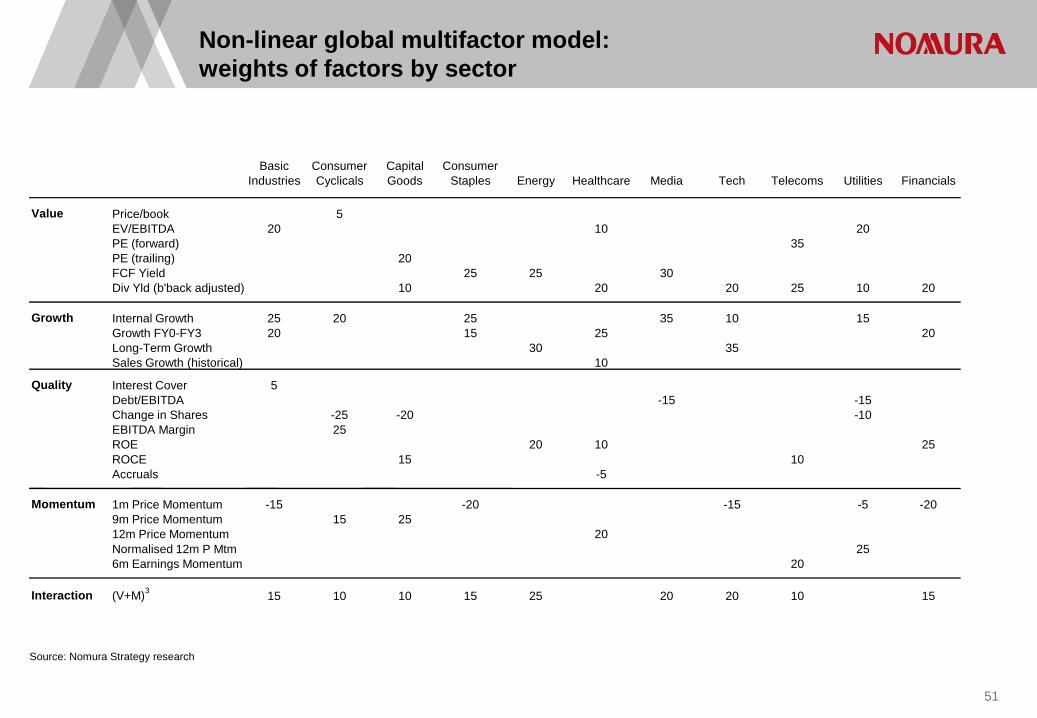
Non-linear global multifactor model: weights of factors by sector
Source: Nomura Strategy research
Basic Industries
Consumer Cyclicals
Capital Goods
Consumer Staples Energy Healthcare Media Tech Telecoms Utilities Financials
Value Price/book 5 EV/EBITDA 20 10 20 PE (forward) 35 PE (trailing) 20 FCF Yield 25 25 30 Div Yld (b'back adjusted) 10 20 20 25 10 20
Growth Internal Growth 25 20 25 35 10 15 Growth FY0-FY3 20 15 25 20 Long-Term Growth 30 35 Sales Growth (historical) 10
Quality Interest Cover 5 Debt/EBITDA -15 -15 Change in Shares -25 -20 -10 EBITDA Margin 25 ROE 20 10 25 ROCE 15 10 Accruals -5
Momentum 1m Price Momentum -15 -20 -15 -5 -20 9m Price Momentum 15 25 12m Price Momentum 20 Normalised 12m P Mtm 25 6m Earnings Momentum 20
Interaction (V+M) 3 15 10 10 15 25 20 20 10 15
51
Global multifactor model
Source: Nomura Strategy research 52
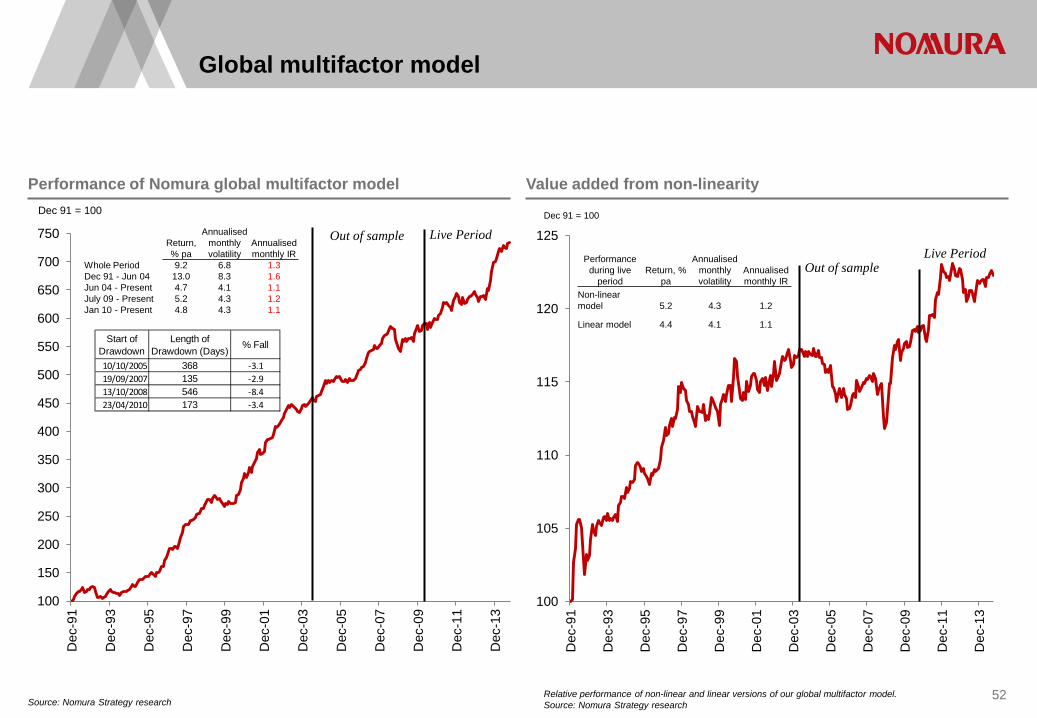
Performance of Nomura global multifactor model Value added from non-linearity
100
150
200
250
300
350
400
450
500
550
600
650
700
750
Dec
-91
Dec
-93
Dec
-95
Dec
-97
Dec
-99
Dec
-01
Dec
-03
Dec
-05
Dec
-07
Dec
-09
Dec
-11
Dec
-13
Dec 91 = 100
Out of sample Live Period
Start of Drawdown
Length of Drawdown (Days)
% Fall
10/10/2005 368 -3.119/09/2007 135 -2.913/10/2008 546 -8.423/04/2010 173 -3.4
Return, % pa
Annualised monthly volatility
Annualised monthly IR
Whole Period 9.2 6.8 1.3 Dec 91 - Jun 04 13.0 8.3 1.6 Jun 04 - Present 4.7 4.1 1.1 July 09 - Present 5.2 4.3 1.2 Jan 10 - Present 4.8 4.3 1.1
100
105
110
115
120
125
Dec
-91
Dec
-93
Dec
-95
Dec
-97
Dec
-99
Dec
-01
Dec
-03
Dec
-05
Dec
-07
Dec
-09
Dec
-11
Dec
-13
Out of sample
Dec 91 = 100
Live Period Performance during live
period Return, %
pa
Annualised monthly volatility
Annualised monthly IR
Non-linear model 5.2 4.3 1.2
Linear model 4.4 4.1 1.1
Relative performance of non-linear and linear versions of our global multifactor model. Source: Nomura Strategy research

Source: Datastream, IBES, Nomura Strategy research 53
Absolute return performance (out of sample period) Relative returns performance (out of sample period)
Absolute return statistics Relative return statistics
Global multifactor (long-only version)
70.0
120.0
170.0
220.0
270.0
320.0
Jun-04 Jun-07 Jun-10 Jun-13
GMF Long only Sector Weighted
FTSE WORLD
90 95
100 105 110 115 120 125 130 135 140
Jun-04 Jun-07 Jun-10 Jun-13
GMF Long only Sector Weighted
Return, % pa Benchmark 1 yr 30.1 18.6
3 yr 19.4 15.2
5 yr 16.0 12.7
Out of sample Period 11.5 8.0
Return, % pa Annualised monthly
volatility Annualised monthly IR
1 yr 7.7 2.3 3.3
3 yr 3.3 3.4 1.0
5 yr 2.8 3.1 0.9 Out of sample
Period 3.2 3.2 1.0
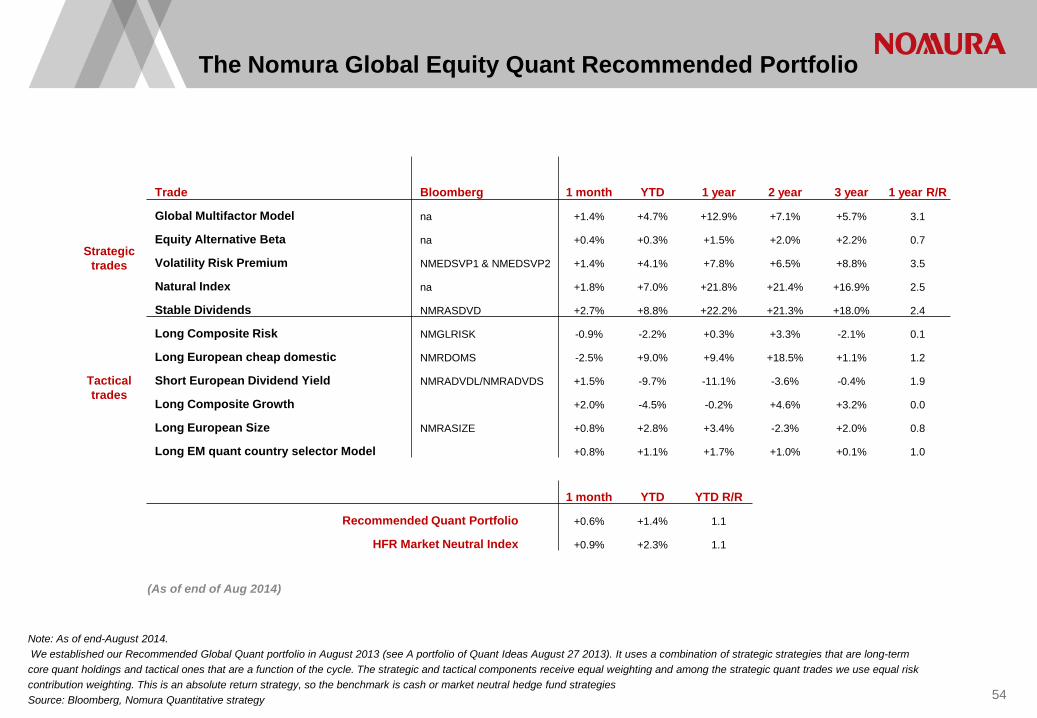
The Nomura Global Equity Quant Recommended Portfolio
Note: As of end-August 2014. We established our Recommended Global Quant portfolio in August 2013 (see A portfolio of Quant Ideas August 27 2013). It uses a combination of strategic strategies that are long-term core quant holdings and tactical ones that are a function of the cycle. The strategic and tactical components receive equal weighting and among the strategic quant trades we use equal risk contribution weighting. This is an absolute return strategy, so the benchmark is cash or market neutral hedge fund strategies Source: Bloomberg, Nomura Quantitative strategy 54
Trade Bloomberg 1 month YTD 1 year 2 year 3 year 1 year R/R
Strategic trades
Global Multifactor Model na +1.4% +4.7% +12.9% +7.1% +5.7% 3.1
Equity Alternative Beta na +0.4% +0.3% +1.5% +2.0% +2.2% 0.7
Volatility Risk Premium NMEDSVP1 & NMEDSVP2 +1.4% +4.1% +7.8% +6.5% +8.8% 3.5
Natural Index na +1.8% +7.0% +21.8% +21.4% +16.9% 2.5
Stable Dividends NMRASDVD +2.7% +8.8% +22.2% +21.3% +18.0% 2.4
Tactical trades
Long Composite Risk NMGLRISK -0.9% -2.2% +0.3% +3.3% -2.1% 0.1
Long European cheap domestic NMRDOMS -2.5% +9.0% +9.4% +18.5% +1.1% 1.2
Short European Dividend Yield NMRADVDL/NMRADVDS +1.5% -9.7% -11.1% -3.6% -0.4% 1.9
Long Composite Growth +2.0% -4.5% -0.2% +4.6% +3.2% 0.0
Long European Size NMRASIZE +0.8% +2.8% +3.4% -2.3% +2.0% 0.8
Long EM quant country selector Model +0.8% +1.1% +1.7% +1.0% +0.1% 1.0
1 month YTD YTD R/R
Recommended Quant Portfolio +0.6% +1.4% 1.1
HFR Market Neutral Index +0.9% +2.3% 1.1
(As of end of Aug 2014)

Long horizon concentrated strategies: a global recommended quant stock portfolio
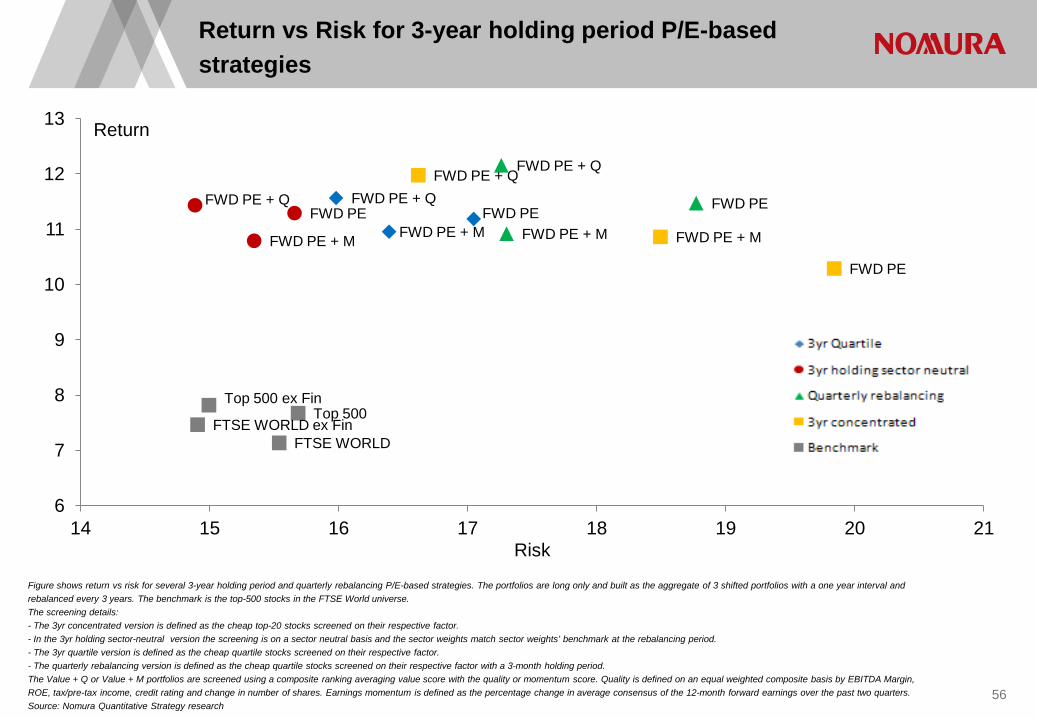
Figure shows return vs risk for several 3-year holding period and quarterly rebalancing P/E-based strategies. The portfolios are long only and built as the aggregate of 3 shifted portfolios with a one year interval and rebalanced every 3 years. The benchmark is the top-500 stocks in the FTSE World universe. The screening details: - The 3yr concentrated version is defined as the cheap top-20 stocks screened on their respective factor. - In the 3yr holding sector-neutral version the screening is on a sector neutral basis and the sector weights match sector weights’ benchmark at the rebalancing period. - The 3yr quartile version is defined as the cheap quartile stocks screened on their respective factor. - The quarterly rebalancing version is defined as the cheap quartile stocks screened on their respective factor with a 3-month holding period. The Value + Q or Value + M portfolios are screened using a composite ranking averaging value score with the quality or momentum score. Quality is defined on an equal weighted composite basis by EBITDA Margin, ROE, tax/pre-tax income, credit rating and change in number of shares. Earnings momentum is defined as the percentage change in average consensus of the 12-month forward earnings over the past two quarters. Source: Nomura Quantitative Strategy research
Return vs Risk for 3-year holding period P/E-based strategies
56
FWD PE FWD PE + Q
FWD PE + M FWD PE
FWD PE + Q
FWD PE + M
FWD PE
FWD PE + Q
FWD PE + M
FWD PE
FWD PE + Q
FWD PE + M
FTSE WORLD FTSE WORLD ex Fin
Top 500 Top 500 ex Fin
6
7
8
9
10
11
12
13
14 15 16 17 18 19 20 21
Return
Risk

Source: Nomura Quantitative strategy 57
Global Recommended Portfolio
•This is a blend of bottom-up systematic stock selection with top-down strategy views on regions and sectors. •The systematic stock selection uses our long-horizon quant stock selection model. •Note that the portfolio has always been a blend of quant and discretionary, but the long-horizon quant stock selection model has only been used since we published it in 2013.
•Portfolio has been run since 1997.
Aim
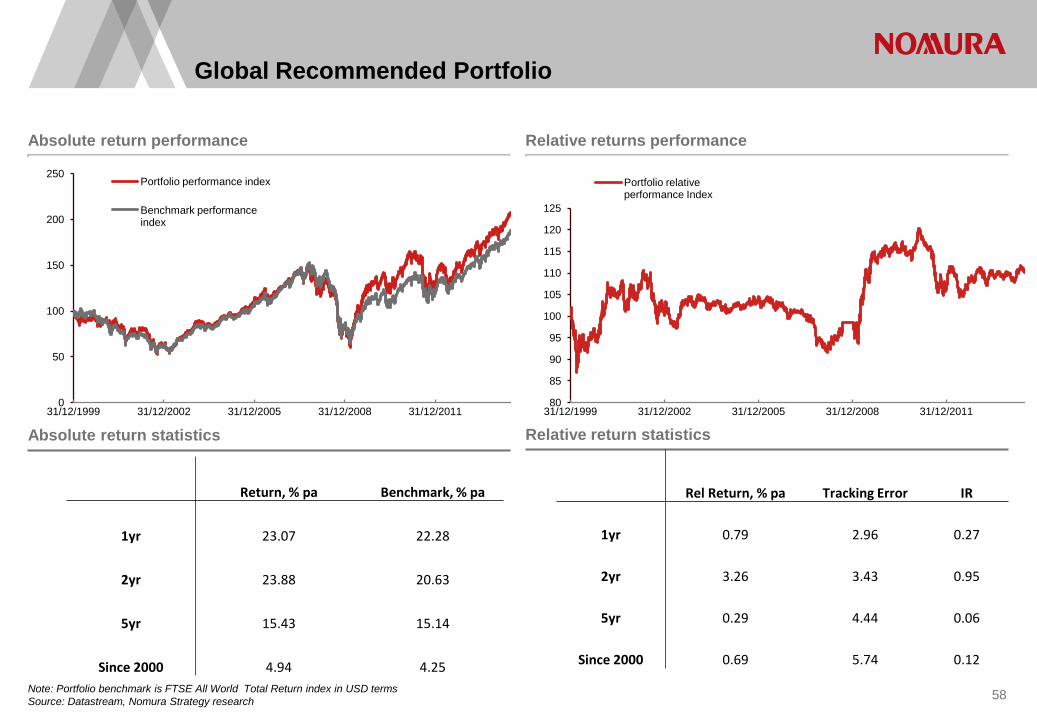
Note: Portfolio benchmark is FTSE All World Total Return index in USD terms Source: Datastream, Nomura Strategy research 58
Absolute return performance Relative returns performance
Absolute return statistics Relative return statistics
Global Recommended Portfolio
0
50
100
150
200
250
31/12/1999 31/12/2002 31/12/2005 31/12/2008 31/12/2011
Portfolio performance index
Benchmark performance index
80
85
90
95
100
105
110
115
120
125
31/12/1999 31/12/2002 31/12/2005 31/12/2008 31/12/2011
Portfolio relative performance Index
Return, % pa Benchmark, % pa
1yr 23.07 22.28
2yr 23.88 20.63
5yr 15.43 15.14
Since 2000 4.94 4.25
Rel Return, % pa Tracking Error IR
1yr 0.79 2.96 0.27
2yr 3.26 3.43 0.95
5yr 0.29 4.44 0.06
Since 2000 0.69 5.74 0.12
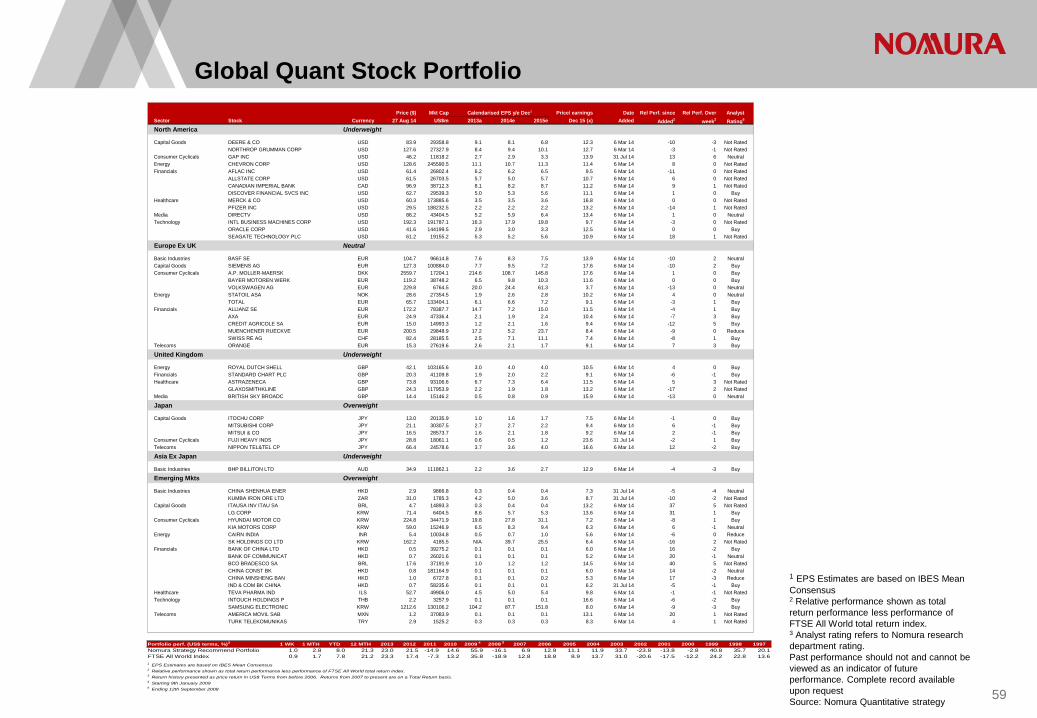
Global Quant Stock Portfolio
59
1 EPS Estimates are based on IBES Mean Consensus 2 Relative performance shown as total return performance less performance of FTSE All World total return index. 3 Analyst rating refers to Nomura research department rating. Past performance should not and cannot be viewed as an indicator of future performance. Complete record available upon request Source: Nomura Quantitative strategy
Price ($) Mkt Cap Calendarised EPS y/e Dec1 Price/ earnings Date Rel Perf. since Rel Perf. Over AnalystSector Stock Currency 27 Aug 14 US$m 2013a 2014e 2015e Dec 15 (x) Added Added2 week2 Rating6
North America Underweight
Capital Goods DEERE & CO USD 83.9 29358.8 9.1 8.1 6.8 12.3 6 Mar 14 -10 -3 Not RatedNORTHROP GRUMMAN CORP USD 127.6 27327.9 8.4 9.4 10.1 12.7 6 Mar 14 -3 -1 Not Rated
Consumer Cyclicals GAP INC USD 46.2 11818.2 2.7 2.9 3.3 13.9 31 Jul 14 13 6 NeutralEnergy CHEVRON CORP USD 128.6 245590.5 11.1 10.7 11.3 11.4 6 Mar 14 8 0 Not RatedFinancials AFLAC INC USD 61.4 26802.4 6.2 6.2 6.5 9.5 6 Mar 14 -11 0 Not Rated
ALLSTATE CORP USD 61.5 26703.5 5.7 5.0 5.7 10.7 6 Mar 14 6 0 Not RatedCANADIAN IMPERIAL BANK CAD 96.9 38712.3 8.1 8.2 8.7 11.2 6 Mar 14 9 1 Not RatedDISCOVER FINANCIAL SVCS INC USD 62.7 29539.3 5.0 5.3 5.6 11.1 6 Mar 14 1 0 Buy
Healthcare MERCK & CO USD 60.3 173885.6 3.5 3.5 3.6 16.8 6 Mar 14 0 0 Not RatedPFIZER INC USD 29.5 188232.5 2.2 2.2 2.2 13.2 6 Mar 14 -14 1 Not Rated
Media DIRECTV USD 86.2 43404.5 5.2 5.9 6.4 13.4 6 Mar 14 1 0 NeutralTechnology INTL BUSINESS MACHINES CORP USD 192.3 191787.1 16.3 17.9 19.8 9.7 6 Mar 14 -3 0 Not Rated
ORACLE CORP USD 41.6 144199.5 2.9 3.0 3.3 12.5 6 Mar 14 0 0 BuySEAGATE TECHNOLOGY PLC USD 61.2 19155.2 5.3 5.2 5.6 10.9 6 Mar 14 18 1 Not Rated
Europe Ex UK Neutral
Basic Industries BASF SE EUR 104.7 96614.8 7.6 8.3 7.5 13.9 6 Mar 14 -10 2 NeutralCapital Goods SIEMENS AG EUR 127.3 100884.0 7.7 9.5 7.2 17.6 6 Mar 14 -10 2 BuyConsumer Cyclicals A.P. MOLLER-MAERSK DKK 2559.7 17204.1 214.6 108.7 145.8 17.6 6 Mar 14 1 0 Buy
BAYER MOTOREN WERK EUR 119.2 38748.2 6.5 9.8 10.3 11.6 6 Mar 14 0 0 BuyVOLKSWAGEN AG EUR 229.8 6764.5 20.0 24.4 61.3 3.7 6 Mar 14 -13 0 Neutral
Energy STATOIL ASA NOK 28.6 27354.5 1.9 2.6 2.8 10.2 6 Mar 14 4 0 NeutralTOTAL EUR 65.7 133404.1 6.1 6.6 7.2 9.1 6 Mar 14 -3 1 Buy
Financials ALLIANZ SE EUR 172.2 78387.7 14.7 7.2 15.0 11.5 6 Mar 14 -4 1 BuyAXA EUR 24.9 47336.4 2.1 1.9 2.4 10.4 6 Mar 14 -7 3 BuyCREDIT AGRICOLE SA EUR 15.0 14993.3 1.2 2.1 1.6 9.4 6 Mar 14 -12 5 BuyMUENCHENER RUECKVE EUR 200.5 29848.9 17.2 5.2 23.7 8.4 6 Mar 14 -9 0 ReduceSWISS RE AG CHF 82.4 28185.5 2.5 7.1 11.1 7.4 6 Mar 14 -8 1 Buy
Telecoms ORANGE EUR 15.3 27619.6 2.6 2.1 1.7 9.1 6 Mar 14 7 3 Buy
United Kingdom Underweight
Energy ROYAL DUTCH SHELL GBP 42.1 103165.6 3.0 4.0 4.0 10.5 6 Mar 14 4 0 BuyFinancials STANDARD CHART PLC GBP 20.3 41109.8 1.9 2.0 2.2 9.1 6 Mar 14 -6 -1 BuyHealthcare ASTRAZENECA GBP 73.8 93106.6 6.7 7.3 6.4 11.5 6 Mar 14 5 3 Not Rated
GLAXOSMITHKLINE GBP 24.3 117953.9 2.2 1.9 1.8 13.2 6 Mar 14 -17 2 Not RatedMedia BRITISH SKY BROADC GBP 14.4 15146.2 0.5 0.8 0.9 15.9 6 Mar 14 -13 0 Neutral
Japan Overweight
Capital Goods ITOCHU CORP JPY 13.0 20135.9 1.0 1.6 1.7 7.5 6 Mar 14 -1 0 BuyMITSUBISHI CORP JPY 21.1 30307.5 2.7 2.7 2.2 9.4 6 Mar 14 6 -1 BuyMITSUI & CO JPY 16.5 28573.7 1.6 2.1 1.8 9.2 6 Mar 14 2 -1 Buy
Consumer Cyclicals FUJI HEAVY INDS JPY 28.8 18061.1 0.6 0.5 1.2 23.6 31 Jul 14 -2 1 BuyTelecoms NIPPON TEL&TEL CP JPY 66.4 24578.6 3.7 3.6 4.0 16.6 6 Mar 14 12 -2 Buy
Asia Ex Japan Underweight
Basic Industries BHP BILLITON LTD AUD 34.9 111862.1 2.2 3.6 2.7 12.9 6 Mar 14 -4 -3 Buy
Emerging Mkts Overweight
Basic Industries CHINA SHENHUA ENER HKD 2.9 9866.8 0.3 0.4 0.4 7.3 31 Jul 14 -5 -4 NeutralKUMBA IRON ORE LTD ZAR 31.0 1785.3 4.2 5.0 3.6 8.7 31 Jul 14 -10 -2 Not Rated
Capital Goods ITAUSA INV ITAU SA BRL 4.7 14893.3 0.3 0.4 0.4 13.2 6 Mar 14 37 5 Not RatedLG CORP KRW 71.4 6404.5 8.6 5.7 5.3 13.6 6 Mar 14 31 1 Buy
Consumer Cyclicals HYUNDAI MOTOR CO KRW 224.8 34471.9 19.8 27.8 31.1 7.2 6 Mar 14 -8 1 BuyKIA MOTORS CORP KRW 59.0 15246.9 6.5 8.3 9.4 6.3 6 Mar 14 6 -1 Neutral
Energy CAIRN INDIA INR 5.4 10034.8 0.5 0.7 1.0 5.6 6 Mar 14 -6 0 ReduceSK HOLDINGS CO LTD KRW 162.2 4185.5 N/A 39.7 25.5 6.4 6 Mar 14 -16 2 Not Rated
Financials BANK OF CHINA LTD HKD 0.5 39275.2 0.1 0.1 0.1 6.0 6 Mar 14 16 -2 BuyBANK OF COMMUNICAT HKD 0.7 26021.6 0.1 0.1 0.1 5.2 6 Mar 14 20 -1 NeutralBCO BRADESCO SA BRL 17.6 37191.9 1.0 1.2 1.2 14.5 6 Mar 14 40 5 Not RatedCHINA CONST BK HKD 0.8 181164.9 0.1 0.1 0.1 6.0 6 Mar 14 14 -2 NeutralCHINA MINSHENG BAN HKD 1.0 6727.8 0.1 0.1 0.2 5.3 6 Mar 14 17 -3 ReduceIND & COM BK CHINA HKD 0.7 58235.6 0.1 0.1 0.1 6.2 31 Jul 14 -5 -1 Buy
Healthcare TEVA PHARMA IND ILS 52.7 49906.0 4.5 5.0 5.4 9.8 6 Mar 14 -1 -1 Not RatedTechnology INTOUCH HOLDINGS P THB 2.2 3257.9 0.1 0.1 0.1 16.6 6 Mar 14 -6 -2 Buy
SAMSUNG ELECTRONIC KRW 1212.6 130106.2 104.2 87.7 151.8 8.0 6 Mar 14 -9 -3 BuyTelecoms AMERICA MOVIL SAB MXN 1.2 37083.9 0.1 0.1 0.1 13.1 6 Mar 14 20 1 Not Rated
TURK TELEKOMUNIKAS TRY 2.9 1525.2 0.3 0.3 0.3 8.3 6 Mar 14 4 1 Not Rated
Portfolio perf. (US$ terms, %)3 1 WK 1 MTH YTD 12 MTH 2013 2012 2011 2010 2009 4 2008 5 2007 2006 2005 2004 2003 2002 2001 2000 1999 1998 1997Nomura Strategy Recommend Portfolio 1.0 2.8 8.0 21.3 23.0 21.5 -14.9 14.6 55.9 -16.1 6.9 12.9 11.1 11.9 33.7 -23.8 -13.8 -2.8 40.8 35.7 20.1FTSE All World Index 0.9 1.7 7.8 21.2 23.3 17.4 -7.3 13.2 35.8 -18.9 12.8 18.8 8.9 13.7 31.0 -20.6 -17.5 -12.2 24.2 22.8 13.61 EPS Estimates are based on IBES Mean Consensus
3 Return history presented as price return in US$ Terms from before 2006. Returns from 2007 to present are on a Total Return basis.
2 Relative performance shown as total return performance less performance of FTSE All World total return index.
4 Starting 9th January 20095 Ending 12th September 2008

Sector allocation
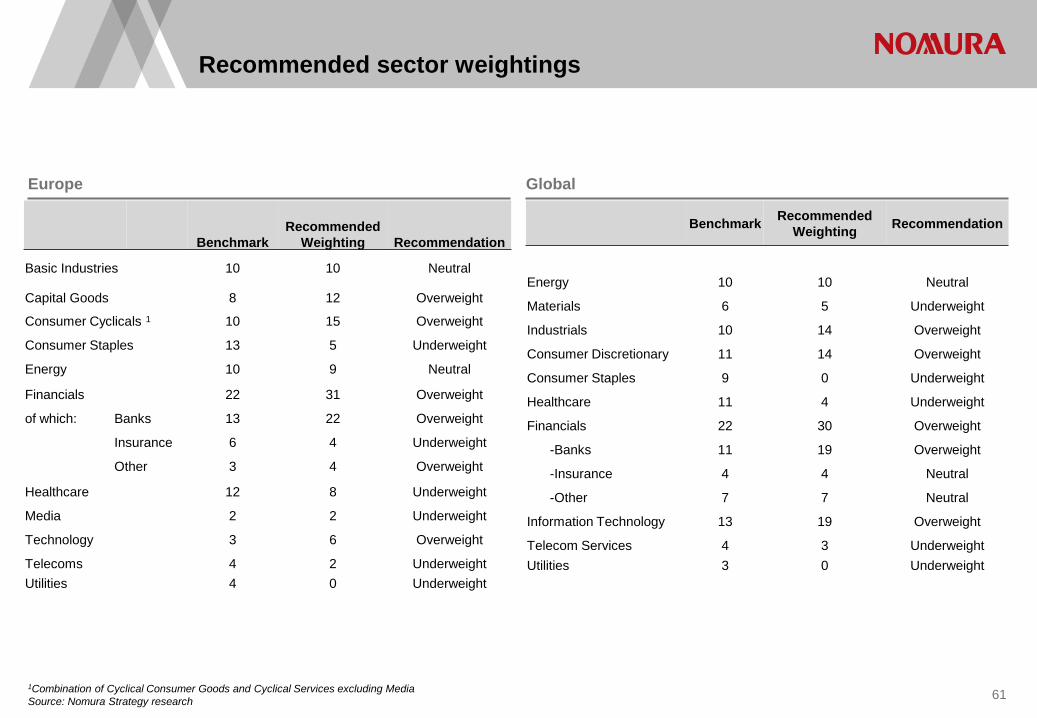
Recommended sector weightings
1Combination of Cyclical Consumer Goods and Cyclical Services excluding Media Source: Nomura Strategy research
Europe Global
61
Benchmark Recommended
Weighting Recommendation
Energy 10 10 Neutral
Materials 6 5 Underweight
Industrials 10 14 Overweight
Consumer Discretionary 11 14 Overweight
Consumer Staples 9 0 Underweight
Healthcare 11 4 Underweight
Financials 22 30 Overweight
-Banks 11 19 Overweight
-Insurance 4 4 Neutral
-Other 7 7 Neutral
Information Technology 13 19 Overweight
Telecom Services 4 3 Underweight Utilities 3 0 Underweight
Benchmark Recommended
Weighting Recommendation
Basic Industries 10 10 Neutral
Capital Goods 8 12 Overweight
Consumer Cyclicals 1 10 15 Overweight
Consumer Staples 13 5 Underweight
Energy 10 9 Neutral
Financials 22 31 Overweight
of which: Banks 13 22 Overweight
Insurance 6 4 Underweight
Other 3 4 Overweight
Healthcare 12 8 Underweight
Media 2 2 Underweight
Technology 3 6 Overweight
Telecoms 4 2 Underweight Utilities 4 0 Underweight
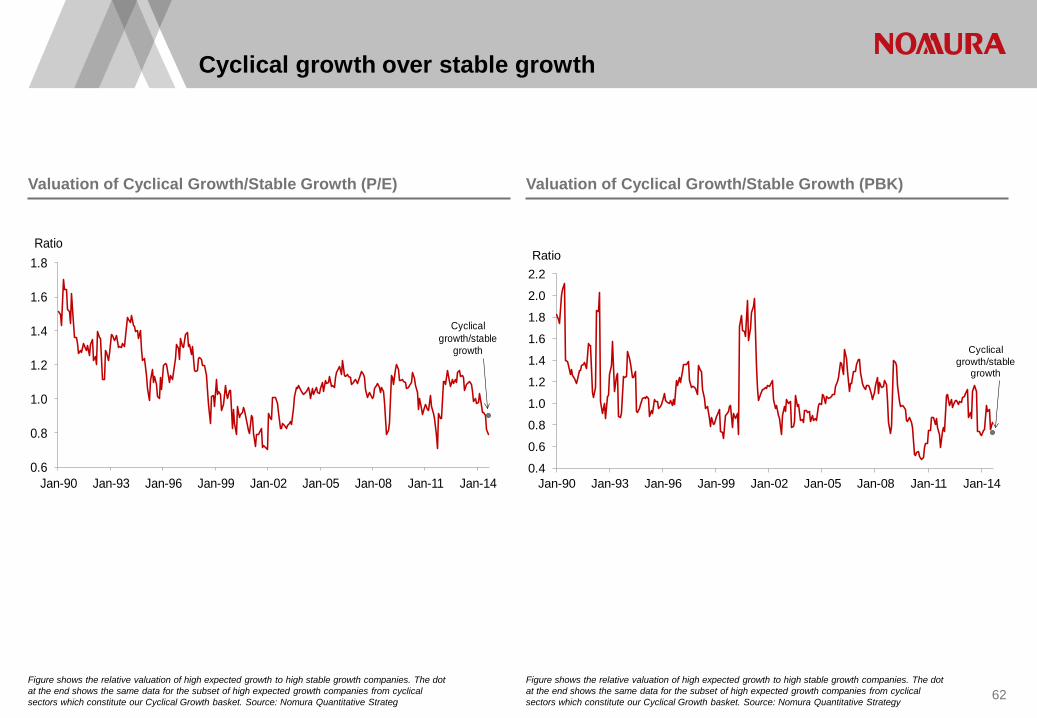
Cyclical growth over stable growth
Figure shows the relative valuation of high expected growth to high stable growth companies. The dot at the end shows the same data for the subset of high expected growth companies from cyclical sectors which constitute our Cyclical Growth basket. Source: Nomura Quantitative Strateg 62
Valuation of Cyclical Growth/Stable Growth (P/E) Valuation of Cyclical Growth/Stable Growth (PBK)
0.6
0.8
1.0
1.2
1.4
1.6
1.8
Jan-90 Jan-93 Jan-96 Jan-99 Jan-02 Jan-05 Jan-08 Jan-11 Jan-14
Ratio
Cyclical growth/stable
growth
0.4
0.6
0.8
1.0
1.2
1.4
1.6
1.8
2.0
2.2
Jan-90 Jan-93 Jan-96 Jan-99 Jan-02 Jan-05 Jan-08 Jan-11 Jan-14
Ratio
Cyclical growth/stable
growth
Figure shows the relative valuation of high expected growth to high stable growth companies. The dot at the end shows the same data for the subset of high expected growth companies from cyclical sectors which constitute our Cyclical Growth basket. Source: Nomura Quantitative Strategy
63 Source: Nomura Strategy research
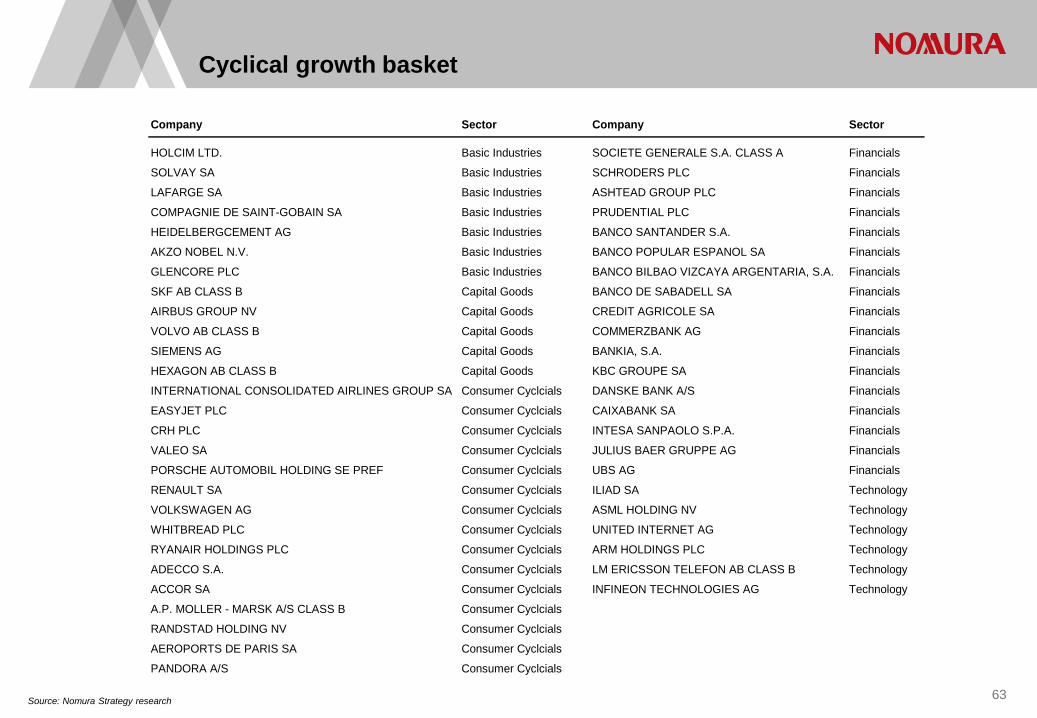
Cyclical growth basket
Company Sector Company Sector
HOLCIM LTD. Basic Industries SOCIETE GENERALE S.A. CLASS A Financials
SOLVAY SA Basic Industries SCHRODERS PLC Financials
LAFARGE SA Basic Industries ASHTEAD GROUP PLC Financials
COMPAGNIE DE SAINT-GOBAIN SA Basic Industries PRUDENTIAL PLC Financials
HEIDELBERGCEMENT AG Basic Industries BANCO SANTANDER S.A. Financials
AKZO NOBEL N.V. Basic Industries BANCO POPULAR ESPANOL SA Financials
GLENCORE PLC Basic Industries BANCO BILBAO VIZCAYA ARGENTARIA, S.A. Financials
SKF AB CLASS B Capital Goods BANCO DE SABADELL SA Financials
AIRBUS GROUP NV Capital Goods CREDIT AGRICOLE SA Financials
VOLVO AB CLASS B Capital Goods COMMERZBANK AG Financials
SIEMENS AG Capital Goods BANKIA, S.A. Financials
HEXAGON AB CLASS B Capital Goods KBC GROUPE SA Financials
INTERNATIONAL CONSOLIDATED AIRLINES GROUP SA Consumer Cyclcials DANSKE BANK A/S Financials
EASYJET PLC Consumer Cyclcials CAIXABANK SA Financials
CRH PLC Consumer Cyclcials INTESA SANPAOLO S.P.A. Financials
VALEO SA Consumer Cyclcials JULIUS BAER GRUPPE AG Financials
PORSCHE AUTOMOBIL HOLDING SE PREF Consumer Cyclcials UBS AG Financials
RENAULT SA Consumer Cyclcials ILIAD SA Technology
VOLKSWAGEN AG Consumer Cyclcials ASML HOLDING NV Technology
WHITBREAD PLC Consumer Cyclcials UNITED INTERNET AG Technology
RYANAIR HOLDINGS PLC Consumer Cyclcials ARM HOLDINGS PLC Technology
ADECCO S.A. Consumer Cyclcials LM ERICSSON TELEFON AB CLASS B Technology
ACCOR SA Consumer Cyclcials INFINEON TECHNOLOGIES AG Technology
A.P. MOLLER - MARSK A/S CLASS B Consumer Cyclcials
RANDSTAD HOLDING NV Consumer Cyclcials
AEROPORTS DE PARIS SA Consumer Cyclcials
PANDORA A/S Consumer Cyclcials
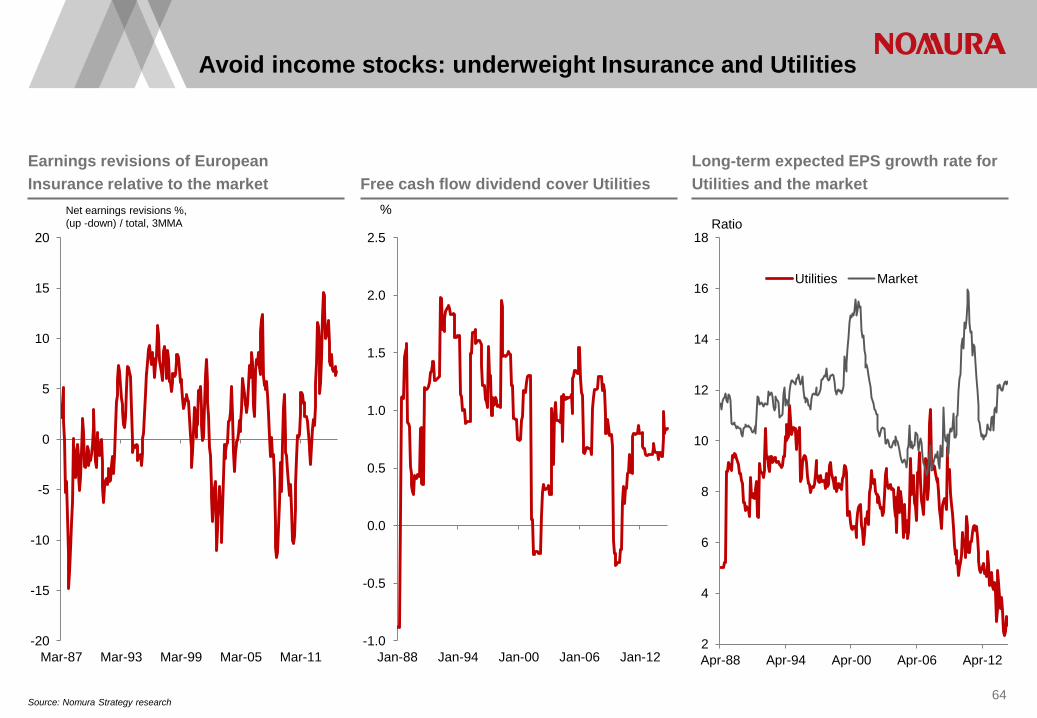
Avoid income stocks: underweight Insurance and Utilities
Source: Nomura Strategy research 64
Earnings revisions of European Insurance relative to the market Free cash flow dividend cover Utilities
Long-term expected EPS growth rate for Utilities and the market
2
4
6
8
10
12
14
16
18
Apr-88 Apr-94 Apr-00 Apr-06 Apr-12
Ratio
Utilities Market
-1.0
-0.5
0.0
0.5
1.0
1.5
2.0
2.5
Jan-88 Jan-94 Jan-00 Jan-06 Jan-12
%
-20
-15
-10
-5
0
5
10
15
20
Mar-87 Mar-93 Mar-99 Mar-05 Mar-11
Net earnings revisions %, (up -down) / total, 3MMA
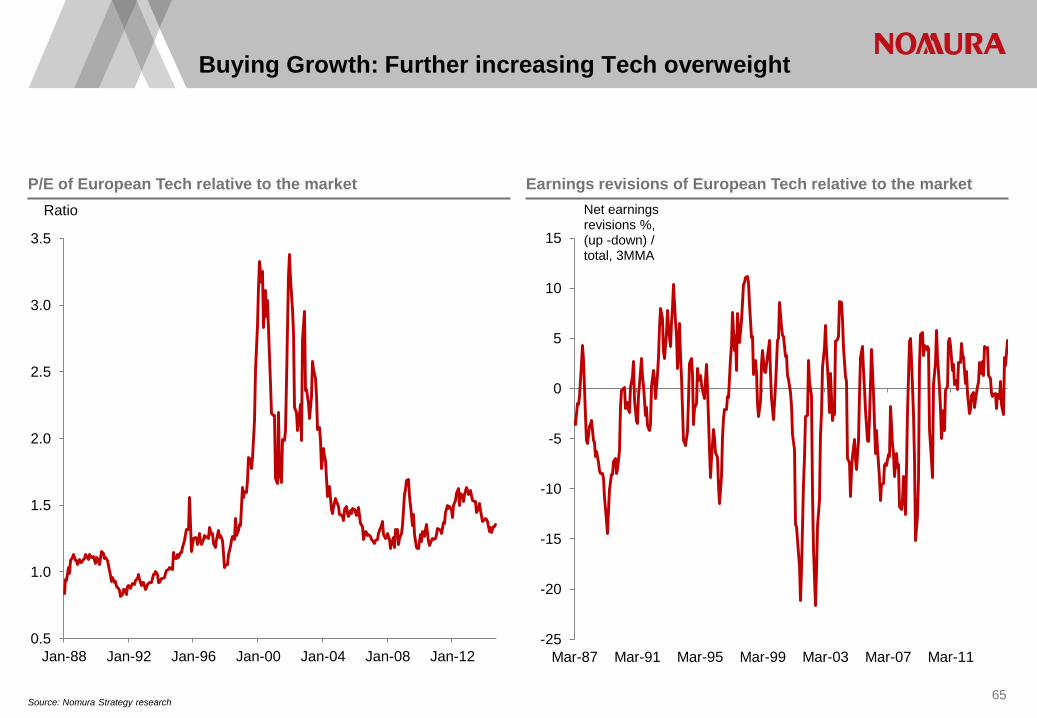
Buying Growth: Further increasing Tech overweight
65
P/E of European Tech relative to the market Earnings revisions of European Tech relative to the market
0.5
1.0
1.5
2.0
2.5
3.0
3.5
Jan-88 Jan-92 Jan-96 Jan-00 Jan-04 Jan-08 Jan-12
Ratio
-25
-20
-15
-10
-5
0
5
10
15
Mar-87 Mar-91 Mar-95 Mar-99 Mar-03 Mar-07 Mar-11
Net earnings revisions %, (up -down) / total, 3MMA
Source: Nomura Strategy research
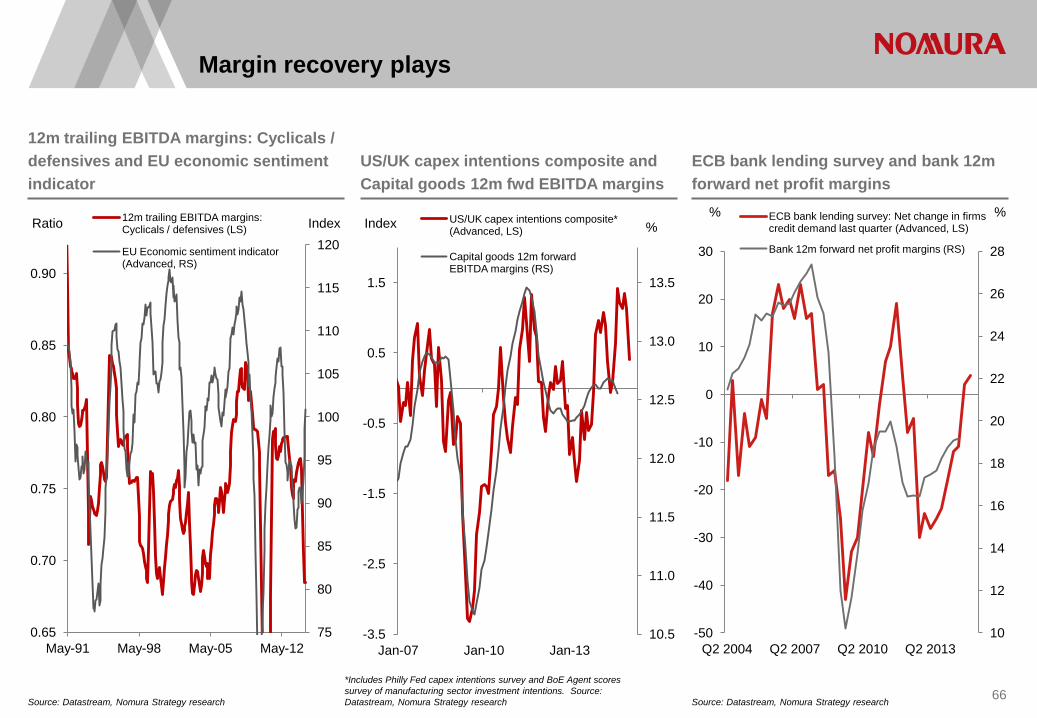
Margin recovery plays
Source: Datastream, Nomura Strategy research 66
12m trailing EBITDA margins: Cyclicals / defensives and EU economic sentiment indicator
US/UK capex intentions composite and Capital goods 12m fwd EBITDA margins
ECB bank lending survey and bank 12m forward net profit margins
75
80
85
90
95
100
105
110
115
120
0.65
0.70
0.75
0.80
0.85
0.90
May-91 May-98 May-05 May-12
Index Ratio 12m trailing EBITDA margins: Cyclicals / defensives (LS)
EU Economic sentiment indicator (Advanced, RS)
10.5
11.0
11.5
12.0
12.5
13.0
13.5
-3.5
-2.5
-1.5
-0.5
0.5
1.5
Jan-07 Jan-10 Jan-13
% Index US/UK capex intentions composite* (Advanced, LS)
Capital goods 12m forward EBITDA margins (RS)
*Includes Philly Fed capex intentions survey and BoE Agent scores survey of manufacturing sector investment intentions. Source: Datastream, Nomura Strategy research
10
12
14
16
18
20
22
24
26
28
-50
-40
-30
-20
-10
0
10
20
30
Q2 2004 Q2 2007 Q2 2010 Q2 2013
ECB bank lending survey: Net change in firms credit demand last quarter (Advanced, LS)
Bank 12m forward net profit margins (RS)
% %
Source: Datastream, Nomura Strategy research
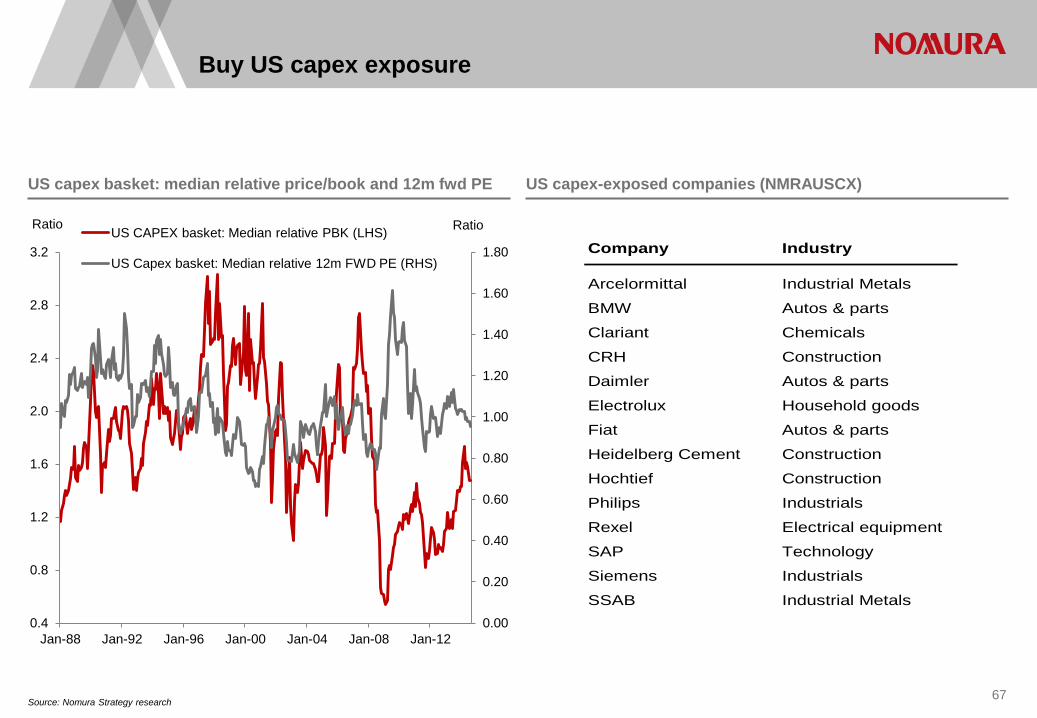
Buy US capex exposure
Source: Nomura Strategy research 67
US capex basket: median relative price/book and 12m fwd PE US capex-exposed companies (NMRAUSCX)
Company Industry
Arcelormittal Industrial Metals
BMW Autos & parts
Clariant Chemicals
CRH Construction
Daimler Autos & parts
Electrolux Household goods
Fiat Autos & parts
Heidelberg Cement Construction
Hochtief Construction
Philips Industrials
Rexel Electrical equipment
SAP Technology
Siemens Industrials
SSAB Industrial Metals 0.00
0.20
0.40
0.60
0.80
1.00
1.20
1.40
1.60
1.80
0.4
0.8
1.2
1.6
2.0
2.4
2.8
3.2
Jan-88 Jan-92 Jan-96 Jan-00 Jan-04 Jan-08 Jan-12
Ratio Ratio US CAPEX basket: Median relative PBK (LHS)
US Capex basket: Median relative 12m FWD PE (RHS)
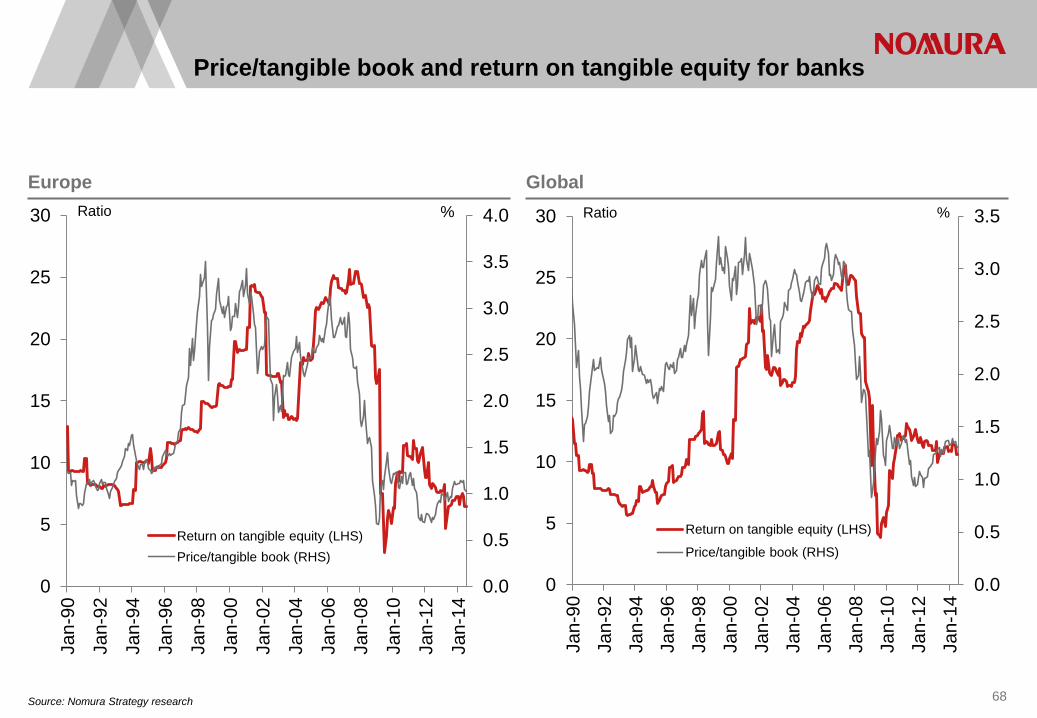
Price/tangible book and return on tangible equity for banks
Source: Nomura Strategy research 68
Europe Global
0.0
0.5
1.0
1.5
2.0
2.5
3.0
3.5
4.0
0
5
10
15
20
25
30
Jan-
90
Jan-
92
Jan-
94
Jan-
96
Jan-
98
Jan-
00
Jan-
02
Jan-
04
Jan-
06
Jan-
08
Jan-
10
Jan-
12
Jan-
14
% Ratio
Return on tangible equity (LHS) Price/tangible book (RHS)
0.0
0.5
1.0
1.5
2.0
2.5
3.0
3.5
0
5
10
15
20
25
30
Jan-
90
Jan-
92
Jan-
94
Jan-
96
Jan-
98
Jan-
00
Jan-
02
Jan-
04
Jan-
06
Jan-
08
Jan-
10
Jan-
12
Jan-
14
% Ratio
Return on tangible equity (LHS)
Price/tangible book (RHS)

Fund management strategy and minimum variance
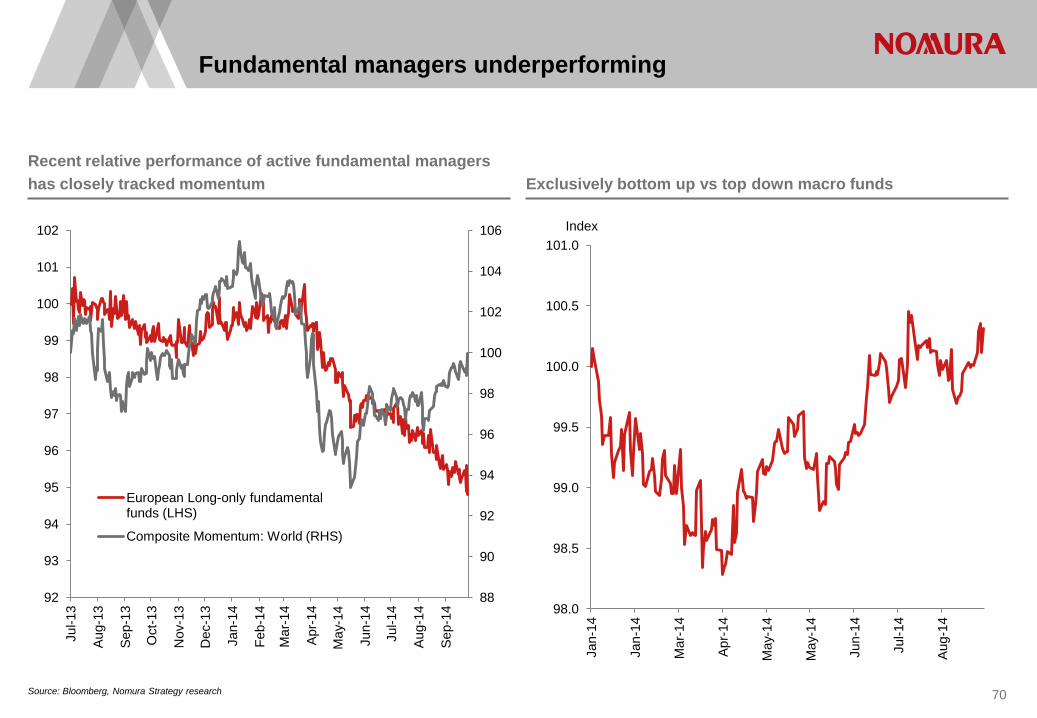
Fundamental managers underperforming
Source: Bloomberg, Nomura Strategy research
70
Recent relative performance of active fundamental managers has closely tracked momentum Exclusively bottom up vs top down macro funds
98.0
98.5
99.0
99.5
100.0
100.5
101.0
Jan-
14
Jan-
14
Mar
-14
Apr-
14
May
-14
May
-14
Jun-
14
Jul-1
4
Aug-
14
Index
88
90
92
94
96
98
100
102
104
106
92
93
94
95
96
97
98
99
100
101
102
Jul-1
3
Aug-
13
Sep-
13
Oct
-13
Nov
-13
Dec
-13
Jan-
14
Feb-
14
Mar
-14
Apr-
14
May
-14
Jun-
14
Jul-1
4
Aug-
14
Sep-
14
European Long-only fundamental funds (LHS)
Composite Momentum: World (RHS)
Source: Nomura Quantitative strategy
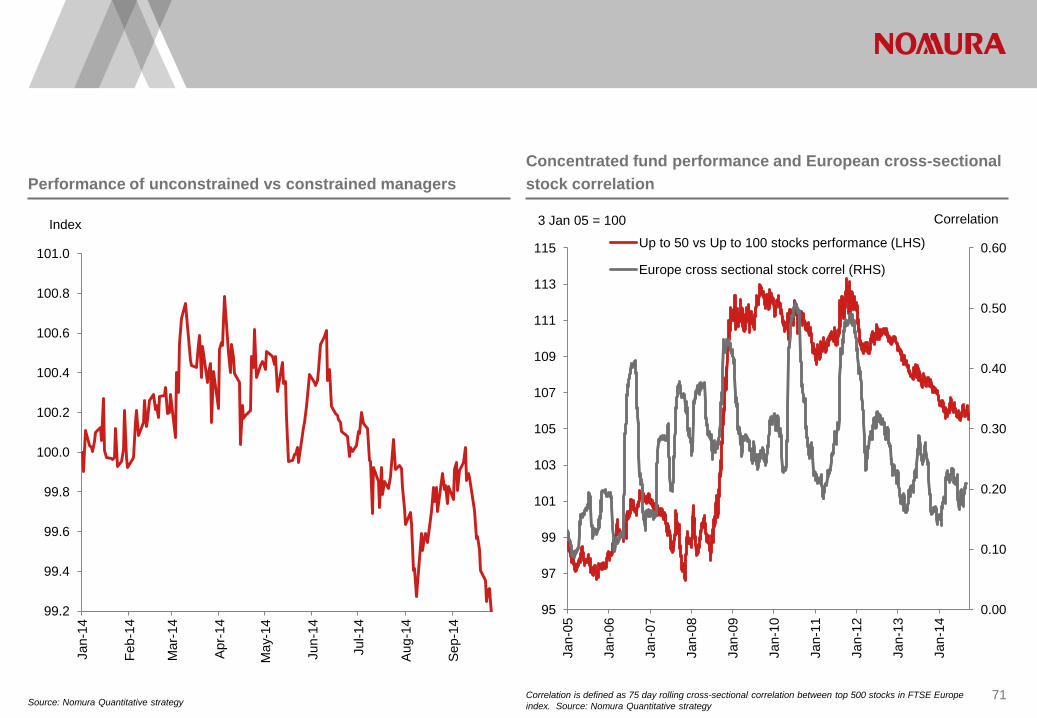
Performance of unconstrained vs constrained managers Concentrated fund performance and European cross-sectional stock correlation
Correlation is defined as 75 day rolling cross-sectional correlation between top 500 stocks in FTSE Europe index. Source: Nomura Quantitative strategy
71
99.2
99.4
99.6
99.8
100.0
100.2
100.4
100.6
100.8
101.0
Jan-
14
Feb-
14
Mar
-14
Apr-
14
May
-14
Jun-
14
Jul-1
4
Aug-
14
Sep-
14
Index
0.00
0.10
0.20
0.30
0.40
0.50
0.60
95
97
99
101
103
105
107
109
111
113
115
Jan-
05
Jan-
06
Jan-
07
Jan-
08
Jan-
09
Jan-
10
Jan-
11
Jan-
12
Jan-
13
Jan-
14
Correlation 3 Jan 05 = 100
Up to 50 vs Up to 100 stocks performance (LHS)
Europe cross sectional stock correl (RHS)

72 Source: Nomura Quantitative Strategy research
Asset share of fundamental managers with more than or fewer than 100 stocks
0.0
0.5
1.0
1.5
2.0
2.5
0
5
10
15
20
25
Jan-07 Jan-08 Jan-09 Jan-10 Jan-11 Jan-12 Jan-13 Jan-14
% %
Up to 100 >100
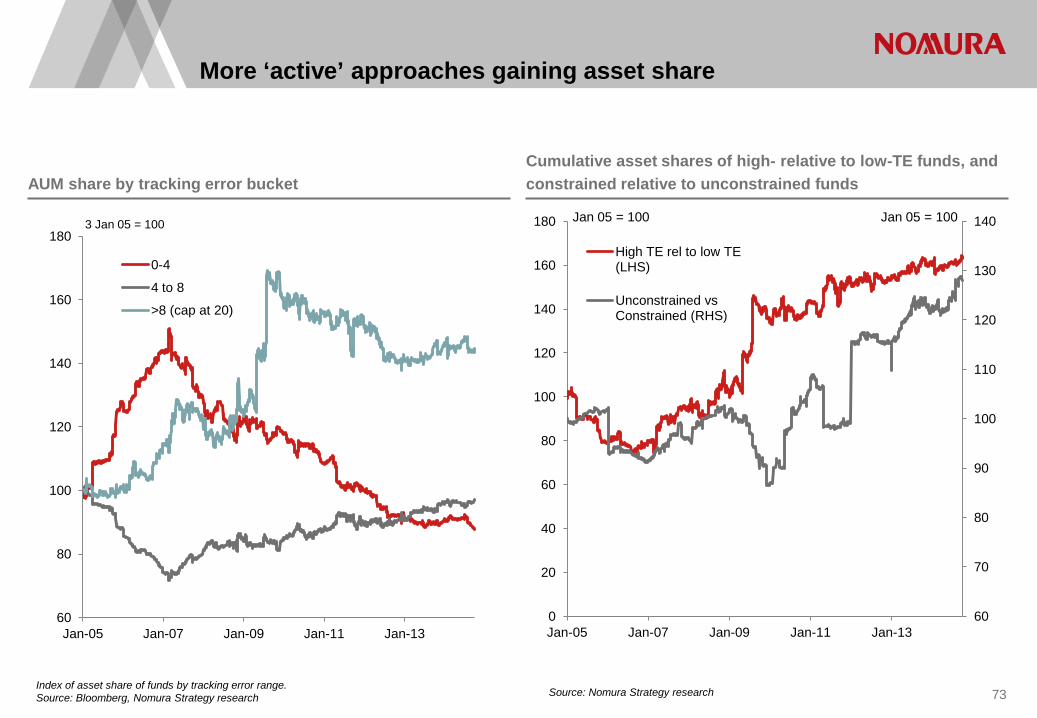
More ‘active’ approaches gaining asset share
Index of asset share of funds by tracking error range. Source: Bloomberg, Nomura Strategy research
AUM share by tracking error bucket Cumulative asset shares of high- relative to low-TE funds, and constrained relative to unconstrained funds
Source: Nomura Strategy research 73
60
80
100
120
140
160
180
Jan-05 Jan-07 Jan-09 Jan-11 Jan-13
3 Jan 05 = 100
0-4
4 to 8
>8 (cap at 20)
60
70
80
90
100
110
120
130
140
0
20
40
60
80
100
120
140
160
180
Jan-05 Jan-07 Jan-09 Jan-11 Jan-13
Jan 05 = 100 Jan 05 = 100
High TE rel to low TE (LHS)
Unconstrained vs Constrained (RHS)
-1500
-1000
-500
0
500
1000
1500
Mar
-02
Mar
-03
Mar
-04
Mar
-05
Mar
-06
Mar
-07
Mar
-08
Mar
-09
Mar
-10
Mar
-11
Mar
-12
Mar
-13
Mar
-14
USDbn
Active Passive All funds
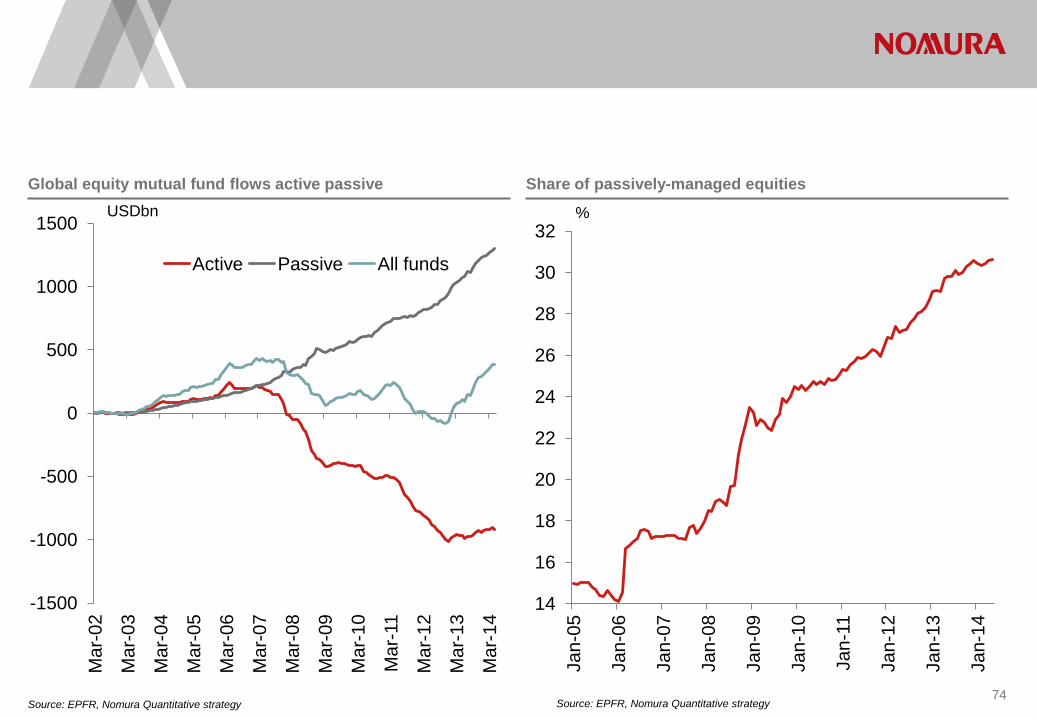
Source: EPFR, Nomura Quantitative strategy 74
Global equity mutual fund flows active passive Share of passively-managed equities
Source: EPFR, Nomura Quantitative strategy
14
16
18
20
22
24
26
28
30
32
Jan-
05
Jan-
06
Jan-
07
Jan-
08
Jan-
09
Jan-
10
Jan-
11
Jan-
12
Jan-
13
Jan-
14
%
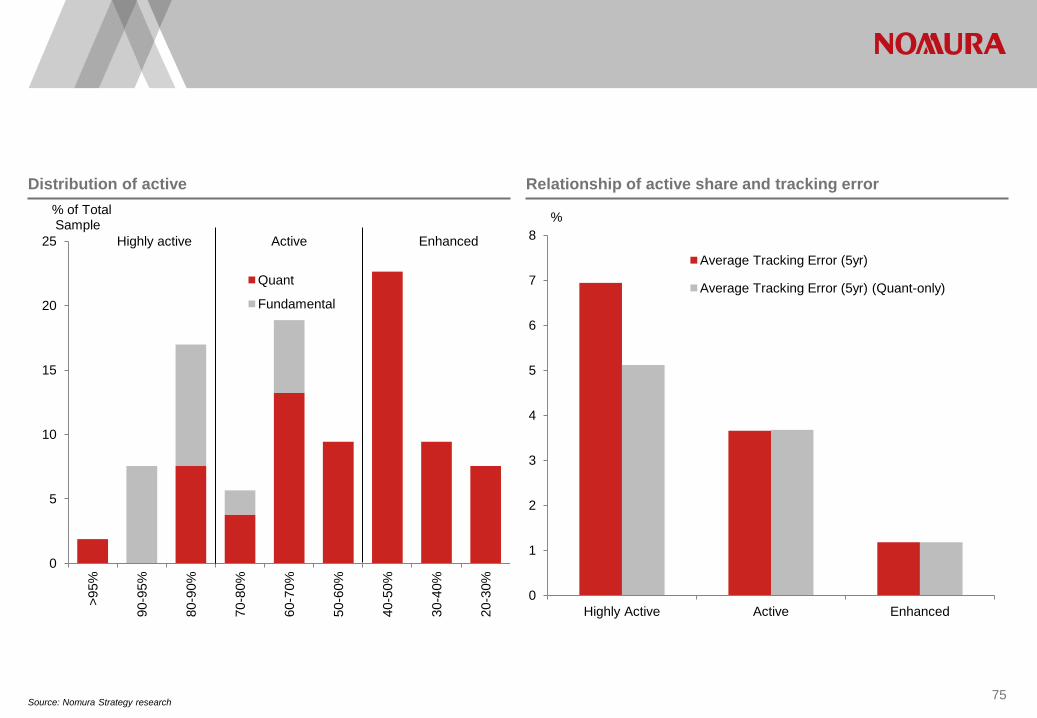
Source: Nomura Strategy research 75
Distribution of active Relationship of active share and tracking error
0
5
10
15
20
25
>95%
90-9
5%
80-9
0%
70-8
0%
60-7
0%
50-6
0%
40-5
0%
30-4
0%
20-3
0%
% of Total Sample
Quant
Fundamental
Enhanced Active Highly active
0
1
2
3
4
5
6
7
8
Highly Active Active Enhanced
%
Average Tracking Error (5yr)
Average Tracking Error (5yr) (Quant-only)
Active share
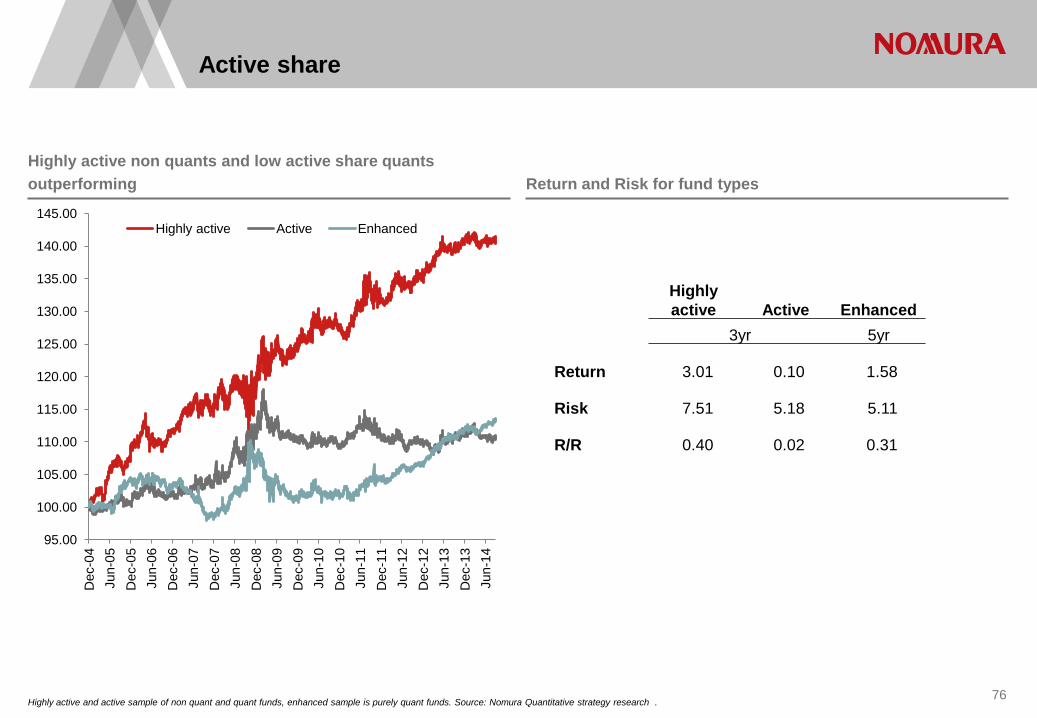
Highly active and active sample of non quant and quant funds, enhanced sample is purely quant funds. Source: Nomura Quantitative strategy research . 76
Highly active non quants and low active share quants outperforming Return and Risk for fund types
Highly active Active Enhanced
3yr 5yr
Return 3.01 0.10 1.58
Risk 7.51 5.18 5.11
R/R 0.40 0.02 0.31
95.00
100.00
105.00
110.00
115.00
120.00
125.00
130.00
135.00
140.00
145.00
Dec
-04
Jun-
05
Dec
-05
Jun-
06
Dec
-06
Jun-
07
Dec
-07
Jun-
08
Dec
-08
Jun-
09
Dec
-09
Jun-
10
Dec
-10
Jun-
11
Dec
-11
Jun-
12
Dec
-12
Jun-
13
Dec
-13
Jun-
14
Highly active Active Enhanced
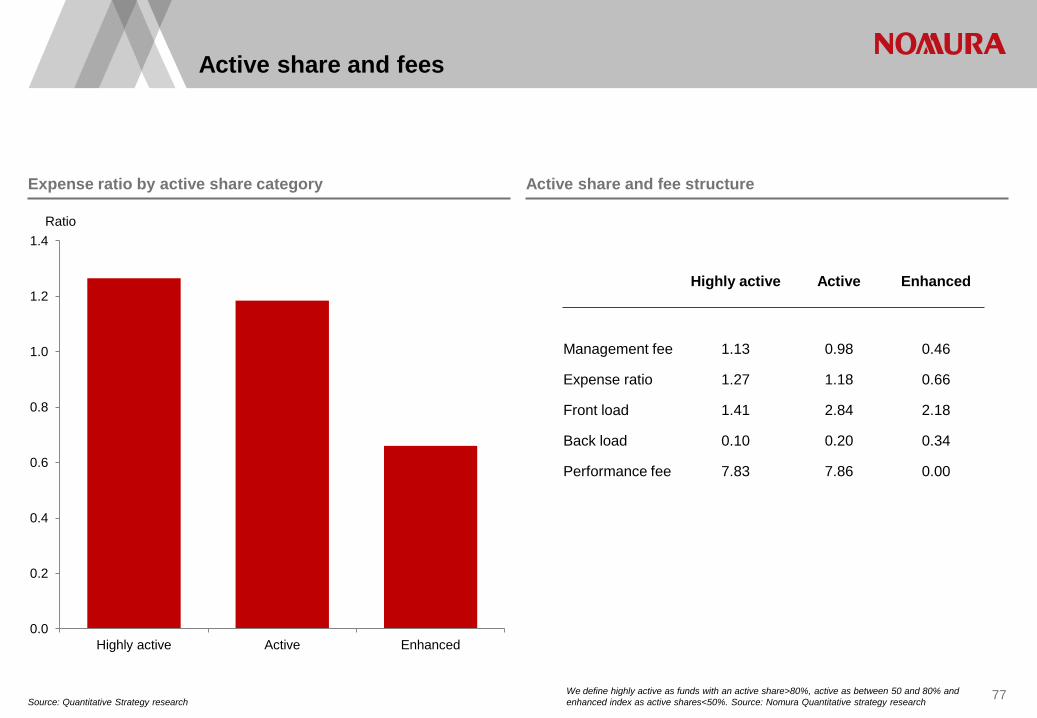
Active share and fees
Source: Quantitative Strategy research 77
Expense ratio by active share category Active share and fee structure
0.0
0.2
0.4
0.6
0.8
1.0
1.2
1.4
Highly active Active Enhanced
Ratio
Highly active Active Enhanced
Management fee 1.13 0.98 0.46
Expense ratio 1.27 1.18 0.66
Front load 1.41 2.84 2.18
Back load 0.10 0.20 0.34
Performance fee 7.83 7.86 0.00
We define highly active as funds with an active share>80%, active as between 50 and 80% and enhanced index as active shares<50%. Source: Nomura Quantitative strategy research
78
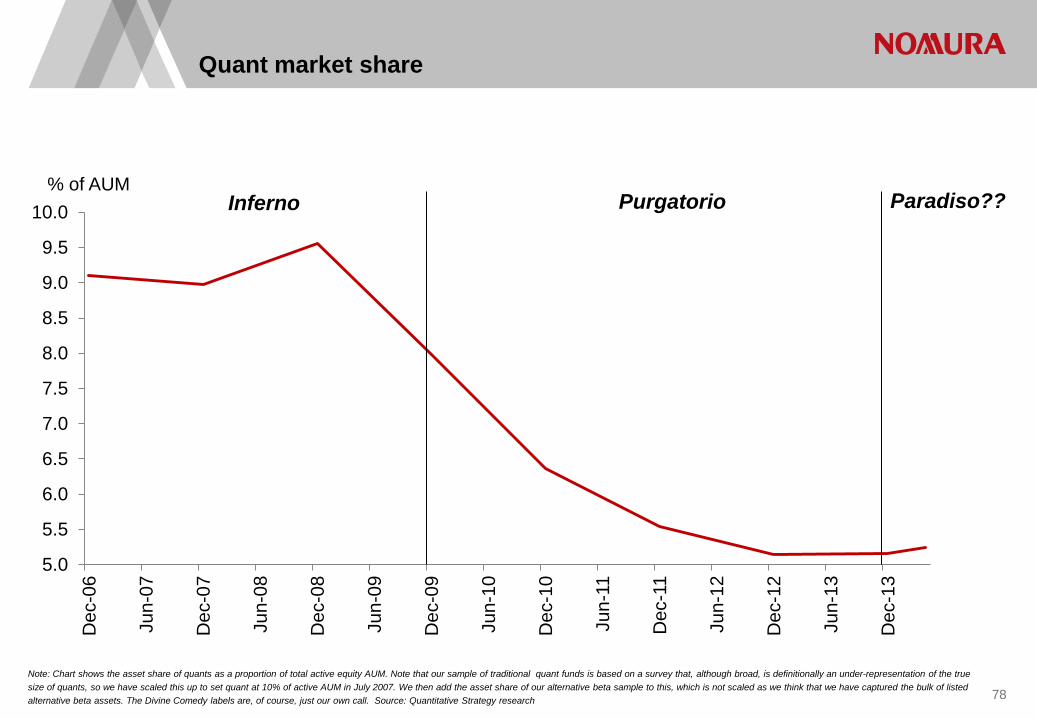
Note: Chart shows the asset share of quants as a proportion of total active equity AUM. Note that our sample of traditional quant funds is based on a survey that, although broad, is definitionally an under-representation of the true size of quants, so we have scaled this up to set quant at 10% of active AUM in July 2007. We then add the asset share of our alternative beta sample to this, which is not scaled as we think that we have captured the bulk of listed alternative beta assets. The Divine Comedy labels are, of course, just our own call. Source: Quantitative Strategy research
Quant market share
5.0
5.5
6.0
6.5
7.0
7.5
8.0
8.5
9.0
9.5
10.0
Dec
-06
Jun-
07
Dec
-07
Jun-
08
Dec
-08
Jun-
09
Dec
-09
Jun-
10
Dec
-10
Jun-
11
Dec
-11
Jun-
12
Dec
-12
Jun-
13
Dec
-13
% of AUM Inferno
Purgatorio Paradiso??
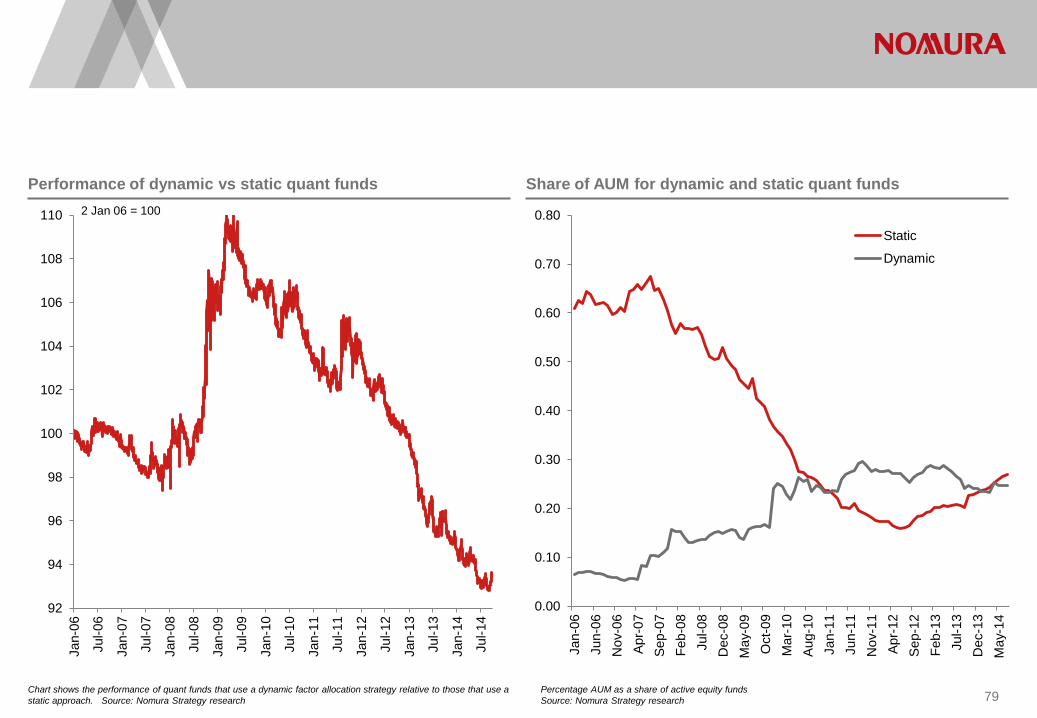
Chart shows the performance of quant funds that use a dynamic factor allocation strategy relative to those that use a static approach. Source: Nomura Strategy research
Performance of dynamic vs static quant funds Share of AUM for dynamic and static quant funds
79 Percentage AUM as a share of active equity funds Source: Nomura Strategy research
92
94
96
98
100
102
104
106
108
110
Jan-
06
Jul-0
6
Jan-
07
Jul-0
7
Jan-
08
Jul-0
8
Jan-
09
Jul-0
9
Jan-
10
Jul-1
0
Jan-
11
Jul-1
1
Jan-
12
Jul-1
2
Jan-
13
Jul-1
3
Jan-
14
Jul-1
4
2 Jan 06 = 100
0.00
0.10
0.20
0.30
0.40
0.50
0.60
0.70
0.80
Jan-
06
Jun-
06
Nov
-06
Apr-
07
Sep-
07
Feb-
08
Jul-0
8 D
ec-0
8 M
ay-0
9 O
ct-0
9 M
ar-1
0 Au
g-10
Ja
n-11
Ju
n-11
N
ov-1
1 Ap
r-12
Se
p-12
Fe
b-13
Ju
l-13
Dec
-13
May
-14
Static
Dynamic
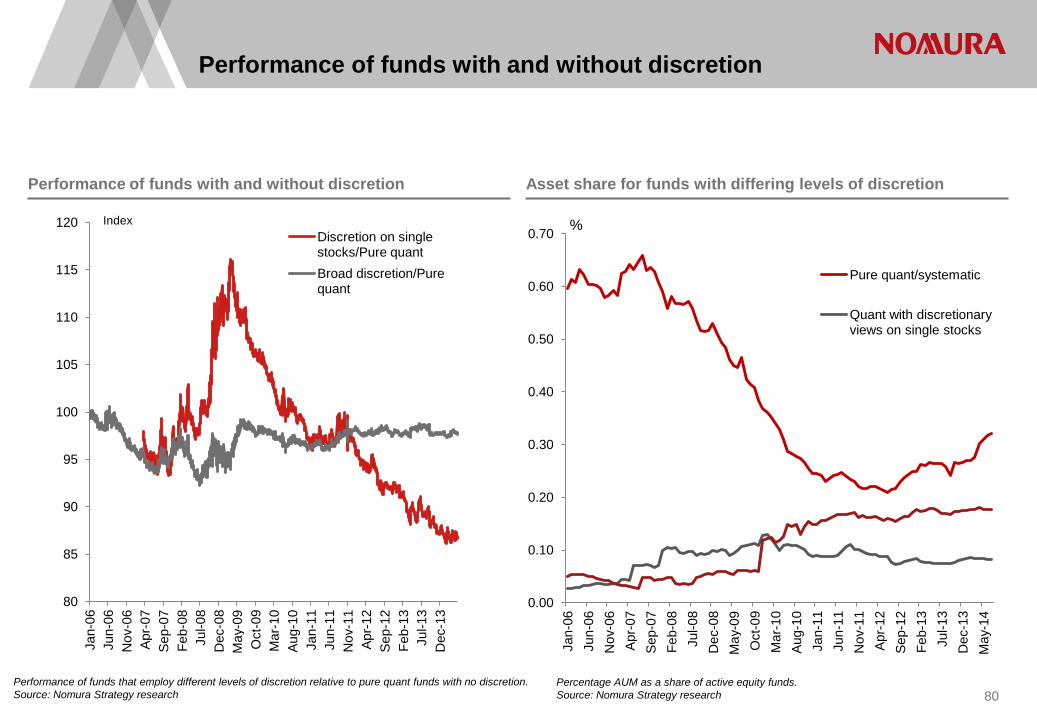
Performance of funds with and without discretion
Performance of funds that employ different levels of discretion relative to pure quant funds with no discretion. Source: Nomura Strategy research
Performance of funds with and without discretion Asset share for funds with differing levels of discretion
80 Percentage AUM as a share of active equity funds. Source: Nomura Strategy research
80
85
90
95
100
105
110
115
120
Jan-
06
Jun-
06
Nov
-06
Apr-
07
Sep-
07
Feb-
08
Jul-0
8 D
ec-0
8 M
ay-0
9 O
ct-0
9 M
ar-1
0 Au
g-10
Ja
n-11
Ju
n-11
N
ov-1
1 Ap
r-12
Se
p-12
Fe
b-13
Ju
l-13
Dec
-13
Discretion on single stocks/Pure quant Broad discretion/Pure quant
Index
0.00
0.10
0.20
0.30
0.40
0.50
0.60
0.70
Jan-
06
Jun-
06
Nov
-06
Apr-
07
Sep-
07
Feb-
08
Jul-0
8 D
ec-0
8 M
ay-0
9 O
ct-0
9 M
ar-1
0 Au
g-10
Ja
n-11
Ju
n-11
N
ov-1
1 Ap
r-12
Se
p-12
Fe
b-13
Ju
l-13
Dec
-13
May
-14
Pure quant/systematic
Quant with discretionary views on single stocks
%
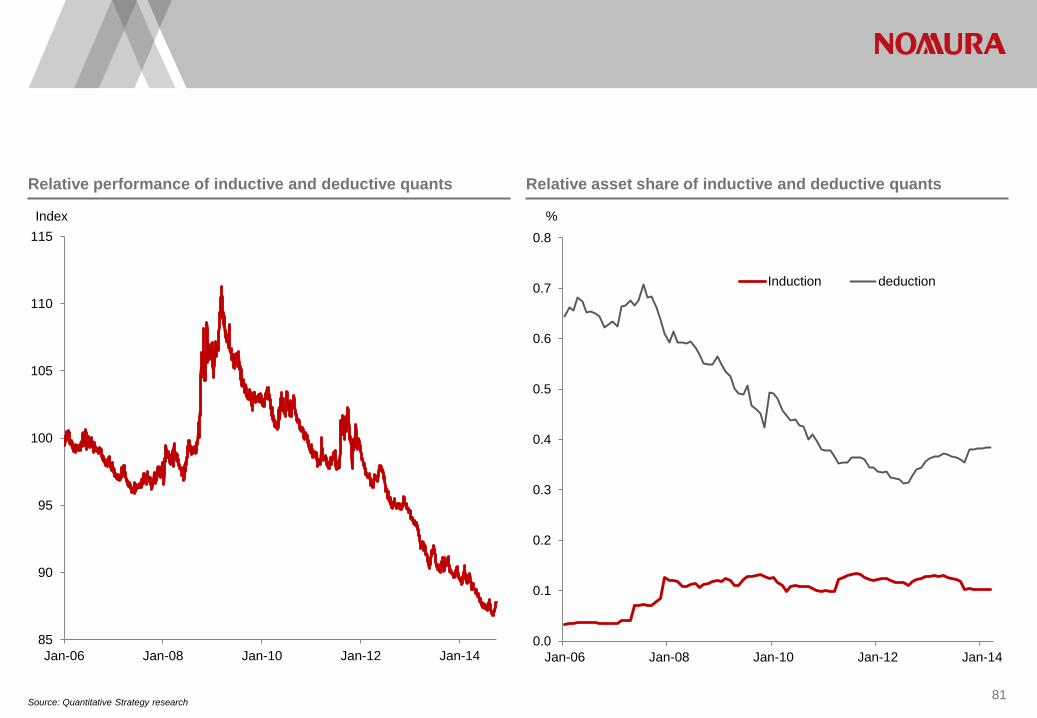
Source: Quantitative Strategy research 81
Relative performance of inductive and deductive quants Relative asset share of inductive and deductive quants
85
90
95
100
105
110
115
Jan-06 Jan-08 Jan-10 Jan-12 Jan-14
Index
0.0
0.1
0.2
0.3
0.4
0.5
0.6
0.7
0.8
Jan-06 Jan-08 Jan-10 Jan-12 Jan-14
%
Induction deduction
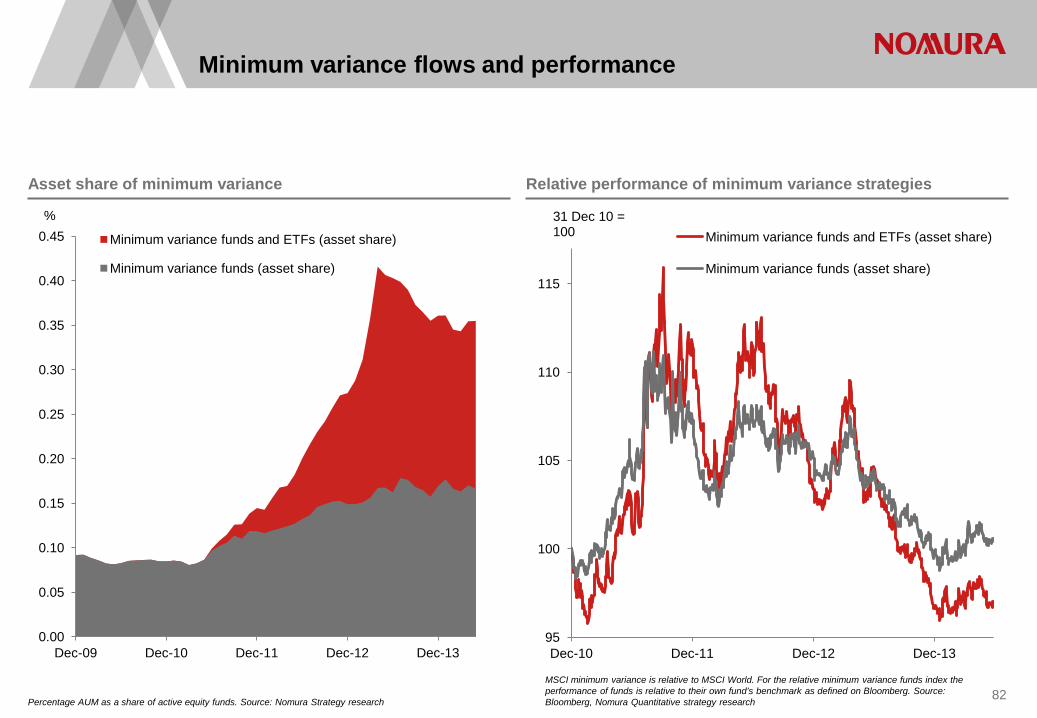
Minimum variance flows and performance
Percentage AUM as a share of active equity funds. Source: Nomura Strategy research 82
Asset share of minimum variance Relative performance of minimum variance strategies
MSCI minimum variance is relative to MSCI World. For the relative minimum variance funds index the performance of funds is relative to their own fund’s benchmark as defined on Bloomberg. Source: Bloomberg, Nomura Quantitative strategy research
95
100
105
110
115
Dec-10 Dec-11 Dec-12 Dec-13
31 Dec 10 = 100 Minimum variance funds and ETFs (asset share)
Minimum variance funds (asset share)
0.00
0.05
0.10
0.15
0.20
0.25
0.30
0.35
0.40
0.45
Dec-09 Dec-10 Dec-11 Dec-12 Dec-13
%
Minimum variance funds and ETFs (asset share)
Minimum variance funds (asset share)

Minimum variance: the volatility advantage and valuations
Volatility of the MSCI low volatility index less volatility of the MSCI World index, rolling 30-day periods. Source: Datastream, Bloomberg, Nomura Strategy research 83
Relative volatility of low volatility companies Relative price to book of the global minimum variance portfolio
-3.3
-2.8
-2.3
-1.8
-1.3
-0.8
-0.3
0.2
Feb-
06
Feb-
07
Feb-
08
Feb-
09
Feb-
10
Feb-
11
Feb-
12
Feb-
13
Feb-
14
%
Volatility of Min Var Sample of funds vs MSCI World
Volatility of MSCI Min Vol vs MSCI World
0.0
0.5
1.0
1.5
2.0
2.5
3.0
Jan-
90
Jan-
92
Jan-
94
Jan-
96
Jan-
98
Jan-
00
Jan-
02
Jan-
04
Jan-
06
Jan-
08
Jan-
10
Jan-
12
Jan-
14
Ratio
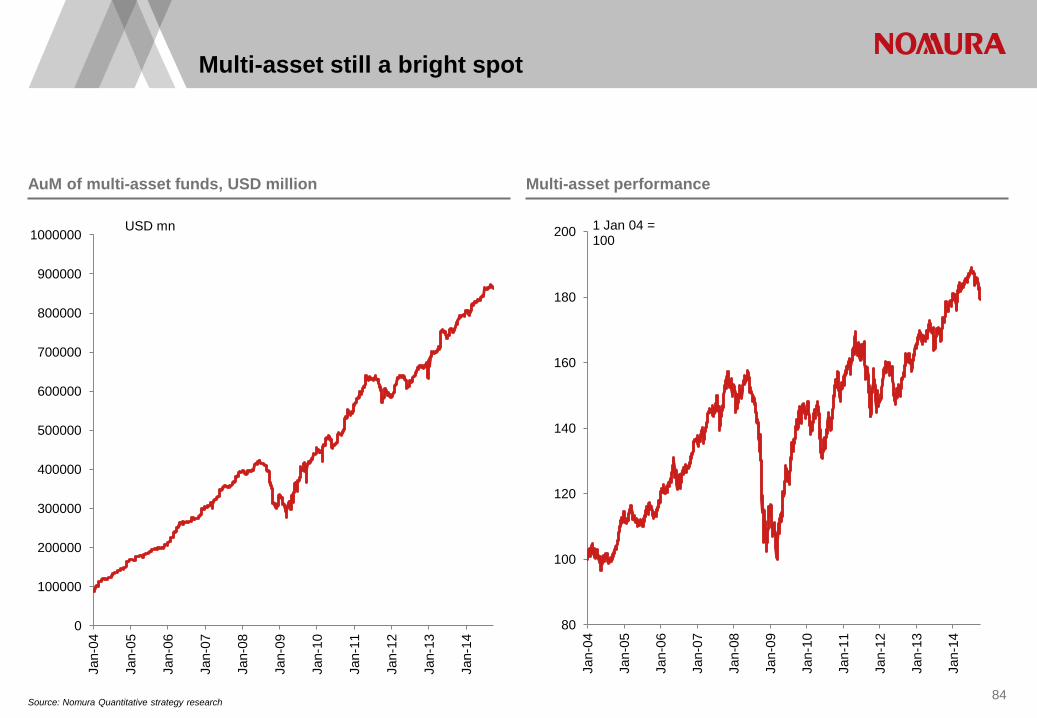
Multi-asset still a bright spot
Source: Nomura Quantitative strategy research 84
AuM of multi-asset funds, USD million Multi-asset performance
0
100000
200000
300000
400000
500000
600000
700000
800000
900000
1000000
Jan-
04
Jan-
05
Jan-
06
Jan-
07
Jan-
08
Jan-
09
Jan-
10
Jan-
11
Jan-
12
Jan-
13
Jan-
14
USD mn
80
100
120
140
160
180
200
Jan-
04
Jan-
05
Jan-
06
Jan-
07
Jan-
08
Jan-
09
Jan-
10
Jan-
11
Jan-
12
Jan-
13
Jan-
14
1 Jan 04 = 100
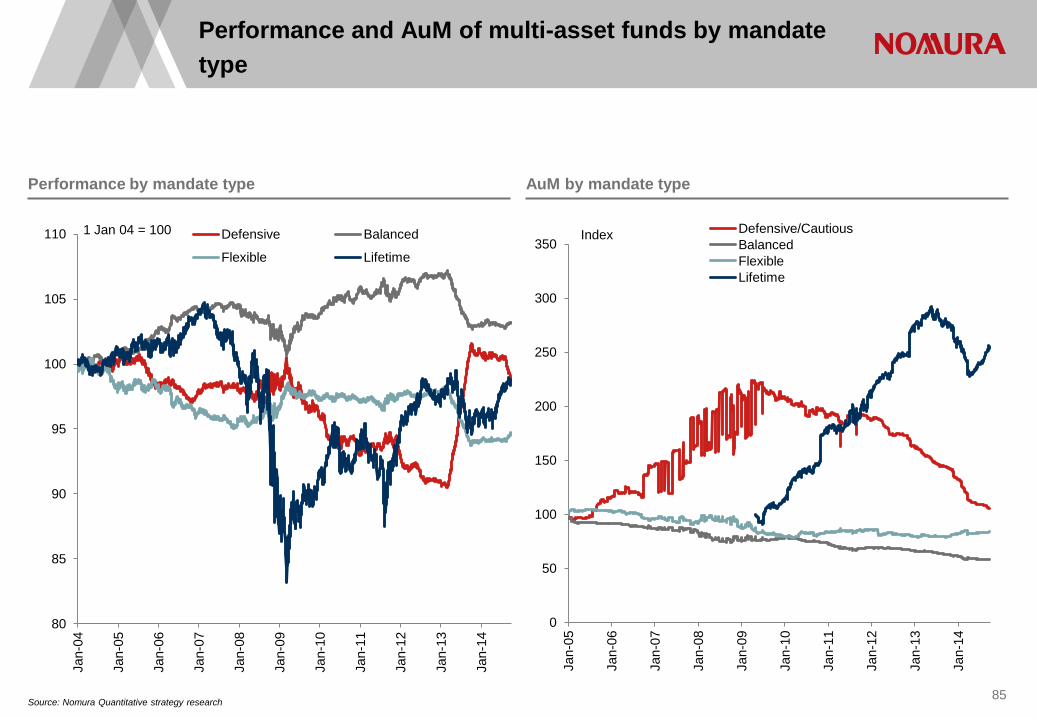
Performance and AuM of multi-asset funds by mandate type
Source: Nomura Quantitative strategy research 85
Performance by mandate type AuM by mandate type
80
85
90
95
100
105
110
Jan-
04
Jan-
05
Jan-
06
Jan-
07
Jan-
08
Jan-
09
Jan-
10
Jan-
11
Jan-
12
Jan-
13
Jan-
14
1 Jan 04 = 100 Defensive Balanced
Flexible Lifetime
0
50
100
150
200
250
300
350
Jan-
05
Jan-
06
Jan-
07
Jan-
08
Jan-
09
Jan-
10
Jan-
11
Jan-
12
Jan-
13
Jan-
14
Defensive/Cautious Balanced Flexible Lifetime
Index

Is passive the new active?

Passive used to mean tracking the cap-weighted index. This definition is now changing to include alternative/smart beta and other factor strategies. We think that a few criteria are desired for such strategies though:
• generate smooth outperformance over time;
• have no discretionary input;
• not concentrated in terms of individual stock positions;
• implementable in large size; and
• do not require heavy transactions costs
We are seeing this in practice with:
•in Japan the GPIF buying a quality-biased index; and
•the UK government proposing that the 89 local authority pension schemes sell all their actively managed fund positions and go fully passive, but the latter can include non market cap weighting.
This is also extending into alternatives – eg the adoption of risk premia strategies by Scandinavian pension funds.
87
Is passive the new active?
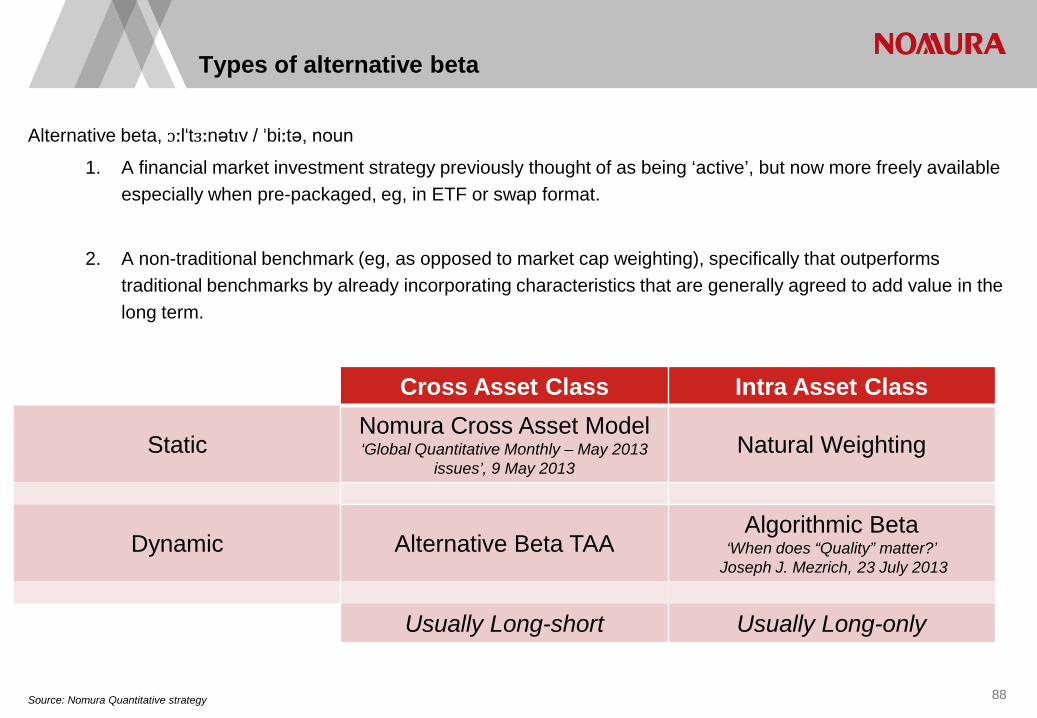
88
Types of alternative beta
Cross Asset Class Intra Asset Class
Static Nomura Cross Asset Model ‘Global Quantitative Monthly – May 2013
issues’, 9 May 2013 Natural Weighting
Dynamic Alternative Beta TAA Algorithmic Beta
‘When does “Quality” matter?’ Joseph J. Mezrich, 23 July 2013
Usually Long-short Usually Long-only
Source: Nomura Quantitative strategy
Alternative beta, ɔːlˈtɜːnətɪv / ˈbiːtə, noun
1. A financial market investment strategy previously thought of as being ‘active’, but now more freely available especially when pre-packaged, eg, in ETF or swap format.
2. A non-traditional benchmark (eg, as opposed to market cap weighting), specifically that outperforms traditional benchmarks by already incorporating characteristics that are generally agreed to add value in the long term.
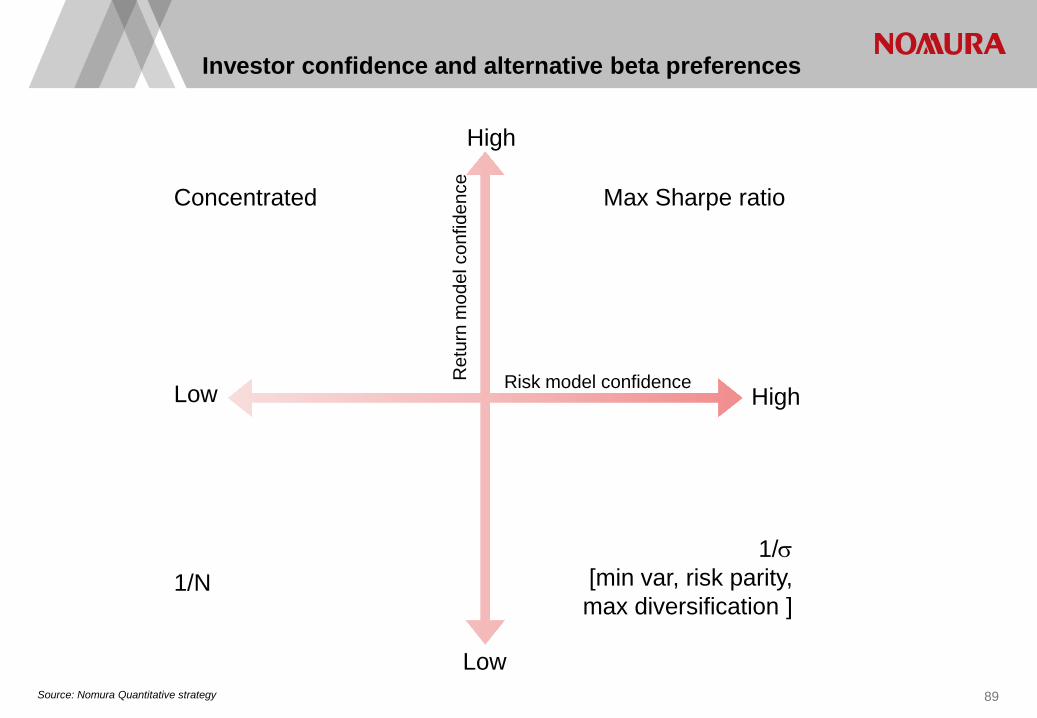
Investor confidence and alternative beta preferences
89
Risk model confidence
1/σ [min var, risk parity, max diversification ]
Low High
High
Concentrated Max Sharpe ratio
1/N
Low
Ret
urn
mod
el c
onfid
ence
Source: Nomura Quantitative strategy
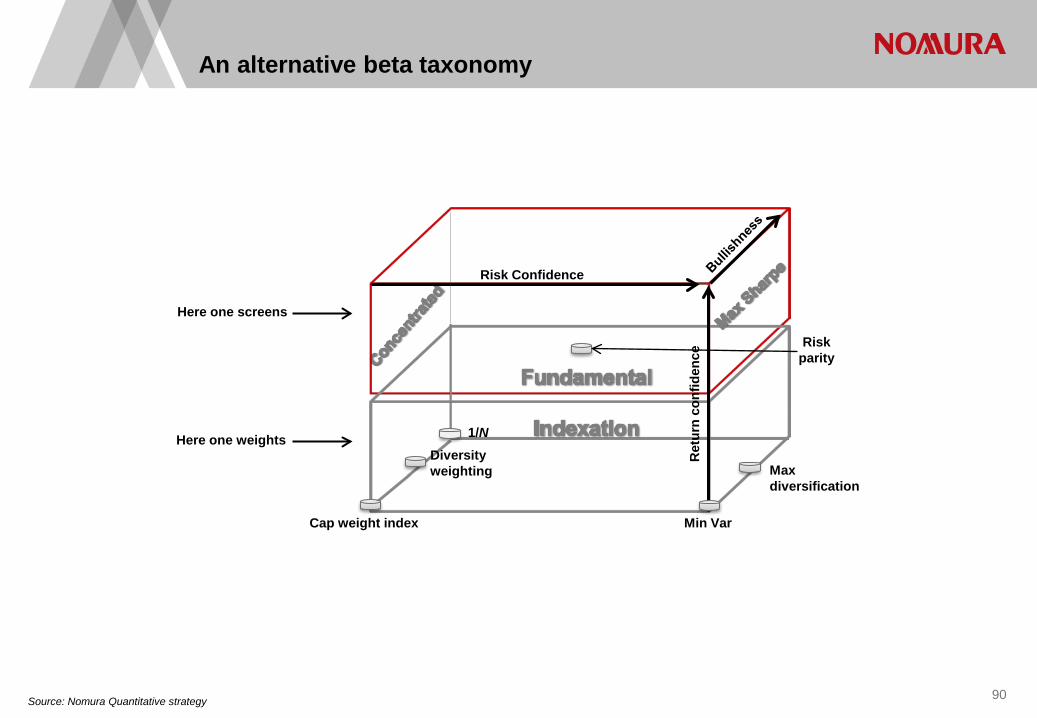
90
An alternative beta taxonomy
Max diversification
Risk parity
Risk Confidence
Min Var Cap weight index
Here one screens
Here one weights 1/N Diversity weighting
Ret
urn
conf
iden
ce
Source: Nomura Quantitative strategy
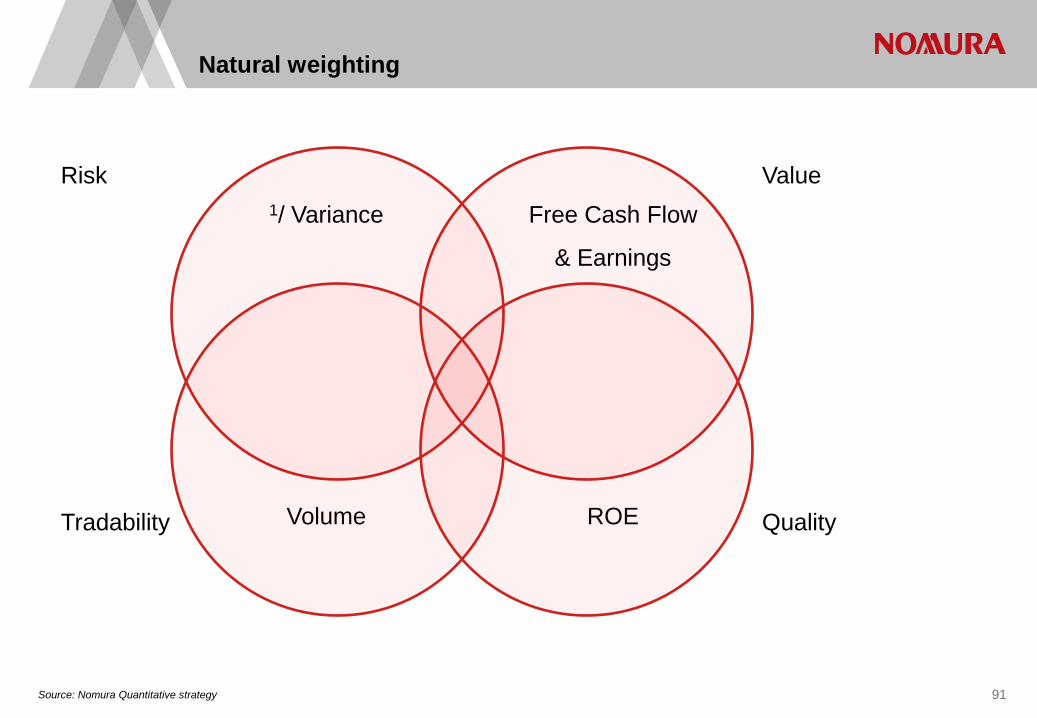
91
Natural weighting
1/ Variance
Volume
Free Cash Flow
& Earnings
ROE
Risk
Tradability
Value
Quality
Source: Nomura Quantitative strategy
Why natural indexation is different from the competition:
• It uses a range of variables to try to determine the natural weight of a stock in the index.
• The approach is anchored in mean-reversion which is a powerful long-term tool, and measures this with valuation, but this is offset with quality and risk measures. Meanwhile, the volume input ensures that the strategy is tradable in size and is geared towards large companies.
• The approach smoothly outperforms the cap weighted index, but without the extended periods of underperformance associated with approaches that are essentially mono-factor such as minimum variance and fundamental indexation.
• There is a clear rationale for why this focused approach should work.
92
Natural weighting
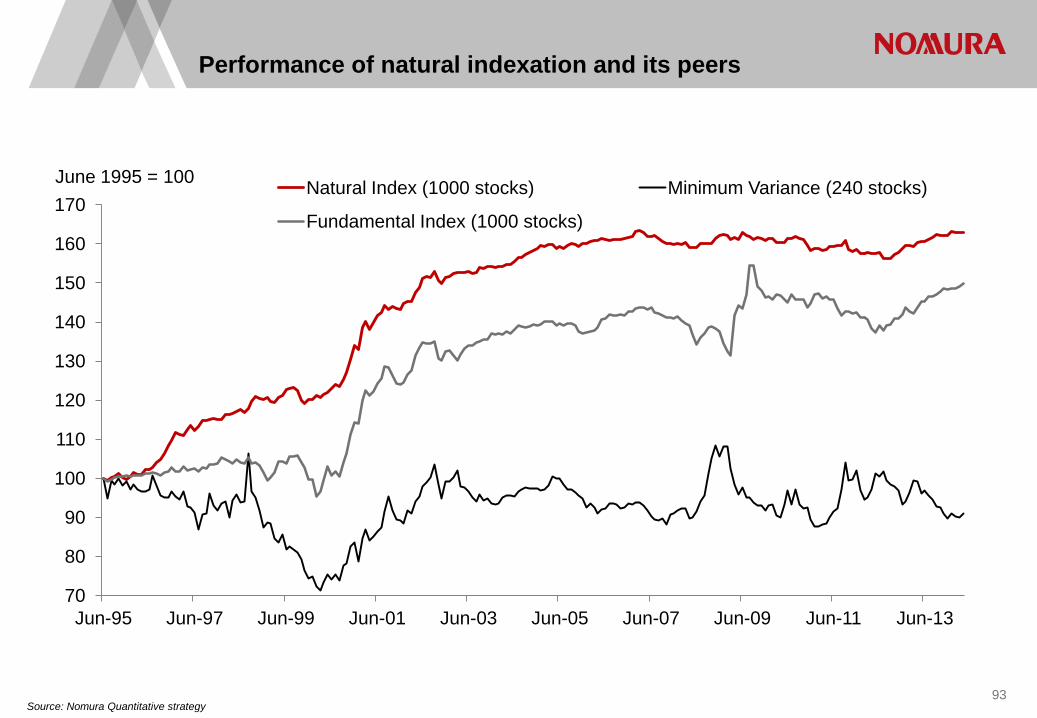
Performance of natural indexation and its peers
Source: Nomura Quantitative strategy 93
70
80
90
100
110
120
130
140
150
160
170
Jun-95 Jun-97 Jun-99 Jun-01 Jun-03 Jun-05 Jun-07 Jun-09 Jun-11 Jun-13
June 1995 = 100 Natural Index (1000 stocks) Minimum Variance (240 stocks)
Fundamental Index (1000 stocks)
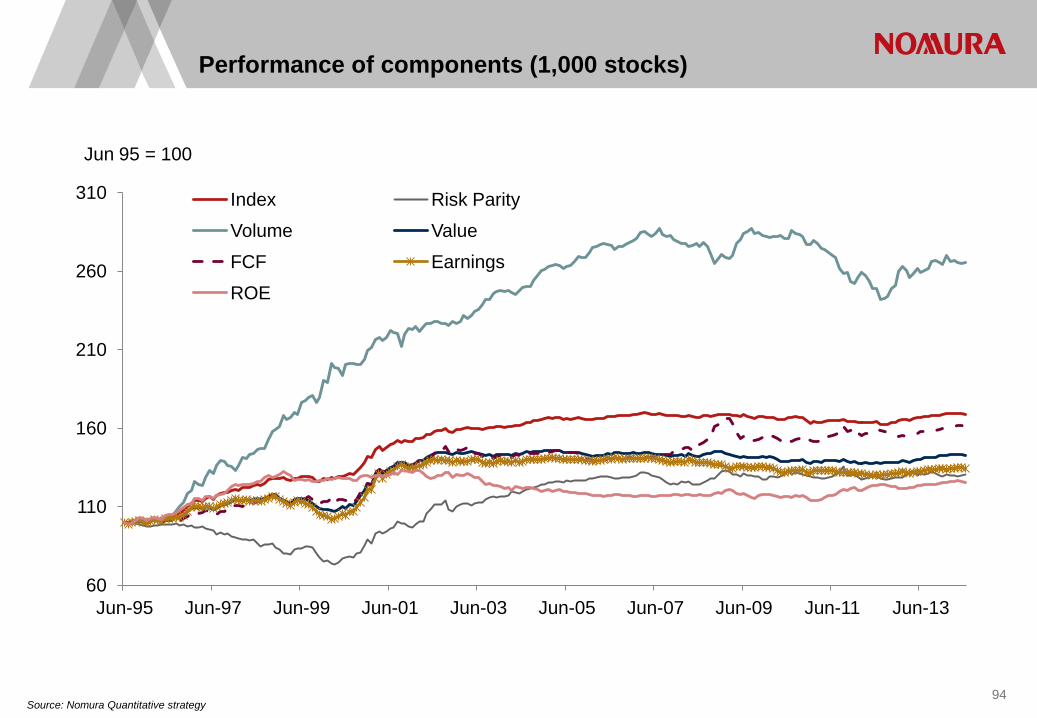
94
Performance of components (1,000 stocks)
Source: Nomura Quantitative strategy
60
110
160
210
260
310
Jun-95 Jun-97 Jun-99 Jun-01 Jun-03 Jun-05 Jun-07 Jun-09 Jun-11 Jun-13
Jun 95 = 100
Index Risk Parity
Volume Value
FCF Earnings
ROE
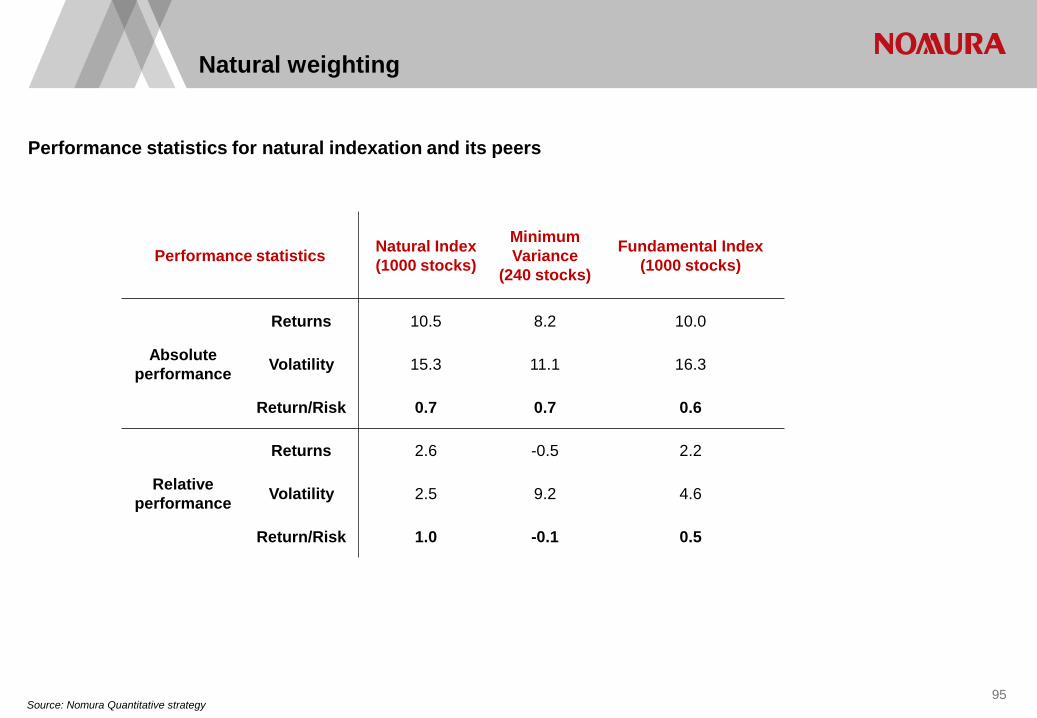
95
Natural weighting
Performance statistics Natural Index (1000 stocks)
Minimum Variance
(240 stocks)
Fundamental Index (1000 stocks)
Absolute performance
Returns 10.5 8.2 10.0
Volatility 15.3 11.1 16.3
Return/Risk 0.7 0.7 0.6
Relative performance
Returns 2.6 -0.5 2.2
Volatility 2.5 9.2 4.6
Return/Risk 1.0 -0.1 0.5
Performance statistics for natural indexation and its peers
Source: Nomura Quantitative strategy

Cross-asset alternative beta/risk premia investing
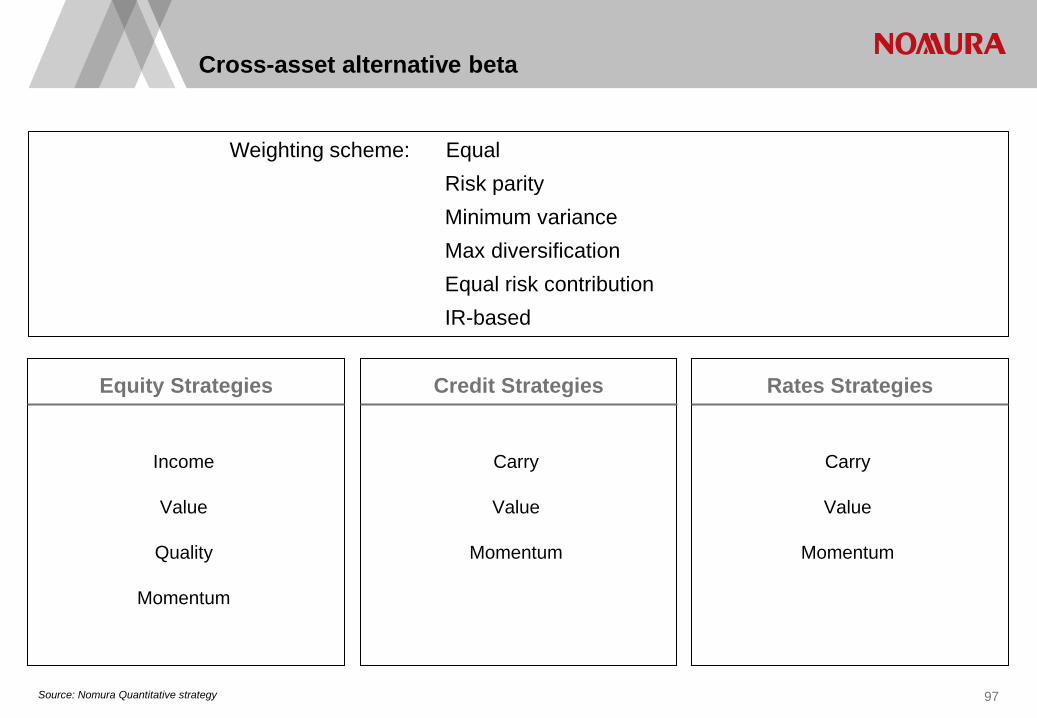
Income
Value
Quality
Momentum
Carry
Value
Momentum
Carry
Value
Momentum
Cross-asset alternative beta
Equity Strategies Credit Strategies Rates Strategies
Weighting scheme: Equal Risk parity Minimum variance Max diversification Equal risk contribution IR-based
Source: Nomura Quantitative strategy 97
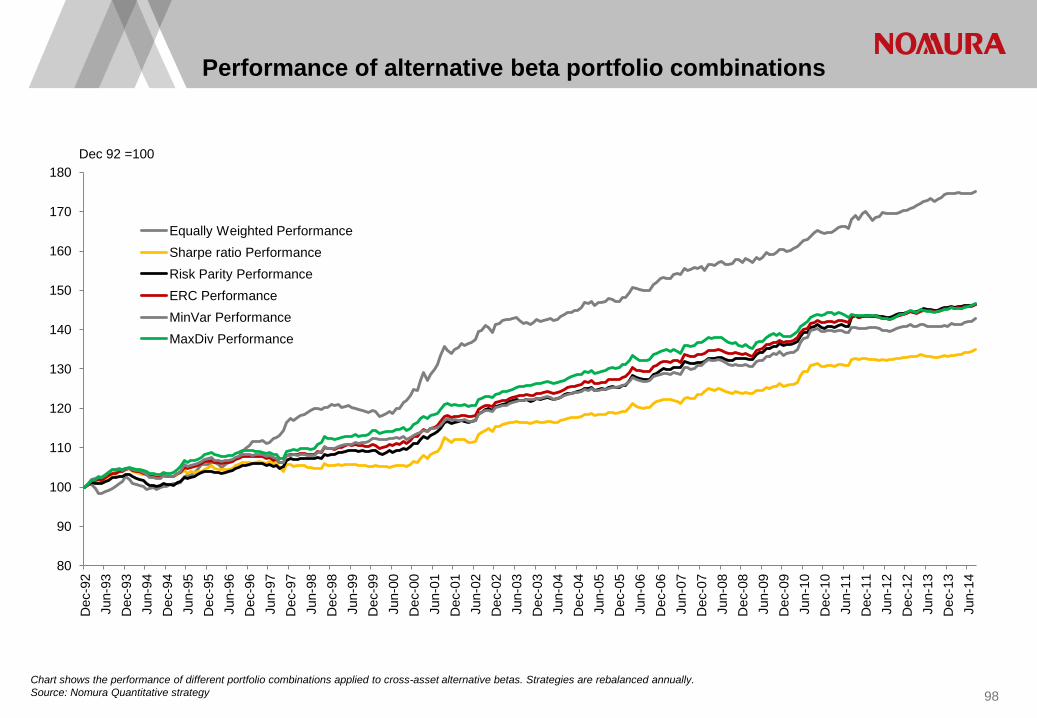
Performance of alternative beta portfolio combinations
Chart shows the performance of different portfolio combinations applied to cross-asset alternative betas. Strategies are rebalanced annually. Source: Nomura Quantitative strategy 98
80
90
100
110
120
130
140
150
160
170
180
Dec
-92
Jun-
93
Dec
-93
Jun-
94
Dec
-94
Jun-
95
Dec
-95
Jun-
96
Dec
-96
Jun-
97
Dec
-97
Jun-
98
Dec
-98
Jun-
99
Dec
-99
Jun-
00
Dec
-00
Jun-
01
Dec
-01
Jun-
02
Dec
-02
Jun-
03
Dec
-03
Jun-
04
Dec
-04
Jun-
05
Dec
-05
Jun-
06
Dec
-06
Jun-
07
Dec
-07
Jun-
08
Dec
-08
Jun-
09
Dec
-09
Jun-
10
Dec
-10
Jun-
11
Dec
-11
Jun-
12
Dec
-12
Jun-
13
Dec
-13
Jun-
14
Dec 92 =100
Equally Weighted Performance Sharpe ratio Performance Risk Parity Performance ERC Performance MinVar Performance MaxDiv Performance
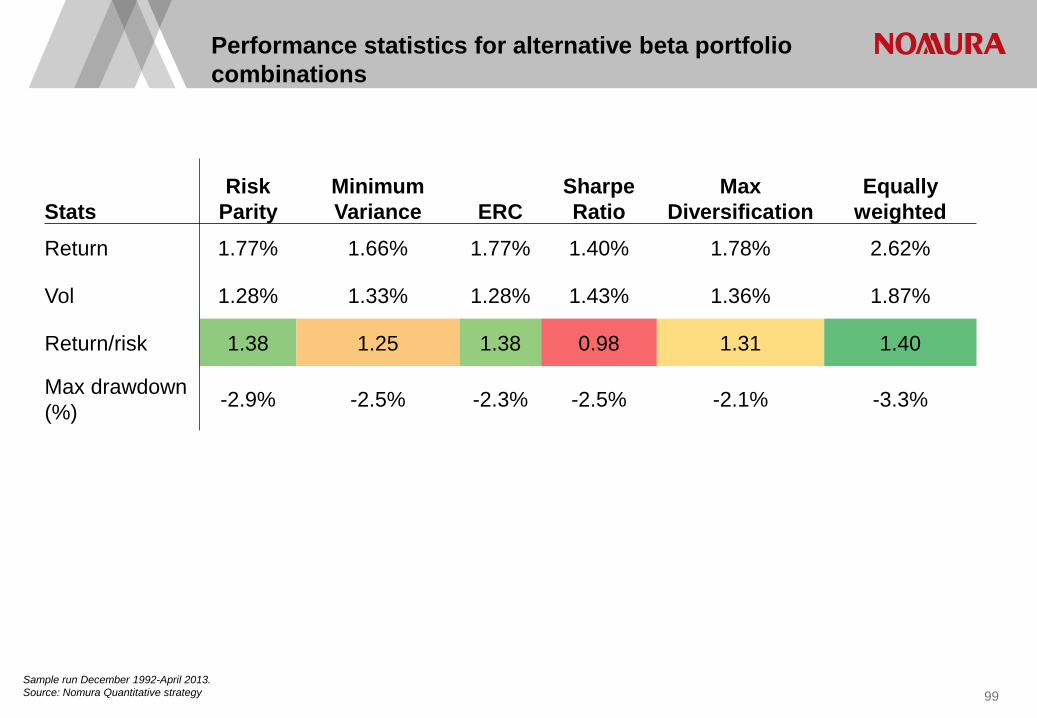
Performance statistics for alternative beta portfolio combinations
Sample run December 1992-April 2013. Source: Nomura Quantitative strategy 99
Stats Risk
Parity Minimum Variance ERC
Sharpe Ratio
Max Diversification
Equally weighted
Return 1.77% 1.66% 1.77% 1.40% 1.78% 2.62%
Vol 1.28% 1.33% 1.28% 1.43% 1.36% 1.87%
Return/risk 1.38 1.25 1.38 0.98 1.31 1.40
Max drawdown (%) -2.9% -2.5% -2.3% -2.5% -2.1% -3.3%
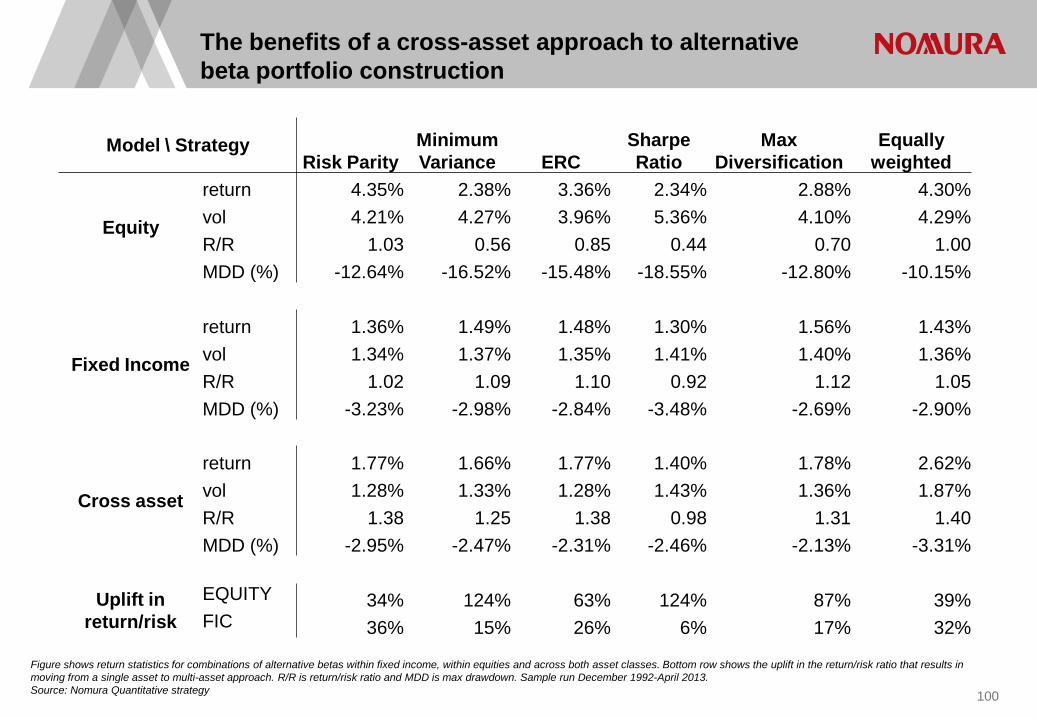
The benefits of a cross-asset approach to alternative beta portfolio construction
Figure shows return statistics for combinations of alternative betas within fixed income, within equities and across both asset classes. Bottom row shows the uplift in the return/risk ratio that results in moving from a single asset to multi-asset approach. R/R is return/risk ratio and MDD is max drawdown. Sample run December 1992-April 2013. Source: Nomura Quantitative strategy 100
Model \ Strategy Risk Parity
Minimum Variance ERC
Sharpe Ratio
Max Diversification
Equally weighted
Equity
return 4.35% 2.38% 3.36% 2.34% 2.88% 4.30% vol 4.21% 4.27% 3.96% 5.36% 4.10% 4.29% R/R 1.03 0.56 0.85 0.44 0.70 1.00 MDD (%) -12.64% -16.52% -15.48% -18.55% -12.80% -10.15%
Fixed Income
return 1.36% 1.49% 1.48% 1.30% 1.56% 1.43% vol 1.34% 1.37% 1.35% 1.41% 1.40% 1.36% R/R 1.02 1.09 1.10 0.92 1.12 1.05 MDD (%) -3.23% -2.98% -2.84% -3.48% -2.69% -2.90%
Cross asset
return 1.77% 1.66% 1.77% 1.40% 1.78% 2.62% vol 1.28% 1.33% 1.28% 1.43% 1.36% 1.87% R/R 1.38 1.25 1.38 0.98 1.31 1.40 MDD (%) -2.95% -2.47% -2.31% -2.46% -2.13% -3.31%
Uplift in return/risk
EQUITY 34% 124% 63% 124% 87% 39% FIC 36% 15% 26% 6% 17% 32%
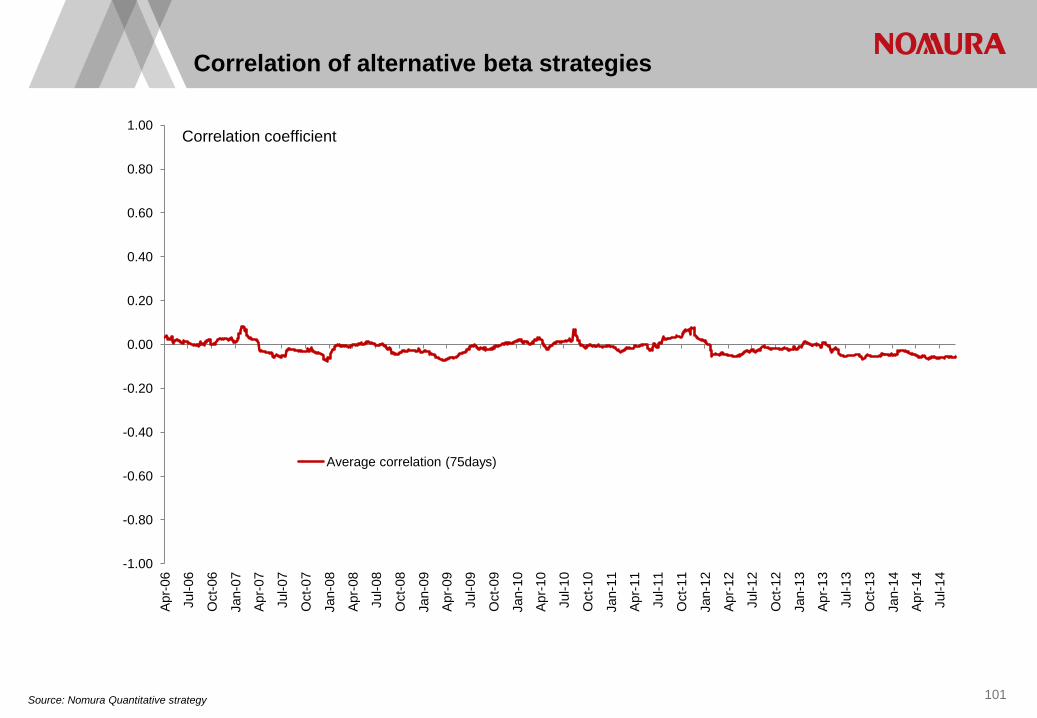
101 Source: Nomura Quantitative strategy
Correlation of alternative beta strategies
-1.00
-0.80
-0.60
-0.40
-0.20
0.00
0.20
0.40
0.60
0.80
1.00
Apr-
06
Jul-0
6
Oct
-06
Jan-
07
Apr-
07
Jul-0
7
Oct
-07
Jan-
08
Apr-
08
Jul-0
8
Oct
-08
Jan-
09
Apr-
09
Jul-0
9
Oct
-09
Jan-
10
Apr-
10
Jul-1
0
Oct
-10
Jan-
11
Apr-
11
Jul-1
1
Oct
-11
Jan-
12
Apr-
12
Jul-1
2
Oct
-12
Jan-
13
Apr-
13
Jul-1
3
Oct
-13
Jan-
14
Apr-
14
Jul-1
4
Correlation coefficient
Average correlation (75days)
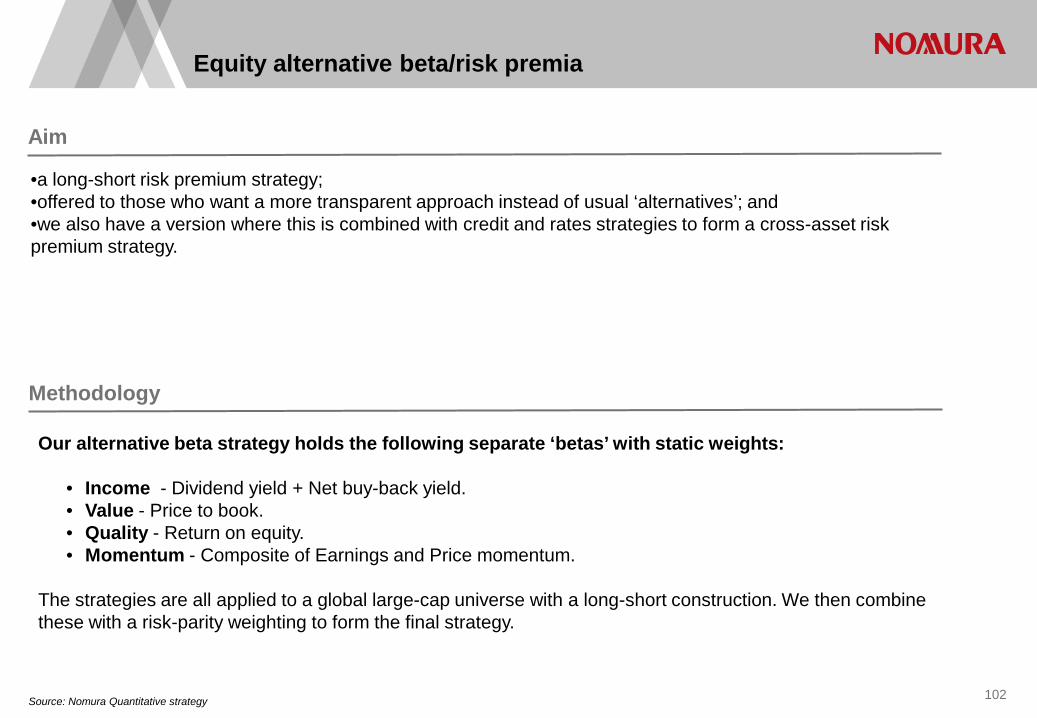
Source: Nomura Quantitative strategy 102
Equity alternative beta/risk premia
•a long-short risk premium strategy; •offered to those who want a more transparent approach instead of usual ‘alternatives’; and •we also have a version where this is combined with credit and rates strategies to form a cross-asset risk premium strategy.
Aim
Methodology
Our alternative beta strategy holds the following separate ‘betas’ with static weights:
• Income - Dividend yield + Net buy-back yield. • Value - Price to book. • Quality - Return on equity. • Momentum - Composite of Earnings and Price momentum.
The strategies are all applied to a global large-cap universe with a long-short construction. We then combine these with a risk-parity weighting to form the final strategy.
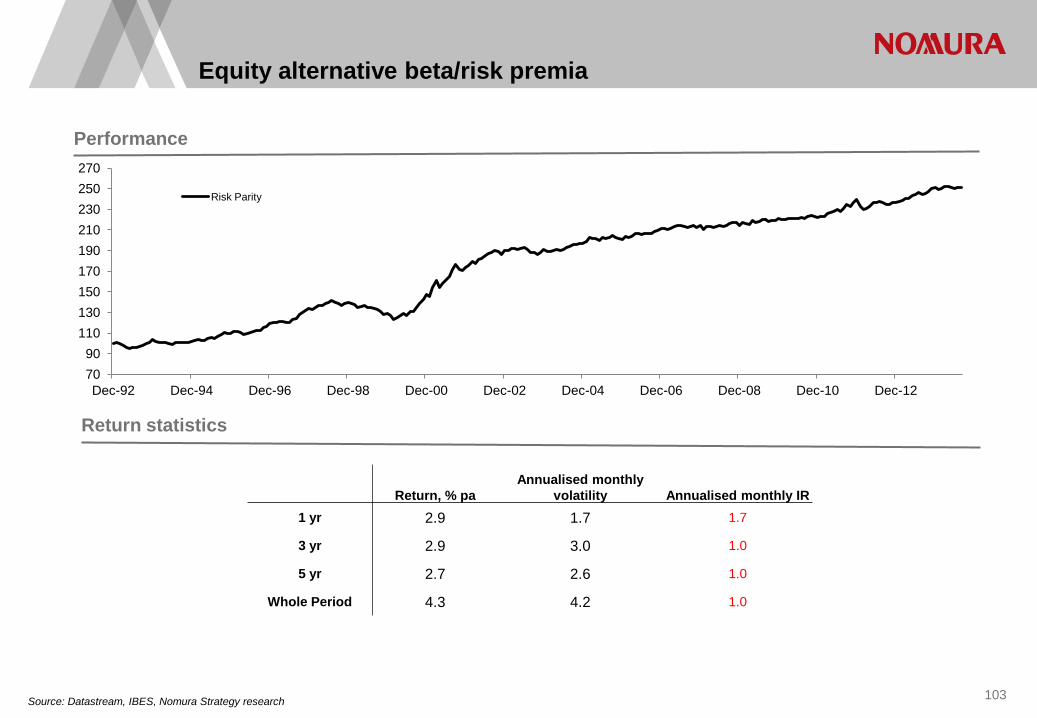
Source: Datastream, IBES, Nomura Strategy research 103
Performance
Return statistics
Equity alternative beta/risk premia
Return, % pa Annualised monthly
volatility Annualised monthly IR 1 yr 2.9 1.7 1.7
3 yr 2.9 3.0 1.0
5 yr 2.7 2.6 1.0
Whole Period 4.3 4.2 1.0
70 90
110 130 150 170 190 210 230 250 270
Dec-92 Dec-94 Dec-96 Dec-98 Dec-00 Dec-02 Dec-04 Dec-06 Dec-08 Dec-10 Dec-12
Risk Parity
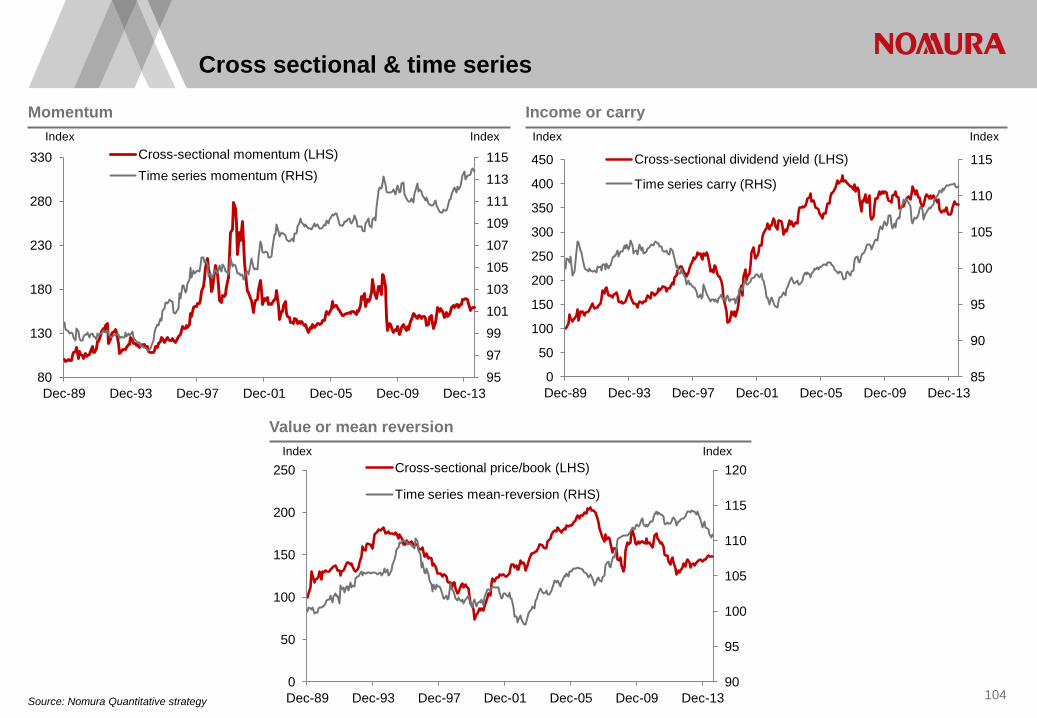
Cross sectional & time series
104
Momentum Income or carry
Value or mean reversion
95 97 99 101 103 105 107 109 111 113 115
80
130
180
230
280
330
Dec-89 Dec-93 Dec-97 Dec-01 Dec-05 Dec-09 Dec-13
Index Index Cross-sectional momentum (LHS) Time series momentum (RHS)
85
90
95
100
105
110
115
0
50
100
150
200
250
300
350
400
450
Dec-89 Dec-93 Dec-97 Dec-01 Dec-05 Dec-09 Dec-13
Index Index
Cross-sectional dividend yield (LHS)
Time series carry (RHS)
90
95
100
105
110
115
120
0
50
100
150
200
250
Dec-89 Dec-93 Dec-97 Dec-01 Dec-05 Dec-09 Dec-13
Index Index Cross-sectional price/book (LHS)
Time series mean-reversion (RHS)
Source: Nomura Quantitative strategy

105
Diversification benefit of time series and cross-sectional factors
Value/Mean-reversion Carry/Income Momentum
Cross-
Sectional Time Series Risk Parity
Combination Cross-
Sectional Time Series Risk Parity
Combination Cross-
Sectional Time Series Risk Parity
Combination
Return 1.6% 0.4% 2.2% 5.3% 0.4% 4.4% 1.9% 0.5% 3.8%
Vol 12.0% 1.8% 9.2% 15.8% 2.0% 11.8% 15.7% 1.4% 12.8%
R/R 0.14 0.23 0.24 0.34 0.22 0.37 0.12 0.38 0.30
The table shows the return/risk of the cross-sectional factors defined as the top-bottom quartile portfolio from the Top 500 stocks FTSE World and the times series factors defined at the index level. The Risk Parity portfolio is the risk weighted portfolio of the cross-sectional series with the volatility leveraged times series. The data are calculated using monthly returns from Dec-89. Source: Nomura Quantitative strategy
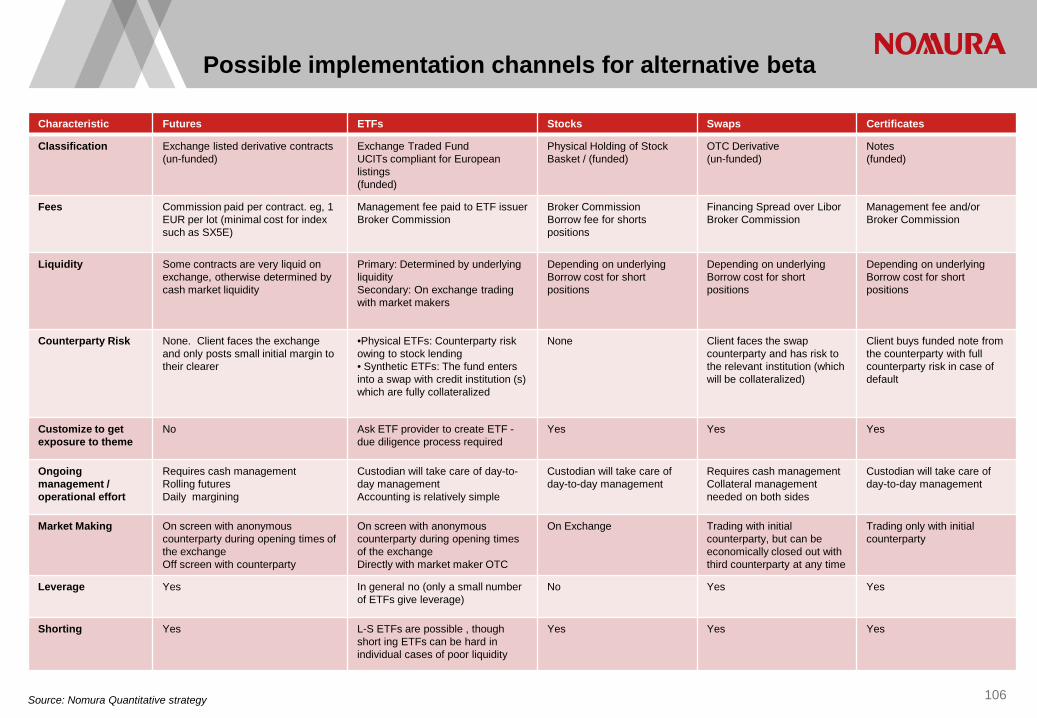
Characteristic Futures ETFs Stocks Swaps Certificates
Classification Exchange listed derivative contracts (un-funded)
Exchange Traded Fund UCITs compliant for European listings (funded)
Physical Holding of Stock Basket / (funded)
OTC Derivative (un-funded)
Notes (funded)
Fees Commission paid per contract. eg, 1 EUR per lot (minimal cost for index such as SX5E)
Management fee paid to ETF issuer Broker Commission
Broker Commission Borrow fee for shorts positions
Financing Spread over Libor Broker Commission
Management fee and/or Broker Commission
Liquidity Some contracts are very liquid on exchange, otherwise determined by cash market liquidity
Primary: Determined by underlying liquidity Secondary: On exchange trading with market makers
Depending on underlying Borrow cost for short positions
Depending on underlying Borrow cost for short positions
Depending on underlying Borrow cost for short positions
Counterparty Risk None. Client faces the exchange and only posts small initial margin to their clearer
•Physical ETFs: Counterparty risk owing to stock lending • Synthetic ETFs: The fund enters into a swap with credit institution (s) which are fully collateralized
None Client faces the swap counterparty and has risk to the relevant institution (which will be collateralized)
Client buys funded note from the counterparty with full counterparty risk in case of default
Customize to get exposure to theme
No Ask ETF provider to create ETF - due diligence process required
Yes Yes Yes
Ongoing management / operational effort
Requires cash management Rolling futures Daily margining
Custodian will take care of day-to-day management Accounting is relatively simple
Custodian will take care of day-to-day management
Requires cash management Collateral management needed on both sides
Custodian will take care of day-to-day management
Market Making On screen with anonymous counterparty during opening times of the exchange Off screen with counterparty
On screen with anonymous counterparty during opening times of the exchange Directly with market maker OTC
On Exchange Trading with initial counterparty, but can be economically closed out with third counterparty at any time
Trading only with initial counterparty
Leverage Yes In general no (only a small number of ETFs give leverage)
No Yes Yes
Shorting Yes L-S ETFs are possible , though short ing ETFs can be hard in individual cases of poor liquidity
Yes Yes Yes
Possible implementation channels for alternative beta
106 Source: Nomura Quantitative strategy

EM country selection
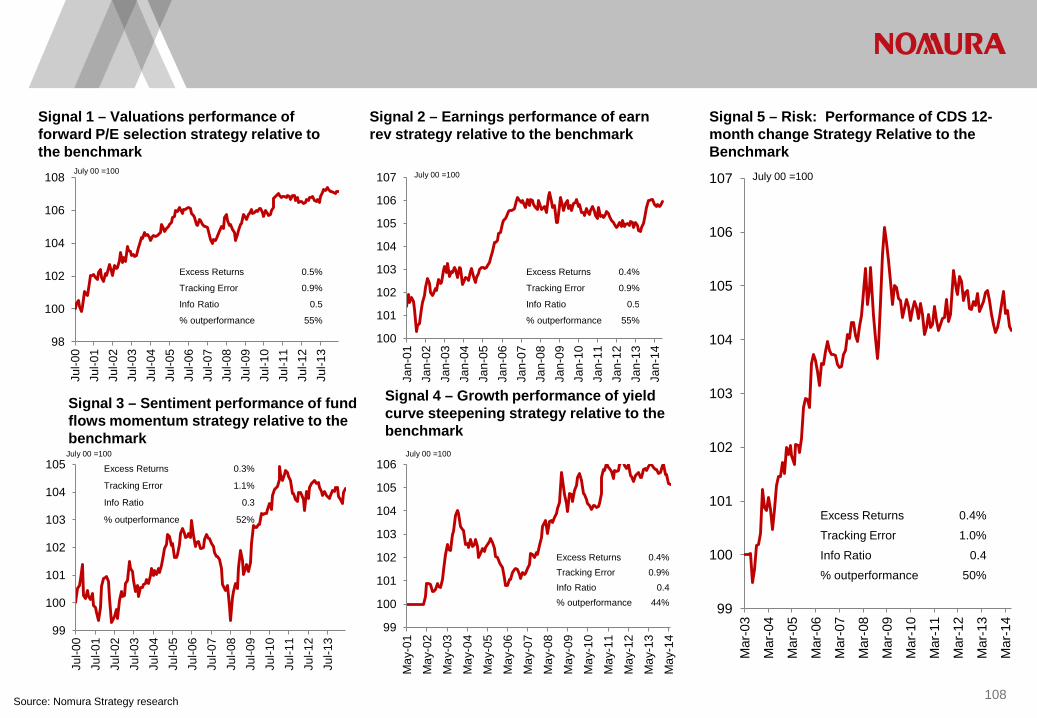
Signal 1 – Valuations performance of forward P/E selection strategy relative to the benchmark
Signal 2 – Earnings performance of earn rev strategy relative to the benchmark
Signal 3 – Sentiment performance of fund flows momentum strategy relative to the benchmark
Signal 4 – Growth performance of yield curve steepening strategy relative to the benchmark
98
100
102
104
106
108
Jul-0
0 Ju
l-01
Jul-0
2 Ju
l-03
Jul-0
4 Ju
l-05
Jul-0
6 Ju
l-07
Jul-0
8 Ju
l-09
Jul-1
0 Ju
l-11
Jul-1
2 Ju
l-13
100
101
102
103
104
105
106
107
Jan-
01
Jan-
02
Jan-
03
Jan-
04
Jan-
05
Jan-
06
Jan-
07
Jan-
08
Jan-
09
Jan-
10
Jan-
11
Jan-
12
Jan-
13
Jan-
14
July 00 =100
99
100
101
102
103
104
105
Jul-0
0 Ju
l-01
Jul-0
2 Ju
l-03
Jul-0
4 Ju
l-05
Jul-0
6 Ju
l-07
Jul-0
8 Ju
l-09
Jul-1
0 Ju
l-11
Jul-1
2 Ju
l-13
99
100
101
102
103
104
105
106
May
-01
May
-02
May
-03
May
-04
May
-05
May
-06
May
-07
May
-08
May
-09
May
-10
May
-11
May
-12
May
-13
May
-14
July 00 =100
July 00 =100 July 00 =100
Excess Returns 0.5%
Tracking Error 0.9%
Info Ratio 0.5
% outperformance 55%
Excess Returns 0.4%
Tracking Error 0.9%
Info Ratio 0.5
% outperformance 55%
Excess Returns 0.3%
Tracking Error 1.1%
Info Ratio 0.3
% outperformance 52%
Excess Returns 0.4% Tracking Error 0.9% Info Ratio 0.4 % outperformance 44%
Source: Nomura Strategy research
Signal 5 – Risk: Performance of CDS 12-month change Strategy Relative to the Benchmark
99
100
101
102
103
104
105
106
107
Mar
-03
Mar
-04
Mar
-05
Mar
-06
Mar
-07
Mar
-08
Mar
-09
Mar
-10
Mar
-11
Mar
-12
Mar
-13
Mar
-14
July 00 =100
Excess Returns 0.4%
Tracking Error 1.0%
Info Ratio 0.4
% outperformance 50%
108
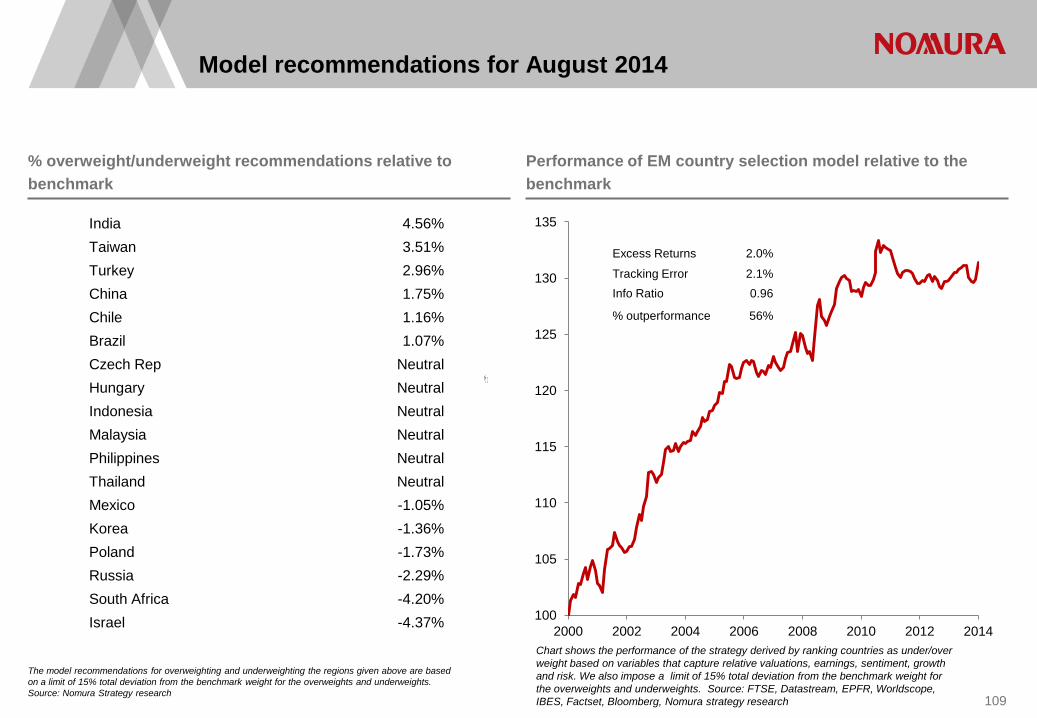
Model recommendations for August 2014
The model recommendations for overweighting and underweighting the regions given above are based on a limit of 15% total deviation from the benchmark weight for the overweights and underweights. Source: Nomura Strategy research
% overweight/underweight recommendations relative to benchmark
Performance of EM country selection model relative to the benchmark
Chart shows the performance of the strategy derived by ranking countries as under/over weight based on variables that capture relative valuations, earnings, sentiment, growth and risk. We also impose a limit of 15% total deviation from the benchmark weight for the overweights and underweights. Source: FTSE, Datastream, EPFR, Worldscope, IBES, Factset, Bloomberg, Nomura strategy research 109
India 4.56% Taiwan 3.51% Turkey 2.96% China 1.75% Chile 1.16% Brazil 1.07% Czech Rep Neutral Hungary Neutral Indonesia Neutral Malaysia Neutral Philippines Neutral Thailand Neutral Mexico -1.05% Korea -1.36% Poland -1.73% Russia -2.29% South Africa -4.20% Israel -4.37% 100
105
110
115
120
125
130
135
2000 2002 2004 2006 2008 2010 2012 2014
Excess Returns 2.0%
Tracking Error 2.1% Info Ratio 0.96
% outperformance 56%

Custom product services, website, Bloomberg access to models, data and Recommended Portfolio
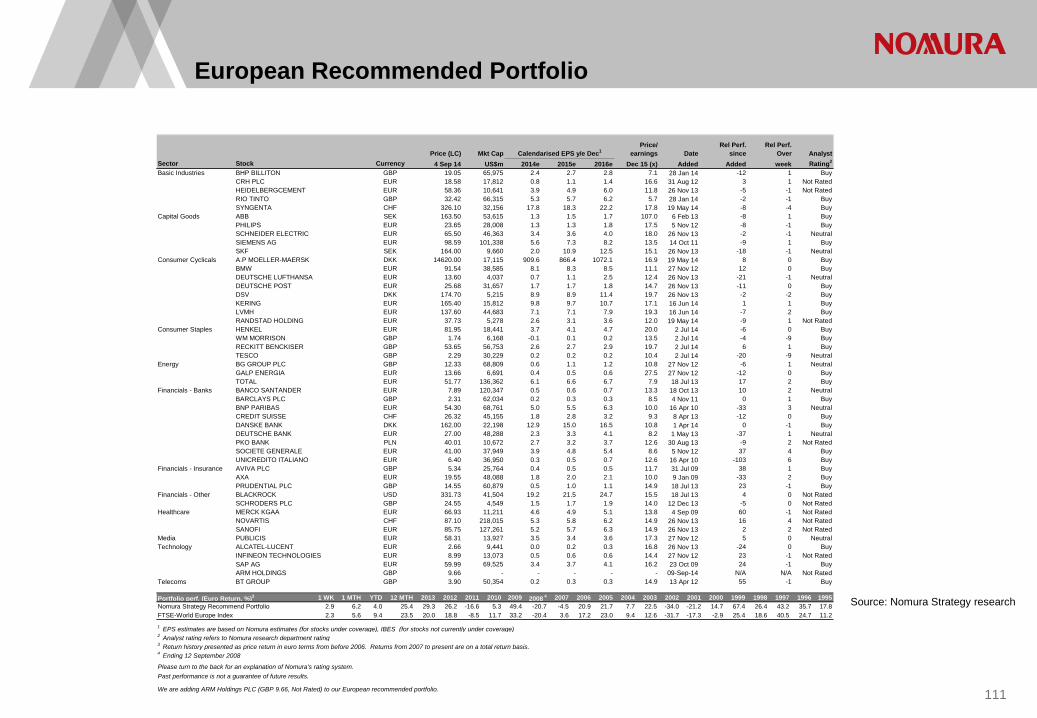
European Recommended Portfolio
111
Source: Nomura Strategy research
Price (LC) Mkt Cap Calendarised EPS y/e Dec1Price/
earnings DateRel Perf.
sinceRel Perf.
Over Analyst Sector Stock Currency 4 Sep 14 US$m 2014e 2015e 2016e Dec 15 (x) Added Added week Rating2
Basic Industries BHP BILLITON GBP 19.05 65,975 2.4 2.7 2.8 7.1 28 Jan 14 -12 1 BuyCRH PLC EUR 18.58 17,812 0.8 1.1 1.4 16.6 31 Aug 12 3 1 Not RatedHEIDELBERGCEMENT EUR 58.36 10,641 3.9 4.9 6.0 11.8 26 Nov 13 -5 -1 Not RatedRIO TINTO GBP 32.42 66,315 5.3 5.7 6.2 5.7 28 Jan 14 -2 -1 BuySYNGENTA CHF 326.10 32,156 17.8 18.3 22.2 17.8 19 May 14 -8 -4 Buy
Capital Goods ABB SEK 163.50 53,615 1.3 1.5 1.7 107.0 6 Feb 13 -8 1 BuyPHILIPS EUR 23.65 28,008 1.3 1.3 1.8 17.5 5 Nov 12 -8 -1 BuySCHNEIDER ELECTRIC EUR 65.50 46,363 3.4 3.6 4.0 18.0 26 Nov 13 -2 -1 NeutralSIEMENS AG EUR 98.59 101,338 5.6 7.3 8.2 13.5 14 Oct 11 -9 1 BuySKF SEK 164.00 9,660 2.0 10.9 12.5 15.1 26 Nov 13 -18 -1 Neutral
Consumer Cyclicals A.P MOELLER-MAERSK DKK 14620.00 17,115 909.6 866.4 1072.1 16.9 19 May 14 8 0 BuyBMW EUR 91.54 38,585 8.1 8.3 8.5 11.1 27 Nov 12 12 0 BuyDEUTSCHE LUFTHANSA EUR 13.60 4,037 0.7 1.1 2.5 12.4 26 Nov 13 -21 -1 NeutralDEUTSCHE POST EUR 25.68 31,657 1.7 1.7 1.8 14.7 26 Nov 13 -11 0 BuyDSV DKK 174.70 5,215 8.9 8.9 11.4 19.7 26 Nov 13 -2 -2 BuyKERING EUR 165.40 15,812 9.8 9.7 10.7 17.1 16 Jun 14 1 1 BuyLVMH EUR 137.60 44,683 7.1 7.1 7.9 19.3 16 Jun 14 -7 2 BuyRANDSTAD HOLDING EUR 37.73 5,278 2.6 3.1 3.6 12.0 19 May 14 -9 1 Not Rated
Consumer Staples HENKEL EUR 81.95 18,441 3.7 4.1 4.7 20.0 2 Jul 14 -6 0 BuyWM MORRISON GBP 1.74 6,168 -0.1 0.1 0.2 13.5 2 Jul 14 -4 -9 BuyRECKITT BENCKISER GBP 53.65 56,753 2.6 2.7 2.9 19.7 2 Jul 14 6 1 BuyTESCO GBP 2.29 30,229 0.2 0.2 0.2 10.4 2 Jul 14 -20 -9 Neutral
Energy BG GROUP PLC GBP 12.33 68,809 0.6 1.1 1.2 10.8 27 Nov 12 -6 1 NeutralGALP ENERGIA EUR 13.66 6,691 0.4 0.5 0.6 27.5 27 Nov 12 -12 0 BuyTOTAL EUR 51.77 136,362 6.1 6.6 6.7 7.9 18 Jul 13 17 2 Buy
Financials - Banks BANCO SANTANDER EUR 7.89 120,347 0.5 0.6 0.7 13.3 18 Oct 13 10 2 NeutralBARCLAYS PLC GBP 2.31 62,034 0.2 0.3 0.3 8.5 4 Nov 11 0 1 BuyBNP PARIBAS EUR 54.30 68,761 5.0 5.5 6.3 10.0 16 Apr 10 -33 3 NeutralCREDIT SUISSE CHF 26.32 45,155 1.8 2.8 3.2 9.3 8 Apr 13 -12 0 BuyDANSKE BANK DKK 162.00 22,198 12.9 15.0 16.5 10.8 1 Apr 14 0 -1 BuyDEUTSCHE BANK EUR 27.00 48,288 2.3 3.3 4.1 8.2 1 May 13 -37 1 NeutralPKO BANK PLN 40.01 10,672 2.7 3.2 3.7 12.6 30 Aug 13 -9 2 Not RatedSOCIETE GENERALE EUR 41.00 37,949 3.9 4.8 5.4 8.6 5 Nov 12 37 4 BuyUNICREDITO ITALIANO EUR 6.40 36,950 0.3 0.5 0.7 12.6 16 Apr 10 -103 6 Buy
Financials - Insurance AVIVA PLC GBP 5.34 25,764 0.4 0.5 0.5 11.7 31 Jul 09 38 1 BuyAXA EUR 19.55 48,088 1.8 2.0 2.1 10.0 9 Jan 09 -33 2 BuyPRUDENTIAL PLC GBP 14.55 60,879 0.5 1.0 1.1 14.9 18 Jul 13 23 -1 Buy
Financials - Other BLACKROCK USD 331.73 41,504 19.2 21.5 24.7 15.5 18 Jul 13 4 0 Not RatedSCHRODERS PLC GBP 24.55 4,549 1.5 1.7 1.9 14.0 12 Dec 13 -5 0 Not Rated
Healthcare MERCK KGAA EUR 66.93 11,211 4.6 4.9 5.1 13.8 4 Sep 09 60 -1 Not RatedNOVARTIS CHF 87.10 218,015 5.3 5.8 6.2 14.9 26 Nov 13 16 4 Not RatedSANOFI EUR 85.75 127,261 5.2 5.7 6.3 14.9 26 Nov 13 2 2 Not Rated
Media PUBLICIS EUR 58.31 13,927 3.5 3.4 3.6 17.3 27 Nov 12 5 0 NeutralTechnology ALCATEL-LUCENT EUR 2.66 9,441 0.0 0.2 0.3 16.8 26 Nov 13 -24 0 Buy
INFINEON TECHNOLOGIES EUR 8.99 13,073 0.5 0.6 0.6 14.4 27 Nov 12 23 -1 Not RatedSAP AG EUR 59.99 69,525 3.4 3.7 4.1 16.2 23 Oct 09 24 -1 BuyARM HOLDINGS GBP 9.66 - - - - - 09-Sep-14 N/A N/A Not Rated
Telecoms BT GROUP GBP 3.90 50,354 0.2 0.3 0.3 14.9 13 Apr 12 55 -1 Buy
Portfolio perf. (Euro Return, %)3 1 WK 1 MTH YTD 12 MTH 2013 2012 2011 2010 2009 2008 4 2007 2006 2005 2004 2003 2002 2001 2000 1999 1998 1997 1996 1995Nomura Strategy Recommend Portfolio 2.9 6.2 4.0 25.4 29.3 26.2 -16.6 5.3 49.4 -20.7 -4.5 20.9 21.7 7.7 22.5 -34.0 -21.2 14.7 67.4 26.4 43.2 35.7 17.8FTSE-World Europe Index 2.3 5.6 9.4 23.5 20.0 18.8 -8.5 11.7 33.2 -20.4 3.6 17.2 23.0 9.4 12.6 -31.7 -17.3 -2.9 25.4 18.6 40.5 24.7 11.2
1 EPS estimates are based on Nomura estimates (for stocks under coverage), IBES (for stocks not currently under coverage)2 Analyst rating refers to Nomura research department rating3 Return history presented as price return in euro terms from before 2006. Returns from 2007 to present are on a total return basis.4 Ending 12 September 2008
Please turn to the back for an explanation of Nomura's rating system.Past performance is not a guarantee of future results.
We are adding ARM Holdings PLC (GBP 9.66, Not Rated) to our European recommended portfolio.
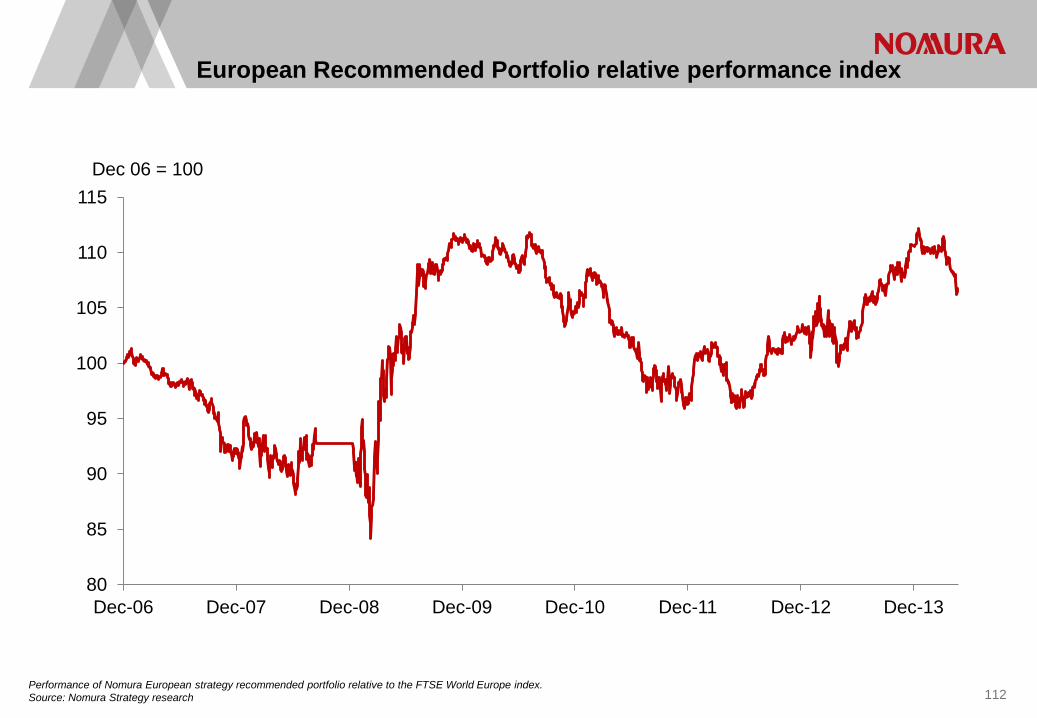
European Recommended Portfolio relative performance index
Performance of Nomura European strategy recommended portfolio relative to the FTSE World Europe index. Source: Nomura Strategy research 112
80
85
90
95
100
105
110
115
Dec-06 Dec-07 Dec-08 Dec-09 Dec-10 Dec-11 Dec-12 Dec-13
Dec 06 = 100

Source: Nomura Strategy research
StrategyInsight https://apps.nomuranow.com/EQS
113

114
1Ratios reflect Earnings Before Goodwill Amortisation 2Financials excluding Real Estate 3Asia ex Japan = Australia, Hong Kong, New Zealand & Singapore Source: Worldscope, FTSE, I/B/E/S, Nomura Strategy research
Global valuation and profitability
12 month Forward PE1
Current Values Post 1990 Average
US Eur ex UK UK Japan Asia ex Jp3 Emerging World US Eur ex UK UK Japan Asia ex Jp3 Emerging WorldEnergy 14.0 11.2 10.4 10.5 15.3 7.3 13.0 Energy 15.3 12.4 13.6 30.0 14.3 13.8 14.4Materials 16.6 15.3 11.7 13.4 13.2 12.3 14.8 Materials 15.1 12.5 11.6 9.0 12.9 10.7 14.5Industrials 15.9 14.8 14.9 13.4 15.7 13.8 15.2 Industrials 15.8 13.0 11.6 28.8 15.4 13.3 16.3Consumer Discretionary 17.3 13.0 15.1 12.2 15.6 11.9 14.9 Consumer Discretionary 17.5 14.7 14.3 48.0 17.5 11.5 17.4Consumer Staples 17.3 18.6 16.5 19.3 17.2 21.0 17.7 Consumer Staples 14.7 16.6 13.0 29.5 15.8 16.1 15.2Healthcare 16.4 17.5 17.1 25.1 20.8 15.9 16.9 Healthcare 17.5 17.5 16.7 23.5 20.6 14.4 17.8Financials2 13.7 11.3 11.3 12.9 13.9 8.8 12.7 Financials2 12.1 12.5 12.2 34.7 12.8 15.2 14.2Information Tech 14.8 18.2 26.9 17.1 17.3 12.1 14.5 Information Tech 20.2 21.1 20.5 29.9 16.7 16.3 20.8Telecom Services 13.4 15.6 20.2 15.0 16.3 14.8 15.1 Telecom Services 16.6 16.0 13.7 26.1 15.1 14.7 15.5Utilities 16.0 14.5 15.2 17.9 13.7 11.8 15.3 Utilities 13.2 13.9 10.2 27.2 13.6 13.2 13.8Market 15.4 14.2 13.3 14.2 14.5 10.9 14.6 Market 15.5 13.9 12.6 28.3 13.9 12.5 15.7
Enterprise Value / Sales
Current Values Post 1990 Average
US Eur ex UK UK Japan Asia ex Jp3 Emerging World US Eur ex UK UK Japan Asia ex Jp3 Emerging WorldEnergy 1.6 0.8 0.7 0.3 1.9 0.8 1.2 Energy 1.3 1.0 1.1 0.5 2.5 1.1 1.1Materials 2.0 1.3 1.0 0.9 2.5 1.3 1.4 Materials 1.5 1.0 1.4 1.1 1.8 1.7 1.3Industrials 2.1 1.1 1.4 1.0 1.2 0.9 1.4 Industrials 1.8 0.8 0.9 0.8 1.5 1.2 1.1Consumer Discretionary 1.8 1.2 1.5 0.8 1.9 1.2 1.4 Consumer Discretionary 1.4 0.8 1.2 0.8 2.3 2.0 1.1Consumer Staples 1.4 1.5 1.9 0.9 0.8 1.5 1.4 Consumer Staples 1.7 1.1 1.3 0.7 0.9 1.6 1.3Healthcare 2.1 3.8 3.9 1.3 4.5 3.3 2.4 Healthcare 2.3 2.9 3.7 1.7 2.7 3.2 2.5Financials2,4 NA NA NA NA NA NA NA Financials2 NA NA NA NA NA NA NAInformation Tech 2.8 1.9 8.5 0.9 3.5 1.0 1.9 Information Tech 2.6 1.6 2.8 0.9 1.6 1.8 1.8Telecom Services 2.4 1.9 1.4 1.8 3.2 2.1 2.1 Telecom Services 2.9 2.4 2.7 1.7 4.1 4.6 2.4Utilities 2.9 1.0 1.6 1.4 3.2 2.0 1.7 Utilities 2.2 1.3 1.6 2.3 4.1 3.6 1.8Market ex Financials 2.0 1.4 1.3 0.9 1.7 1.2 1.6 Market ex Financials 1.8 1.1 1.3 0.9 1.9 1.8 1.3
Enterprise Value / EBITDA
Current Values Post 1990 Average
US Eur ex UK UK Japan Asia ex Jp3 Emerging World US Eur ex UK UK Japan Asia ex Jp3 Emerging WorldEnergy 7.3 3.9 6.1 5.7 13.1 5.0 6.5 Energy 7.5 5.3 7.0 8.3 6.5 11.2 6.7Materials 9.8 9.3 7.1 7.2 7.3 8.2 8.6 Materials 8.4 6.1 6.9 9.7 7.6 10.2 7.7Industrials 11.9 9.2 8.7 8.7 10.0 10.8 10.4 Industrials 10.1 6.7 6.6 11.6 8.0 8.3 9.3Consumer Discretionary 10.8 8.0 10.4 7.1 11.8 7.9 9.2 Consumer Discretionary 9.2 6.2 8.6 8.4 13.8 10.5 8.3Consumer Staples 11.4 11.1 10.7 8.0 10.5 13.7 11.0 Consumer Staples 10.5 8.9 8.5 9.1 9.2 10.4 9.6Healthcare 12.7 13.6 10.3 10.6 18.3 14.4 12.7 Healthcare 12.5 10.8 11.3 9.3 13.3 12.5 11.8Financials2 NA NA NA NA NA NA NA Financials2 NA NA NA NA NA NA NAInformation Tech 10.4 11.7 11.8 7.2 17.8 5.8 8.9 Information Tech 12.1 10.6 14.2 8.1 11.5 10.3 10.7Telecom Services 6.5 5.7 4.8 5.9 8.9 6.2 6.1 Telecom Services 6.9 5.7 6.6 5.3 9.3 9.0 6.2Utilities 9.2 4.9 8.5 10.8 14.2 7.9 7.8 Utilities 7.4 6.0 6.3 11.0 11.5 9.3 7.4Market ex Financials 10.1 8.0 8.0 7.8 10.0 7.2 9.0 Market ex Financials 9.5 6.7 7.2 9.3 9.1 8.9 8.5
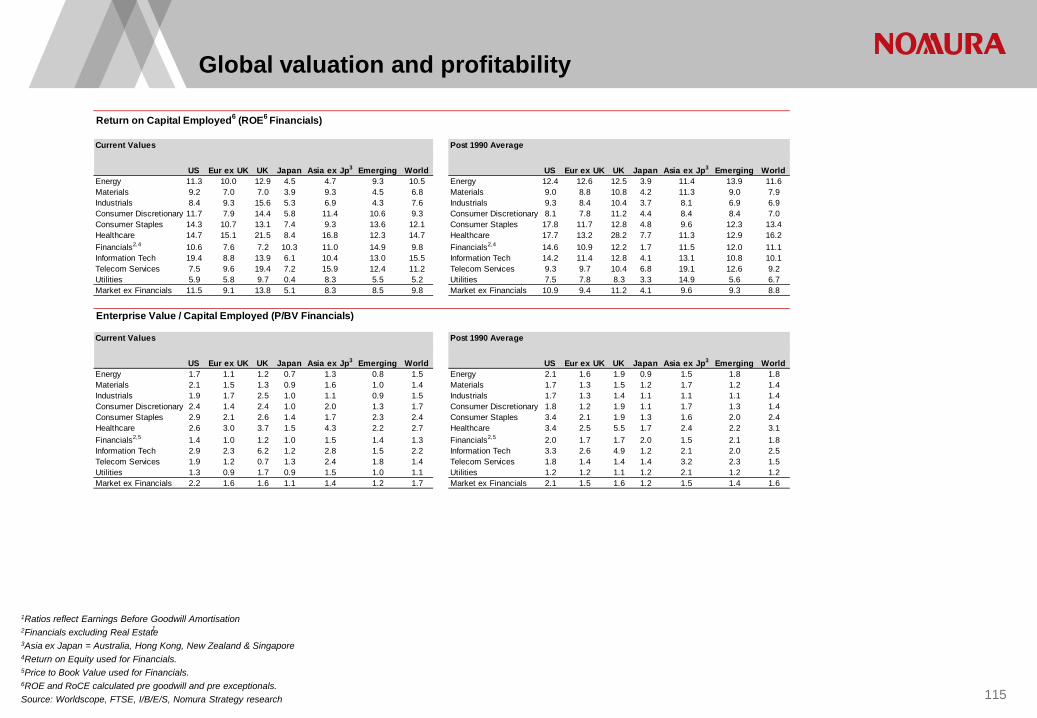
115
1Ratios reflect Earnings Before Goodwill Amortisation 2Financials excluding Real Estate 3Asia ex Japan = Australia, Hong Kong, New Zealand & Singapore 4Return on Equity used for Financials. 5Price to Book Value used for Financials. 6ROE and RoCE calculated pre goodwill and pre exceptionals. Source: Worldscope, FTSE, I/B/E/S, Nomura Strategy research
Global valuation and profitability
1
Current Values Post 1990 Average
US Eur ex UK UK Japan Asia ex Jp3 Emerging World US Eur ex UK UK Japan Asia ex Jp3 Emerging WorldEnergy 11.3 10.0 12.9 4.5 4.7 9.3 10.5 Energy 12.4 12.6 12.5 3.9 11.4 13.9 11.6Materials 9.2 7.0 7.0 3.9 9.3 4.5 6.8 Materials 9.0 8.8 10.8 4.2 11.3 9.0 7.9Industrials 8.4 9.3 15.6 5.3 6.9 4.3 7.6 Industrials 9.3 8.4 10.4 3.7 8.1 6.9 6.9Consumer Discretionary 11.7 7.9 14.4 5.8 11.4 10.6 9.3 Consumer Discretionary 8.1 7.8 11.2 4.4 8.4 8.4 7.0Consumer Staples 14.3 10.7 13.1 7.4 9.3 13.6 12.1 Consumer Staples 17.8 11.7 12.8 4.8 9.6 12.3 13.4Healthcare 14.7 15.1 21.5 8.4 16.8 12.3 14.7 Healthcare 17.7 13.2 28.2 7.7 11.3 12.9 16.2Financials2,4 10.6 7.6 7.2 10.3 11.0 14.9 9.8 Financials2,4 14.6 10.9 12.2 1.7 11.5 12.0 11.1Information Tech 19.4 8.8 13.9 6.1 10.4 13.0 15.5 Information Tech 14.2 11.4 12.8 4.1 13.1 10.8 10.1Telecom Services 7.5 9.6 19.4 7.2 15.9 12.4 11.2 Telecom Services 9.3 9.7 10.4 6.8 19.1 12.6 9.2Utilities 5.9 5.8 9.7 0.4 8.3 5.5 5.2 Utilities 7.5 7.8 8.3 3.3 14.9 5.6 6.7Market ex Financials 11.5 9.1 13.8 5.1 8.3 8.5 9.8 Market ex Financials 10.9 9.4 11.2 4.1 9.6 9.3 8.8
Enterprise Value / Capital Employed (P/BV Financials)
Current Values Post 1990 Average
US Eur ex UK UK Japan Asia ex Jp3 Emerging World US Eur ex UK UK Japan Asia ex Jp3 Emerging WorldEnergy 1.7 1.1 1.2 0.7 1.3 0.8 1.5 Energy 2.1 1.6 1.9 0.9 1.5 1.8 1.8Materials 2.1 1.5 1.3 0.9 1.6 1.0 1.4 Materials 1.7 1.3 1.5 1.2 1.7 1.2 1.4Industrials 1.9 1.7 2.5 1.0 1.1 0.9 1.5 Industrials 1.7 1.3 1.4 1.1 1.1 1.1 1.4Consumer Discretionary 2.4 1.4 2.4 1.0 2.0 1.3 1.7 Consumer Discretionary 1.8 1.2 1.9 1.1 1.7 1.3 1.4Consumer Staples 2.9 2.1 2.6 1.4 1.7 2.3 2.4 Consumer Staples 3.4 2.1 1.9 1.3 1.6 2.0 2.4Healthcare 2.6 3.0 3.7 1.5 4.3 2.2 2.7 Healthcare 3.4 2.5 5.5 1.7 2.4 2.2 3.1Financials2,5 1.4 1.0 1.2 1.0 1.5 1.4 1.3 Financials2,5 2.0 1.7 1.7 2.0 1.5 2.1 1.8Information Tech 2.9 2.3 6.2 1.2 2.8 1.5 2.2 Information Tech 3.3 2.6 4.9 1.2 2.1 2.0 2.5Telecom Services 1.9 1.2 0.7 1.3 2.4 1.8 1.4 Telecom Services 1.8 1.4 1.4 1.4 3.2 2.3 1.5Utilities 1.3 0.9 1.7 0.9 1.5 1.0 1.1 Utilities 1.2 1.2 1.1 1.2 2.1 1.2 1.2Market ex Financials 2.2 1.6 1.6 1.1 1.4 1.2 1.7 Market ex Financials 2.1 1.5 1.6 1.2 1.5 1.4 1.6
Return on Capital Employed6 (ROE6 Financials)
Any Authors named on this report are Research Analysts unless otherwise indicated Analyst Certification We, Inigo Fraser-Jenkins and Alla Harmsworth, hereby certify (1) that the views expressed in this Research report accurately reflect our personal views about any or all of the subject securities or issuers referred to in this Research report, (2) no part of our compensation was, is or will be directly or indirectly related to the specific recommendations or views expressed in this Research report and (3) no part of our compensation is tied to any specific investment banking transactions performed by Nomura Securities International, Inc., Nomura International plc or any other Nomura Group company. Important Disclosures Online availability of research and conflict-of-interest disclosures Nomura research is available on www.nomuranow.com/research, Bloomberg, Capital IQ, Factset, MarkitHub, Reuters and ThomsonOne. Important disclosures may be read at http://go.nomuranow.com/research/globalresearchportal/pages/disclosures/disclosures.aspx or requested from Nomura Securities International, Inc., on 1-877-865-5752. If you have any difficulties with the website, please email [email protected] for help. The analysts responsible for preparing this report have received compensation based upon various factors including the firm's total revenues, a portion of which is generated by Investment Banking activities. Unless otherwise noted, the non-US analysts listed at the front of this report are not registered/qualified as research analysts under FINRA/NYSE rules, may not be associated persons of NSI, and may not be subject to FINRA Rule 2711 and NYSE Rule 472 restrictions on communications with covered companies, public appearances, and trading securities held by a research analyst account. Nomura Global Financial Products Inc. (“NGFP”) Nomura Derivative Products Inc. (“NDPI”) and Nomura International plc. (“NIplc”) are registered with the Commodities Futures Trading Commission and the National Futures Association (NFA) as swap dealers. NGFP, NDPI, and NIplc are generally engaged in the trading of swaps and other derivative products, any of which may be the subject of this report. Any authors named in this report are research analysts unless otherwise indicated. Industry Specialists identified in some Nomura International plc research reports are employees within the Firm who are responsible for the sales and trading effort in the sector for which they have coverage. Industry Specialists do not contribute in any manner to the content of research reports in which their names appear. Distribution of ratings (Global) The distribution of all ratings published by Nomura Global Equity Research is as follows: 47% have been assigned a Buy rating which, for purposes of mandatory disclosures, are classified as a Buy rating; 41% of companies with this rating are investment banking clients of the Nomura Group*. 43% have been assigned a Neutral rating which, for purposes of mandatory disclosures, is classified as a Hold rating; 54% of companies with this rating are investment banking clients of the Nomura Group*. 10% have been assigned a Reduce rating which, for purposes of mandatory disclosures, are classified as a Sell rating; 24% of companies with this rating are investment banking clients of the Nomura Group*. As at 30 June 2014. *The Nomura Group as defined in the Disclaimer section at the end of this report. Explanation of Nomura's equity research rating system in Europe, Middle East and Africa, US and Latin America, and Japan and Asia ex-Japan from 21 October 2013 The rating system is a relative system, indicating expected performance against a specific benchmark identified for each individual stock, subject to limited management discretion. An analyst’s target price is an assessment of the current intrinsic fair value of the stock based on an appropriate valuation methodology determined by the analyst. Valuation methodologies include, but are not limited to, discounted cash flow analysis, expected return on equity and multiple analysis. Analysts may also indicate expected absolute upside/downside relative to the stated target price, defined as (target price - current price)/current price. STOCKS A rating of 'Buy', indicates that the analyst expects the stock to outperform the Benchmark over the next 12 months. A rating of 'Neutral', indicates that the analyst expects the stock to perform in line with the Benchmark over the next 12 months. A rating of 'Reduce', indicates that the analyst expects the stock to underperform the Benchmark over the next 12 months. A rating of 'Suspended', indicates that the rating, target price and estimates have been suspended temporarily to comply with applicable regulations and/or firm policies. Securities and/or companies that are labelled as 'Not rated' or shown as 'No rating' are not in regular research coverage. Investors should not expect continuing or additional information from Nomura relating to such securities and/or companies. Benchmarks are as follows: United States/Europe/Asia ex-Japan: please see valuation methodologies for explanations of relevant benchmarks for stocks, which can be accessed at: http://go.nomuranow.com/research/globalresearchportal/pages/disclosures/disclosures.aspx; Global Emerging Markets (ex-Asia): MSCI Emerging Markets ex-Asia, unless otherwise stated in the valuation methodology; Japan: Russell/Nomura Large Cap.
116
Appendix A-1
SECTORS A 'Bullish' stance, indicates that the analyst expects the sector to outperform the Benchmark during the next 12 months. A 'Neutral' stance, indicates that the analyst expects the sector to perform in line with the Benchmark during the next 12 months. A 'Bearish' stance, indicates that the analyst expects the sector to underperform the Benchmark during the next 12 months. Sectors that are labelled as 'Not rated' or shown as 'N/A' are not assigned ratings. Benchmarks are as follows: United States: S&P 500; Europe: Dow Jones STOXX 600; Global Emerging Markets (ex-Asia): MSCI Emerging Markets ex-Asia. Japan/Asia ex-Japan: Sector ratings are not assigned.
Explanation of Nomura's equity research rating system in Japan and Asia ex-Japan prior to 21 October 2013 STOCKS Stock recommendations are based on absolute valuation upside (downside), which is defined as (Target Price - Current Price) / Current Price, subject to limited management discretion. In most cases, the Target Price will equal the analyst's 12-month intrinsic valuation of the stock, based on an appropriate valuation methodology such as discounted cash flow, multiple analysis, etc. A 'Buy' recommendation indicates that potential upside is 15% or more. A 'Neutral' recommendation indicates that potential upside is less than 15% or downside is less than 5%. A 'Reduce' recommendation indicates that potential downside is 5% or more. A rating of 'Suspended' indicates that the rating and target price have been suspended temporarily to comply with applicable regulations and/or firm policies in certain circumstances including when Nomura is acting in an advisory capacity in a merger or strategic transaction involving the subject company. Securities and/or companies that are labelled as 'Not rated' or shown as 'No rating' are not in regular research coverage of the Nomura entity identified in the top banner. Investors should not expect continuing or additional information from Nomura relating to such securities and/or companies.
SECTORS A 'Bullish' rating means most stocks in the sector have (or the weighted average recommendation of the stocks under coverage is) a positive absolute recommendation. A 'Neutral' rating means most stocks in the sector have (or the weighted average recommendation of the stocks under coverage is) a neutral absolute recommendation. A 'Bearish' rating means most stocks in the sector have (or the weighted average recommendation of the stocks under coverage is) a negative absolute recommendation.
Target Price A Target Price, if discussed, reflects in part the analyst's estimates for the company's earnings. The achievement of any target price may be impeded by general market and macroeconomic trends, and by other risks related to the company or the market, and may not occur if the company's earnings differ from estimates.
Disclaimers This document contains material that has been prepared by the Nomura entity identified on page 1 and/or with the sole or joint contributions of one or more Nomura entities whose employees and their respective affiliations are also specified on page 1 or identified elsewhere in the document. The term "Nomura Group" used herein refers to Nomura Holdings, Inc. or any of its affiliates or subsidiaries and may refer to one or more Nomura Group companies including: Nomura Securities Co., Ltd. ('NSC') Tokyo, Japan; Nomura International plc ('NIplc'), UK; Nomura Securities International, Inc. ('NSI'), New York, US; Nomura International (Hong Kong) Ltd. (‘NIHK’), Hong Kong; Nomura Financial Investment (Korea) Co., Ltd. (‘NFIK’), Korea (Information on Nomura analysts registered with the Korea Financial Investment Association ('KOFIA') can be found on the KOFIA Intranet at http://dis.kofia.or.kr); Nomura Singapore Ltd. (‘NSL’), Singapore (Registration number 197201440E, regulated by the Monetary Authority of Singapore); Nomura Australia Ltd. (‘NAL’), Australia (ABN 48 003 032 513), regulated by the Australian Securities and Investment Commission ('ASIC') and holder of an Australian financial services licence number 246412; P.T. Nomura Indonesia (‘PTNI’), Indonesia; Nomura Securities Malaysia Sdn. Bhd. (‘NSM’), Malaysia; NIHK, Taipei Branch (‘NITB’), Taiwan; Nomura Financial Advisory and Securities (India) Private Limited (‘NFASL’), Mumbai, India (Registered Address: Ceejay House, Level 11, Plot F, Shivsagar Estate, Dr. Annie Besant Road, Worli, Mumbai- 400 018, India; Tel: +91 22 4037 4037, Fax: +91 22 4037 4111; CIN No : U74140MH2007PTC169116, SEBI Registration No: BSE INB011299030, NSE INB231299034, INF231299034, INE 231299034, MCX: INE261299034) and NIplc, Madrid Branch (‘NIplc, Madrid’). ‘CNS Thailand’ next to an analyst’s name on the front page of a research report indicates that the analyst is employed by Capital Nomura Securities Public Company Limited (‘CNS’) to provide research assistance services to NSL under a Research Assistance Agreement. THIS MATERIAL IS: (I) FOR YOUR PRIVATE INFORMATION, AND WE ARE NOT SOLICITING ANY ACTION BASED UPON IT; (II) NOT TO BE CONSTRUED AS AN OFFER TO SELL OR A SOLICITATION OF AN OFFER TO BUY ANY SECURITY IN ANY JURISDICTION WHERE SUCH OFFER OR SOLICITATION WOULD BE ILLEGAL; AND (III) BASED UPON INFORMATION FROM SOURCES THAT WE CONSIDER RELIABLE, BUT HAS NOT BEEN INDEPENDENTLY VERIFIED BY NOMURA GROUP. Nomura Group does not warrant or represent that the document is accurate, complete, reliable, fit for any particular purpose or merchantable and does not accept liability for any act (or decision not to act) resulting from use of this document and related data. To the maximum extent permissible all warranties and other assurances by Nomura group are hereby excluded and Nomura Group shall have no liability for the use, misuse, or distribution of this information. Opinions or estimates expressed are current opinions as of the original publication date appearing on this material and the information, including the opinions and estimates contained herein, are subject to change without notice. Nomura Group is under no duty to update this document. Any comments or statements made herein are those of the author(s) and may differ from views held by other parties within Nomura Group. Clients should consider whether any advice or recommendation in this report is suitable for their particular circumstances and, if appropriate, seek professional advice, including tax advice. Nomura Group does not provide tax advice.
117
Nomura Group, and/or its officers, directors and employees, may, to the extent permitted by applicable law and/or regulation, deal as principal, agent, or otherwise, or have long or short positions in, or buy or sell, the securities, commodities or instruments, or options or other derivative instruments based thereon, of issuers or securities mentioned herein. Nomura Group companies may also act as market maker or liquidity provider (within the meaning of applicable regulations in the UK) in the financial instruments of the issuer. Where the activity of market maker is carried out in accordance with the definition given to it by specific laws and regulations of the US or other jurisdictions, this will be separately disclosed within the specific issuer disclosures.
This document may contain information obtained from third parties, including ratings from credit ratings agencies such as Standard & Poor’s. Reproduction and distribution of third-party content in any form is prohibited except with the prior written permission of the related third-party. Third-party content providers do not guarantee the accuracy, completeness, timeliness or availability of any information, including ratings, and are not responsible for any errors or omissions (negligent or otherwise), regardless of the cause, or for the results obtained from the use of such content. Third-party content providers give no express or implied warranties, including, but not limited to, any warranties of merchantability or fitness for a particular purpose or use. Third-party content providers shall not be liable for any direct, indirect, incidental, exemplary, compensatory, punitive, special or consequential damages, costs, expenses, legal fees, or losses (including lost income or profits and opportunity costs) in connection with any use of their content, including ratings. Credit ratings are statements of opinions and are not statements of fact or recommendations to purchase hold or sell securities. They do not address the suitability of securities or the suitability of securities for investment purposes, and should not be relied on as investment advice.
Any MSCI sourced information in this document is the exclusive property of MSCI Inc. (‘MSCI’). Without prior written permission of MSCI, this information and any other MSCI intellectual property may not be reproduced, re-disseminated or used to create any financial products, including any indices. This information is provided on an "as is" basis. The user assumes the entire risk of any use made of this information. MSCI, its affiliates and any third party involved in, or related to, computing or compiling the information hereby expressly disclaim all warranties of originality, accuracy, completeness, merchantability or fitness for a particular purpose with respect to any of this information. Without limiting any of the foregoing, in no event shall MSCI, any of its affiliates or any third party involved in, or related to, computing or compiling the information have any liability for any damages of any kind. MSCI and the MSCI indexes are services marks of MSCI and its affiliates.
Russell/Nomura Japan Equity Indexes are protected by certain intellectual property rights of Nomura Securities Co., Ltd. and Russell Investments. Nomura Securities Co., Ltd. and Russell Investments do not guarantee the accuracy, completeness, reliability, or usefulness thereof and do not account for business activities and services that any index user and its affiliates undertake with the use of the Indexes.
Investors should consider this document as only a single factor in making their investment decision and, as such, the report should not be viewed as identifying or suggesting all risks, direct or indirect, that may be associated with any investment decision. Nomura Group produces a number of different types of research product including, among others, fundamental analysis and quantitative analysis; recommendations contained in one type of research product may differ from recommendations contained in other types of research product, whether as a result of differing time horizons, methodologies or otherwise. Nomura Group publishes research product in a number of different ways including the posting of product on Nomura Group portals and/or distribution directly to clients. Different groups of clients may receive different products and services from the research department depending on their individual requirements.
Figures presented herein may refer to past performance or simulations based on past performance which are not reliable indicators of future performance. Where the information contains an indication of future performance, such forecasts may not be a reliable indicator of future performance. Moreover, simulations are based on models and simplifying assumptions which may oversimplify and not reflect the future distribution of returns.
Certain securities are subject to fluctuations in exchange rates that could have an adverse effect on the value or price of, or income derived from, the investment.
The securities described herein may not have been registered under the US Securities Act of 1933 (the ‘1933 Act’), and, in such case, may not be offered or sold in the US or to US persons unless they have been registered under the 1933 Act, or except in compliance with an exemption from the registration requirements of the 1933 Act. Unless governing law permits otherwise, any transaction should be executed via a Nomura entity in your home jurisdiction.
118

This document has been approved for distribution in the UK and European Economic Area as investment research by NIplc. NIplc is authorised by the Prudential Regulation Authority and regulated by the Financial Conduct Authority and the Prudential Regulation Authority. NIplc is a member of the London Stock Exchange. This document does not constitute a personal recommendation within the meaning of applicable regulations in the UK, or take into account the particular investment objectives, financial situations, or needs of individual investors. This document is intended only for investors who are 'eligible counterparties' or 'professional clients' for the purposes of applicable regulations in the UK, and may not, therefore, be redistributed to persons who are 'retail clients' for such purposes. This document has been approved by NIHK, which is regulated by the Hong Kong Securities and Futures Commission, for distribution in Hong Kong by NIHK. This document has been approved for distribution in Australia by NAL, which is authorized and regulated in Australia by the ASIC. This document has also been approved for distribution in Malaysia by NSM. In Singapore, this document has been distributed by NSL. NSL accepts legal responsibility for the content of this document, where it concerns securities, futures and foreign exchange, issued by their foreign affiliates in respect of recipients who are not accredited, expert or institutional investors as defined by the Securities and Futures Act (Chapter 289). Recipients of this document in Singapore should contact NSL in respect of matters arising from, or in connection with, this document. Unless prohibited by the provisions of Regulation S of the 1933 Act, this material is distributed in the US, by NSI, a US-registered broker-dealer, which accepts responsibility for its contents in accordance with the provisions of Rule 15a-6, under the US Securities Exchange Act of 1934. The entity that prepared this document permits its separately operated affiliates within the Nomura Group to make copies of such documents available to their clients.
This document has not been approved for distribution to persons other than ‘Authorised Persons’, ‘Exempt Persons’ or ‘Institutions’ (as defined by the Capital Markets Authority) in the Kingdom of Saudi Arabia (‘Saudi Arabia’) or 'professional clients' (as defined by the Dubai Financial Services Authority) in the United Arab Emirates (‘UAE’) or a ‘Market Counterparty’ or ‘Business Customers’ (as defined by the Qatar Financial Centre Regulatory Authority) in the State of Qatar (‘Qatar’) by Nomura Saudi Arabia, NIplc or any other member of Nomura Group, as the case may be. Neither this document nor any copy thereof may be taken or transmitted or distributed, directly or indirectly, by any person other than those authorised to do so into Saudi Arabia or in the UAE or in Qatar or to any person other than ‘Authorised Persons’, ‘Exempt Persons’ or ‘Institutions’ located in Saudi Arabia or 'professional clients' in the UAE or a ‘Market Counterparty’ or ‘Business Customers’ in Qatar . By accepting to receive this document, you represent that you are not located in Saudi Arabia or that you are an ‘Authorised Person’, an ‘Exempt Person’ or an ‘Institution’ in Saudi Arabia or that you are a 'professional client' in the UAE or a ‘Market Counterparty’ or ‘Business Customers’ in Qatar and agree to comply with these restrictions. Any failure to comply with these restrictions may constitute a violation of the laws of the UAE or Saudi Arabia or Qatar.
NO PART OF THIS MATERIAL MAY BE (I) COPIED, PHOTOCOPIED, OR DUPLICATED IN ANY FORM, BY ANY MEANS; OR (II) REDISTRIBUTED WITHOUT THE PRIOR WRITTEN CONSENT OF A MEMBER OF NOMURA GROUP. If this document has been distributed by electronic transmission, such as e-mail, then such transmission cannot be guaranteed to be secure or error-free as information could be intercepted, corrupted, lost, destroyed, arrive late or incomplete, or contain viruses. The sender therefore does not accept liability for any errors or omissions in the contents of this document, which may arise as a result of electronic transmission. If verification is required, please request a hard-copy version.
Nomura Group manages conflicts with respect to the production of research through its compliance policies and procedures (including, but not limited to, Conflicts of Interest, Chinese Wall and Confidentiality policies) as well as through the maintenance of Chinese walls and employee training.
Additional information is available upon request and disclosure information is available at the Nomura Disclosure web page: http://go.nomuranow.com/research/globalresearchportal/pages/disclosures/disclosures.aspx
Copyright © 2014 Nomura International plc. All rights reserved.
119