Embed Size (px)
Citation preview

RESEARCH Open Access
Non-cancer-related pathogenic germlinevariants and expression consequences inten-thousand cancer genomesZishan Wang1, Xiao Fan2, Yufeng Shen3, Meghana S Pagadala4, Rebecca Signer1, Kamil J. Cygan5,William G. Fairbrother5, Hannah Carter4, Wendy K. Chung2* and Kuan-lin Huang1*
Abstract
Background: DNA sequencing is increasingly incorporated into the routine care of cancer patients, many of whomalso carry inherited, moderate/high-penetrance variants associated with other diseases. Yet, the prevalence andconsequence of such variants remain unclear.
Methods: We analyzed the germline genomes of 10,389 adult cancer cases in the TCGA cohort, identifyingpathogenic/likely pathogenic variants in autosomal-dominant genes, autosomal-recessive genes, and 59 medicallyactionable genes curated by the American College of Molecular Genetics (i.e., the ACMG 59 genes). We alsoanalyzed variant- and gene-level expression consequences in carriers.
Results: The affected genes exhibited varying pan-ancestry and population-specific patterns, and overall, theEuropean population showed the highest frequency of pathogenic/likely pathogenic variants. We further identifiedgenes showing expression consequence supporting variant functionality, including altered gene expression, allelicspecific expression, and mis-splicing determined by a massively parallel splicing assay.
Conclusions: Our results demonstrate that expression-altering variants are found in a substantial fraction of casesand illustrate the yield of genomic risk assessments for a wide range of diseases across diverse populations.
BackgroundRecent advances in sequencing technology and targetedtherapeutic development have led to increased clinicalgenomic sequencing for patients. In 2015, the AmericanCollege of Molecular Genetics and Association for Mo-lecular Pathology (ACMG/AMP) established criteria forgenetic variant classification on a spectrum from patho-genic to benign as a guide for consistent clinical inter-pretation [1]. The ACMG also curated a list of 59
medically actionable, highly penetrant genes (abbreviatedACMG 59 genes) [2], for which reporting of secondaryfindings is recommended. However, pathogenic variantsin non-cancer or cancer-syndrome-related genes haverarely been systematically evaluated in a large cohort ofcancer patients across diverse ancestries. Furthermore,many variants are extremely rare, and might be foundervariants exclusive to a specific ancestral population [3].Extensive genetic analyses across diverse populations willhelp to inform future population-based genomic screen-ing strategies.Beyond identifying DNA sequence variant, variant in-
terpretation often requires assumptions about the ex-pression consequences of the variants. For example,many pathogenic variants are premature stop-codonspresumed to cause mRNA transcript degradation
© The Author(s). 2021 Open Access This article is licensed under a Creative Commons Attribution 4.0 International License,which permits use, sharing, adaptation, distribution and reproduction in any medium or format, as long as you giveappropriate credit to the original author(s) and the source, provide a link to the Creative Commons licence, and indicate ifchanges were made. The images or other third party material in this article are included in the article's Creative Commonslicence, unless indicated otherwise in a credit line to the material. If material is not included in the article's Creative Commonslicence and your intended use is not permitted by statutory regulation or exceeds the permitted use, you will need to obtainpermission directly from the copyright holder. To view a copy of this licence, visit http://creativecommons.org/licenses/by/4.0/.The Creative Commons Public Domain Dedication waiver (http://creativecommons.org/publicdomain/zero/1.0/) applies to thedata made available in this article, unless otherwise stated in a credit line to the data.
* Correspondence: [email protected]; [email protected] of Pediatrics and Medicine, Columbia University Irving MedicalCenter, New York, NY 10032, USA1Department of Genetics and Genomic Sciences, Center for TransformativeDisease Modeling, Tisch Cancer Institute, Icahn Institute for Data Science andGenomic Technology, Icahn School of Medicine at Mount Sinai, New York,NY 10029, USAFull list of author information is available at the end of the article
Wang et al. Genome Medicine (2021) 13:147 https://doi.org/10.1186/s13073-021-00964-1
through nonsense-mediated decay (NMD) [4]. The di-minished gene expression impairs cellular function, lead-ing to disease phenotype. Concurrent observation ofexpression aberrations in tissue samples—at both the al-lelic specific expression (ASE) [5, 6] and gene expressionlevel—can validate variant functionality. Yet, publishedlarge-scale studies that evaluate expression consequencesof genomic variants mostly represent European popula-tions with available multi-omics data like Genotype-Tissue Expression (GTEx) project [7–10]. The CancerGenome Atlas (TCGA) project includes DNA/RNA-Seqdata for over 10 K cancer cases of multiple ancestries[11], providing an opportunity to dissect the expressionconsequences of variants.In this study, we systematically investigated pathogenic
or likely pathogenic genetic variants in human diseasegenes not related to cancer or cancer-related syndromes,herein abbreviated as NC P/LPs (non-cancer-relatedpathogenic/likely pathogenic variants), in 10,389 cancercases across multiple ancestries. We identified overtwent-nine-hundred NC P/LPs and described the af-fected genes and population frequencies. Gene-level ex-pression analyses revealed reduced gene expressionassociated with NC P/LPs. Furthermore, NC P/LPsshowing reduced ASE were identified using RNA-Seqanalyses and found to be enriched for nonsense variants.Splicing-assay data identified several previously classifiedmissense variants associated with mis-splicing effects. Insummary, our analysis revealed NC P/LPs in ten-thousand cancer cases and their varied expressionconsequences.
MethodsCohort description and genetic ancestry assignmentWe used the clinical data provided by TCGA PanCanA-tlas and restricted analyses to those with pass-QC blood/normal sequencing data. The inclusion criteria were de-scribed by the PanCanAtlas germline working group[12], where in addition to excluding cases with PanCa-nAtlas blacklisted germline BAM-files, cases with lessthan 60% genotype concordance between sequencingvariant calls and SNP-genotype data were eliminated.The final cohort consists of 10,389 cases across 33 can-cer types. Then, genetic ancestry assignments for 10,353cases were obtained from the PanCanAtlas Ancestry In-formative Markers (AIM) working group [13]. Of theremaining 36 cases, 10 cases were further classifiedbased on the principal component analysis (PCA) in theTCGA PanCanAtlas Germline project [12], and theother 26 cases without genetic ancestry assignments inboth projects were considered as the “other” group.Principal component (PC) values for each case were
obtained from the TCGA PanCanAtlas Germline project[12]. Briefly, the downloaded PC data were calculated
based on 298,004 variants with MAF > 0.15 and lowmissingness. The PC1 and PC2 accounted for 51.6% and29.2% of the variations across the first 20 PCs, and noneof the trailing PCs accounted for more than 3.2%. Thus,we subsequently controlled for PC1 and PC2 in gene ex-pression analysis.
Variant identification and classificationWe downloaded CharGer-prioritized variants among the~ 1.46 billion germline variant calls conducted by TCGAPanCanAtlas Germline working group [12] and furtherrequired the variants to have sufficient DNA variant readcounts (≥ 5 alternative allele read counts and ≥ 0.2 alter-native allele read frequency in both the normal andtumor bam file) retaining 35,911 prioritized germlinevariants (sample-variant). We then filtered out variantsassociated with cancer or cancer syndromes, retaining23,928 sample-variants. Non-cancer-related variantswere considered as those not in the curated 152 cancerpredisposition genes by the PanCanAtlas germline group(Additional file 1: Table S1) nor have “tumor,” “cancer,”“neoplasia,” or cancer-related “-oma” terms in their cor-responding ClinVar trait. We noted that the systematicassessment of the 23,928 variants may miss those show-ing “Conflicting interpretations of pathogenicity” or withupdated classification on ClinVar [14] since the PanCa-nAtlas study [12] and/or those showing little other sup-porting evidence in the ACMG guideline [1]. Some ofthese variants could be P/LPs upon close examinationand, particularly, the variants in the ACMG 59 genescould have critical clinical implication. Thus, we furtherextracted all variants in the 34 non-cancer ACMG 59genes from the original variant call data, filtered with ≥5 alternative allele read counts, and conducted variantinterpretation.Variant interpretation of all the unique non-cancer
variants was assigned using the standard ACMG classifi-cation criteria [1] and variant reviews. Variant interpret-ation was first screened using our in-housebioinformatics pipeline based on InterVar [15]. Thepipeline automatically collected 18 out of 28 lines of evi-dence used in the ACMG guidelines [1]. Potential P/LPvariants identified by the pipeline were then manuallyreviewed by a board-certified molecular geneticist usingthe ACMG classification criteria. A total of 2920 countswere identified in 757 unique P/LP variants in 363 NCgenes. The majority (96.0%) of these variants were re-ported in ClinVar [14] as P/LP. For the remaining newlyidentified P/LP variants, 19 (63.3%) of them are rare pre-dicted loss-of-function variants. Eleven newly identifiedmissense P/LP variants were classified based upon func-tional studies provided in the literature, protein domain,rareness in general populations, P/LP variants at thesame residue, and computational predictions.
Wang et al. Genome Medicine (2021) 13:147 Page 2 of 13

Altogether, the procedure resulted in 2271 unique(2920 sample-variants) NC P/LPs (Additional file 2:Table S2). Using Online Mendelian Inheritance in Man(OMIM), we annotated associated disease and mode ofinheritance to genes with ACMG-classified NC P/LPs.
gnomAD analysisWe analyzed the variant-level frequency of our identifiedNC P/LPs using variants of 118,479 non-cancer exomessample that pass all filters in the genome aggregationdatabase (gnomAD-non-cancer) v.2.1 [16].
Gene expression impact analysisWe downloaded a batch-corrected and normalizedTCGA expression data processed by TCGA PanCanA-tlas from Genome Data Commons (GDC). We calcu-lated tumor expression percentile of individual genes ineach cancer cohort by using the empirical cumulativedistribution function (ecdf), as implemented in R, anddownloaded consensus measurement of tumor purity in-formation by using TCGAbiolinks R package. Next, weused a multivariate linear regression model to assess theimpact of NC P/LPs on expression of affected genes withat least three carriers in the pan-cancer cohort, wherethe changes in gene i mRNA expression, yi, were a linearfunction of variant status and covariates (including age,gender, tumor purity, PC1, PC2, and cancer type) xi:
yi ¼ β0 þ βixi þ εi; i ¼ 1;…; n:
where β0 was the intercept, and βi was the coefficientfor variant status and covariates. Samples lacking the re-quired covariates or gene expression for the multivariatelinear model are not considered. A total of 7734 casesand 2005 NC P/LPs had complete data for the model.Benjamini-Hochberg (BH) procedure was performed toadjust P-value into FDR (false discovery rate). We se-lected 0.05 and 0.15 as the FDR cutoff for significant orsuggestive associations affected by NC P/LP,respectively.
Allelic specific expression (ASE) analysisBarcodes of TCGA patients were mapped to file ids forRNA-seq BAM files. To circumvent a potentially largemultiple-testing correction penalities, we constrained theanalyses to rare (MAF ≤ 0.05%) NC P/LPs. For 2640 pa-tients with cancer variants or NC P/LPs, 3625 file ids forRNA-seq BAMs were mapped. For 118 TCGA patients,RNA-seq BAM files were not found. GRCh37 alignedBAM files were downloaded from TCGA Legacy Archiveusing the gdc client and bam-readcount v0.8.0 was usedto extract read counts for GRCh37 variants ids for eachspecified patient by providing variant id location andBAM file. Read counts for each base (A,G,C,T) were
compiled across all BAM files. When multiple RNA-SeqBam-files are available for one case, we selected theBam-file with the deepest sequencing depth at that allelefor further analysis. We retained variants with at leastsix read counts (reference allele + alternate allele ≥ 6)for ASE analysis. Next, we conducted a one-sided bino-mial test with a null probability of success 0.5 in a Ber-noulli experiment to identify ASE, where the alternativeallele shows significantly less expression. Subsequently,we used BH to adjust p-value into FDR and defined FDRless than 0.05 and 0.15 as significant and suggestive,respectively.Furthermore, the gene-level enrichment of variants
with significant ASE is assessed by constructing a two-by-two table of variants located in a gene region versusASE status and conducting a two-sided Fisher exact test.We limited the analysis to genes with at least 3 signifi-cant ASE NC P/LPs and more than 70% of carriersshowing significant ASE. P value is adjusted by BH intoFDR and two FDR cutoffs, 0.05 and 0.15, are selected todefine significant and suggestive enrichment,respectively.We used an empirical permutation-based method to
evaluate the enrichment of NC P/LPs for each predictedvariant function class, where the test statistics is the per-centage of significant ASE NC P/LPs. The ASE statuseswere randomly shuffled for 10,000 times, and each time,the percentage of significant ASE NC P/LPs was calcu-lated. We defined P value for each predicted variantfunction class as the fraction of significant ASE NC P/LPproportions under random conditions that were greaterthan the observed one.
Variants showing mis-splicing effectsWe utilized the data from our recently published Mas-sively Parallel Splicing Assay (MaPSy) experiment [17].Based on the raw allelic counts of the reference and in-duced alternate allele, we calculated the allelic ratio andsignificance for each candidate splicing variant. Variantswith BH-adjusted FDR less than 0.05 and allelic ratioless than -log2(1.5) in both the in vitro and in vivo as-says were regarded as variants showing mis-splicing ef-fects. We then match these variants based on theirgenomic coordinate, reference, and alternative alleles tovariants we identified in TCGA patients.
ResultsNC P/LPs in 10,389 cancer casesWe identified NC P/LPs in the TCGA cohort of 10,389adult cancer cases across different ancestral populations.The cohort contained germline genome data that passedquality control procedures as described by TCGA Pan-CanAtlas Germline working group [12]. Genetic ancestryanalyses of PanCanAltas AIM and Germline working
Wang et al. Genome Medicine (2021) 13:147 Page 3 of 13

groups [12, 13, 18] stratified the cohort into 305 individualsof the Latinx/Native American, 971 of the African American,8279 of the European, 652 of the East Asian, 50 of the SouthAsian, 106 of mixed (> 20% genetic admixture) ancestries,and 26 of other ancestry (Methods, Fig. 1).In the 10,389 cases, TCGA PanCanAtlas Germline
working group previously conducted variant calling thatresulted in ~ 1.46 billion variants and utilized CharGer[19] to prioritize variants [12]. Among the CharGer-prioritized variants as well as all the variants in theACMG 59 genes that are not directly associated withcancer, we systematically filtered them based on alleleread count thresholds and association with cancer orcancer syndromes, followed by ACMG classificationalong with variant reviews by a board-certified moleculargeneticist (Methods). Based on this procedure, we identi-fied 2916 heterozygous and 4 homozygous NC P/LPsthat were pathogenic or likely pathogenic (Fig. 1A).These NC P/LPs included 753 unique variants distrib-uted across 363 non-cancer genes, harbored in 24.1%(2505/10,389) of the cancer cases (Additional file 3:Table S3). We further examined the frequencies acrossancestries: 26.75% of European ancestry were found toharbor NC P/LPs, a higher frequency compared to otherancestries with more than 100 patients, including15.08% of the Latinx/Native American, 12.98% of the Af-rican American, and 11.66% of the East Asian (Fig. 1B).Overall, putative autosomal dominant (AD) variants af-fected 2.07% (215/10,389) and autosomal recessive (AR)variants affected 22.02% (2288/10,389) of the cohort
while showing different frequencies across ancestries(Additional file 4: Figure S1).Among the ACMG 59 genes [2], for which reporting
of secondary findings is recommended, 34 were not dir-ectly cancer-related. These 34 ACMG non-cancer genesaffected 1.48% of the TCGA cancer cases across all an-cestral groups. Restricting to the P/LPs in genes that arenot directly cancer-related, previous studies have re-ported 1.0% (95 % confidence interval (CI) 0.4–1.6%)carriers in 1000 Genome project [20], 1.2% (1.0–1.3%) ineMERGE [21], 1.1% (0.1–2.0%) in European AmericanFramingham Heart Study, and 0.5% (0.2–0.7%) inAfrican-American Jackson Heart Study [22]. The carrierfrequencies may vary depending on genes assessed, evi-dence available at the time of pathogenicity assignment,ancestry of participants, and participant ascertainmentmethod.Using 94 AR disorders assessed by Haque et al. [23],
we found TCGA carrier frequencies of 10.1% (95 % con-fidence interval (CI) 9.5–10.8%), 6.2% (CI 4.7–7.7%),1.7% (0.7–2.7%), and 2.6% (0.8–4.4%) in individuals ofEuropean, African American, East Asian, and Latinx an-cestry for at least one P/LP variant in the 94 disorders.Our estimates are slightly higher in European-ancestryindividuals and lower in African American, East Asian,and Latinx compared with Haque et al. [23] reportedcarrier frequencies of 7.7% (7.5–7.9%), 11.3% (10.9–11.7%), 6.9% (6.3–7.6%), and 6.0% (5.6–6.4%), in thesame ancestral groups. The differences between the twostudies in part reflect differences in knowledge and stan-dards for classification of variants over time.
Fig. 1. Non-cancer-related pathogenic/likely pathogenic variants (NC P/LPs) in over ten thousand cancer cases. A Schematic overview foridentification of NC P/LPs in 10,389 cancer cases. B Frequency of NC P/LP carriers (left panel) and count of NC P/LPs (right panel) across differentancestries. The total case number of each ancestry is labeled
Wang et al. Genome Medicine (2021) 13:147 Page 4 of 13

Prevalence of NC P/LPs across ancestral populationsWe investigated the genes with the highest prevalence ofNC P/LPs across ancestries. Fourteen of the ACMG 59genes were affected by NC P/LPs in TCGA (Fig. 2A).
For example, NC P/LPs in KCNQ1, associated with type1 long QT syndrome, affected 6 European individualsand 1 individual in East Asian or South Asian in theTCGA cohort. Many ACMG 59 genes were restricted to
Fig. 2 Prevalence of affected genes across ancestries. A Frequency/count of NC P/LP carriers in each ancestry among the ACMG 59 genes andthe top 10% genes (ranked by sums of all defined ancestry frequencies, excluding Mix and Other). The ACMG genes affected were shown at theupper panel while the top 10% genes at the lower panel. The genes associated with autosomal-dominantly inherited diseases were labeled red.B Variant count of predisposing variants in the matched gnomAD ancestry (European of gnomAD is the union of FIN and NFE populations).TCGA population-specific NC P/LPs, exclusively found in a specific TCGA ancestry, are shown as a triangle. Top NC P/LP or top TCGA ancestry-specific NC P/LP, ranked by allele counts in TCGA or gnomAD, was labeled
Wang et al. Genome Medicine (2021) 13:147 Page 5 of 13
individuals of European population in this cohort, suchas LDLR, DSG2, APOB, ATP7B, CACNA1S, FBN1, andTNNI3 (Fig. 2A and Additional file 5: Table S4).Across populations, the most commonly identified
predisposing genes—each with at least 100 carriers—in-cluded SPG7, MPO, and ACADM; all three genes are as-sociated with autosomal recessively inherited diseases(Fig. 2A and Additional file 5: Table S4). SPG7 variantswere observed in 100 European carriers (1.21%) and onecarrier each of Latinx/Native American, African Ameri-can, and South Asian ancestry. Similar to SPG7, MPOvariants were found in 117 European carriers (1.41%),one carrier of Latinx/Native American and AfricanAmerican ancestry. ACADM variants were identified in115 European carriers (1.39%), 2 carriers of AfricanAmerican and one carrier of mixed ancestry. We alsoobserved several commonly ancestry-specific genes car-rying variants that showed occurrences exclusively inone ancestral population. In addition to those exclusivelyidentified in the Europeans, we found two ACMG 59genes whose NC P/LPs only affected East Asians inTCGA, including SERPINB7 in 8 carriers (1.23%) andSLC22A12 in 6 carriers (0.92%) (Fig. 2A and Additionalfile 5: Table S4). These results highlight the genetic vari-ants that may disproportionally affect diversepopulations.We sought validation of NC P/LPs in the gnomAD
non-cancer cohort (abbreviated as gnomAD below),which had no samples overlapping with the TCGA co-hort. The carrier frequencies of the TCGA-identified NCP/LPs were the highest among the gnomAD AshkenaziJewish (ASJ), Non-Finnish European (NFE), and Finnish(FIN) compared to other ancestral populations (Add-itional file 4: Figure S2), consistent with ClinGen’s recentreport finding Europeans in gnomAD contained overhalf of the information on the clinically relevant variantson ClinVar [24]. We also examined the gene-level carrierfrequencies of the same variants across different gno-mAD ancestral populations. Multiple genes, includingSPG7, MPO, and ACADM, showed higher carrier fre-quencies of this set of NC P/LPs in European individualsfrom both the TCGA and gnomAD cohorts (Fig. 2A andAdditional file 4: Figure S3A). ACADS and GALT vari-ants were present at highest frequency in African Ameri-cans in both TCGA and gnomAD; similarly SERPINB7and SLC22A12 variants appeared predominantly in theEast Asian population of both cohorts.We further investigated the concordance of variant-
level frequencies in the matched ancestries betweenTCGA and gnomAD. We found significant correlationsof variant frequencies in East Asian (Pearson R = 0.8, pvalue = 2.53e−07), European (Pearson R = 0.83, p value= 4.13e−143), and African American (Pearson R = 0.82,p value = 1.35e−12) population, whereas the variant
frequencies in Latinx/Native American ancestry did notshow significant correlations (Pearson R = 0.09, p value= 0.58, Additional file 5: Table S4), likely due to thesmaller sample size or admixtures in the populations.Multiple variants found exclusively in one TCGA ances-try were rediscovered in their respective ancestry cohortof gnomAD, such as ACADS p.W177R in AfricanAmerican, MCCC2 p.L355F in Latinx/Native American,ALPL p.E191K in European, SERPINB7 p.R266* in EastAsian, and ACADSB p.Q99* in South Asian (Fig. 2B andAdditional file 5: Table S4). Replicated across cohorts,the markedly higher frequencies of these variants in onepopulation compared to the others support their popula-tion specificity and potential founder effects.We further compared the frequency of each NC P/LP
in TCGA vs. gnomAD stratified by population using atwo-tailed Fisher’s exact text. The analyses identified 57variants (FDR < 0.05) (Additional file 6: Table S5), themajority of which were TCGA-enriched variants foundin the European ancestry and the most significant onesincluded MPO c.2031-2A>C (splice site variant, myelo-peroxidase deficiency), F11 p.E135* and p.F301L (heredi-tary factor XI deficiency disease), and ACADM p.K333Eand p.G271R (medium-chain acyl-coenzyme A dehydro-genase deficiency). In contrast, CYP21A2 p.P454S, TSFMp.Q307* and ALPL p.E191K showed higher frequenciesin gnomAD compared to TCGA Europeans (Additionalfile 4: Figure S3B). Acknowledging the caveat of compar-ing TCGA vs. gnomAD data from different sequencingplatforms, variant calling pipelines, and sampled sourcesand populations, these results suggest a potential differ-ent distribution of NC P/LPs that may be indirectly asso-ciated with the cancer phenotype that needs to befurther tested.
Gene expression impacted by NC P/LPsMany of the identified NC P/LPs are truncating variantsthat are presumed to alter expression of the gene prod-ucts through mechanisms such as NMD. To interrogatethe variant consequences at the gene expression level,we applied a multivariate linear regression model usingthe expression quantile of the affected gene within eachcancer cohort as a dependent variable and variant statusas the independent variable, adjusting for age, gender,PC1, PC2, cancer type, and tumor purity (Methods). Wefound 5 significant and 16 suggestive genes to be differ-entially expressed, 17 of which showed reduced expres-sion in variant carriers (Fig. 3A).We further examined the specific variants that co-
occurred with low gene expression in the bottom quar-tile of their respective cancer cohorts (Fig. 3B and Add-itional file 4: Figure S4). The majority or all nonsensevariants carriers of multiple genes showed bottom-quartile expression of the affected genes, such as IRAK4,
Wang et al. Genome Medicine (2021) 13:147 Page 6 of 13

PHKB, MMACHC, and GFER. Meanwhile, bottom-quartile HEXB gene expression was observed in 13 car-riers of the missense variant HEXB p.P417L. Overall, weobserved distinct expression effects of different varianttypes. Among 376 nonsense variants, 137 (36.4%)showed bottom-quartile expression of the respectivegenes, confirming the potential effects from NMD. Incomparison, 271 of 1169 (23.2%) missense variants alsoshowed bottom quartile expression (approximating the25% in a null scenario, Additional file 7: Table S6), sug-gesting that many of these missense variants, along witha fraction of truncating variants, may exert their effectsthrough mechanisms independent of altering geneexpression.
Allele-specific expression of NC P/LPsThe majority of differentially expressed genes associatedwith NC P/LPs showed reduced expression (Fig. 3A).Further, many pathogenic variants are assumed to altergene expression through mechanisms such as NMD,leading that ASE at the RNA-level would be observedfor a heterozygous individual. To further assess themechanism at a variant level, we further identified ASEshowing reduced expression of the alternate allele forthe rare NC P/LPs (MAF ≤ 0.05%) by performing a one-sided binomial test (Methods). Among the 657 rare NCP/LPs with sufficient read counts in tumor RNA-Seqdata for analyses, ~ 26.3% (173/657) showed significantASE (FDR < 0.05), and another 4.26% (28/657) showedsuggestive ASE (0.05 ≤ FDR < 0.15) (Fig. 4A).We investigated whether the ASE status of variants
were disproportionally present in a predicted variant
function class by conducting a permutation test(Methods). Among the predicted variant function class,nonsense variants were significantly enriched for thoseshowing ASE (48 %, P < 1E−4), confirming their tran-scriptional impact that is likely mediated through NMD.In addition, synonymous variants are also enriched forthose showing significant ASE (7 out of 7, P < 1E−4), al-though there were only 7 synonymous variants in ouranalysis (Fig. 4B and Additional file 8: Table S7), includ-ing four East Asian carriers of CYP27A1 c.862G>T, oneEast Asian carrier of G6PC c.727G>T and two Europeancarriers of DGUOK c.676G>A.Next, we identified genes enriched for significant ASE
NC P/LPs using Fisher’s exact test (Methods). We ob-served that ASE variants were significantly enriched in 6genes, including ASS1 (FDR = 0.001), SMARCAL1 (FDR= 0.022), AGXT (FDR = 0.023), KIAA1279 (FDR =0.023), TMEM216 (FDR = 0.023), and NEK8 (FDR =0.023) (Fig. 4C). At the variant level, 12 of the 17 ASS1carriers showed significant ASE, including two carriers ofmissense variant p.G324S, nonsense variant p.R344*, allthree carriers of the nonsense variant p.R279* and five car-riers of missense variant p.G390R (Figs. 4D and 5). Fiveout of the six SMARCAL1 p.E848* carriers also showedsignificant ASE. All carriers with enough read counts dataof the remaining four genes (AGXT, KIAA1279,TMEM216, and NEK8) showed significant ASE (Figs. 4Dand 5). Additionally, we identified two genes showing sug-gestive enrichment of significant ASE NC P/LPs, includingG6PC and LAMA2 (FDR = 0.057) (Fig. 4C). For G6PC,significant ASE was found in one each carrier of p.R83C,p.L216, and p.Q347* (Fig. 4D and Additional file 4: Figure
Fig. 3 Impact of NC P/LPs on gene expression. A A volcano plot showing genes whose expression is affected by related NC P/LPs. Colorrepresents the significance level, and the size represents the gene’s NC P/LP carrier frequency. B Distribution of percentile expression in a specificcancer at NC P/LP carriers of genes whose expression is significantly/suggestively impacted by NC P/LPs. Color represents variant type. Significantgenes is highlighted in bold
Wang et al. Genome Medicine (2021) 13:147 Page 7 of 13

Fig. 4 Rare variants showing allele-specific expression (ASE) and enriched genes. A Identification of rare NC P/LPs associated with ASE. Colorrepresents ASE status. B Distribution of NC P/LPs with distinct ASE enrichment status across predicted variant function classes. C Geneenrichment analysis for NC P/LPs showing significant ASE. Each dot is a gene affected by NC P/LPs. The X-axis represents the number of NC P/LPswith sufficient read counts located at a specific gene region, of which significant ASE NC P/LP proportion is Y-axis. D Count of NC P/LPs withdistinct ASE enrichment status for ASE NC P/LP enriched genes. Significant genes is labeled bold. Color of B and D were the same as A
Wang et al. Genome Medicine (2021) 13:147 Page 8 of 13
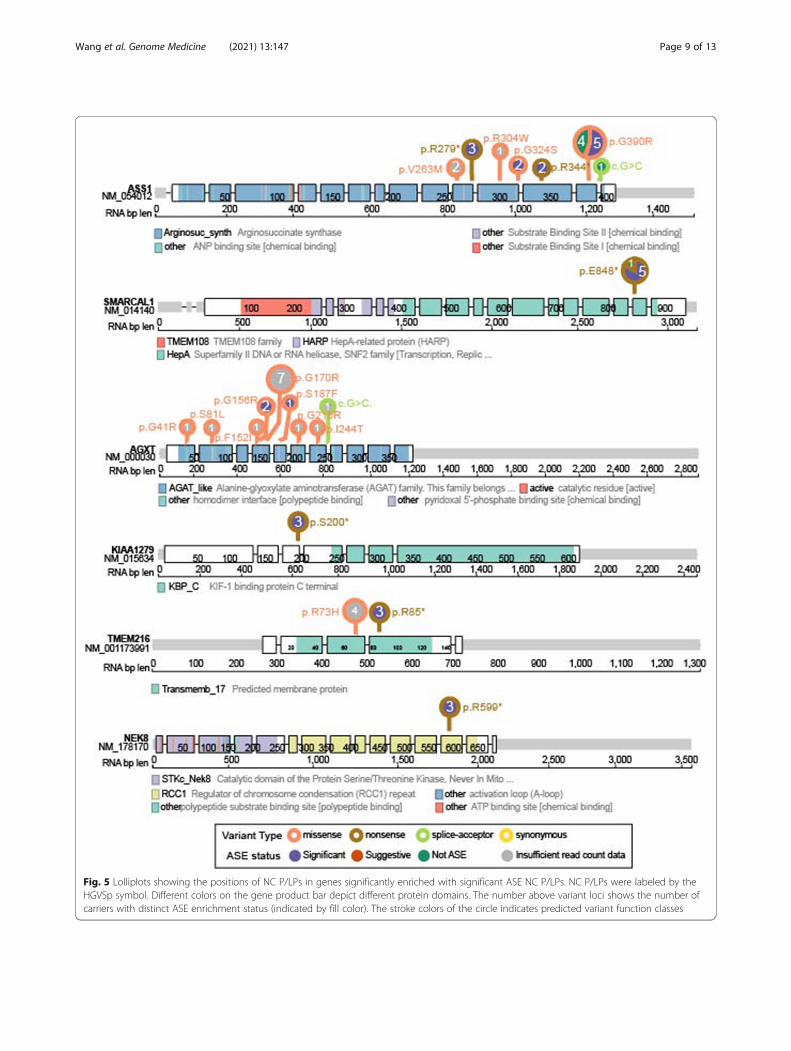
Fig. 5 Lolliplots showing the positions of NC P/LPs in genes significantly enriched with significant ASE NC P/LPs. NC P/LPs were labeled by theHGVSp symbol. Different colors on the gene product bar depict different protein domains. The number above variant loci shows the number ofcarriers with distinct ASE enrichment status (indicated by fill color). The stroke colors of the circle indicates predicted variant function classes
Wang et al. Genome Medicine (2021) 13:147 Page 9 of 13

S5). For LAMA2, all 3 carriers of p.R1326* showed signifi-cant ASE, while the only carrier of p.R1826* showed sug-gestive ASE (Fig. 4D and Additional file 4: Figure S5).There is no overlap between genes enriched with ASE var-iants and genes whose expression is associated with vari-ants. The non-concordance between ASE analysis andgene expression impact suggested a possible expressioncompensation from the reference allele or a lack of powerin the gene expression analysis. Altogether, the observedASE validated the expression consequences of many NCP/LPs.
Mis-splicing effects induced by NC P/LPsAside from nonsense variants assumed to undergoNMD, we also observed significant numbers of variantsshowing ASE and gene expression effects (Figs. 3 and 4).Recent studies have shown that, in addition to canonicalsplice sites, many missense variants can also affect spli-cing [17, 25]. Utilizing data from our recently publishedMassively Parallel Splicing Assay (MaPSy) experimentsurveying nearly five thousand variants [17], we system-atically identified variants showing mis-splicing effectsboth in vitro and in vivo matched to the NC P/LPs iden-tified in TCGA patients. Among 226 NC P/LPs thatoverlapped with MaPSy variants, 36 NC P/LPs showedsignificant mis-splicing effects, including 30 Europeancarriers of missense GALT p.Q103R, one European car-rier of missense SMPD1 p.H423Y, one American carrierof missense RYR1, two European carriers of nonsenseNDUFAF2 p.R47*, one European carrier of nonsenseHADH p.R236*, and one East Asian carrier of nonsenseBBS1 p.E586*. The carrier of nonsense HADH p.R236*showing mis-splicing in MaPSy also showed significantASE.To discover additional variants with expression and
possibly functional consequences, we assessed the mis-splicing effects that may be exerted by all prioritized var-iants (i.e., the 35,911 variants in Fig. 1A). Among these,21,008 were non-cancer related NC P/LPs that yieldedinsufficient evidence to satisfy a likely pathogenic classi-fication, and 266 were characterized by MaPSy. Fifteenof these prioritized missense variants showed mis-splicing effects, including three European carriers ofDARS2 p.R263Q, one European carrier of CD36 p.I413L,one European carrier/one African carrier of SLC29A3p.M116R, and eight East Asian carriers/one Mixed an-cestry carrier of PLG p.A620T. On ClinVar, DARS2p.R263Q is classified as pathogenic by a single submitterassociated with the condition of leukoencephalopathywith brain stem and spinal cord involvement and lactateelevation, whereas SLC29A3 p.M116R is pathogenicwithout assertion criteria and linked to histiocytosis-lymphadenopathy plus syndrome. The European carrierof CD36 p.I413L, another MaPSy-identified variant
associated with platelet glycoprotein IV deficiency, alsoshowed significant ASE along with the suggestive ASEfound in the European carrier of the MaPSy-identifiedSLC29A3 p.M116R. These variants have additional func-tional evidence of mRNA effects in patient samples and/or functional assays, which strengthen variant interpret-ation assertions.
DiscussionAssessment of hereditary cancer and tumor sequencingare the most common use cases for genomic medicinein adults. As genome sequencing is considered as theplatform for genomic assessment, we sought to under-stand the expected yield of NC P/LPs variants. Wepresent one of the largest studies to date on NC P/LPsin a cancer sequencing cohort. In the TCGA cohort ofover ten thousand adult cancer cases, NC P/LPs in dis-ease associated genes were found to be about 25% of in-dividuals. The NC P/LPs corresponded to multiplediseases, and many genes and variants showed ancestry-specific patterns validated across the TCGA and gno-mAD non-cancer cohorts. As expected, a higher fractionof nonsense variants showed ASEs, although variant-level ASE did not guarantee the reduced expression ofthe affected gene. Some missense variants were also as-sociated with ASE or low gene expression, and a fewwere found to be associated with mis-splicing effects.The frequency of variants we identified in 34 ACMG
non-cancer or cancer-syndrome-related genes wereslightly higher than those found in previous studies [20–23]. In addition to the intrinsic cohort difference, thedifferences in frequency may reflect the difference in se-quencing platforms, the advances in variant interpret-ation over time [14, 26], and the difference in variantinterpretation guidelines [27]. In particular, the TCGAdataset used herein include samples collected and se-quenced over a decade ago, and the biased inclusion oflarger tumors and individuals with severe cancer maynot yield generalizable results for current cancer patientsor the overall population.The higher rate of NC P/LPs found in the European
ancestry is consistent with previous studies and may re-flect the bias of characterized and reported variants inthose of European ancestry [24]. Much of the non-European populations are under-represented in existingsequencing cohorts [28–30]. Fewer counts of pathogenicor likely pathogenic variants identified in non-Europeansherein also highlight the limitation of current cohorts inidentifying non-European pathogenic alleles. Currentgermline sequencing in non-European patients produceshigher rates of variants of unknown significance (VUSs)[31, 32] and false-positives [33], limiting the clinical util-ity of genetic testing for those groups. Ongoing projects,including CSER [34], eMERGE III [35], UKBioBank [36,
Wang et al. Genome Medicine (2021) 13:147 Page 10 of 13

37], TopMed [38], Million Veterans Program [39], andAll of Us Research Program, are beginning to addressthe challenge for diverse populations. Ancestral popula-tions in TCGA and gnomAD showed correlations intheir carrier frequencies, suggesting combining evidencefrom these ongoing efforts can likely increase confidencein identifying critical variants within populations.Many predisposing variants lead to aberrations of gene
expression. Such expression consequences can help as-sess pathogenicity among VUSs, yet this evidence isunder-utilized. Growing evidence suggests the genomiccontext, even in a local genomic region, affects eQTL as-sociations [40–42]. Thus, as multi-omics cohorts expandto cover substantial fractions of diverse populations,evaluating expression consequences of alleles found indifferent ancestral groups can help facilitate the inter-pretation of rare variants. A caveat for the expressionanalyses presented herein is that most RNA-Seq data inTCGA were derived from tumor tissues, which may notbe the tissue directly affected by the disease associatedvariant but could provide a surrogate to assess expres-sion consequences. Additional paired samples with ex-pression data and genomic data will help assess effectsof synonymous variants on splicing and impact of regu-latory variants that will improve prediction algorithms toimprove variant interpretation more broadly.Many rare variants found in disease predisposition test-
ing panels, particularly missense variants, are still of un-known significance [43] and require alternativeapproaches for interpretation. Aside from canonical splicesites in introns, splicing effects were detected for a consid-erable fraction of BRCA1 missense [25] and known exonicvariants [17]. Systematic identification of such splicing ef-fects using mRNA sequencing data from carriers orfunctional-screen experiments is critical to identify patho-genic splice variants that may be labeled as non-splice var-iants. In the current ACMG guidelines [1] for variantinterpretation, one consideration is “the effect of a varianton gene/protein function as determined by a well-established functional assay,” adding either strong supportof a pathogenic (PS3) or benign (BS3) impact. This evi-dence level is rarely used, and our results showed thesedata could be incorporated to increase the accuracy ofvariant classification.
ConclusionsOur study represents one of the most extensive studiesto date that evaluated NC P/LPs and their expressionconsequences. As clinical genomic sequencing becomesmore common, particularly with the adoption of whole-exome or genome profiling technologies, the presentedknowledge herein and additional studies in diverse pop-ulations are valuable to facilitate genome-medicine and
accurately assess an individual’s comprehensive diseaserisk profile.
AbbreviationsACMG/AMP: American College of Molecular Genetics and Association forMolecular Pathology; AD: Autosomal dominant; AR: Autosomal recessive;AIM: Ancestry Informative Markers; ASE: Allelic specific expression;BH: Benjamini-Hochberg; CI: Confidence interval; FDR: False discovery rate;GDC: Genome Data Commons; GTEx: Genotype-Tissue Expression;MaPSy: Massively Parallel Splicing Assay; NC P/LPs: Non-cancer-relatedpathogenic/likely pathogenic variants; NMD: Nonsense-mediated decay;OMIM: Online Mendelian Inheritance in Man; PC: Principal component;PCA: Principal component analysis; TCGA: The Cancer Genome Atlas;VUS: Variants of unknown significance
Supplementary InformationThe online version contains supplementary material available at https://doi.org/10.1186/s13073-021-00964-1.
Additional file 1: Table S1. The list of 152 cancer predisposition genesused to filter for non-cancer related variants.
Additional file 2: Table S2. Detailed information used in this researchfor the 2,271 unique variants.
Additional file 3: Table S3. The distribution of NC P/LPs amongpredisposing variants, patients and genes across different ancestries.
Additional file 4: Figure S1. Carrier frequency (left panel) and NC P/LPs count (right panel) of autosomal recessive (AR) and autosomaldominant (AD) genes across ancestries. Figure S2. Validation ofidentified NC P/LPs in TCGA by respective ancestral population ingnomAD. Figure S3. Validation of genes impacted by identified NC P/LPs in TCGA for respective ancestral population in gnomAD. Figure S4.Carrier density for the distribution of percentile expression of impactedgenes. Figure S5. Lolliplots showing the positions of NC P/LPs in genessuggestively enriched with significant ASE NC P/LPs.
Additional file 5: Table S4. Detailed information of NC P/LPs for Fig. 2.
Additional file 6: Table S5. NC P/LPs with different frequency betweenTCGA cohort and gnomAD cohort.
Additional file 7: Table S6. NC P/LP carrier count/frequency of allaffected genes, ASE NC P/LPs enriched genes and genes impacted by NCP/LPs across different quartile expression splits.
Additional file 8: Table S7. Count/Frequency of NC P/LPs amongpredicted function groups across different ASE enrichment status.
AcknowledgementsThis work was supported in part through the computational resources andstaff expertise provided by Scientific Computing at the Icahn School ofMedicine at Mount Sinai. The authors wish to acknowledge the participatingpatients and families who generously contributed to the TCGA and gnomADdata.
Authors’ contributionsK.H. conceived the research, and K.H. and Z.W. designed the analyses. Z.W.,M.P., and H.C. conducted the bioinformatics analyses. Z.W., X.F., R.S., K.H., andW.K.C. performed the variant prioritization, and X.F. and W.K.C. conducted thevariant review and interpretation. K.C. and W.F. conducted the splicing assaysand curated the experimental data. K.H. and W.K.C. supervised the study. Allauthors read, edited, and approved the manuscript. All authors read andapproved the manuscript.
FundingThe project was supported by ISMMS funds and NIGMS R35GM138113 toK.H.
Availability of data and materialsAncestry ascertainments for all samples in this study were obtained from theTCGA PanCanAtlas AIM analysis working group’s publication and itssupplementary information files [13]. Germline variant calls used in this study
Wang et al. Genome Medicine (2021) 13:147 Page 11 of 13

are available through controlled access data release of the TCGAPanCanAtlas germline working group [12] (https://gdc.cancer.gov/about-data/publications/PanCanAtlas-Germline-AWG). All additional data generatedor analyzed during this study are included in this published article and itssupplementary information files. All the analysis codes used by this studywere deposited on GitHub [44] (https://github.com/WangZishan/TCGASecondaryPredisposition).
Declarations
Ethics approval and consent to participateNot applicable.
Consent for publicationNot applicable.
Competing interestsThe authors declare that they have no competing interests.
Author details1Department of Genetics and Genomic Sciences, Center for TransformativeDisease Modeling, Tisch Cancer Institute, Icahn Institute for Data Science andGenomic Technology, Icahn School of Medicine at Mount Sinai, New York,NY 10029, USA. 2Departments of Pediatrics and Medicine, ColumbiaUniversity Irving Medical Center, New York, NY 10032, USA. 3Departments ofSystems Biology and DBMI, Columbia University Irving Medical Center, NewYork, NY 10032, USA. 4Department of Medicine, University of California SanDiego, 9500 Gilman, San Diego, CA 92093, USA. 5Department of MolecularBiology, Cell Biology and Biochemistry, Brown University, Providence, RI, USA.
Received: 11 January 2021 Accepted: 30 August 2021
References1. Richards S, Aziz N, Bale S, Bick D, Das S, Gastier-Foster J, et al. Standards and
guidelines for the interpretation of sequence variants: a joint consensusrecommendation of the American College of Medical Genetics andGenomics and the Association for Molecular Pathology. Genet Med. 2015;17(5):405–23. https://doi.org/10.1038/gim.2015.30.
2. Kalia SS, Adelman K, Bale SJ, Chung WK, Eng C, Evans JP, et al.Recommendations for reporting of secondary findings in clinical exomeand genome sequencing, 2016 update (ACMG SF v2.0): a policy statementof the American College of Medical Genetics and Genomics. Genet Med.2017;19(2):249–55.
3. Lupski JR, Belmont JW, Boerwinkle E, Gibbs RA. Clan genomics and thecomplex architecture of human disease. Cell. 2011;147(1):32–43.
4. Kobayashi Y, Yang S, Nykamp K, Garcia J, Lincoln SE, Topper SE. Pathogenicvariant burden in the ExAC database: An empirical approach to evaluatingpopulation data for clinical variant interpretation. Genome Med. 2017;9(1):1–14.
5. Tsui B, Dow M, Skola D, Carter H. Extracting allelic read counts from 250,000human sequencing runs in Sequence Read Archive. Pac Symp Biocomput.2019;24:196–207.
6. Deelen P, Zhernakova DV, de Haan M, van der Sijde M, Bonder MJ,Karjalainen J, et al. Calling genotypes from public RNA-sequencing dataenables identification of genetic variants that affect gene-expression levels.Genome Med. 2015;7(1):30. https://doi.org/10.1186/s13073-015-0152-4.
7. Li X, Kim Y, Tsang EK, Davis JR, Damani FN, Chiang C, et al. The impact ofrare variation on gene expression across tissues. Nature. 2017;550(7675):239–43.
8. Frésard L, Smail C, Ferraro NM, Teran NA, Li X, Smith KS, et al. Identificationof rare-disease genes using blood transcriptome sequencing and largecontrol cohorts. Nat Med. 2019;25(6):911–9.
9. Ferraro NM, Strober BJ, Einson J, Abell NS, Aguet F, Barbeira AN, et al.Transcriptomic signatures across human tissues identify functional raregenetic variation. Science. 2020;369(6509):eaaz5900.
10. Chiang C, Scott AJ, Davis JR, Tsang EK, Li X, Kim Y, et al. The impact ofstructural variation on human gene expression. Nat Genet. 2017;49(5):692–9.
11. Ding L, Bailey MH, Porta-Pardo E, Thorsson V, Colaprico A, Bertrand D, et al.Perspective on oncogenic processes at the end of the beginning of cancergenomics. Cell. 2018;173(2):305–20.e10.
12. Huang KL, Mashl RJ, Wu Y, Ritter DI, Wang J, Oh C, et al. Pathogenicgermline variants in 10,389 adult cancers. Cell. 2018;173(2):355–70.e14.
13. Carrot-Zhang J, Chambwe N, Damrauer JS, Knijnenburg TA, Robertson AG,Yau C, et al. Comprehensive analysis of genetic ancestry and its molecularcorrelates in cancer. Cancer Cell. 2020;37(5):639–654.e6.
14. Landrum MJ, Lee JM, Benson M, Brown GR, Chao C, Chitipiralla S, et al. ClinVar:improving access to variant interpretations and supporting evidence. NucleicAcids Res. 2018;46(D1):D1062–7. https://doi.org/10.1093/nar/gkx1153.
15. Li Q, Wang K. InterVar: clinical interpretation of genetic variants by the 2015ACMG-AMP guidelines. Am J Hum Genet. 2017;100(2):267–80. https://doi.org/10.1016/j.ajhg.2017.01.004.
16. Karczewski KJ, Francioli LC, Tiao G, Cummings BB, Alföldi J, Wang Q, et al.The mutational constraint spectrum quantified from variation in 141,456humans. Nature. 2020;581:434–43.
17. Soemedi R, Cygan KJ, Rhine CL, Wang J, Bulacan C, Yang J, et al. Pathogenicvariants that alter protein code often disrupt splicing. Nat Genet. 2017;49(6):848–55. https://doi.org/10.1038/ng.3837.
18. Oak N, Cherniack AD, Mashl RJ, Carrot-Zhang J, Chambwe N, Damrauer JS,et al. Ancestry-specific predisposing germline variants in cancer. GenomeMed. 2020;12(1):51.
19. Scott AD, Huang KL, Weerasinghe A, Mashl RJ, Gao Q, Martins Rodrigues F,et al. CharGer: clinical characterization of Germline variants. Bioinformatics.2019;35(5):865–7. https://doi.org/10.1093/bioinformatics/bty649.
20. Olfson E, Cottrell CE, Davidson NO, Gurnett CA, Heusel JW, Stitziel NO, et al.Identification of medically actionable secondary findings in the 1000genomes. PLoS One. 2015;10(9):e0135193. https://doi.org/10.1371/journal.pone.0135193.
21. The eMERGE Clinical Annotation Working Group. Frequency of genomicsecondary findings among 21,915 eMERGE network participants. GenetMed. 2020;22(9):1470–7.
22. Natarajan P, Gold NB, Bick AG, McLaughlin H, Kraft P, Rehm HL, et al.Aggregate penetrance of genomic variants for actionable disorders inEuropean and African Americans. Sci Transl Med. 2016;8(364):364ra151.
23. Haque IS, Lazarin GA, Kang HP, Evans EA, Goldberg JD, Wapner RJ. Modeledfetal risk of genetic diseases identified by expanded carrier screening. JAMA.2016;316(7):734–42.
24. Popejoy AB, Ritter DI, Crooks K, Currey E, Fullerton SM, Hindorff LA, et al.The clinical imperative for inclusivity: race, ethnicity, and ancestry (REA) ingenomics. Hum Mutat. 2018;39(11):1713–20. https://doi.org/10.1002/humu.23644.
25. Findlay GM, Daza RM, Martin B, Zhang MD, Leith AP, Gasperini M, et al.Accurate classification of BRCA1 variants with saturation genome editing.Nature. 2018;562(7726):217–22. https://doi.org/10.1038/s41586-018-0461-z.
26. Landrum MJ, Lee JM, Benson M, Brown G, Chao C, Chitipiralla S, et al.ClinVar: public archive of interpretations of clinically relevant variants.Nucleic Acids Res. 2016;44(D1):D862–8. https://doi.org/10.1093/nar/gkv1222.
27. Amendola LM, Jarvik GP, Leo MC, McLaughlin HM, Akkari Y, Amaral MD,et al. Performance of ACMG-AMP variant-interpretation guidelines amongnine laboratories in the Clinical Sequencing Exploratory ResearchConsortium. Am J Hum Genet. 2016;98(6):1067–76.
28. Popejoy AB, Fullerton SM. Genomics is failing on diversity. Nature. 2016;538(7624):161
29. Hindorff LA, Bonham VL, Brody LC, Ginoza MEC, Hutter CM, Manolio TA,et al. Prioritizing diversity in human genomics research. Nat Rev Genet.2018;19(3):175–85.
30. Petrovski S, Goldstein DB. Unequal representation of genetic variation acrossancestry groups creates healthcare inequality in the application of precisionmedicine. Genome Biol. 2016;17(1):157.
31. Caswell-Jin JL, Gupta T, Hall E, Petrovchich IM, Mills MA, Kingham KE, et al.Racial/ethnic differences in multiple-gene sequencing results for hereditarycancer risk. Genet Med. 2018;20(2):234–9.
32. Abul-Husn NS, Soper ER, Odgis JA, Cullina S, Bobo D, Moscati A, et al.Exome sequencing reveals a high prevalence of BRCA1 and BRCA2 foundervariants in a diverse population-based biobank. Genome Med. 2019;12(1):2.
33. Manrai AK, Funke BH, Rehm HL, Olesen MS, Maron BA, Szolovits P, et al.Genetic misdiagnoses and the potential for health disparities. N Engl J Med.2016;375(7):655–65. https://doi.org/10.1056/NEJMsa1507092.
34. Amendola LM, Berg JS, Horowitz CR, Angelo F, Bensen JT, Biesecker BB,et al. The clinical sequencing evidence-generating research consortium:integrating genomic sequencing in diverse and medically underservedpopulations. Am J Hum Genet. Cell Press. 2018;103:319–27.
Wang et al. Genome Medicine (2021) 13:147 Page 12 of 13

35. Zouk H, Venner E, Lennon NJ, Muzny DM, Abrams D, Adunyah S, et al.Harmonizing clinical sequencing and interpretation for the eMERGE IIInetwork. Am J Hum Genet. 2019;105(3):588–605.
36. Fry A, Littlejohns TJ, Sudlow C, Doherty N, Adamska L, Sprosen T, et al.Comparison of sociodemographic and health-related characteristics of UKBiobank participants with those of the general population. Am J Epidemiol.2017;186(9):1026–34. https://doi.org/10.1093/aje/kwx246.
37. Bycroft C, Freeman C, Petkova D, Band G, Elliott LT, Sharp K, et al. The UKBiobank resource with deep phenotyping and genomic data. Nature. 2018;562(7726):203–9.
38. Kowalski MH, Qian H, Hou Z, Rosen JD, Tapia AL, Shan Y, et al. Use of>100,000 NHLBI Trans-Omics for Precision Medicine (TOPMed) Consortiumwhole genome sequences improves imputation quality and detection ofrare variant associations in admixed African and Hispanic/Latinopopulations. PLoS Genet. 2019;15(12):e1008500. https://doi.org/10.1371/journal.pgen.1008500.
39. Gaziano JM, Concato J, Brophy M, Fiore L, Pyarajan S, Breeling J, et al.Million Veteran Program: a mega-biobank to study genetic influences onhealth and disease. J Clin Epidemiol. 2016;70:214–23. https://doi.org/10.1016/j.jclinepi.2015.09.016.
40. Stranger BE, Montgomery SB, Dimas AS, Parts L, Stegle O, Ingle CE, et al.Patterns of Cis regulatory variation in diverse human populations. PLoSGenet. 2012;8(4):e1002639.
41. Tehranchi A, Hie B, Dacre M, Kaplow I, Pettie K, Combs P, et al. Fine-mapping cis-regulatory variants in diverse human populations. Elife. 2019;8:e39595.
42. Zhong Y, Perera MA, Gamazon ER. On using local ancestry to characterizethe genetic architecture of human traits: genetic regulation of geneexpression in multiethnic or admixed populations. Am J Hum Genet. 2019;104(6):1097–115. https://doi.org/10.1016/j.ajhg.2019.04.009.
43. Couch FJ, Shimelis H, Hu C, Hart SN, Polley EC, Na J, et al. Associationsbetween cancer predisposition testing panel genes and breast cancer.JAMA Oncol. 2017;3(9):1190–6.
44. Wang Z. TCGA secondary predisposition. Github. 2021. https://github.com/WangZishan/TCGASecondaryPredisposition. Accessed 18 Aug 2021.
Publisher’s NoteSpringer Nature remains neutral with regard to jurisdictional claims inpublished maps and institutional affiliations.
Wang et al. Genome Medicine (2021) 13:147 Page 13 of 13


![longevity: 25 genetic loci associated in 389,166 UK ... › ... · knocking out many specific genes [1]. In humans there is a growing number of inherited (germline) genetic variants](https://img.pdfslide.net/doc/110x75/5f10337d7e708231d447f108/longevity-25-genetic-loci-associated-in-389166-uk-a-knocking-out-many.jpg)