Embed Size (px)
Citation preview

NBER WORKING PAPER SERIES
NON-CORE BANK LIABILITIES AND FINANCIAL VULNERABILITY
Joon-Ho HahmHyun Song Shin
Kwanho Shin
Working Paper 18428http://www.nber.org/papers/w18428
NATIONAL BUREAU OF ECONOMIC RESEARCH1050 Massachusetts Avenue
Cambridge, MA 02138September 2012
We are grateful to Stijn Claessens and Ken West for comments on an earlier version. The authorsthank Yongwhan Jung and Ilsoo Hahn for their excellent research assistance. This paper was presentedat the Federal Reserve Board/JMCB conference on “Regulation of Systemic Risk”, September 14,2011. We thank participants at the conference for their feedback. The views expressed herein arethose of the authors and do not necessarily reflect the views of the National Bureau of Economic Research.
At least one co-author has disclosed a financial relationship of potential relevance for this research.Further information is available online at http://www.nber.org/papers/w18428.ack
NBER working papers are circulated for discussion and comment purposes. They have not been peer-reviewed or been subject to the review by the NBER Board of Directors that accompanies officialNBER publications.
© 2012 by Joon-Ho Hahm, Hyun Song Shin, and Kwanho Shin. All rights reserved. Short sectionsof text, not to exceed two paragraphs, may be quoted without explicit permission provided that fullcredit, including © notice, is given to the source.

Non-Core Bank Liabilities and Financial VulnerabilityJoon-Ho Hahm, Hyun Song Shin, and Kwanho ShinNBER Working Paper No. 18428September 2012JEL No. F32,F33,F34
ABSTRACT
A lending boom is reflected in the composition of bank liabilities when traditional retail deposits (coreliabilities) cannot keep pace with asset growth and banks turn to other funding sources (non-core liabilities)to finance their lending. We formulate a model of credit supply as the flip side of a credit risk modelwhere a large stock of non-core liabilities serves as an indicator of the erosion of risk premiums andhence of vulnerability to a crisis. We find supporting empirical evidence in a panel probit study ofemerging and developing economies.
Joon-Ho HahmYonsei UniversityGraduate School of International StudiesSeoul, [email protected]
Hyun Song ShinDepartment of EconomicsPrinceton UniversityPrinceton, NJ 08544and [email protected]
Kwanho ShinKorea UniversityDepartment of EconomicsSeoul [email protected]
An online appendix is available at:http://www.nber.org/data-appendix/w18428
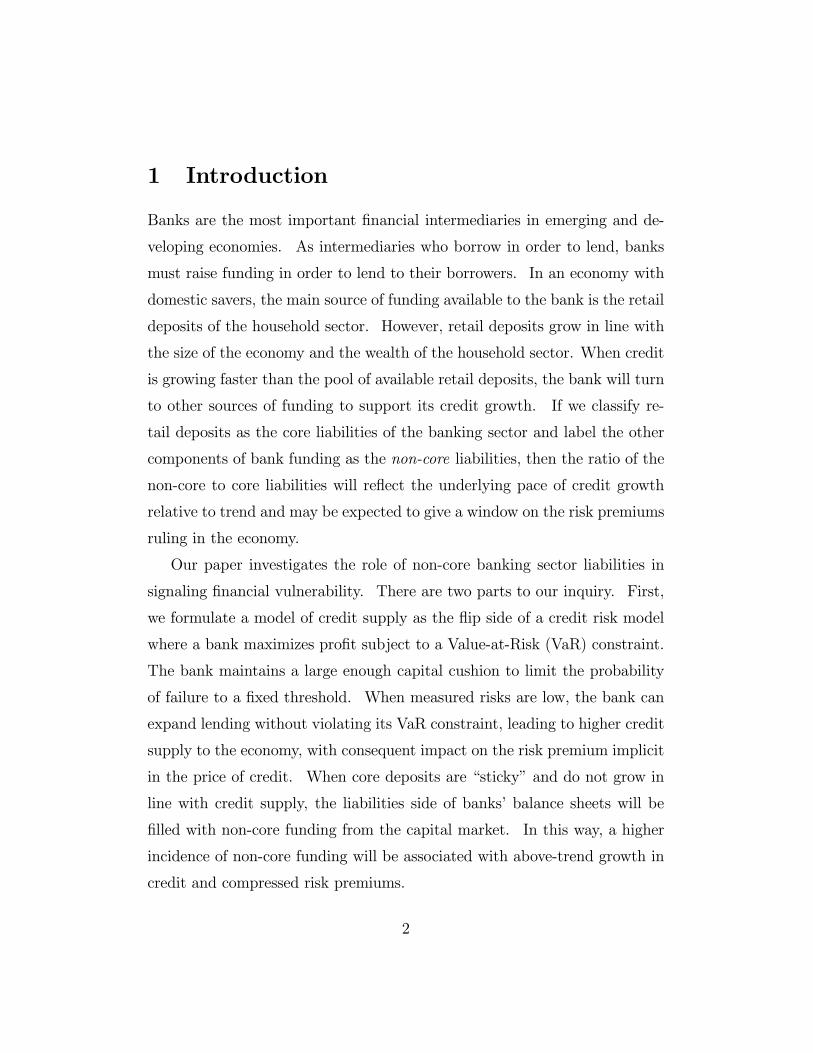
1 Introduction
Banks are the most important financial intermediaries in emerging and de-
veloping economies. As intermediaries who borrow in order to lend, banks
must raise funding in order to lend to their borrowers. In an economy with
domestic savers, the main source of funding available to the bank is the retail
deposits of the household sector. However, retail deposits grow in line with
the size of the economy and the wealth of the household sector. When credit
is growing faster than the pool of available retail deposits, the bank will turn
to other sources of funding to support its credit growth. If we classify re-
tail deposits as the core liabilities of the banking sector and label the other
components of bank funding as the non-core liabilities, then the ratio of the
non-core to core liabilities will reflect the underlying pace of credit growth
relative to trend and may be expected to give a window on the risk premiums
ruling in the economy.
Our paper investigates the role of non-core banking sector liabilities in
signaling financial vulnerability. There are two parts to our inquiry. First,
we formulate a model of credit supply as the flip side of a credit risk model
where a bank maximizes profit subject to a Value-at-Risk (VaR) constraint.
The bank maintains a large enough capital cushion to limit the probability
of failure to a fixed threshold. When measured risks are low, the bank can
expand lending without violating its VaR constraint, leading to higher credit
supply to the economy, with consequent impact on the risk premium implicit
in the price of credit. When core deposits are “sticky” and do not grow in
line with credit supply, the liabilities side of banks’ balance sheets will be
filled with non-core funding from the capital market. In this way, a higher
incidence of non-core funding will be associated with above-trend growth in
credit and compressed risk premiums.
2
A L
AssetsEquity
Debt
A L
Assets
Equity
Debt
A L
Assets
Equity
Debt
A L
Assets
Equity
Debt
Mode 1: Increased leverage with assets fixed Mode 2: Increased leverage via asset growth
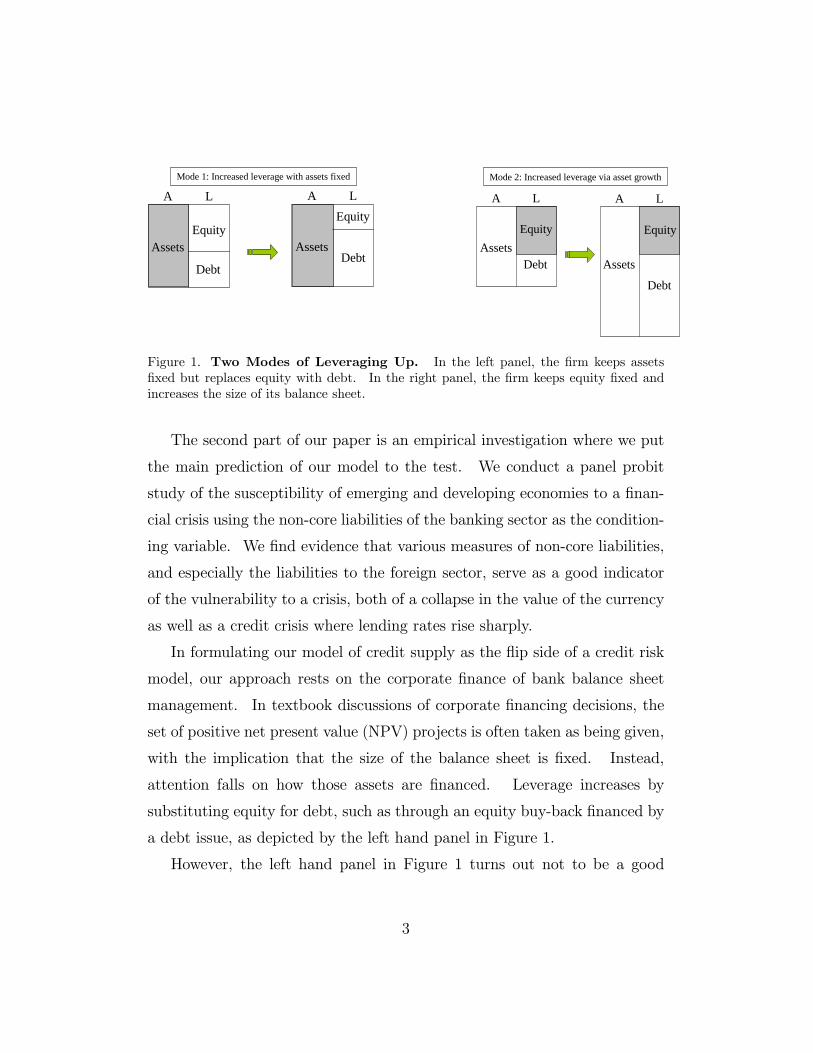
Figure 1. Two Modes of Leveraging Up. In the left panel, the firm keeps assets
fixed but replaces equity with debt. In the right panel, the firm keeps equity fixed and
increases the size of its balance sheet.
The second part of our paper is an empirical investigation where we put
the main prediction of our model to the test. We conduct a panel probit
study of the susceptibility of emerging and developing economies to a finan-
cial crisis using the non-core liabilities of the banking sector as the condition-
ing variable. We find evidence that various measures of non-core liabilities,
and especially the liabilities to the foreign sector, serve as a good indicator
of the vulnerability to a crisis, both of a collapse in the value of the currency
as well as a credit crisis where lending rates rise sharply.
In formulating our model of credit supply as the flip side of a credit risk
model, our approach rests on the corporate finance of bank balance sheet
management. In textbook discussions of corporate financing decisions, the
set of positive net present value (NPV) projects is often taken as being given,
with the implication that the size of the balance sheet is fixed. Instead,
attention falls on how those assets are financed. Leverage increases by
substituting equity for debt, such as through an equity buy-back financed by
a debt issue, as depicted by the left hand panel in Figure 1.
However, the left hand panel in Figure 1 turns out not to be a good
3

Barclays: 2 year change in assets, equity, debt and risk-weighted assets (1992 -2010)
y = 0.9974x - 0.175
R2 = 0.9998
-1,000
-800
-600
-400
-200
0
200
400
600
800
1,000
-1,000 -500 0 500 1,000
2 year asset change (billion pounds)
2 ye
ar c
hang
e in
equ
ity, d
ebt a
nd
risk-
wei
ghte
d as
sets
(bi
llion
pou
nds)
2yr RWAChange
2yr EquityChange
2yr DebtChange
Figure 2. Scatter chart of relationship between the two year change in total assets
of Barclays against two-year changes in debt, equity and risk-weighted assets (Source:
Bankscope)
description of the way that the banking sector leverage varies over the finan-
cial cycle. Instead, leverage and total assets tend to move in lock-step, as
depicted in the right hand panel of Figure 1.
Bank balance sheet management can be illustrated in Figure 2 that shows
the scatter chart of the two-year changes in debt, equity and risk-weighted
assets to changes in total assets of Barclays. The pattern in Figure 2 is
typical of banks across countries and across business sectors.1 More precisely,
Figure 2 plots {(∆∆)}, {(∆∆)} and {(∆∆)} where∆ is the two-year change in assets at quarter , and where ∆, ∆ and
∆ are the two-year changes in equity, debt, and risk-weighted assets,
respectively.
1See Adrian and Shin (2010) for a more detailed study of the US investment banks.
4

The fitted line through {(∆∆)} has slope very close to 1, whilethe slope of the fitted line through the points {(∆∆)} is close to zero.Both features capture the picture of bank balance sheet management given
by the right hand panel in Figure 1.
The upshot is that there is a near one-for-one relation between the change
in assets and the change in debt, meaning that assets expand or contract
dollar for dollar (or pound for pound) through a change in debt. What is
especially notable is how the risk-weighted assets of the bank barely change,
even as the raw assets change by several hundred billion pounds. The fact
that risk-weighted assets barely increase even as raw assets are increasing
rapidly attests to the lowering of measured risks during upswings. Lower
measured risks and lending booms thus go together. Bank lending appears
to expand to fill up any spare balance sheet capacity when measured risks
are low.
The causation in the reverse direction may also be operating — that is,
the compression of risk spreads is induced by the rapid increase in credit
supply chasing available credits. In the presence of such two-way causation,
there may well be the potential for a feedback loop in which greater credit
supply by banks and the compression of risk spreads interact to generate an
amplification of the credit boom. Borio and Disyatat (2011) have coined
the term ”excess elasticity” to describe the tendency of the banking system
to expand when financial constraints are relaxed.
Such procyclical behavior of the banking sector has consequences for cap-
ital flows. Banks are intermediaries who borrow in order to lend, and they
must raise funding in order to lend to their borrowers. When credit is ex-
panding rapidly, outstripping the pool of available retail deposits, the bank
5
will turn to other sources of funding to support its credit growth, typically
from other banks operating as wholesale lenders in the capital market. In this
respect, there are close parallels between currency crises and credit crises.
The link comes from the fact that the procyclical behavior of banking that
fuels the credit boom is financed through capital inflows via the banking sec-
tor. Indeed, one of the key results unearthed by our empirical investigation
below is that the most consistently reliable indicator of the vulnerability of
both a currency crisis and a credit crisis is a high level of bank liabilities to
the foreign sector.
By addressing the up-phase of the financial cycle, and the potential for
the compression of risk premiums during lending booms, our approach differs
from models of leverage constraints or collateral constraints that bind only
in the downturn. In such models, lending is always below the first best. As
well as on the downturn, our focus is on the up-phase of the cycle when risk
premiums become compressed, leaving the economy vulnerable to a potential
reversal.
Our model is not sufficiently refined to address issues of the optimal level
of risk premium or quantity of credit. However, the model delivers the
feature that a large stock of non-core liabilities of the banking sector will be
associated with compressed risk premiums in the market for bank credit - a
feature that proves useful in our empirical investigation. We conduct a panel
probit investigation for the incidence of financial crises in a large sample of
emerging and developing economies and find that non-core bank liabilities
do, indeed, have explanatory power for subsequent crises.
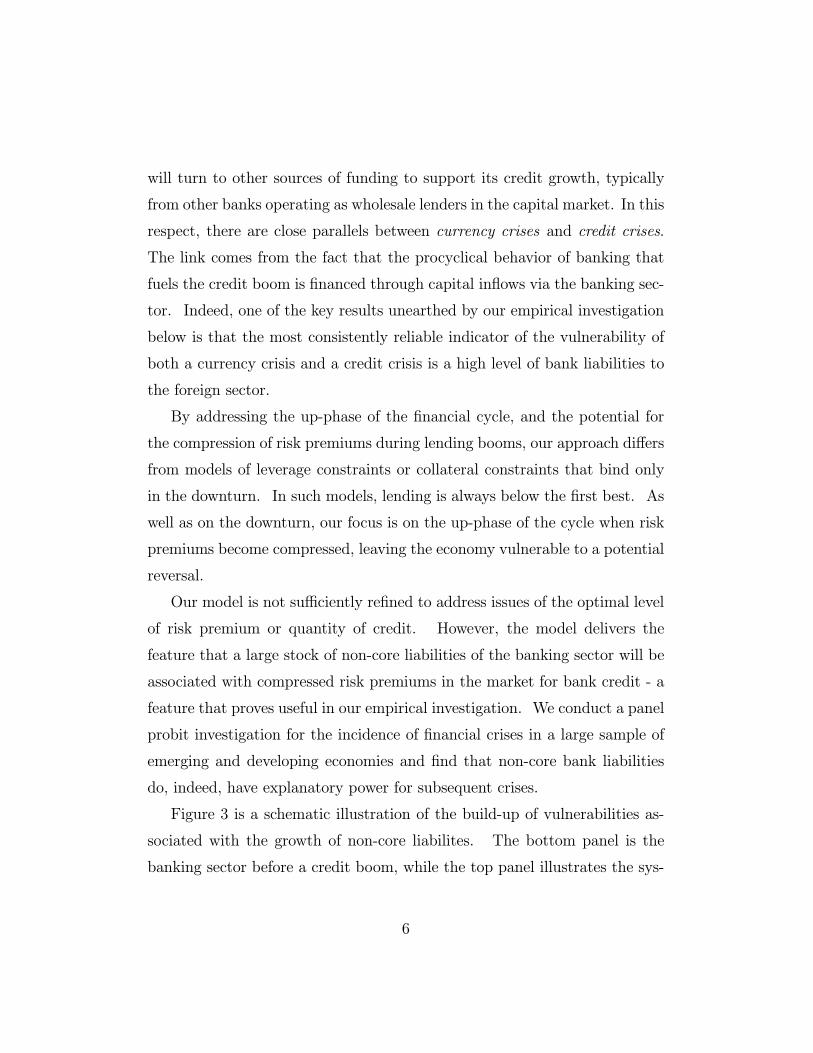
Figure 3 is a schematic illustration of the build-up of vulnerabilities as-
sociated with the growth of non-core liabilites. The bottom panel is the
banking sector before a credit boom, while the top panel illustrates the sys-
6
DomesticDepositors
Borrowers
Banking Sector
ForeignCreditors
NewBorrowers
DomesticDepositors
Borrowers
Banking Sector
AfterLendingBoom
BeforeLendingBoom
Figure 3. Lending Boom Financed by Non-Core Liabilities. This figure depicts
the banking sector balance sheet before and after a credit boom. Increased lending during
a credit boom is financed by non-core liabilities.
tem after the boom. As traditional deposit funding does not keep up with
the credit growth, the banking sector’s expansion is funded by non-core li-
abilities (in this case, from foreign creditors), building up vulnerabilities to
deleveraging by foreign creditors.
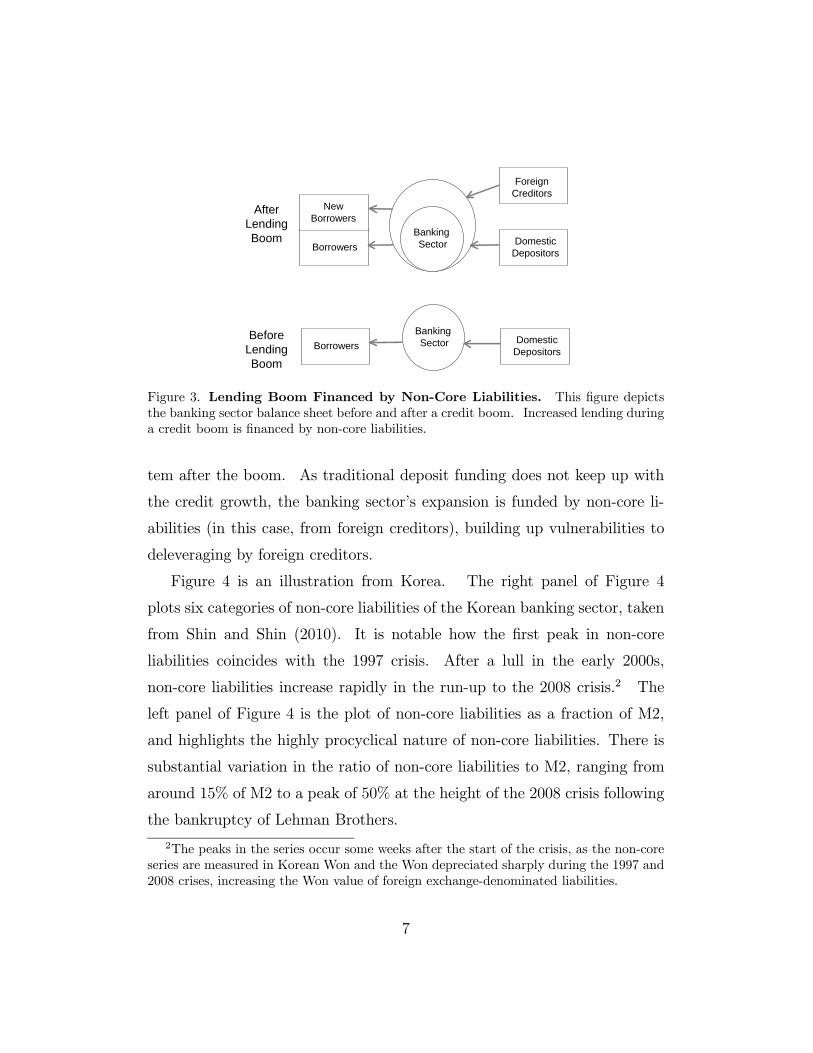
Figure 4 is an illustration from Korea. The right panel of Figure 4
plots six categories of non-core liabilities of the Korean banking sector, taken
from Shin and Shin (2010). It is notable how the first peak in non-core
liabilities coincides with the 1997 crisis. After a lull in the early 2000s,
non-core liabilities increase rapidly in the run-up to the 2008 crisis.2 The
left panel of Figure 4 is the plot of non-core liabilities as a fraction of M2,
and highlights the highly procyclical nature of non-core liabilities. There is
substantial variation in the ratio of non-core liabilities to M2, ranging from
around 15% of M2 to a peak of 50% at the height of the 2008 crisis following
the bankruptcy of Lehman Brothers.
2The peaks in the series occur some weeks after the start of the crisis, as the non-core
series are measured in Korean Won and the Won depreciated sharply during the 1997 and
2008 crises, increasing the Won value of foreign exchange-denominated liabilities.
7

Non-Core Liabilities as Fraction of M2
Jan-98
Jan-09
0.10
0.15
0.20
0.25
0.30
0.35
0.40
0.45
0.50
0.55
Jan-91
Jan-92
Jan-93
Jan-94
Jan-95
Jan-96
Jan-97
Jan-98
Jan-99
Jan-00
Jan-01
Jan-02
Jan-03
Jan-04
Jan-05
Jan-06
Jan-07
Jan-08
Jan-09
Jan-10
0
100
200
300
400
500
600
700
800
Jan-91
Jan-93
Jan-95
Jan-97
Jan-99
Jan-01
Jan-03
Jan-05
Jan-07
Jan-09
Tri
llio
n W
on
[Other] FX borrowing
[Lf] Debt Securities
[Lf] Repos
[M2] Promissory Note 2
[M2] Promissory Note 1
[M2] Certificate of Deposit
Non-Core Liabilities of Korean Banks
Figure 4. Non-Core Liabilites of Korean Banks. Panel on right plots six categories
of non-core liabilities of Korean banks measured in Korean Won. Panel on the left plots
the non-core series as a fraction of M2. Source: Bank of Korea and Shin and Shin (2010)
There is an extensive literature on leading indicators of emerging market
financial crises. Using a panel of over 100 developing countries from 1971 to
1992, Frankel and Rose (1996) find that currency crises tend to occur when
output growth is sluggish, domestic credit growth is high, foreign interest
rates are high, and the ratio of FDI to debt is low. Kaminsky and Reinhart
(1999) explored the linkages between banking crises and currency crises, and
found that financial liberalization and capital inflows, credit booms, and an
overvalued currency often precede “twin crises” that combine banking and
currency crises.3
Drawing on the earlier literature, Goldstein, Kaminsky and Reinhart
(2000) conducted a comprehensive battery of empirical tests for the effec-
tiveness of early warning systems that rely on macroeconomic (and some
microeconomic) variables at various frequencies. Using the “signals” method-
3See Berg and Pattillo (1999) for a survey of the early literature and comparison of
methodologies.
8

ology of comparing Type I and Type II errors, they conclude that many of
their in-sample leading indicators remain effective in out-of-sample analyses.
The recent global financial crisis has also stimulated renewed interest
in measuring vulnerability. However, the fact that the crisis affected ad-
vanced and emerging economies alike, with outwardly disparate causes in
the two groups, has meant that consistent indicators of vulnerability have
been rare. Claessens et al. (2010) examine many candidate indicators of
vulnerability but find support only for house price appreciation, current ac-
count deficits and bank credit growth. Using a Multiple Indicator Multiple
Cause model based on 107 country data, Rose and Spiegel (2008, 2010) find
that commonly cited causes of financial crises implicating a host of variables
- macroeconomic, financial conditions, regulatory, and institutional - are in
fact only weakly related to the incidence of crises, leading them to somewhat
more skeptical conclusions on the usefulness of early warning systems.
Our objective differs from these earlier papers. Our motivation is pri-
marily to draw attention to the role of the intermediary sector in driving
fluctuations in risk premiums. For this reason, we employ only a small
selection of key variables motivated by the theory, and we do not attempt
to maximize goodness of fit by employing a large number of explanatory
variables from disparate categories. Nevertheless, we conduct a robustness
analysis by considering other variables considered in the literature.
Overall, the empirical performance of non-core liabilities measures is en-
couraging and gives some cause for optimism that more elaborate versions of
such models may be a useful input into early warning exercises. In any case,
we note that previous research on forecasting crises did not focus explicitly
on fluctuation of non-core bank liabilities as a potential indicator of finan-
cial vulnerability, focusing instead on the asset side of the banking sector
9
balance sheet, such as on credit growth or credit to GDP ratios. Although
our non-core liability measures are closely related to asset side measures, we
show that they carry considerable information value over and above credit
aggregates.
Liabilities of banks to the foreign sector constitute a major component of
non-core bank liabilities in many emerging market countries as the domestic
wholesale bank funding market is not sufficiently developed to support rapid
bank lending growth. Earlier empirical studies cited above have examined
the size and maturity structure of aggregate external debt positions - an ex-
ample being the ratio of short-term external debt to official foreign exchange
reserves. These ratios were employed as an indicator of vulnerability to for-
eign exchange liquidity shocks. Our contribution is to point to the banking
sector as the likely engine of accumulating vulnerability.
Our investigation complements that in Gourinchas and Obstfeld (2012),
who conduct an empirical study using data from 1973 to 2010 for both ad-
vanced and emerging economies on the determinants of financial crises. They
find that two factors emerge consistently as the most robust and significant
predictors of financial crises, namely a rapid increase in leverage and a sharp
real appreciation of the currency.
Our study also builds on Shin and Shin (2010), who laid out the concep-
tual distinction between core- and non-core banking sector liabilities, and how
these aggregates relate to traditional monetary aggregates. Using Korean
bank data, this earlier study finds that non-core bank liabilities as defined
as the sum of foreign exchange liabilities and wholesale bank funding are
associated with vulnerability to sharp depreciation of the Won and increased
borrowing spreads. Hahm, Mishkin, Shin and Shin (2010) further elaborate
on the role of non-core bank liabilities as an indicator of financial procyclical-
10

ity. Using more disaggregated series by claim-holders of non-core liabilities
in Korea, they find that, relative to core liabilities, non-core bank liabilities
are more procyclical on various measures. Drawing on these earlier studies,
the objective of our empirical analysis is to explore the potential usefulness
of non-core bank liabilities as conditioning variables in a panel probit study
of potential vulnerability of emerging economies to financial crises.
The outline of the paper is as follows. We begin in the next section by
formulating our model of credit supply based on the Vasicek (2002) model of
credit risk, and draw implications on the relationship between credit, non-
core liabilities and risk premiums in the bank credit market. We then fol-
low with our empirical investigation by conducting a panel probit study of
financial crises in emerging and developing economies using the IMF’s In-
ternational Financial Statistics (IFS) data. In order to allow for persistent
heterogeneity across countries in our sample, we use the random effects ver-
sion of the panel probit model, and confirm the strong explanatory role of
non-core banking sector liabilities in explaining crises.
2 Model
Our model is a static model of credit supply with two dates - dates 0 and
1. Loans are made at date 0 and repaid at date 1. A bank makes loans
financed from three funding sources - the bank’s equity , its deposits
and its non-core liabilities, denoted by . The notation for the components
of the bank’s balance sheet is given as in Figure 5.
The bank’s equity and total deposit funding are both fixed. Deposits
are fully insured by the government, and so earn the risk-free rate of return,
which we set to zero. Total lending satisfies the balance sheet identity:
= + + (1)
11

Assets Liabilities
L
E
D
N
Loans
Equity
Deposits
Non-Core Liabilities
Figure 5. Balance Sheet of Bank
The bank has a well-diversified loan portfolio consisting of loans to many
borrowers, and credit risk follows the Vasicek (2002) model, which is the
basis for the Basel capital requirements (BCBS (2005)). Borrower repays
the loan when 0, where is the random variable given by
= −Φ−1 () +√ +p1− (2)
where Φ () is the c.d.f. of the standard normal, is the probability of default
on the loan and and {} are mutually independent standard normalrandom variables. is the common factor that drives credit risk while each
are the idiosyncratic component of credit risk for the particular borrower
. The parameter ∈ (0 1) is the exposure of each loan to the commonfactor . To verify that is the probability of default, note that
Pr ( 0) = Pr³√
+p1− Φ−1 ()
´= Φ
¡Φ−1 ()
¢=
Conditional on the common factor , defaults are independent. Denote
the loan interest rate as so that the notional value of assets (the amount
due to the bank at date 1) is (1 + ). By the law of large numbers, the
realized value of the loan book at date 1 is the random variable ( ) defined
12
as:
( ) ≡ (1 + ) · Pr ( ≥ 0| )= (1 + ) · Pr
³√ +
p1− ≥ Φ−1 () |
´= (1 + ) · Φ
³√−Φ−1()√1−
´(3)
The quantiles of the asset realizations can be derived as follows. The
c.d.f. of the realized value of the loan portfolio at date 1 is given by
() = Pr ( ≤ )
= Pr¡ ≤ −1 ()
¢= Φ
¡−1 ()
¢= Φ
µΦ−1()+
√1−Φ−1(
(1+))√
¶(4)
As prescribed by the Basel capital requirements (BCBS (2005))4, the bank
follows the Value-at-Risk (VaR) rule of keeping enough equity to limit the
insolvency probability of the bank to be some small 0. We impose the
condition that . That is, the bank defaults with a smaller probability
than an individual borrower.5 The bank is risk-neutral otherwise. The
bank’s objective is to maximize expected profit subject only to its Value-at-
Risk constaint.
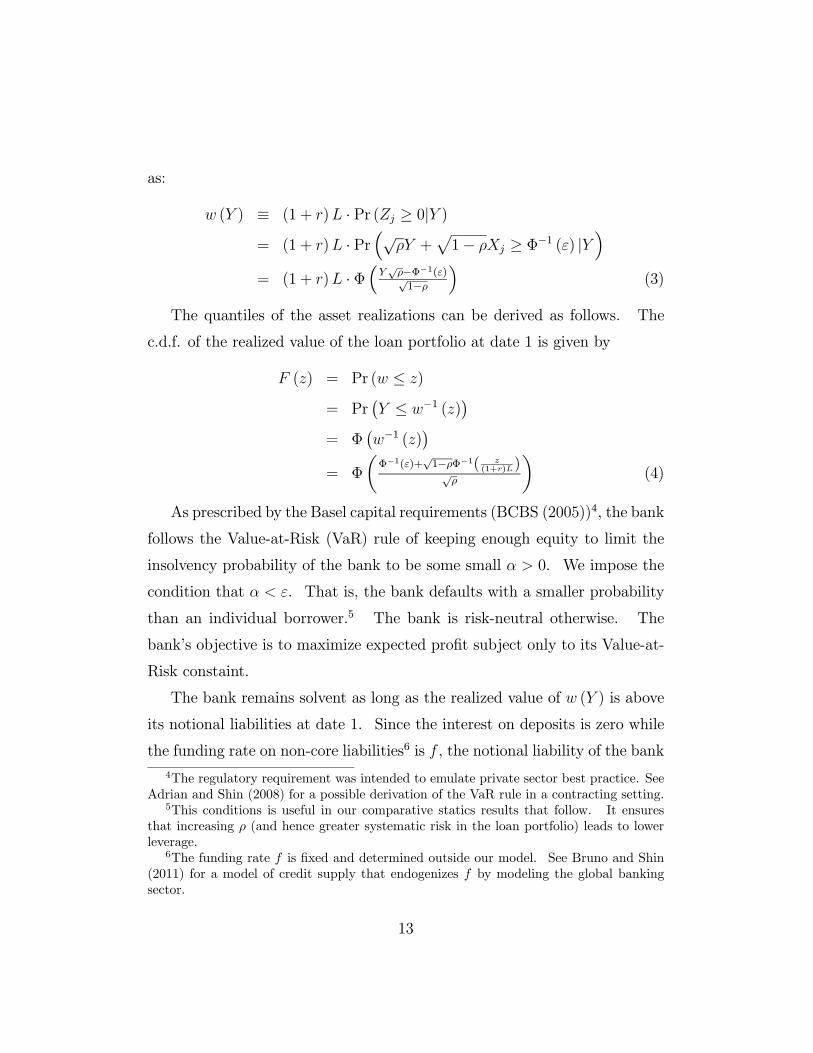
The bank remains solvent as long as the realized value of ( ) is above
its notional liabilities at date 1. Since the interest on deposits is zero while
the funding rate on non-core liabilities6 is , the notional liability of the bank
4The regulatory requirement was intended to emulate private sector best practice. See
Adrian and Shin (2008) for a possible derivation of the VaR rule in a contracting setting.5This conditions is useful in our comparative statics results that follow. It ensures
that increasing (and hence greater systematic risk in the loan portfolio) leads to lower
leverage.6The funding rate is fixed and determined outside our model. See Bruno and Shin
(2011) for a model of credit supply that endogenizes by modeling the global banking
sector.
13
NfD 1
Densityover
repayments
Lr10
Yw
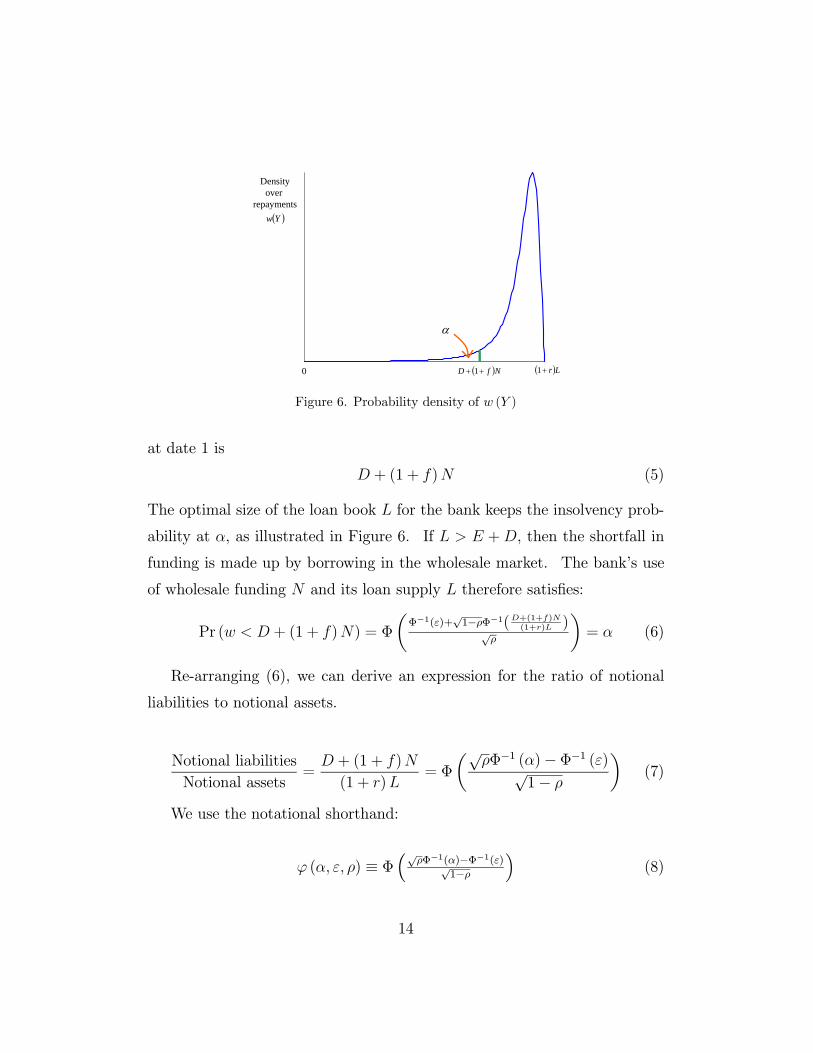
Figure 6. Probability density of ( )
at date 1 is
+ (1 + ) (5)
The optimal size of the loan book for the bank keeps the insolvency prob-
ability at , as illustrated in Figure 6. If +, then the shortfall in
funding is made up by borrowing in the wholesale market. The bank’s use
of wholesale funding and its loan supply therefore satisfies:
Pr ( + (1 + )) = Φ
µΦ−1()+
√1−Φ−1(+(1+)(1+) )√
¶= (6)
Re-arranging (6), we can derive an expression for the ratio of notional
liabilities to notional assets.
Notional liabilities
Notional assets=
+ (1 + )
(1 + )= Φ
µ√Φ−1 ()−Φ−1 ()√
1−
¶(7)
We use the notational shorthand:
( ) ≡ Φ³√
Φ−1()−Φ−1()√1−
´(8)
14

0.0 0.1 0.2 0.3 0.4 0.5 0.6 0.7 0.8 0.9 1.00.0
0.1
0.2
0.3
0.4
0.5
0.6
0.7
0.8
0.9
Figure 7. Plot of notional debt to assets ratio ( ). This chart plots as a
function of with = 0001. Dark line is when = 001. Light line is when = 0005.
Clearly, ∈ (0 1). Our condition that ensures that the expression
inside Φ () in (8) flips sign from negative to positive as increases from zero
to one. Figure 7 plots the notional debt to assets ratio as a function
of the common risk factor . The Value-at-Risk threshold level is fixed at
= 01%. The dark line is when the default probability is 1%, while
the light line is when is 0.5%. We see that the debt to assets ratio is
decreasing in both and . Since the bank’s leverage is monotonic in ,
leverage declines in and .
From (7), we can solve for the bank’s stock of non-core liabilities .
= (1 + ) ( +)−
1 + − (1 + )(9)
Using the balance sheet identity = + + , we can also solve for
the bank’s loan supply function
() = +
1+·
1− 1+1+
· (10)
15

0
1/
LoanSupply
11
f
Loan rate r
rLS
f
DEf
f
111
)(1
Figure 8. Loan Supply ()
Note that the loan supply by the bank is increasing in and . Loan
supply is well-defined only when 1 + (1 + ). Loan supply goes to
infinity as the ratio (1 + ) (1 + ) approaches . Since the probability of
default is , the expected profit to the bank from one dollar’s worth of loans
is
(1− ) (1 + )− 1 (11)
Since the bank maximizes expected profit, its loan supply is zero if falls be-
low (1− ). Otherwise, it will supply the full amount of loans constrained
only by the VaR constraint (6). Figure 8 plots the loan supply curve of the
bank as a function of the loan interest rate . Note that the loan supply
is zero if (1− ), and goes to infinity as approaches the asymptote
((1 + ) )− 1 from below. We summarize our results as follows.
Proposition 1 Non-core funding is increasing in and decreasing in .
Corollary 2 Bank credit supply is increasing in and decreasing in .
16

Corollary 2 follows from the balance sheet identity = + + and
the fact that bank equity and deposit funding are fixed, so that total credit
and non-core funding move together.
Credit market clearing determines the equilibrium loan rate , and hence
the risk premium. Denoting loan demand as (), the equilibrium condi-
tion for the loan market is
() = +
1+·
1− 1+1+
· (12)
The market-clearing condition (12) determines the equilibrium loan rate
. Since the default probability of loans is , the risk premium in the credit
market is given by
≡ (1− ) (1 + )− 1 (13)
When is high, loan supply is high and hence the risk premium is low.
For fixed , the risk premium is monotonic in the lending rate , so that the
comparative statics of the risk premium inherit the comparative statics of
the total credit supply given by Corollary 2.
Proposition 3 The risk premium is low when is high. The risk pre-
mium increases when the funding rate increases, or when falls.
In a credit boom when the systematic risk factor is small, the measured
risks in the loan portfolio is low, implying that less equity is needed to meet
the bank’s Value-at-Risk constraint, allowing the bank to increase its lending
funded by an expansion in its wholesale funding . In Figure 6, a decrease in
implies the shrinkage of the size of the left tail of the density of repayments,
meaning that the bank can have a larger loan book for any given equity base
. Also, during a period of permissive funding conditions when the funding
rate is low, the bank can maintain a larger stock of non-core liabilities .
17

0
1/
EquilibriumCredit L
11
f
Loan rate r
11
f
AB
Decrease in N
NDE
rLS
rLD
Figure 9. Effect of rise in funding rate
However, after such a period of permissive financial conditions, risk pre-
miums are low and the sector is vulnerable to a shock that reverses the
permissive financial conditions. When eventually a shock arrives that either
increases , or when the funding rate increases due to an overall deterio-
ration of the wholesale funding market, there will be a sharp contraction in
the stock of wholesale funding and in overall lending. Figure 9 shows the
effect of a sharp increase in the funding rate . The increase in the funding
rate shifts up the loan supply curve of the bank. For any given loan demand
curve (), the shift upward in loan supply results in a sharp decrease in
credit and in the use of non-core liabilities .
In open emerging economies, a substantial fraction of the non-core liabil-
ities of the banks are foreign exchange-denominated liabilities, often short-
term. Therefore, a sharp reduction in will be associated with capital
outflows through the contraction of banking sector debt, and a depreciation
of the domestic currency.
18
3 Evidence from Panel Probit
3.1 Data Description and Methodology
The primary data source for our study is the IMF’s International Financial
Statistics (IFS) database, focusing on the banking sector indicators at the
country level. Although the country coverage of the IFS data is broad, the
range of variables that can serve as the empirical counterpart of our non-core
concept is somewhat limited. The IFS database lists 105 countries that have
measures of banking sector liabilities to the foreign sector, 60 countries with
liabilities of banks to non-bank financial sectors (with 50 that have both),
and only 14 countries that list bonds issued by banking institutions. We
also examine the difference M3 — M2 between two measures of broad money,
M3 and M2 (reported by 64 countries) in order to get another fix on non-core
liabilities of the banking sector.7 The sample period spans January 2000 to
December 2010. All variables are monthly except for the credit to GDP
ratio, which is annual. All missing values are replaced by using the linear
interpolation method.
As measures of core liabilities, we sum demand deposits (reported by
121 countries), time, savings and foreign currency deposits (120 countries)
and restricted deposits (80 countries). As an alternative, we use monetary
aggregates M1 (reported by 120 countries) and M2 (120 countries). Eurozone
countries do not report separate monetary aggregates and hence are excluded
here. Use of the M3 measure in our study also reduces our sample. For
instance, Korea does not figure in the regressions below, as it does not report
7Although the detailed breakdown of M2 and M3 categories differs across financial
systems, the US is a useful benchmark (although the Federal Reserve no longer reports
M3). For the US, the difference between M3 and M2 is given by large time deposits,
institutional money market mutual funds, and repurchase agreements. In this respect it
captures some aspects of wholesale bank funding.
19

M3 within IFS.
To investigate the predictive power of non-core bank liabilities for im-
pending financial crises, we use three definitions of crises - currency crises,
credit crises and stock market crises.
Currency crises are episodes where the value of the local currency drops
abruptly and substantially. Following Frankel and Rose (1996) we define a
currency crisis in terms of a currency depreciation of more than 25% in one
year, and where the depreciation is at least 10% more than the depreciation
in the previous year. That is
ln − ln −12 ≥ 025 (14)
(ln − ln −12)− (ln −12 − ln −24) ≥ 010 (15)
The second condition was introduced by Frankel and Rose (1996) to take
account of countries that undergo rapid but steady depreciation due to high
inflation.
The credit crisis definition captures episodes of sharply higher market
interest rates. Specifically, we use the money market interest rate, and define
a credit crisis as an episode where the money market rate reaches a level that
is in the top 3% tail of the pooled in-sample distribution. A more standard
measure of credit crisis would have been in terms of the spread between the
local risk-free rate and the local rate on private liabilities, but data limitations
due to the sample of countries examined in our study precludes the use of
this more standard (and desirable) measure. By analogy with our definition
of a credit crisis, we define a stock market crisis as an episode where the rate
of change in stock price index belongs to the bottom 3% tail of the pooled
in-sample distribution.
Our investigation complements that in Gourinchas and Obstfeld (2012),
who find that a rapid increase in leverage and a sharp real appreciation of
20

the currency emerge as being important in explaining crises. Our model
suggests that the common thread between currency crises and credit crises is
the procyclical behavior of the banking sector, and the implication for capital
flows, as mentioned at the outset. Banks are intermediaries who borrow in
order to lend, and they must raise funding in order to lend to their borrowers.
When credit is expanding rapidly, outstripping the pool of available domestic
deposits, the bank will turn to other sources of funding to support its credit
growth, typically from other banks operating as wholesale lenders in the
capital market. The link comes from the fact that the procyclical behavior of
banking that fuels the credit boom is financed through capital inflows via the
banking sector. When the cycle turns, the decline in credit is accompanied
by the “sudden stop” in capital flows and the associated collapse of the
currency. As we see below, the most consistently reliable indicator of the
vulnerability of both a currency crisis and a credit crisis turns out to be a
high level of bank liabilities to the foreign sector.
A stock market crisis will reflect the direct distress of banking sector
stocks, as well as the associated distress of firms whose access to credit is
impaired by the crisis. The sharp increase in credit spreads will also increase
the discount rate, pushing down stock prices. Thus we would expect a
close connection between all three measures of crises - currency crisis, credit
crisis and stock market crisis. We explore the connections in our empirical
investigation below.
Once the crisis month is identified, we define a crisis episode by following
the procedure used by Hausmann, Pritchett and Rodrik (2005)8, and assign
the dummy value of 1 to the ±6 month period centered on the month of acrisis. That is, when the crisis happens at date , the crisis dummy equals
8Hausmann, Pritchett and Rodrik (2005) used a probit model to identify factors in
growth accelerations.
21

to 1 at dates
− 6 − 5 · · · + 1 · · · + 6We drop data for the six months before and after the crisis period so as to
remove the ambiguity associated with the transition period when 1 or 0 may
not be clearly assigned. The comparison group is the group of the countries
that did not have a crisis in that same month.
By using a binary definition of crisis, we may be neglecting those episodes
where the financial system is under considerable stress, but just manages to
weather the storm. In order to capture such “near misses”, we also examine
alternative definitions of crises, such as the currency pressure index to be
introduced below.
Our definition of non-core bank liabilities follows the approach in Shin
and Shin (2010). Non-core bank liabilities will be classified (in the first
instance) broadly as claims on banks held by financial institutions and held
by foreign creditors. In principle, non-core bank liabilities should include
inter-bank liabilities, but data limitations for emerging economies prevent
us from using interbank liabilities in gross terms. We adopt two alternative
measures of non-core bank liabilities:
Non-core 1 = Liability of banks to the foreign sector
+ Liability of banks to the
non-banking financial sector (16)
Non-core 2 = Liability of banks to the foreign sector
+ (M3 — M2) (17)
Both measures of non-core bank liabilities include bank liabilities to the
foreign sector, which constitutes an important source of non-deposit whole-
sale funding for banks in emerging and developing economies. In addition
22

to foreign liabilities, non-core 1 adds bank liabilities to non-bank financial
institutions such as insurance companies and pension funds, and non-core 2
adds M3 — M2 as additional components of non-core liabilities.
In actual estimations of the probit models below, we use various ratios
of non-core to core. As a measure of core liabilities, we use three alternative
measures — M1, M2 and core deposits. Core deposits are obtained by sum-
ming demand deposits, time and savings deposits, foreign currency deposits,
and restricted deposits. Finally, to obtain the credit to GDP ratio, we use
deposit-taking banks’ claims on other residents as a measure of bank credit.
The appendix presents the full list of countries that experienced a cur-
rency crisis, credit crisis or stock market crisis as identified above, together
with the crisis dates. The appendix also reports which countries have data
on non-core bank liabilities and the credit to GDP ratio. 37 countries had
currency crises during our sample period, and several countries had two or
more currency crises according to our definition (Brazil, Colombia, Lesotho,
Mozambique, Namibia, South Africa, Swaziland, Turkey and Zambia). We
have18 countries that underwent credit crises in the sample period and 27
countries that underwent stock market crises.
Table 1 reports summary statistics for the monthly variables used in the
probit analysis. When non-core liability is defined as the sum of bank lia-
bilities to the foreign sector and non-bank financial sector (Non-core I), the
non-core liability is 70% of M1 and around 30% of M2 or core deposits. The
currency and credit crisis variables are dummy variables with a value of 1 for
the crisis period. Credit to GDP is an annual variable with a mean of 45%
in our sample.
23

Table 1. Summary Statistics. This table gives the summary statistics for the monthly
variables. Missing values are replaced by using a linear interpolation. The appendix
contains the list of crisis episodes studied in this paper.
Variable Obs Mean Std.Dev Min Max
Noncore1/M1 4228 0.70 0.92 0.00 9.13
Noncore1/M2 4239 0.27 0.46 0.00 5.10
Noncore1/Core 4510 0.22 0.24 0.00 1.80
Foreign/M1 6029 0.63 0.93 0.00 9.11
Foreign/M2 6040 0.31 0.52 0.00 5.09
Foreign/Core 6286 0.26 0.44 0.00 8.37
Nonbank/M1 4228 0.17 0.28 0.00 1.66
Nonbank/M2 4239 0.06 0.09 0.00 0.85
Nonbank/Core 4510 0.05 0.09 0.00 0.90
Noncore2/M1 4506 1.41 1.38 0.09 10.10
Noncore2/M2 4610 0.66 0.64 0.02 5.98
Noncore2/Core 4585 0.55 0.57 0.03 10.02
(M3-M2)/M1 4506 0.77 1.05 0.00 6.50
(M3-M2)/M2 4610 0.34 0.40 0.00 3.84
(M3-M2)/Core 4585 0.26 0.27 0.00 1.95
Exchange rate growth 6026 0.01 0.13 -0.54 0.86
Interest rate 3974 8.09 11.24 0.00 400.27
Currency crisis 5547 0.11 0.31 0.00 1.00
Credit crisis 3885 0.11 0.31 0.00 1.00
Stock market crisis 1796 0.27 0.44 0.00 1.00
24

3.2 Probit Estimation Results
We estimate panel probit models to investigate the linkage between our cri-
sis measures and the non-core bank liabilities constructed above. Under the
probit model, the inverse standard normal c.d.f. of the probability of crisis
is modeled as a linear function of the explanatory variables. We run sepa-
rate probit regressions for each crisis definition, and use the random effects
panel probit method to allow for country differences that persist over time.
As a robustness check, we also ran all regressions using the pooled probit
(no random effects) and the fixed effects logit method, and confirmed that
the results to be reported below are qualitatively unchanged.9 The panels
are estimated by maximum likelihood, where the explanatory variables are
detrended. In each probit regression, the binary outcome variable is the
crisis dummy variable for either the currency crisis or credit crisis. All the
regressors are lagged by six months in regressions with monthly data and by
one year in regressions with annual data.
3.2.1 Currency Crisis
Table 2 presents the random effects panel probit regression results for cur-
rency crises. As described above, we have two measures of noncore bank
liabilities — non-core 1 (using liabilities to financial institutions) and non-
core 2 (using M3 minus M2), and three proxies for core liabilities - M1, M2
and core deposits. Hence, we have six alternative ways of constructing the
ratio of non-core to core liabilities. In Table 2, all non-core liability ratios
9The fixed effects logit model has the advantage of being robust to potential correlation
between cross-section country heterogeneity and the error term, but we lose sample ob-
servations of countries that did not have a crisis (when the dependent variable is constant
at 0). The robustness of our results to the choice of regression method is a case in favor
of the random effects model used here. See Wooldridge (2010, ch.15) for a discussion of
relative advantages of probit and logit.
25

Table 2. Random Effects Panel Probit Regression for Currency Crisis: Monthly
Data for Non-Core Sum. The binary outcome variable is the currency crisis dummy.
Regressors are six months-lagged values of the noncore-core ratios. Standard errors are in
parentheses. Statistical significance at 10% ,5% and 1% level is denoted by *, ** and ***
respectively.
(1) (2) (3) (4) (5) (6)
Noncore1/M1 2.80***(0.24)
Noncore1/M2 4.17***
(0.50)Noncore1/Core 3.95***
(0.55)
Noncore2/M1 0.93***(0.09)
Noncore2/M2 1.44***(0.17)
Noncore2/Core 1.54***
(0.22)
Pseudo 2 0.15 0.10 0.04 0.07 0.05 0.05
Log-likelihood -638.93 -681.89 -766.36 -932.94 -952.67 -947.40
Observations 3,304 3,310 3,552 3,482 3,586 3,581
Countries 38 38 40 41 42 42
are 6 months-lagged and detrended, and we report coefficient estimates along
with standard errors in the parenthesis.
As can be seen in Table 2, for both non-core 1 and non-core 2 measures,
and regardless of the form of core liabilities, all the non-core liability ratios
have a positive and statistically significant coefficient at the 1% level. The
results indicate that an increase in the non-core bank liability ratio is associ-
ated with an increase in the predicted probability of having a currency crisis.
This finding is in line with the predictions from our theory section. Fluctu-
ations in the non-core to core liability ratio can be interpreted as reflecting
fluctuations in the changing degree of financial vulnerability to a crisis.
In Table 3, we present the panel probit regression results when we de-
compose the two non-core bank liability variables into their two respective
separate components. As before, we introduce the non-core components as
26
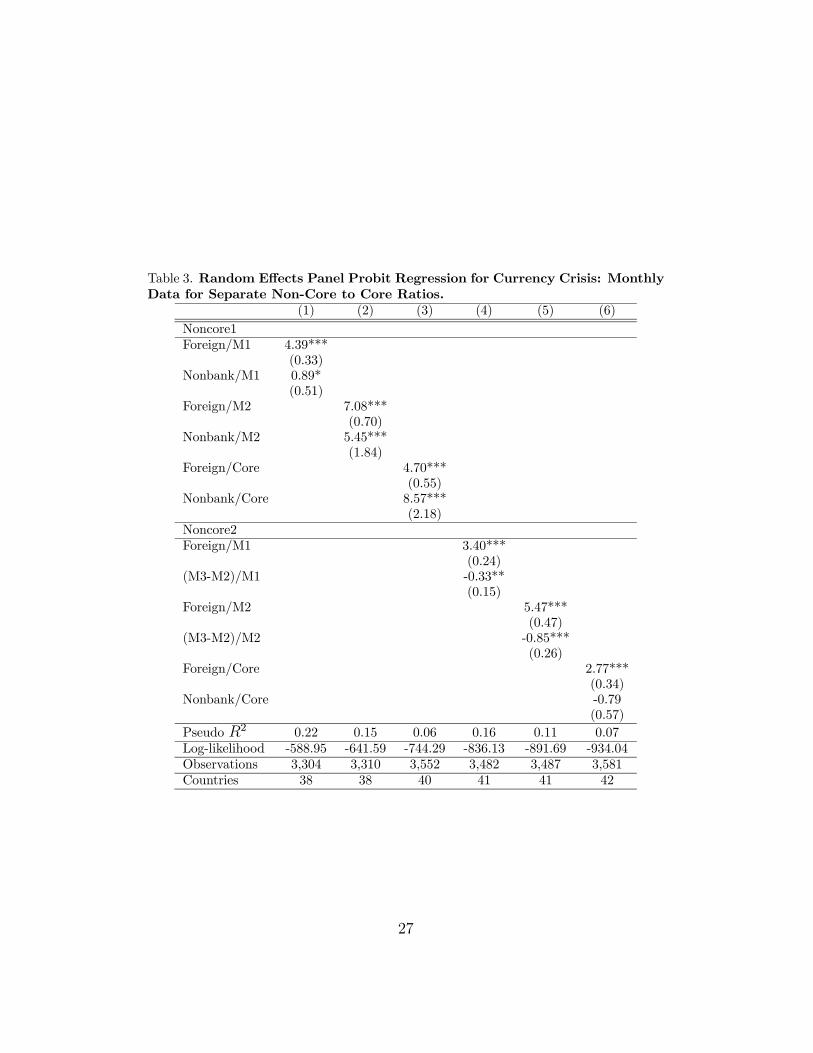
Table 3. Random Effects Panel Probit Regression for Currency Crisis: Monthly
Data for Separate Non-Core to Core Ratios.
(1) (2) (3) (4) (5) (6)
Noncore1
Foreign/M1 4.39***
(0.33)Nonbank/M1 0.89*
(0.51)Foreign/M2 7.08***
(0.70)
Nonbank/M2 5.45***(1.84)
Foreign/Core 4.70***
(0.55)Nonbank/Core 8.57***
(2.18)
Noncore2
Foreign/M1 3.40***
(0.24)(M3-M2)/M1 -0.33**
(0.15)
Foreign/M2 5.47***(0.47)
(M3-M2)/M2 -0.85***
(0.26)Foreign/Core 2.77***
(0.34)Nonbank/Core -0.79
(0.57)
Pseudo 2 0.22 0.15 0.06 0.16 0.11 0.07
Log-likelihood -588.95 -641.59 -744.29 -836.13 -891.69 -934.04
Observations 3,304 3,310 3,552 3,482 3,487 3,581
Countries 38 38 40 41 41 42
27
ratios of core liabilities.
The results reveal some insights on which components are relatively more
important. When we use non-core 1, both foreign and non-bank components
have a statistically significant positive effect. However, when we use non-core
2, only foreign liability terms are significantly positive. The coefficients on
M3 — M2 have the “wrong” sign, suggesting that the broad money aggregate
may not be capturing non-core liabilities. This suggests that foreign lia-
bilities play a more robust role as a predictor of currency crises in emerging
economies. Nonetheless, there seems to be an additional and independent role
of domestic non-core liabilities, although the non-core measure constructed
from traditional monetary aggregates have little explanatory power. Mone-
tary aggregates such as M2 and M3 are based on the legal form of the claim
rather than on who holds the claim. Shin and Shin (2010) propose that clas-
sification by holder is more important for how “sticky” the claim is, rather
than the legal form of the claim. Hahm, Mishkin, Shin and Shin (2010)
provide evidence for this claim from disaggregated Korean banking sector
data.
In Table 4, we check the robustness of our results by comparing our non-
core measures to the much better known credit to GDP ratio. Borio and
Lowe (2004) argued for the informativeness of credit aggregates in signalling
financial excesses that expose an economy to potential crises, and have given
prominence to the ratio of credit to GDP as an indicator. As the credit to
GDP ratio is available at an annual frequency only, we run annual regressions.
However, instead of re-identifying crisis episodes for annual data, we used the
crisis episodes identified in the monthly data. Namely, the year in which the
crisis occurs in the monthly data is identified as a crisis episode.
As can be seen in Table 4, we re-confirm the credit to GDP ratio as a
28

Table 4. Random Effects Panel Probit Regression for Currency Crisis: Annual
Data with Credit to GDP Ratio Included.
(1) (2) (3) (4) (5) (6)
Credit/GDP 9.77*** 21.29*** 21.23*** 13.44*** 19.18*** 13.62***
(2.28) (6.54) (6.64) (3.58) (5.64) (3.48)Noncore1/M2 2.91
(2.02)
Foreign/M2 3.34(2.27)
Nonbank/M2 3.35(4.98)
Noncore2/M2 2.40**
(1.11)Foreign/M2 14.06** 4.45**
(5.57) (1.84)(M3-M2)/M2 -2.57
(1.99)
Pseudo 2 0.08 0.21 0.21 0.14 0.19 0.16
Log-likelihood -129.06 -61.46 -61.10 -79.41 -74.48 -107.19
Observations 454 233 233 256 256 385
Countries 66 35 35 39 39 58
significant indicator of an impending currency crisis. In every regression,
it has a positive coefficient, and significant at the 1% level. Interestingly,
however, note how non-core ratios still retain significance even in the presence
of the credit to GDP ratio. In contrast with the monthly regressions above,
non-core 2 measures seem to fare better than non-core 1 ratios when the
credit to GDP ratio is included. This weak performance of non-core 1 may
reflect the potential positive correlation between the credit to GDP ratio and
the liability to non-bank financial institutions. The insignificant coefficient
estimates of non-core 1 ratios may have also resulted from the weak power
of test due to the loss of observations in the switch to annual data in these
regressions.
It is noteworthy that the significance of the non-core 2 ratio relies heavily
on foreign liabilities. We see this in the regression where we break out the
non-core measures into their respective components. In column (5) only
29
the foreign liability ratio remains significantly positive while the ratio using
the M3 — M2 measure is insignificant. The predictive power of foreign bank
liability ratio is again confirmed when it is included as the sole explanatory
variable alongside the credit to GDP ratio in column (6).
The empirical results in Table 4 suggest that, independently from the
credit to GDP ratio, the non-core liability ratio retains predictive power for
currency crises in emerging and developing economies. This predictive power
springs mainly from the foreign liabilities of banks, suggesting that liability
side measures of vulnerability retain additional explanatory value that is not
captured by the credit to GDP ratio.
The informativeness of liability side measures take on added significance
when considering the more timely and higher frequency nature of such mea-
sures. Credit to GDP ratios are available at an annual frequency in most
countries, while liability side aggregates are available more frequently, often
monthly and sometimes even weekly. For purposes of real time surveillance
exercises where timely identification of emerging vulnerabilities are impor-
tant, the liability side aggregates identified in our paper may be promising
as early warning indicators.
3.2.2 Credit Crisis
We now turn to consider credit crises. Credit crises are often associated with
currency crises (as part of a “twin crisis”), but credit crises have occurred
independently of currency crises, as is clear from the list of crisis episodes
listed in the appendix to our paper. As explained above, our definition of
credit crisis is constructed from the money market interest rate being in the
3% tail of the in-sample distribution. Tables 5 to 7 report the random effects
panel probit estimation results for credit crises. .
30
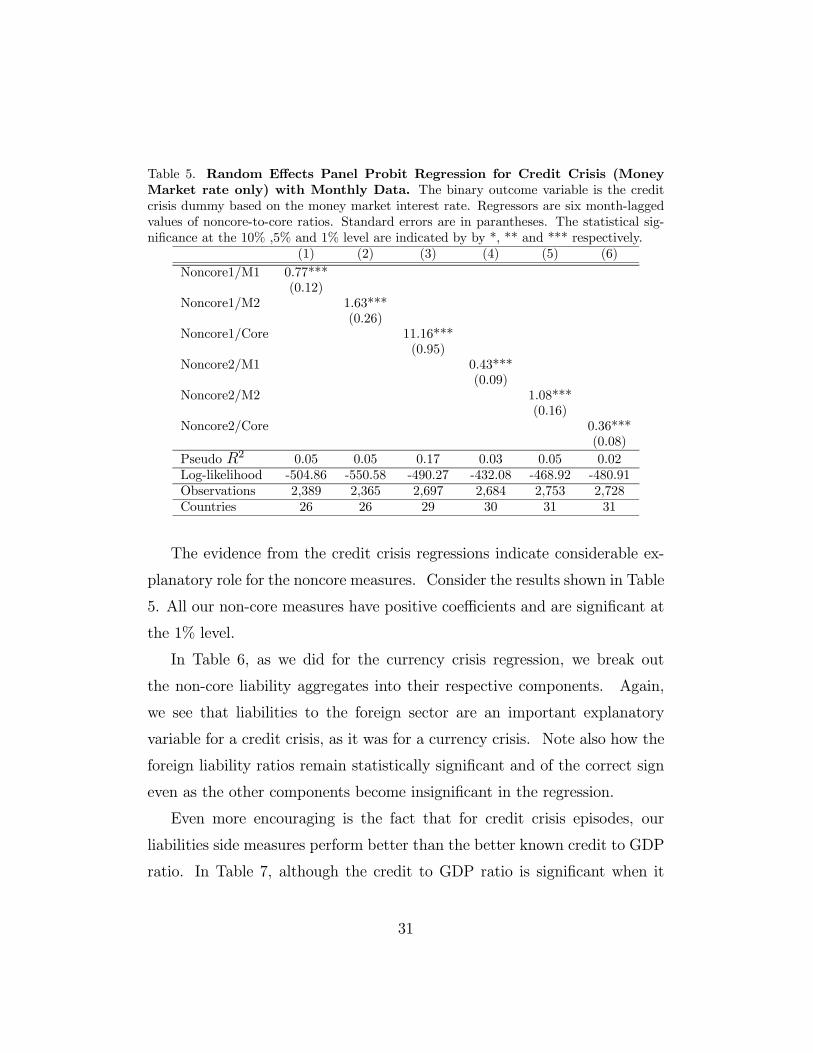
Table 5. Random Effects Panel Probit Regression for Credit Crisis (Money
Market rate only) with Monthly Data. The binary outcome variable is the credit
crisis dummy based on the money market interest rate. Regressors are six month-lagged
values of noncore-to-core ratios. Standard errors are in parantheses. The statistical sig-
nificance at the 10% ,5% and 1% level are indicated by by *, ** and *** respectively.
(1) (2) (3) (4) (5) (6)
Noncore1/M1 0.77***(0.12)
Noncore1/M2 1.63***
(0.26)Noncore1/Core 11.16***
(0.95)
Noncore2/M1 0.43***(0.09)
Noncore2/M2 1.08***(0.16)
Noncore2/Core 0.36***
(0.08)
Pseudo 2 0.05 0.05 0.17 0.03 0.05 0.02
Log-likelihood -504.86 -550.58 -490.27 -432.08 -468.92 -480.91
Observations 2,389 2,365 2,697 2,684 2,753 2,728
Countries 26 26 29 30 31 31
The evidence from the credit crisis regressions indicate considerable ex-
planatory role for the noncore measures. Consider the results shown in Table
5. All our non-core measures have positive coefficients and are significant at
the 1% level.
In Table 6, as we did for the currency crisis regression, we break out
the non-core liability aggregates into their respective components. Again,
we see that liabilities to the foreign sector are an important explanatory
variable for a credit crisis, as it was for a currency crisis. Note also how the
foreign liability ratios remain statistically significant and of the correct sign
even as the other components become insignificant in the regression.
Even more encouraging is the fact that for credit crisis episodes, our
liabilities side measures perform better than the better known credit to GDP
ratio. In Table 7, although the credit to GDP ratio is significant when it
31
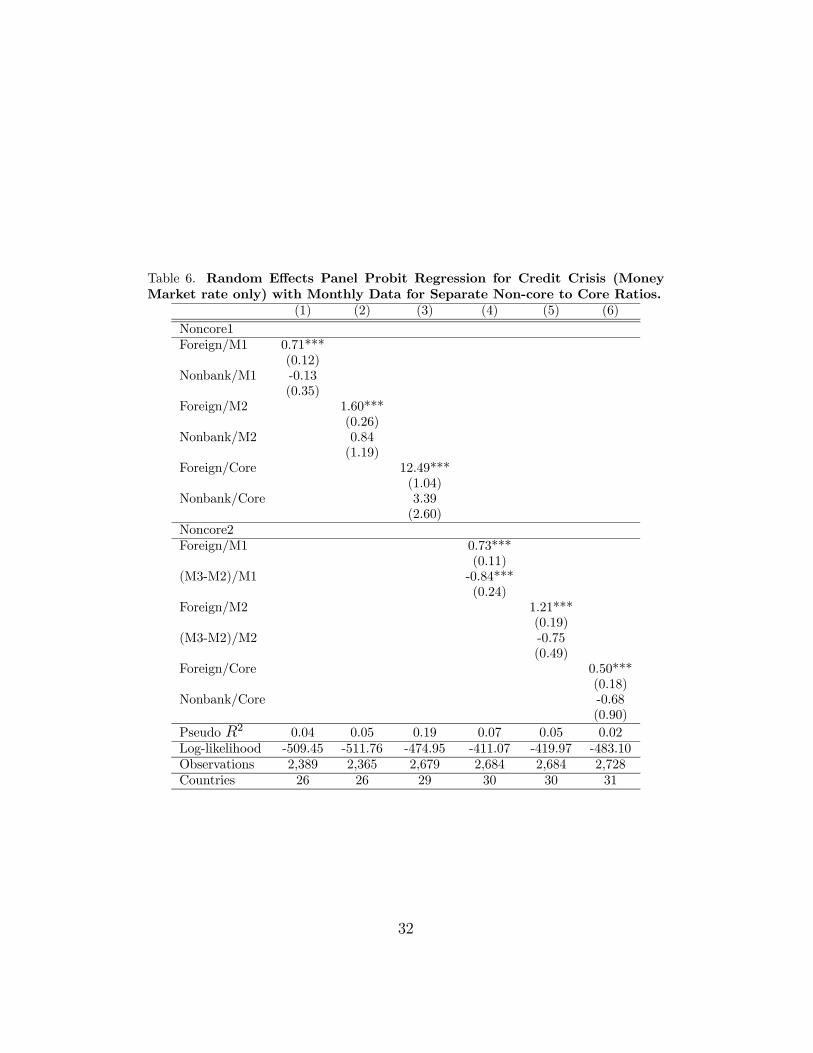
Table 6. Random Effects Panel Probit Regression for Credit Crisis (Money
Market rate only) with Monthly Data for Separate Non-core to Core Ratios.
(1) (2) (3) (4) (5) (6)
Noncore1
Foreign/M1 0.71***
(0.12)Nonbank/M1 -0.13
(0.35)Foreign/M2 1.60***
(0.26)
Nonbank/M2 0.84(1.19)
Foreign/Core 12.49***
(1.04)Nonbank/Core 3.39
(2.60)
Noncore2
Foreign/M1 0.73***
(0.11)(M3-M2)/M1 -0.84***
(0.24)
Foreign/M2 1.21***(0.19)
(M3-M2)/M2 -0.75
(0.49)Foreign/Core 0.50***
(0.18)Nonbank/Core -0.68
(0.90)
Pseudo 2 0.04 0.05 0.19 0.07 0.05 0.02
Log-likelihood -509.45 -511.76 -474.95 -411.07 -419.97 -483.10
Observations 2,389 2,365 2,679 2,684 2,684 2,728
Countries 26 26 29 30 30 31
32

Table 7. Random Effects Panel Probit Regression for Credit Crisis (Money
Market rate only): Annual Data with Credit to GDP Ratio Included.
(1) (2) (3) (4) (5) (6)
Credit/GDP 4.17** 6.73 6.80 2.50 1.93 1.48
(1.71) (4.55) (4.80) (2.41) (3.17) (2.28)Noncore1/M2 1.07
(1.21)
Foreign/M2 0.94(1.28)
Nonbank/M2 0.94(3.79)
Noncore2/M2 7.55***
(2.03)Foreign/M2 12.42*** 4.58***
(3.59) (1.57)(M3-M2)/M2 1.91
(2.65)
Pseudo 2 0.03 0.07 0.07 0.26 0.31 0.11
Log-likelihood -102.64 -48.31 -48.42 -38.29 -35.72 -86.91
Observations 488 165 165 216 216 412
Countries 62 25 25 31 31 55
enters as the sole explanatory variable, it is knocked out when our liabilities
side variables are introduced. In particular, in columns (4) to (6), the
non-core 2 ratio as well as the decomposed foreign liability ratio have a
positive coefficient that is significant at the 1% level, even though the credit
to GDP ratio becomes insignificant. These results confirm the intuition that
liabilities to the foreign sector have implications for distress in the domestic
financial market, also. By highlighting the explanatory role of banking sector
liabilities, we train the spotlight on the behavior of the banking sector in the
period preceding the crisis. Overall, these results for credit crises indicate
that the non-core liability ratio may have an independent and even superior
predictive power relative to measures of credit to GDP.
33
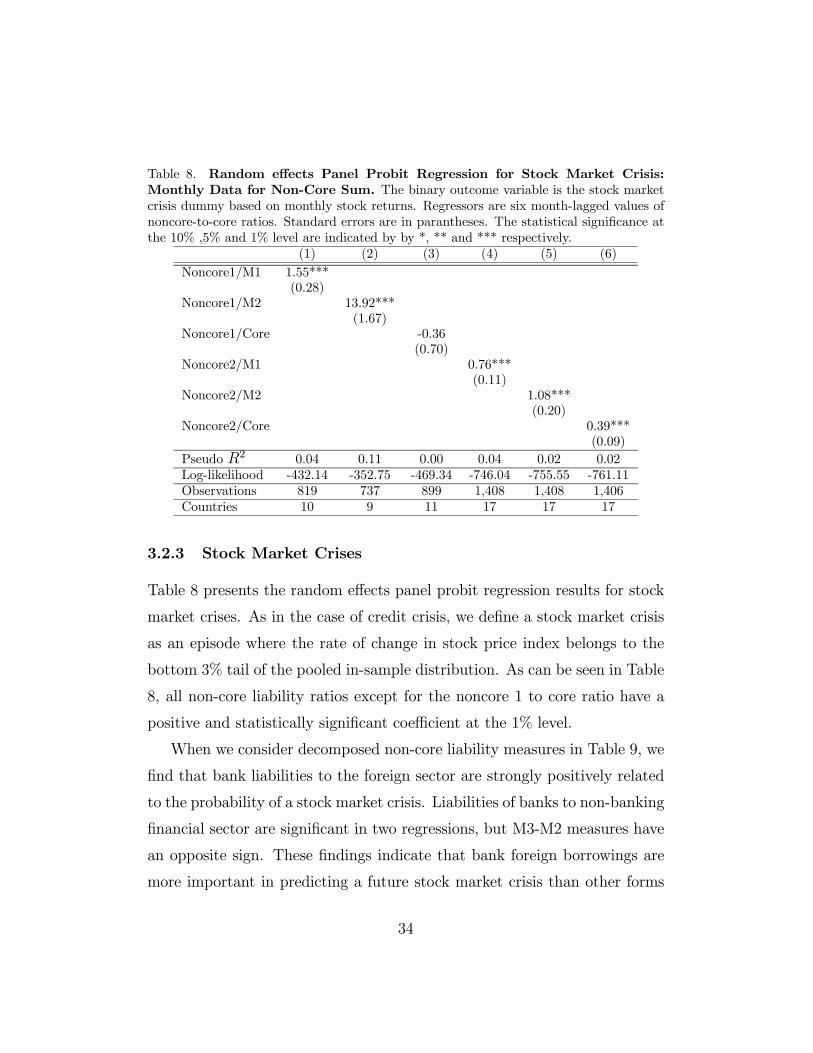
Table 8. Random effects Panel Probit Regression for Stock Market Crisis:
Monthly Data for Non-Core Sum. The binary outcome variable is the stock market
crisis dummy based on monthly stock returns. Regressors are six month-lagged values of
noncore-to-core ratios. Standard errors are in parantheses. The statistical significance at
the 10% ,5% and 1% level are indicated by by *, ** and *** respectively.
(1) (2) (3) (4) (5) (6)
Noncore1/M1 1.55***(0.28)
Noncore1/M2 13.92***
(1.67)Noncore1/Core -0.36
(0.70)
Noncore2/M1 0.76***(0.11)
Noncore2/M2 1.08***(0.20)
Noncore2/Core 0.39***
(0.09)
Pseudo 2 0.04 0.11 0.00 0.04 0.02 0.02
Log-likelihood -432.14 -352.75 -469.34 -746.04 -755.55 -761.11
Observations 819 737 899 1,408 1,408 1,406
Countries 10 9 11 17 17 17
3.2.3 Stock Market Crises
Table 8 presents the random effects panel probit regression results for stock
market crises. As in the case of credit crisis, we define a stock market crisis
as an episode where the rate of change in stock price index belongs to the
bottom 3% tail of the pooled in-sample distribution. As can be seen in Table
8, all non-core liability ratios except for the noncore 1 to core ratio have a
positive and statistically significant coefficient at the 1% level.
When we consider decomposed non-core liability measures in Table 9, we
find that bank liabilities to the foreign sector are strongly positively related
to the probability of a stock market crisis. Liabilities of banks to non-banking
financial sector are significant in two regressions, but M3-M2 measures have
an opposite sign. These findings indicate that bank foreign borrowings are
more important in predicting a future stock market crisis than other forms
34
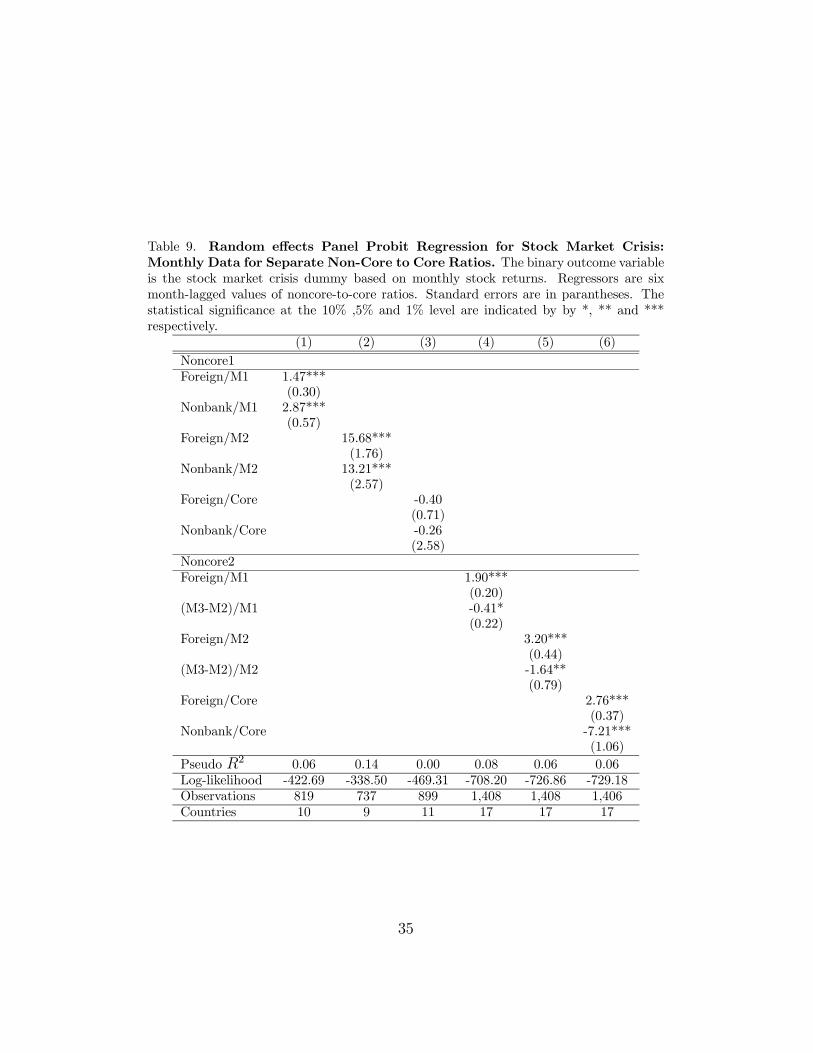
Table 9. Random effects Panel Probit Regression for Stock Market Crisis:
Monthly Data for Separate Non-Core to Core Ratios. The binary outcome variable
is the stock market crisis dummy based on monthly stock returns. Regressors are six
month-lagged values of noncore-to-core ratios. Standard errors are in parantheses. The
statistical significance at the 10% ,5% and 1% level are indicated by by *, ** and ***
respectively.
(1) (2) (3) (4) (5) (6)
Noncore1
Foreign/M1 1.47***(0.30)
Nonbank/M1 2.87***(0.57)
Foreign/M2 15.68***
(1.76)Nonbank/M2 13.21***
(2.57)Foreign/Core -0.40
(0.71)
Nonbank/Core -0.26(2.58)
Noncore2
Foreign/M1 1.90***(0.20)
(M3-M2)/M1 -0.41*
(0.22)Foreign/M2 3.20***
(0.44)(M3-M2)/M2 -1.64**
(0.79)
Foreign/Core 2.76***(0.37)
Nonbank/Core -7.21***(1.06)
Pseudo 2 0.06 0.14 0.00 0.08 0.06 0.06
Log-likelihood -422.69 -338.50 -469.31 -708.20 -726.86 -729.18
Observations 819 737 899 1,408 1,408 1,406
Countries 10 9 11 17 17 17
35
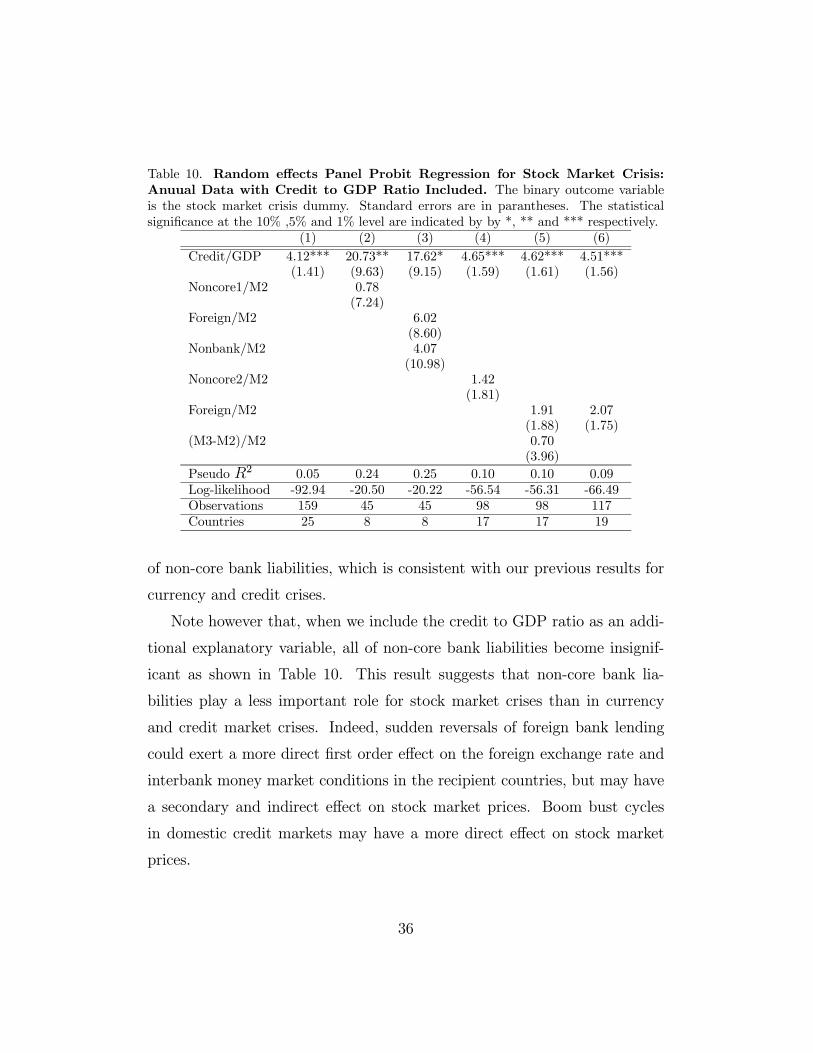
Table 10. Random effects Panel Probit Regression for Stock Market Crisis:
Anuual Data with Credit to GDP Ratio Included. The binary outcome variable
is the stock market crisis dummy. Standard errors are in parantheses. The statistical
significance at the 10% ,5% and 1% level are indicated by by *, ** and *** respectively.
(1) (2) (3) (4) (5) (6)
Credit/GDP 4.12*** 20.73** 17.62* 4.65*** 4.62*** 4.51***(1.41) (9.63) (9.15) (1.59) (1.61) (1.56)
Noncore1/M2 0.78(7.24)
Foreign/M2 6.02
(8.60)Nonbank/M2 4.07
(10.98)Noncore2/M2 1.42
(1.81)
Foreign/M2 1.91 2.07(1.88) (1.75)
(M3-M2)/M2 0.70
(3.96)
Pseudo 2 0.05 0.24 0.25 0.10 0.10 0.09
Log-likelihood -92.94 -20.50 -20.22 -56.54 -56.31 -66.49
Observations 159 45 45 98 98 117
Countries 25 8 8 17 17 19
of non-core bank liabilities, which is consistent with our previous results for
currency and credit crises.
Note however that, when we include the credit to GDP ratio as an addi-
tional explanatory variable, all of non-core bank liabilities become insignif-
icant as shown in Table 10. This result suggests that non-core bank lia-
bilities play a less important role for stock market crises than in currency
and credit market crises. Indeed, sudden reversals of foreign bank lending
could exert a more direct first order effect on the foreign exchange rate and
interbank money market conditions in the recipient countries, but may have
a secondary and indirect effect on stock market prices. Boom bust cycles
in domestic credit markets may have a more direct effect on stock market
prices.
36

4 Robustness Checks
We now proceed to extend our empirical investigation in three directions so as
to check the robustness of our findings. First, we re-examine our results when
we use quarterly data for GDP and credit for those countries where quarterly
data are available. As we show below, our results become sharper, with
greater statistical significance. Second, we introduce a number of control
variables to gauge the impact of global variables. Third, we examine a
number of alternative dependent variables for crises, taking account of the
currency pressures and other distress measures that may not be captured by
our binary variables for crises.
4.1 Analysis with Quarterly Credit to GDP Ratio
Using yearly data we have found that the non-core bank liability ratio, es-
pecially foreign borrowing of banks, has independent predictive power not
captured by the better known credit to GDP ratio, in both currency and
credit crisis regressions. For the subsample of countries for which quarterly
credit to GDP ratios can be obtained, we run the analogous panel probit
regressions for our three alternative measures of crises. Tables 11, 12 and 13
report the quarterly regression results for currency crisis, credit crisis, and
stock market crisis respectively. In the regressions, all explanatory variables
were lagged by one quarter.
Empirical results confirm our previous findings in that the non-core bank
liability measures turn out to be even more significant and fare better than
the better known credit to GDP ratio in both currency and credit crisis re-
gressions. For currency crisis, non-core bank liabilities have a significantly
positive coefficient in every regression even in the presence of the credit to
GDP ratio in Table 11, and non-core liabilities are in general a better predic-
37

Table 11. Random effects Panel Probit Regression for Currency Crisis: Quar-
terly Data with Credit to GDP Ratio Included. The binary dependent variable is
the currency crisis dummy. Regressors are one quarter-lagged values of noncore-to-core
ratios. We use quarterly data. Standard errors are in parentheses. Statistical significance
at 10%, 5% and 1% level is denoted by ∗, ∗∗ and ∗ ∗ ∗ respectively.(1) (2) (3) (4) (5) (6)
Credit/GDP -0.15 3.11*** 3.23*** 0.14 3.65*** 3.01***
(0.22) (0.89) (0.97) (0.29) (0.94) (0.71)Noncore1/M2 4.10**
(1.85)
Foreign/M2 8.90***(3.03)
Nonbank/M2 2.07
(3.88)Noncore2/M2 1.14***
(0.30)Foreign/M2 15.64*** 12.04***
(3.20) (2.41)
(M3-M2)/M2 -2.28**(0.93)
Pseudo 2 0.00 0.14 0.17 0.09 0.29 0.23
Log-likelihood -143.98 -97.50 -94.20 -97.14 -75.18 -96.78
Observations 914 598 598 492 460 659
Countries 30 22 22 18 17 24
38
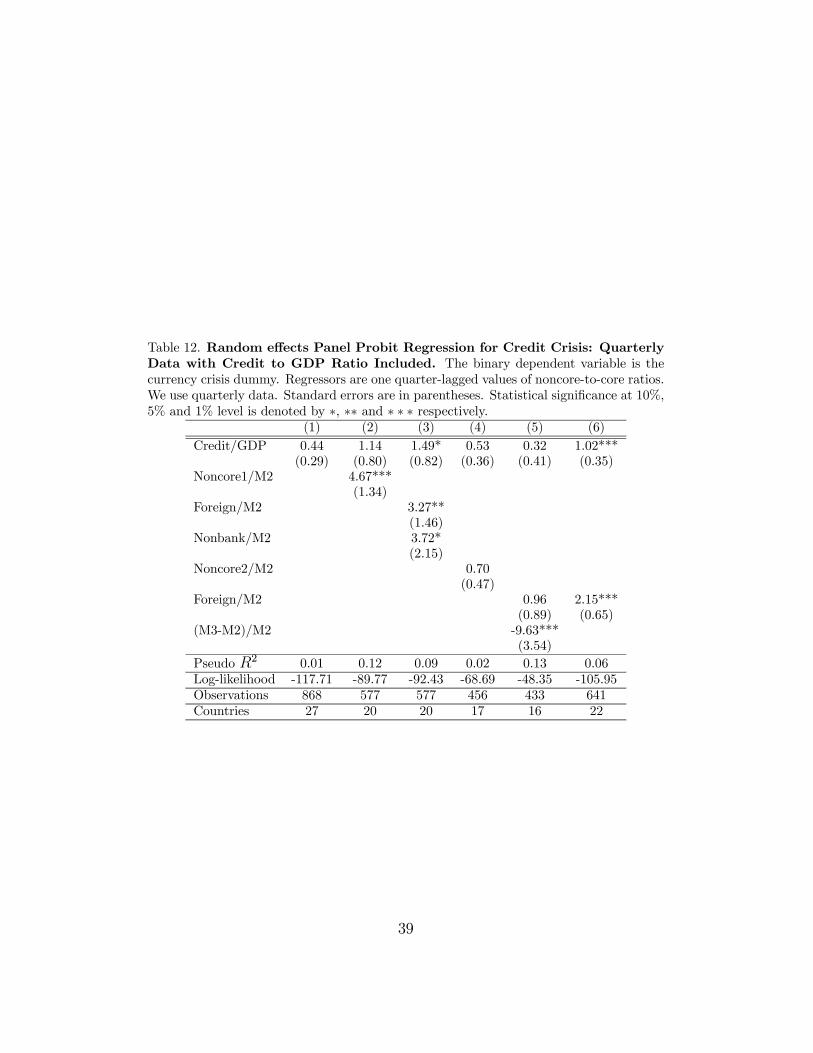
Table 12. Random effects Panel Probit Regression for Credit Crisis: Quarterly
Data with Credit to GDP Ratio Included. The binary dependent variable is the
currency crisis dummy. Regressors are one quarter-lagged values of noncore-to-core ratios.
We use quarterly data. Standard errors are in parentheses. Statistical significance at 10%,
5% and 1% level is denoted by ∗, ∗∗ and ∗ ∗ ∗ respectively.(1) (2) (3) (4) (5) (6)
Credit/GDP 0.44 1.14 1.49* 0.53 0.32 1.02***
(0.29) (0.80) (0.82) (0.36) (0.41) (0.35)Noncore1/M2 4.67***
(1.34)
Foreign/M2 3.27**(1.46)
Nonbank/M2 3.72*
(2.15)Noncore2/M2 0.70
(0.47)Foreign/M2 0.96 2.15***
(0.89) (0.65)
(M3-M2)/M2 -9.63***(3.54)
Pseudo 2 0.01 0.12 0.09 0.02 0.13 0.06
Log-likelihood -117.71 -89.77 -92.43 -68.69 -48.35 -105.95
Observations 868 577 577 456 433 641
Countries 27 20 20 17 16 22
39

Table 13. Random effects Panel Probit Regression for Stock Market Crisis:
Quarterly Data with Credit to GDP Ratio Included. The binary dependent vari-
able is the currency crisis dummy. Regressors are one quarter-lagged values of noncore-
to-core ratios. We use quarterly data. Standard errors are in parentheses. Statistical
significance at 10%, 5% and 1% level is denoted by ∗, ∗∗ and ∗ ∗ ∗ respectively.(1) (2) (3) (4) (5) (6)
Credit/GDP -0.81** 0.52 0.42 -0.82* -1.23 -0.95*(0.39) (1.17) (1.18) (0.43) (0.81) (0.57)
Noncore1/M2 3.98
(3.72)Foreign/M2 5.42
(3.69)
Nonbank/M2 0.35(6.23)
Noncore2/M2 0.29(0.34)
Foreign/M2 3.97 2.13*
(2.73) (1.17)(M3-M2)/M2 -1.87
(2.19)
Pseudo 2 0.03 0.01 0.03 0.08 0.17 0.11
Log-likelihood -102.98 -48.71 -48.18 -41.98 -38.02 -53.03
Observations 423 221 221 208 208 249
Countries 14 8 8 8 8 9
tor of a credit crisis as shown in Table 12. However, non-core bank liabilities
are not significant in stock market regressions in Table 13, which is consistent
with our findings above with monthly data.
4.2 Global Factors as Control Variables
We also investigate the robustness of our results by considering a set of
global factors as additional independent control variables. External condi-
tions, such as the stage of the global business cycle or global liquidity flows
may affect the volume of non-core bank liabilities as well as financial vulner-
ability of open emerging market countries. Commodity price shocks are also
an important factor that exerts a crucial impact on both capital and cur-
rent accounts in emerging market countries. Hence, we include world GDP
40
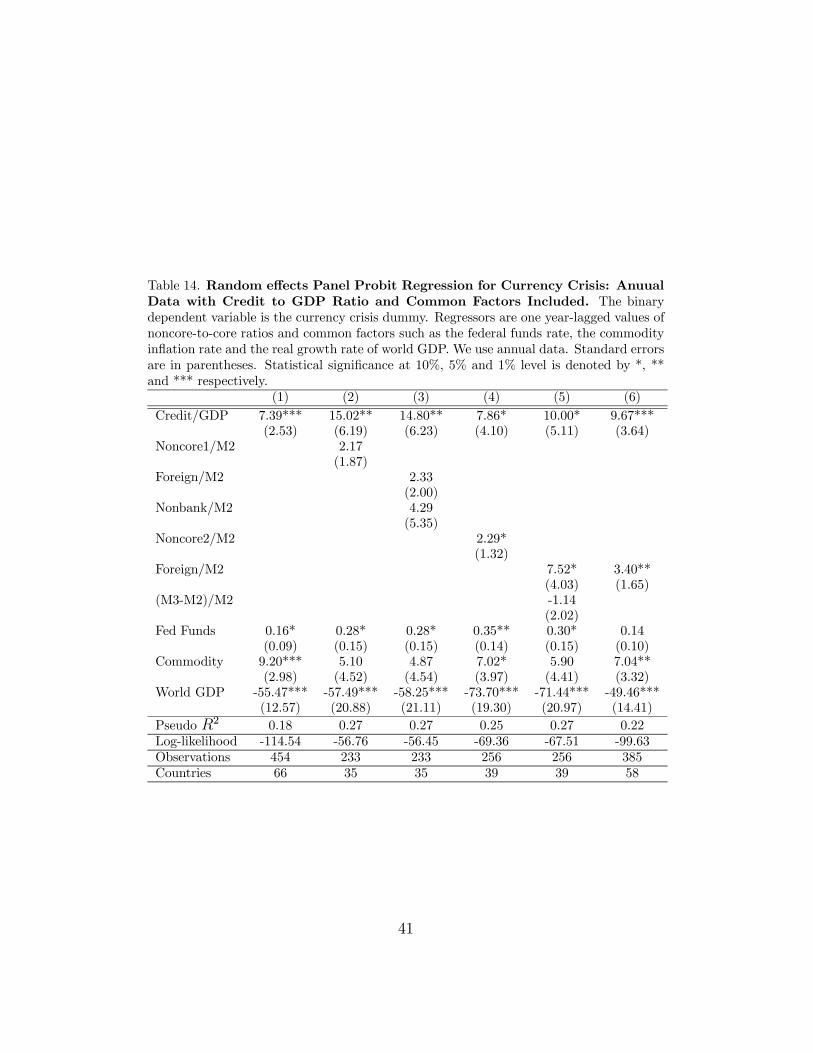
Table 14. Random effects Panel Probit Regression for Currency Crisis: Anuual
Data with Credit to GDP Ratio and Common Factors Included. The binary
dependent variable is the currency crisis dummy. Regressors are one year-lagged values of
noncore-to-core ratios and common factors such as the federal funds rate, the commodity
inflation rate and the real growth rate of world GDP. We use annual data. Standard errors
are in parentheses. Statistical significance at 10%, 5% and 1% level is denoted by *, **
and *** respectively.
(1) (2) (3) (4) (5) (6)
Credit/GDP 7.39*** 15.02** 14.80** 7.86* 10.00* 9.67***(2.53) (6.19) (6.23) (4.10) (5.11) (3.64)
Noncore1/M2 2.17
(1.87)Foreign/M2 2.33
(2.00)Nonbank/M2 4.29
(5.35)
Noncore2/M2 2.29*(1.32)
Foreign/M2 7.52* 3.40**(4.03) (1.65)
(M3-M2)/M2 -1.14
(2.02)Fed Funds 0.16* 0.28* 0.28* 0.35** 0.30* 0.14
(0.09) (0.15) (0.15) (0.14) (0.15) (0.10)Commodity 9.20*** 5.10 4.87 7.02* 5.90 7.04**
(2.98) (4.52) (4.54) (3.97) (4.41) (3.32)
World GDP -55.47*** -57.49*** -58.25*** -73.70*** -71.44*** -49.46***(12.57) (20.88) (21.11) (19.30) (20.97) (14.41)
Pseudo 2 0.18 0.27 0.27 0.25 0.27 0.22
Log-likelihood -114.54 -56.76 -56.45 -69.36 -67.51 -99.63
Observations 454 233 233 256 256 385
Countries 66 35 35 39 39 58
41

Table 15. Random effects Panel Probit Regression for Credit Crisis: Anuual
Data with Credit to GDP Ratio and Common Factors Included. The binary
dependent variable is the currency crisis dummy. Regressors are one year-lagged values of
noncore-to-core ratios and common factors such as the federal funds rate, the commodity
inflation rate and the real growth rate of world GDP. We use annual data. Standard errors
are in parentheses. Statistical significance at 10%, 5% and 1% level is denoted by *, **
and *** respectively.
(1) (2) (3) (4) (5) (6)
Credit/GDP 1.62 16.43* 12.72 -1.42 -4.88 -1.75
(2.71) (9.84) (10.10) (5.22) (8.08) (5.97)
Noncore1/M2 3.68(3.33)
Foreign/M2 9.20(6.56)
Nonbank/M2 -1.54
(7.06)Noncore2/M2 9.22***
(3.08)Foreign/M2 16.94*** 14.07***
(6.28) (4.33)
(M3-M2)/M2 2.62(3.97)
Fed Funds 0.17 -0.07 -0.14 0.05 0.10 0.17
(0.14) (0.23) (0.24) (0.21) (0.24) (0.18)Commodity -9.09** -17.19** -18.41** -8.00 -11.11 -15.42**
(4.58) (7.74) (7.93) (6.76) (7.27) (6.23)World GDP -73.57*** -18.26 -4.11 -61.06* -51.83 -51.21*
(23.36) (38.15) (40.94) (32.28) (34.86) (27.77)
Pseudo 2 0.17 0.28 0.30 0.35 0.39 0.33
Log-likelihood -68.99 -33.64 -32.95 -30.24 -28.28 -54.19
Observations 432 156 156 199 199 375
Countries 62 25 25 31 31 55
growth rate, change in commodity price index, and the US Fed Fund target
rate as global factor variables in addition to the credit to GDP ratio. We
run yearly regressions as the world GDP growth rate is available only at an-
nual frequency. To avoid a potential endogeneity problem, the global factor
variables were also lagged by one year.
Tables 14, 15 and 16 report the regression results for currency crisis, credit
crisis, and stock market crisis respectively. As can be seen in Table 14, for
42

Table 16. Random effects Panel Probit Regression for Stock Market Crisis:
Anuual Data with Credit to GDP Ratio and Common Factors Included. The
binary dependent variable is the currency crisis dummy. Regressors are one year-lagged
values of noncore-to-core ratios and common factors such as the federal funds rate, the
commodity inflation rate and the real growth rate of world GDP. We use annual data.
Standard errors are in parentheses. Statistical significance at 10%, 5% and 1% level is
denoted by *, ** and *** respectively.
(1) (2) (3) (4) (5) (6)
Credit/GDP 6.97* 16.73 50.80 13.56* 15.96* 16.56**
(3.98) (16.89) (88.44) (7.68) (8.15) (7.05)
Noncore1/M2 1.15(10.20)
Foreign/M2 223.92***(79.74)
Nonbank/M2 -226.45**
(102.94)Noncore2/M2 2.86
(3.13)Foreign/M2 1.78 1.87
(2.94) (2.64)
(M3-M2)/M2 16.87*(8.44)
Fed Funds 0.72*** 0.47 4.31* 0.64** 0.83** 0.45**
(0.17) (0.33) (2.37) (0.27) (0.34) (0.20)Commodity 33.05*** 27.27 163.33 35.69*** 39.14*** 31.08***
(8.96) (21.94) (134.52) (13.64) (15.13) (11.06)World GDP -24.59 10.77 807.18 -10.76 -22.08 5.47
(19.61) (53.23) (525.01) (30.18) (34.21) (25.63)
Pseudo 2 0.45 0.50 0.46 0.47 0.38 0.39
Log-likelihood -34.95 -26.64 -28.94 -12.11 -14.20 -51.55
Observations 139 42 42 87 87 103
Countries 25 8 8 8 17 17
currency crisis, non-core bank liability measures seem to be less significant
in the presence of both credit to GDP ratio and global factor variables. Note
however that foreign liabilities seem to remain significant. Note also that
the world GDP growth rate has a significantly negative coefficient in all
regressions, which indicates that downturns in global business cycle lead to
higher probabilities of a currency crisis in emerging market economies.
Table 15 shows regression results for credit crisis. Interestingly, non-
43
core bank liability measures seem to fare better than the credit to GDP
ratio even in the presence of global factor variables. Note that a fall in
commodity prices tends to raise the probability of a credit crisis. Table 16
reports results for stock market crisis. Again non-core bank liabilities seem
to have less information as a predictor of a future crisis in the case of stock
market prices. It is also interesting that the US fed fund rate is positively
associated with the probability of a stock market crisis, which may be due
to reversals in portfolio investment flows in response to higher US interest
rates.
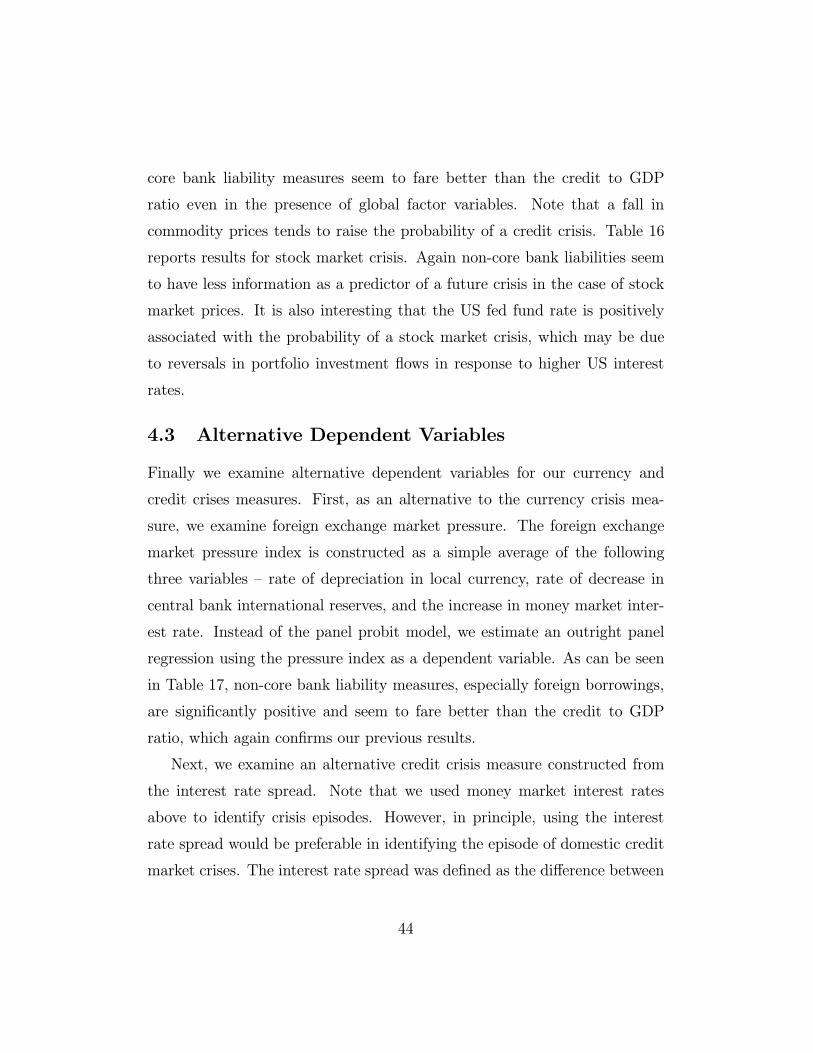
4.3 Alternative Dependent Variables
Finally we examine alternative dependent variables for our currency and
credit crises measures. First, as an alternative to the currency crisis mea-
sure, we examine foreign exchange market pressure. The foreign exchange
market pressure index is constructed as a simple average of the following
three variables — rate of depreciation in local currency, rate of decrease in
central bank international reserves, and the increase in money market inter-
est rate. Instead of the panel probit model, we estimate an outright panel
regression using the pressure index as a dependent variable. As can be seen
in Table 17, non-core bank liability measures, especially foreign borrowings,
are significantly positive and seem to fare better than the credit to GDP
ratio, which again confirms our previous results.
Next, we examine an alternative credit crisis measure constructed from
the interest rate spread. Note that we used money market interest rates
above to identify crisis episodes. However, in principle, using the interest
rate spread would be preferable in identifying the episode of domestic credit
market crises. The interest rate spread was defined as the difference between
44
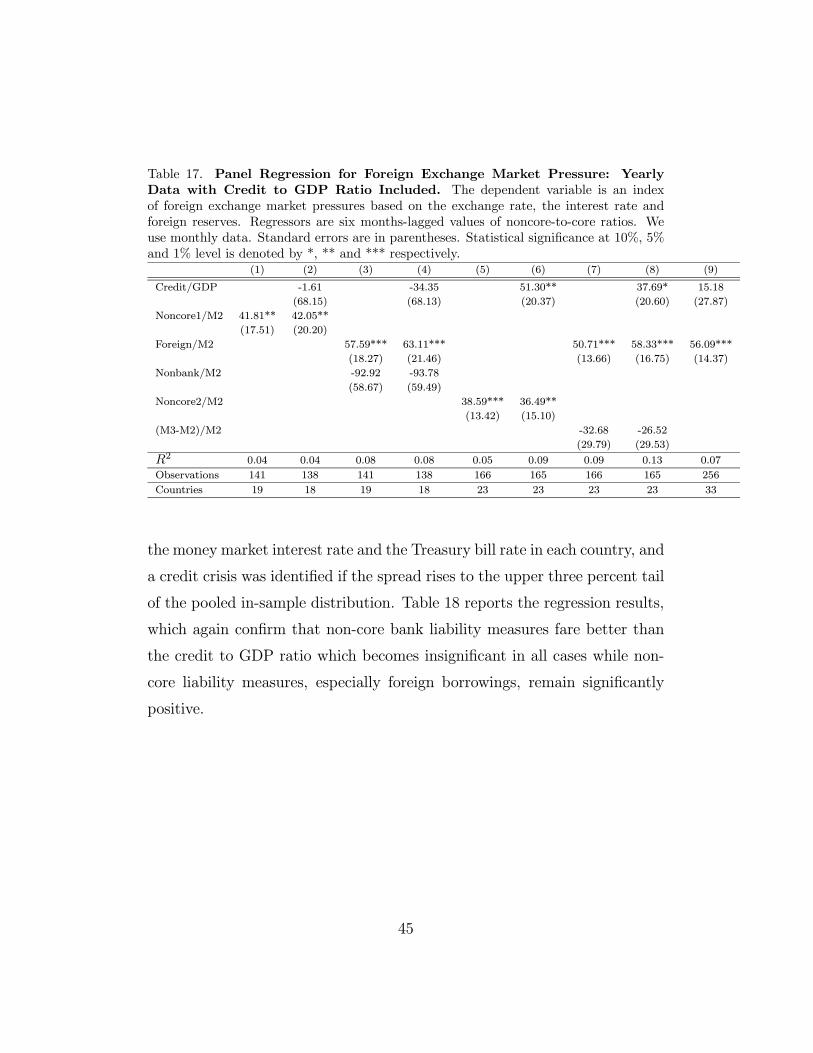
Table 17. Panel Regression for Foreign Exchange Market Pressure: Yearly
Data with Credit to GDP Ratio Included. The dependent variable is an index
of foreign exchange market pressures based on the exchange rate, the interest rate and
foreign reserves. Regressors are six months-lagged values of noncore-to-core ratios. We
use monthly data. Standard errors are in parentheses. Statistical significance at 10%, 5%
and 1% level is denoted by *, ** and *** respectively.(1) (2) (3) (4) (5) (6) (7) (8) (9)
Credit/GDP -1.61 -34.35 51.30** 37.69* 15.18
(68.15) (68.13) (20.37) (20.60) (27.87)
Noncore1/M2 41.81** 42.05**
(17.51) (20.20)
Foreign/M2 57.59*** 63.11*** 50.71*** 58.33*** 56.09***
(18.27) (21.46) (13.66) (16.75) (14.37)
Nonbank/M2 -92.92 -93.78
(58.67) (59.49)
Noncore2/M2 38.59*** 36.49**
(13.42) (15.10)
(M3-M2)/M2 -32.68 -26.52
(29.79) (29.53)
2 0.04 0.04 0.08 0.08 0.05 0.09 0.09 0.13 0.07
Observations 141 138 141 138 166 165 166 165 256
Countries 19 18 19 18 23 23 23 23 33
the money market interest rate and the Treasury bill rate in each country, and
a credit crisis was identified if the spread rises to the upper three percent tail
of the pooled in-sample distribution. Table 18 reports the regression results,
which again confirm that non-core bank liability measures fare better than
the credit to GDP ratio which becomes insignificant in all cases while non-
core liability measures, especially foreign borrowings, remain significantly
positive.
45
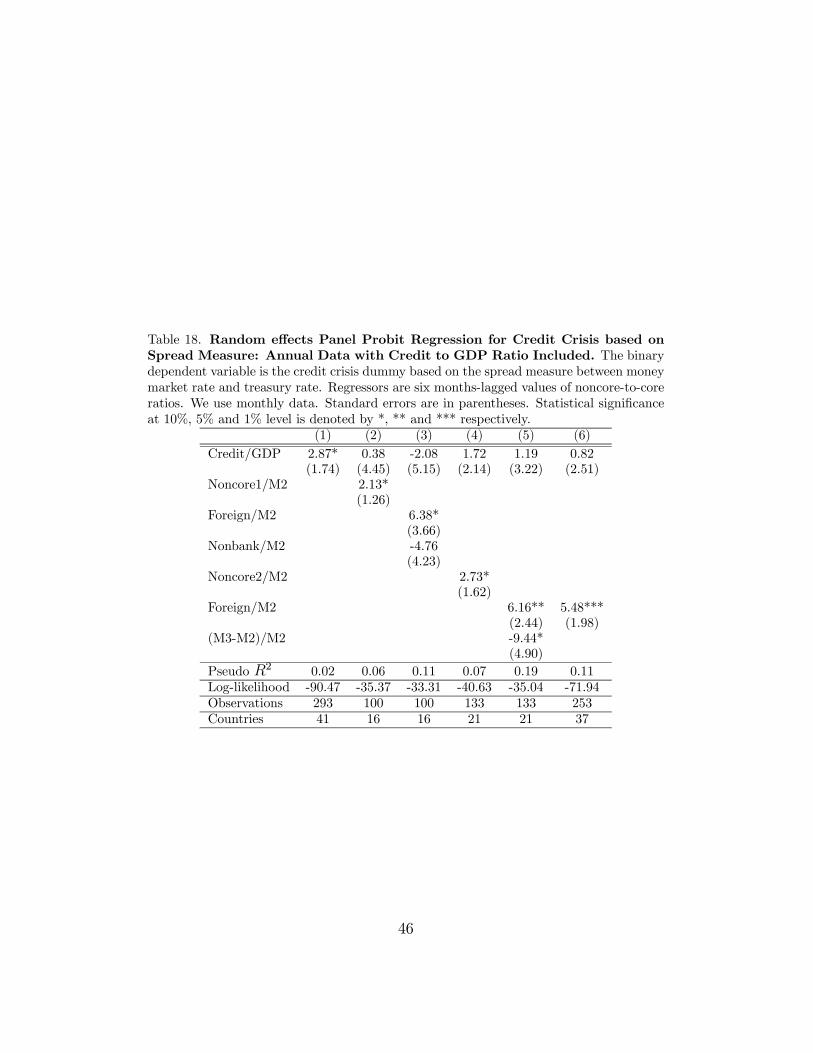
Table 18. Random effects Panel Probit Regression for Credit Crisis based on
Spread Measure: Annual Data with Credit to GDP Ratio Included. The binary
dependent variable is the credit crisis dummy based on the spread measure between money
market rate and treasury rate. Regressors are six months-lagged values of noncore-to-core
ratios. We use monthly data. Standard errors are in parentheses. Statistical significance
at 10%, 5% and 1% level is denoted by *, ** and *** respectively.
(1) (2) (3) (4) (5) (6)
Credit/GDP 2.87* 0.38 -2.08 1.72 1.19 0.82(1.74) (4.45) (5.15) (2.14) (3.22) (2.51)
Noncore1/M2 2.13*
(1.26)Foreign/M2 6.38*
(3.66)
Nonbank/M2 -4.76(4.23)
Noncore2/M2 2.73*(1.62)
Foreign/M2 6.16** 5.48***
(2.44) (1.98)(M3-M2)/M2 -9.44*
(4.90)
Pseudo 2 0.02 0.06 0.11 0.07 0.19 0.11
Log-likelihood -90.47 -35.37 -33.31 -40.63 -35.04 -71.94
Observations 293 100 100 133 133 253
Countries 41 16 16 21 21 37
46
5 Summary and Concluding Remarks
Our empirical results paint a remarkably consistent picture across all the
regressions (both binary and standard panel regressions) and can be summa-
rized as follows.
First, our measures of the non-core bank liability ratio has significant
predictive power for currency crises and credit crises. The predictive power
of non-core liabilities seem to be weakest for stock market crises, although
even here, there is some empirical support for the usefulness of non-core
liabilities as a predictive variable..
Second, most of the predictive power of the non-core liability ratio stems
from the information contained in the banking sector’s liabilities to the for-
eign sector.
Third, the non-core bank liability ratio has independent predictive power
over the much better-known and debated credit to GDP ratio. Moreover,
the non-core liability ratio remains significant in the presence of the credit to
GDP ratio and other control variables in the regressions, and the non-core
liability ratio seems to fare better than the credit to GDP ratio in the key
crisis regressions.
Taken together, the empirical evidence strongly suggests that non-core
liability measures contain considerable information value for financial vulner-
ability, and provides an additional support for the “excess elasticity” hypoth-
esis of Borio and Disyatat (2011), as formalized in our theory section. Our
findings suggest that, at least in emerging and developing economies, non-
core bank liabilities may be usefully monitored as a complementary measure
to the credit to GDP ratio in gauging the stage of financial cycles and the
build up of financial risk.
The discussion in our paper serves to focus attention on the banking sector
47

and its role in the fluctuations in financial conditions. Through its pivotal
role in the determination of risk premiums and overall financial conditions,
the banking sector can be seen to lie at the heart of issues of financial stability.
Our discussion has focused mainly on the theoretical underpinnings of
the possible information value of non-core banking sector liabilities and their
empirical properties in forecasting crisis episodes. Although much more work
is necessary in refining the results, there are some lessons for the broader
application of balance sheet aggregates in questions of financial regulation
and the mitigation of financial vulnerability.
Our empirical result that non-core liability aggregates perform at least
as well as the credit to GDP ratio (and sometimes much better) has far-
reaching implications for the choice of aggregate measures to be used in
surveillance and regulatory frameworks. As part of the Basel III overhaul
of bank regulation, the Basel Committee on Banking Supervision (BCBS)
has agreed on a countercyclical capital buffer. In operational terms, the
countercyclical buffer will make use of the credit to GDP ratio as the indicator
of procyclicality that triggers increased capital requirements on banks (BCBS
2010). However, as seen in our results above, the simple credit to GDP ratio
may be a somewhat coarse indicator, as well as being available only at a low
frequency.
One of the main reasons for the lack of universal support for the cycli-
cal capital surcharge under Basel III has been the concern that the simple
credit to GDP aggregate may be too noisy in capturing finer institutional de-
tails that are relevant when considering harmonized international standards
for bank capital regulation. Our results concerning the informativeness of
liabilities side measures raise the prospect of having possibly more finely
distinguished measures of financial vulnerability that tie up better with the
48
underlying cyclical trends in the banking sector. Further research will be
illuminating in shedding more light on these questions.
49

References
Adrian, Tobias and Hyun Song Shin (2008) “Procyclical Leverage and Value-
at-Risk” Federal Reserve Bank of New York Staff Report 338,
http://www.newyorkfed.org/research/staff reports/sr338.html
Adrian, Tobias and Hyun Song Shin (2010) “Liquidity and Leverage,” Jour-
nal of Financial Intermediation, 19, 418-437
Basel Committee on Banking Supervision (2005) “International Convergence
of Capital Measurement and Capital Standards: A Revised Framework”,
Bank for International Settlements, November 2005
http://www.bis.org/publ/bcbs118.pdf
Basel Committee on Banking Supervision (2010), ”Guidance for National
Authorities Operating the Countercyclical Capital Buffer,” BIS, December.
Berg, Andrew and Catherine Pattillo (1999) “Predicting Currency Crises:
The Indicator Approach and an Alternative” Journal of International Money
and Finance, 18, 561 - 586
Borio, Claudio and Piti Disyatat (2011) “Global imbalances and the financial
crisis: Link or no link?” BIS Working Papers 346
http://www.bis.org/publ/work346.pdf
Borio, Claudio and Philip Lowe (2004), ”Securing Sustainable Price Stabil-
ity: Should Credit Come Back From the Wilderness?” BIS Working Paper,
No.157.
Bruno, Valentina and Hyun Song Shin (2011) “Capital Flows, Cross-Border
Banking and Global Liquidity” working paper.
Claessens, Stijn, Giovanni Dell’Ariccia, Deniz Igan and Luc Laeven (2010)
“Cross-Country Experiences and Policy Implications from the Global Finan-
cial Crisis” Economic Policy, 62, 267-293
Frankel, Jeffrey, and Andrew Rose (1996), ”Currency Crashes in Emerging
Markets: An Empirical Treatment,” Journal of International Economics,
Vol. 41, pp.351-66.
50

Frankel, Jeffrey, and George Saravelos (2010) “Are Leading Indicators of
Financial Crises Useful for Assessing Country Vulnerability?” NBER working
paper No. 16047
Goldstein, Morris, Kaminsky, Graciela, and Carmen Reinhart (2000), Assess-
ing Financial Vulnerability: An Early Warning System for Emerging Mar-
kets, Institute for International Economics, Washington DC.
Gourinchas, Pierre-Olivier and Maurice Obstfeld (2012) ”Stories of the Twen-
tieth Century for the Twenty-First,” American Economic Journal: Macroe-
conomics, 4(1), 226-65.
Hahm, Joon-Ho, Mishkin, Frederic S., Shin, Hyun Song and Kwanho Shin
(2010), ”Macroprudential Policies in Open Emerging Economies,” paper pre-
pared for the Bank of Korea.
Kaminsky, Graciela, and Carmen Reinhart (1999), “The Twin Crises: The
Causes of Banking and Balance of Payments Problems,” American Economic
Review, Vol. 89, No. 3, pp. 473-500.
Lane, Philip R. and Gian Maria Milesi-Ferretti (2010) “The Cross-Country
Incidence of the Global Crisis”, working paper
Rose, Andrew and Mark Spiegel (2008), “Cross-Country Causes and Con-
sequences of the 2008 Crisis: Early Warning,” NBER working paper 15357,
forthcoming in Global Journal of Economics
Rose, Andrew and Mark Spiegel (2010) “The Causes and Consequences of
the 2008 Crisis: An Update”, forthcoming in the European Economic Review,
2011.
Shin, Hyun Song and Kwanho Shin (2010), “Procyclicality and Monetary
Aggregates,” NBER working paper 16836
http://www.nber.org/papers/w16836
Vasicek, Oldrich (2002) “The Distribution of Loan Portfolio Value” Risk,
December 2002,
http://www.moodyskmv.com/conf04/pdf/papers/dist loan port val.pdf
Wooldridge, Jeffrey M. (2010) Econometric Analysis of Cross Section and
Panel Data, second edition, MIT Press, Cambridge, MA.
51
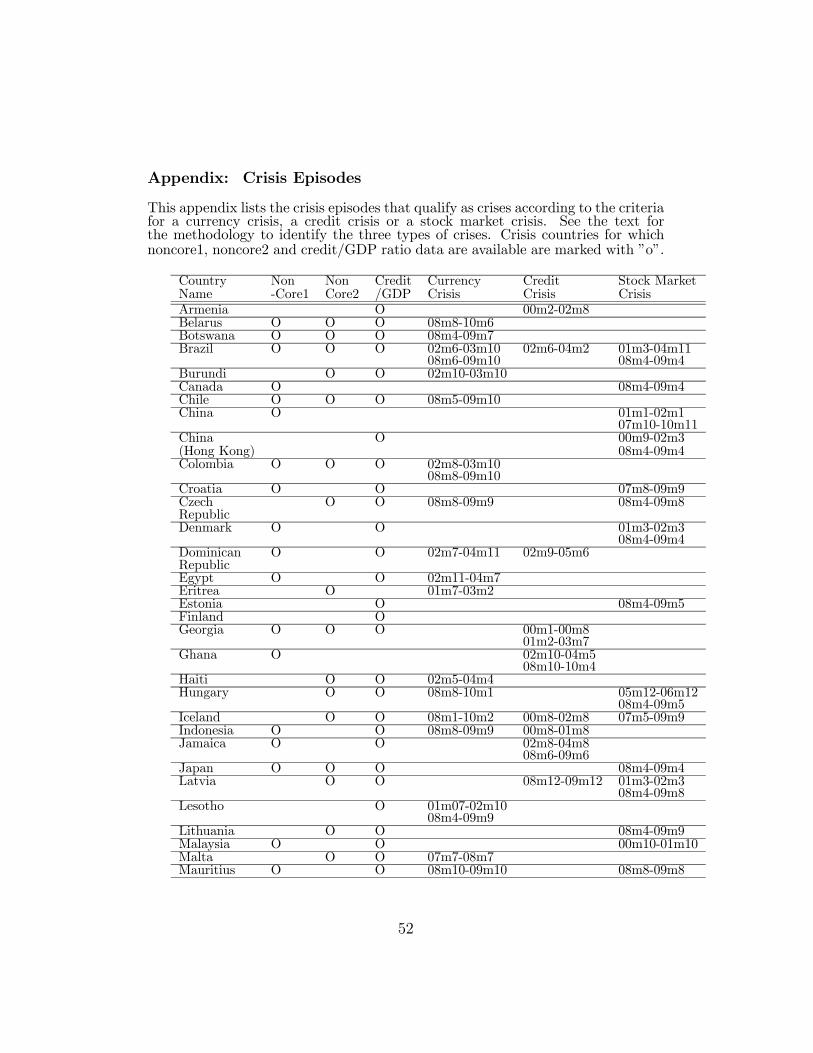
Appendix: Crisis Episodes
This appendix lists the crisis episodes that qualify as crises according to the criteriafor a currency crisis, a credit crisis or a stock market crisis. See the text forthe methodology to identify the three types of crises. Crisis countries for whichnoncore1, noncore2 and credit/GDP ratio data are available are marked with ”o”.
Country Non Non Credit Currency Credit Stock MarketName -Core1 Core2 /GDP Crisis Crisis Crisis
Armenia O 00m2-02m8Belarus O O O 08m8-10m6Botswana O O O 08m4-09m7Brazil O O O 02m6-03m10 02m6-04m2 01m3-04m11
08m6-09m10 08m4-09m4Burundi O O 02m10-03m10Canada O 08m4-09m4Chile O O O 08m5-09m10China O 01m1-02m1
07m10-10m11China O 00m9-02m3(Hong Kong) 08m4-09m4Colombia O O O 02m8-03m10
08m8-09m10Croatia O O 07m8-09m9Czech O O 08m8-09m9 08m4-09m8RepublicDenmark O O 01m3-02m3
08m4-09m4Dominican O O 02m7-04m11 02m9-05m6RepublicEgypt O O 02m11-04m7Eritrea O 01m7-03m2Estonia O 08m4-09m5Finland OGeorgia O O O 00m1-00m8
01m2-03m7Ghana O 02m10-04m5
08m10-10m4Haiti O O 02m5-04m4Hungary O O 08m8-10m1 05m12-06m12
08m4-09m5Iceland O O 08m1-10m2 00m8-02m8 07m5-09m9Indonesia O O 08m8-09m9 00m8-01m8Jamaica O O 02m8-04m8
08m6-09m6Japan O O O 08m4-09m4Latvia O O 08m12-09m12 01m3-02m3
08m4-09m8Lesotho O 01m07-02m10
08m4-09m9Lithuania O O 08m4-09m9Malaysia O O 00m10-01m10Malta O O 07m7-08m7Mauritius O O 08m10-09m10 08m8-09m8
52
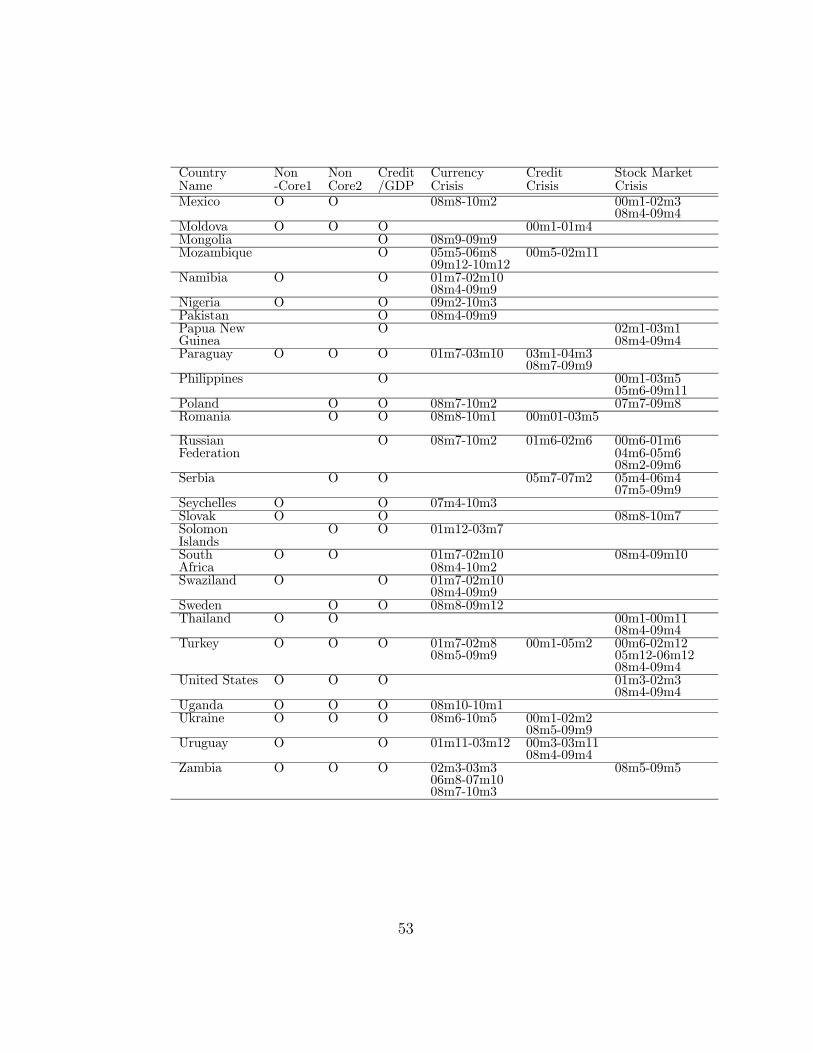
Country Non Non Credit Currency Credit Stock MarketName -Core1 Core2 /GDP Crisis Crisis Crisis
Mexico O O 08m8-10m2 00m1-02m308m4-09m4
Moldova O O O 00m1-01m4Mongolia O 08m9-09m9Mozambique O 05m5-06m8 00m5-02m11
09m12-10m12Namibia O O 01m7-02m10
08m4-09m9Nigeria O O 09m2-10m3Pakistan O 08m4-09m9Papua New O 02m1-03m1Guinea 08m4-09m4Paraguay O O O 01m7-03m10 03m1-04m3
08m7-09m9Philippines O 00m1-03m5
05m6-09m11Poland O O 08m7-10m2 07m7-09m8Romania O O 08m8-10m1 00m01-03m5
Russian O 08m7-10m2 01m6-02m6 00m6-01m6Federation 04m6-05m6
08m2-09m6Serbia O O 05m7-07m2 05m4-06m4
07m5-09m9Seychelles O O 07m4-10m3Slovak O O 08m8-10m7Solomon O O 01m12-03m7IslandsSouth O O 01m7-02m10 08m4-09m10Africa 08m4-10m2Swaziland O O 01m7-02m10
08m4-09m9Sweden O O 08m8-09m12Thailand O O 00m1-00m11
08m4-09m4Turkey O O O 01m7-02m8 00m1-05m2 00m6-02m12
08m5-09m9 05m12-06m1208m4-09m4
United States O O O 01m3-02m308m4-09m4
Uganda O O O 08m10-10m1Ukraine O O O 08m6-10m5 00m1-02m2
08m5-09m9Uruguay O O 01m11-03m12 00m3-03m11
08m4-09m4Zambia O O O 02m3-03m3 08m5-09m5
06m8-07m1008m7-10m3
53