Embed Size (px)
Citation preview
International Journal of Management and Commerce Innovations ISSN 2348-7585 (Online) Vol. 3, Issue 1, pp: (240-254), Month: April 2015 - September 2015, Available at: www.researchpublish.com
Page | 240 Research Publish Journals
Non Financial Reward and Employee Retention in
Private Primary Schools in Kenya (Kiambu County)
Josephine Wanjiru Nyaga
Abstract: Most research which has been undertaken has focused on financial aspects of reward. Little effort has been
taken to understand the value of non-financial rewards. The objective of this research was to determine whether
private schools in Kenya are utilizing non-financial rewards as a competitive advantage in retraining their employees.
A survey was done to the heads and teachers of selected private schools to find out their perception on the use of
different non-financial rewards in retaining their services in their institutions. The objectives of this study were
achieved through conducting a survey on the employees of selected schools .The results that describe the entire
population were used. The major findings were that job flexibility was an important tool because it gives the employee
some authority in their working hours. This gives them room to cater for any other eventualities that may arise in their
life away from the office hence the job does not become a hindrance to their duties prompting them to serve the
institution longer years. The findings under paternity leave were almost at a tie because majority of the respondents
had gone through the phase of paternity leave and others had no intention of the same thereby finding it not relevant.
This requires an employer to gain knowledge of the employee well enough to ensure he or she offers benefits that are
relevant to him. From the results of the research, non-financial rewards took dominance as a factor of employee
retention. It is recommended that organizations continually review their reward practices to ensure alignment
with the potential impact of changes in the macro environment and to make allowance for different
requirements based on the demographic factors of their employees.
Keywords: non-financial rewards, employees, selected private schools.
1. INTRODUCTION
1.1 Background of the study:
The management of remuneration was once straightforward with a strong link between Job level and Pay (Bussin, 2003). It
has become very complex due to the pressures of the volatile business world today. Globalization and the increased
importance of employing the most talented people all contribute to the complex design of reward programmes (Gross &
Friedman, 2004) According to Munsammy and vector (2009), in the current world of work where the war for talent is real,
skilled employees have a broader choice of employment, both locally and internationally.
Organizations are increasingly interested in reducing labor costs and increasing productivity. Money, benefits and other
different forms of rewards have been used to attract and retain employees to achieve organizational goals around the world
(chiu, luk & tang, 2002). According to Aghazadeh (2003), human resource management practices have to change as the
business environment changes.The private schools in Kenya have their challenges to contend with. Their teachers are always
looking for avenues to join the public service. This is due to various factors like job flexibility, job security, Benefits
e.t.c(Meso & Kaino,2008). Due to these factors and also the turbulence of the global business environment, organizations
have no alternative other than to have alternative forms of rewards.
The problem with companies today is that in the case of competition, the emphasis has and is still on financial rewards (kerr-
phillips and Thimas (2009). There has been a significant interest in the importance of money as an attraction and retention
tool (tang, luna & Surtaso,2004)Notwithstanding the above, non-financial factors have the potential to improve the
competitiveness of organizations in attracting and retaining employees because they are less costly and have a long term focus
especially in the case of learning and development. Organisations face negative consequences when they ignore the
importance of financial rewards on employee retention (Hijazi, Anwar, & Mehbood, 2007).
1.1.1 Non-financial rewards and employee retention:
Responding to today‟s workplace demands means among other things that organizations need to understand the preferences
and needs of employees and offer more than a good paycheck (Nienaber, 2009). According to Aghazader (2003), the changing
expectations of employees present various challenges to managers. (Nienaber, 2009) suggests that employees seek more
meaningful and challenging opportunities, an alignment between personal and organization values as well as tolerance to
individual preferences and differences. Remuneration is important to employees, but what really impacts people on a daily
basis are the quality of their work experience (Ferguson & Brohaugh, 2009). Most companies are not sensitive to the different
needs of their employees and do not differentiate between different forms of rewards (Amstrong, 2006).Because Employees
are the direct beneficiaries of rewards, their different needs and demographics should be considered before constructing a
reward package.
International Journal of Management and Commerce Innovations ISSN 2348-7585 (Online) Vol. 3, Issue 1, pp: (240-254), Month: April 2015 - September 2015, Available at: www.researchpublish.com
Page | 241 Research Publish Journals
Giancola (2009) argues against generalizing rewards. He argues that instead of generalizing, they should directly ask
employees for their preferences and eliminate guesswork about the rewards favored. A powerful similarity of the impact of
financial rewards is given by Bussin (2003). He states that a supertanker called Exxon Valdez ran aground in Alaska and
poured oil in the ocean. Speedy action was required to rescue wildlife from the spreading oil. Local members of the Eskimo
tribe were hired to take care of the stranded whales at $20 per hour. When the oil spill was cleaned up and the whales release
back to the ocean, the Eskimos went back to their occupation which was to hunt the same whales. This shows that Money can
only motivate to a certain extent, what matters is the impact the reward has on the individual as a whole.
According to Lawler (1996), while extrinsic rewards such as money are important in the short term, intrinsic rewards in the
form of meaningful work tend to sustain motivation in the long-term.
1.2 Statement of the problem:
Financial rewards can only be utilized to a limited degree depending on the capability of the employer (Lawler, 1996). This
has been illustrated in the recent strikes by teachers and other workers demanding higher pay. This strikes lead to employers
digging deeper in their pockets to sustain the employees in their jobs. Sometimes, the money is not forthcoming leading to
some of the workers leaving for greener pastures. This external factors impact the financial viability of organizations and they
can be reduced by the use of less costly, convenient and long term non-financial rewards.
The TSC (Teachers service commission) is the government employer. Apart from Job security which many teachers enjoy, it
also offers many kinds of allowances like Hardship allowance which is 10% of the basic pay, commuter allowance, house
allowance, a generous medical cover e.t.c. The basic pay is sometimes not as high as in private schools but the benefits are
adequate. This study seeks to find out whether private schools are utilizing the non-financial rewards as a competitive
advantage in retaining their staff.
1.3 Objectives of the study:
1.3.1 General objective
The general objective of this study was to establish the influence of non-financial rewards on employee retention in private
schools in Kenya.
1.3.2 Specific Objectives
The specific objectives of this study were:
i. To establish the effect of job security on employee retention in private schools in Kenya.
ii. To establish the effect of job flexibility on employee retention in private schools in Kenya.
iii. To establish the effect of learning and development on employee retention in private schools in Kenya.
iv. To establish the effect of Paternity leave on employee retention in private schools in Kenya.
1.4 Research questions:
i. What is the effect of job security on employee retention in private schools in Kenya?
ii. What is the effect of job flexibility on employee retention in private schools in Kenya?
iii. What is the effect Learning and development on employee retention in private schools in Kenya?
iv. What is the effect of Paternity leave on employee retention in private schools in Kenya?
1.5 Justification of the study:
Employee retention has always been a major problem to many organizations. This has been regarded as the most vital issue
that many organizations are looking forward to ensure it succeeds. Employees have to be retained in an organization because
of various reasons. They include; long lasting employees in an organization gains experience and thus improve on their
efficiency, cost of trainings and workshops is reduced, time wastage is minimized because employees know better what is
supposed to be done and at what time and so on. This has made it a prerogative of the management of an organization to
ensure that employees are retained and the turn-over is reduced.
Financial rewards are is the set of forces that directs and makes people persist in their efforts to accomplish a goal. According
to the basics of motivation theory people are motivated by unmet needs so in order to motivate a person or employee one must
learn what his or her needs are. In my opinion it is clear that not only financial rewards are the key to employee retention but
the question is what the best way to motivate an employee is in order to make him/her have confidence of working within his
particular company.
An important feature is that employee‟s good performance will be rewarded with attractive rewards. If the rewards being
offered are directly linked to their performance then workers will be motivated to take action and perform well to get their
desired rewards. An intended effort will turn into visible effort when people expect their efforts will result in good
performance. The important point to note here is that it is not just the financial rewards that cause people to perform well but
also the employee needs to know that their efforts will turn into good performance. So it is clearly evident so far that financial
rewards are important in motivation of executives but it is not the only factor and must be used in the correct way in order to
achieve maximum results. So if the rewards are attractive and linked to performance (instrumentally) people are motivated to
take action. Intended effort will turn into actual effort when people believe their hard work will result in good performance.
The study was significant to a number of organizations:-
1.6 Limitations of the study:
Respondents were not willing to answer the questions. This resulted to 3 incomplete questionnaires.
International Journal of Management and Commerce Innovations ISSN 2348-7585 (Online) Vol. 3, Issue 1, pp: (240-254), Month: April 2015 - September 2015, Available at: www.researchpublish.com
Page | 242 Research Publish Journals
2. LITERATURE REVIEW
2.1 Introduction:
This chapter presented a review of literature on Employee retention, job security, job flexibility, paternity leave, and Learning
and development. The theory reviewed built a platform of understanding the importance of non-financial rewards within the
context of job security, job flexibility, learning and development and paternity leave. The chapter began with a theoretical
review followed by a conceptual framework, empirical review and a research gap.
2.2 Theoretical review:
A theory is a set of statements or principles devised to explain a group of facts or phenomena, especially one that has been
repeatedly tested or is widely accepted and can be used to make predictions about natural phenomena. The theories reviewed
in this study include (Employee satisfaction theory, Marsloys theory of needs , job flexibility, paternity leave, and Learning
and development)
2.2.1 Herzberg’s Two-Factor Theory:
The two-factor theory of job satisfaction was the result of a five year research program on job attitudes initiated by a grant
from The Buhl Foundation. There was an urgent need at the time Herzberg‟s Two-Factor Theory 4 for more and better insight
about the attitudes of people towards their jobs due to the prevalence of job dissatisfaction indicators such as strikes, slow
downs, and filing of grievances (Herzberg, Mausner, Peterson, & Capwell, 1957). During the first stage of the program,
Herzberg and his colleagues conducted a comprehensive literature review of over 2000 writings published between 1900 and
1955. The literature yielded contradictory results, and the research designs of the studies varied widely in quality and the
methodologies used (Herzberg, Mausner, & Snyderman, 1959). Based on their review of the literature, Herzberg et al. (1959)
made core assumptions on which to base their hypothesis and research design. First, there was enough evidence to assume that
there was some relationship between job attitudes and productivity. Second, the characteristics of dissatisfied workers had
been well-defined in the existing literature. Third, the factors related to job attitudes had also been previously well-defined.
Herzberg et al. (1959) developed an initial hypothesis that satisfaction and dissatisfaction could not be reliably measured on
the same continuum. Herzberg et al. next conducted an empirical study to test the hypothesis. After two pilot programs, the
design and hypothesis were further developed and expanded (Herzberg et al., 1959). The main hypothesis stated that factors
leading to positive attitudes and those leading to negative attitudes will differ. The second hypothesis stated that factors and
effects involved in long-range sequences of events would differ from those in short-range sequences.
The high sequence events provide contrast to the low sequence events. It was found that a great many things can be a source
of dissatisfaction, but only certain factors can contribute to satisfaction (Herzberg et al., 1959). Low sequence factors were
rarely found in the high sequences. Salary was the exception to these findings as it was mentioned with similar frequency in
both the high and low range stories. However, when viewed within the context of the events, it became apparent to the
researchers that salary is primarily a dissatisfier. When salary was mentioned as a satisfier, it was related to appreciation and
recognition of a job done well and not as a factor in itself
Snape (2006) seeks to explore the perceptions of scientists regarding the intrinsic and extrinsic factors that motivate them and
the role of management in enhancing and maintaining motivation with the purpose of identifying practical recommendations
for managers to improve the productivity of scientists. A total of 18 semi-structured interviews were undertaken with
randomly selected (stratified sampling) scientists working at a government research institute in the UK. The scientists
interviewed were typically motivated by the ability to do high quality, curiosity-driven research and de-motivated by lack of
feedback from management, difficulty in collaborating with colleagues and constant review and change. Extrinsic motivators
such as salaries, incentive schemes and prospects for promotion were not considered as motivating factors by most scientists.
Promotion was not a motivator for most of the scientists and many thought that they would never get promoted again. Efforts
should be focused on addressing the hygiene factors (i.e. removing the negatives) rather than introducing new incentives.
Schroder (2008) used the two-factor theory as the theoretical framework for a study of 835 university employees in order to
understand the impact of demographical factors on job satisfaction. The researcher found that overall job satisfaction was
related to age and educational level, and that levels of intrinsic and extrinsic job satisfaction were not the same for different
occupational groups – findings that contradicted Herzberg‟s findings (Schroder, 2008). The two-factor theory was also tested
among construction workers in Bangkok (Ogunlana & Chang, 1998). The study did not provide support for the theory, but it
was hypothesized that the conflicting results were due to the lower placement of Thailand‟s construction workers on
Maslow‟s hierarchy of needs. Because survival was still a basic need of these workers, they were not able to desire self-
actualization and place value on Herzberg‟s motivators (Ogunlana & Chang, 1998).
Under Herzberg's (1966) theory, workers who are satisfied with both motivation and hygiene factors would be top performers,
and those who are dissatisfied with both factors would be poor performers. Christopher (2005) found no support for this, and
his research concluded that Herzberg's results prove accurate only under his original methodology. Theories of worker
motivation address a model connecting job satisfaction, motivation and performance. Considerable importance is attached to
these concepts, and there is a need for clarification on how satisfaction and motivation differ from each other. Job satisfaction
is an emotional response accompanying actions or thoughts relating to work, whereas motivation is the process that activates
behavior. As satisfaction is an attitude, it is possible for a worker to be satisfied with his job but not be motivated. Hence,
motivation and satisfaction are not synonymous with each other. It is vital to clarify the distinction between the concepts so
that it is easier to understand that motivation leads to satisfaction, which ultimately leads to enhanced performance.
2.2.2 Maslow’s hierarchy of needs theory:
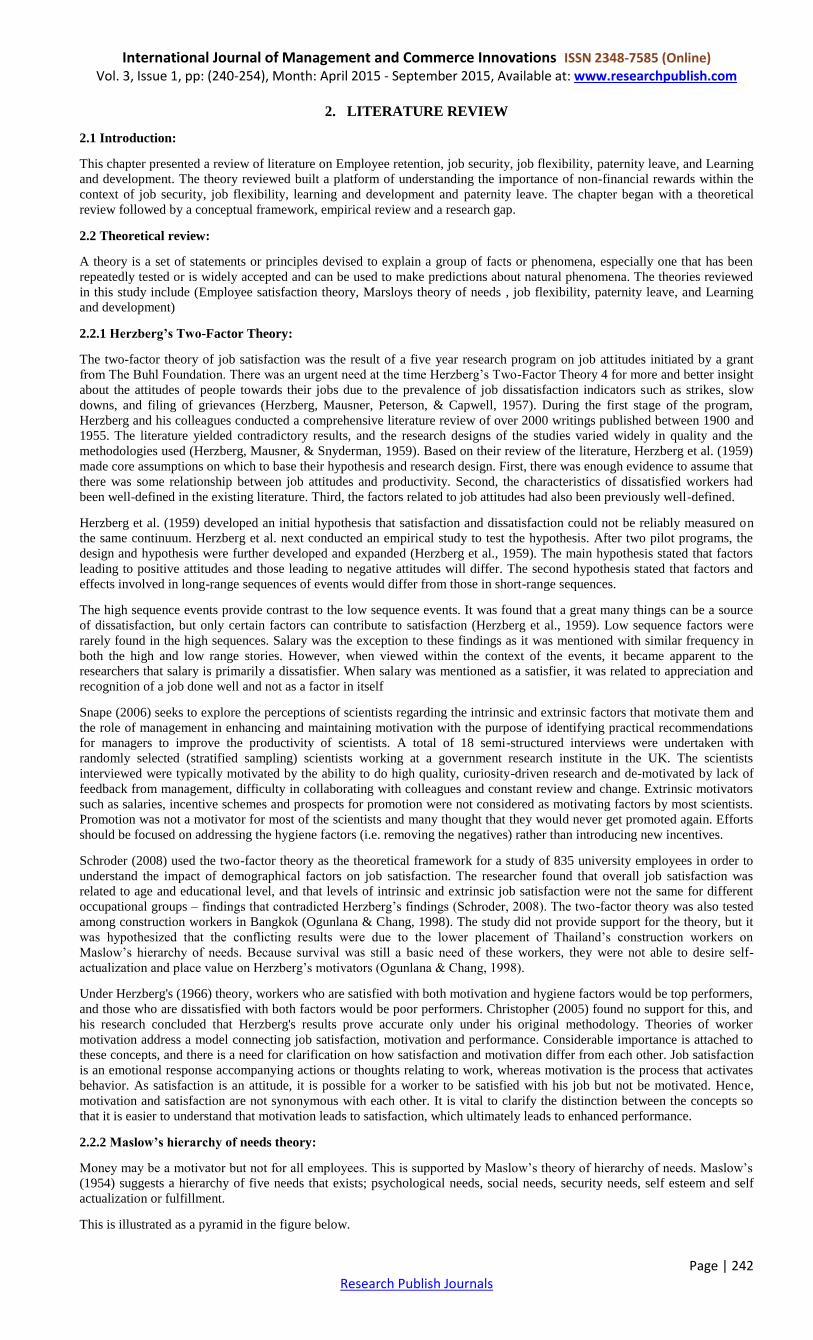
Money may be a motivator but not for all employees. This is supported by Maslow‟s theory of hierarchy of needs. Maslow‟s
(1954) suggests a hierarchy of five needs that exists; psychological needs, social needs, security needs, self esteem and self
actualization or fulfillment.
This is illustrated as a pyramid in the figure below.
International Journal of Management and Commerce Innovations ISSN 2348-7585 (Online) Vol. 3, Issue 1, pp: (240-254), Month: April 2015 - September 2015, Available at: www.researchpublish.com
Page | 243 Research Publish Journals
Fig.1 Marslows hierachy of needs. (Maslow, 1943)
(Cunningham, 2002) states that employees rank recognition, flexibility and training as top priorities in prolonging individual
employment, while walker (2001) calls for establishing a supportive working and learning climate for employee retention.
Further, career development (Boomr Authority 2007) organization commitment (Patrick owens, 2006). Communication
(Gopinath and Becker, 2000) and superior- subordinate relationship (Zenger, ulrich, smallwood, 2000) are also the factors
known for prolonged stay of the employees in the organisation.
2.2.3 Victor Vroom's Expectancy Theory:
Vroom's expectancy theory assumes that behaviour results from conscious choices among alternatives whose purpose it is to
maximize pleasure and to minimize pain. Vroom realized that an employee's performance is based on individual factors such
as personality, skills, knowledge, experience and abilities. He stated that effort, performance and motivation are linked in a
person's motivation. He uses the variables Expectancy, Instrumentality and Valence to account for this.
Expectancy is the belief that increased effort will lead to increased performance i.e. if I work harder then this will be better.
This is affected by such things as: Having the right resources available (e.g. raw materials, time) ,Having the right skills to do
the job ,Having the necessary support to get the job done (e.g. supervisor support, or correct information on the job)
Instrumentality is the belief that if you perform well that a valued outcome will be received. The degree to which a first level
outcome will lead to the second level outcome. i.e. if I do a good job, there is something in it for me. This is affected by such
things as: Clear understanding of the relationship between performance and outcomes – e.g. the rules of the reward 'game'
,Trust in the people who will take the decisions on who gets what outcome, Transparency of the process that decides who gets
what outcome.Valence is the importance that the individual places upon the expected outcome. For the valence to be positive,
the person must prefer attaining the outcome to not attaining it. For example, if someone is mainly motivated by money, he or
she might not value offers of additional time off.
The three elements are important behind choosing one element over another because they are clearly defined: effort-
performance expectancy (E>P expectancy) and performance-outcome expectancy (P>O expectancy).E>P expectancy: our
assessment of the probability that our efforts will lead to the required performance level,P>O expectancy: our assessment of
the probability that our successful performance will lead to certain outcomes,Crucially, Vroom's expectancy theory works on
perceptions – so even if an employer thinks they have provided everything appropriate for motivation, and even if this works
with most people in that organisation, it doesn't mean that someone won't perceive that it doesn't work for them.
At first glance expectancy theory would seem most applicable to a traditional-attitude work situation where how motivated the
employee is depends on whether they want the reward on offer for doing a good job and whether they believe more effort will
lead to that reward.
2.2.4 Stacy Adams Equity theory (1963, 1965):
John Stacey Adams' equity theory helps explain why pay and conditions alone do not determine motivation. It also explains
why giving one person a promotion or pay-rise can have a demotivating effect on others. When people feel fairly or
advantageously treated they are more likely to be motivated; when they feel unfairly treated they are highly prone to feelings
of disaffection and demotivation. Employees seek to maintain equity between the inputs that they bring to a job and the
outcomes that they receive from it against the perceived inputs and outcomes of others. The belief in equity theory is that
people value fair treatment which causes them to be motivated to keep the fairness maintained within the relationships of their
co-workers and the organization.
Words like efforts and rewards, or work and pay, are an over-simplification - hence the use of the terms inputs and outputs.
Inputs are logically what we give or put into our work. Outputs are everything we take out in return. The belief is that people
value fair treatment which causes them to be motivated to keep the fairness maintained within the relationships of their co-
workers and the organization. The structure of equity in the workplace is based on the ratio of inputs to outcomes. Inputs are
the contributions made by the employee for the organization.
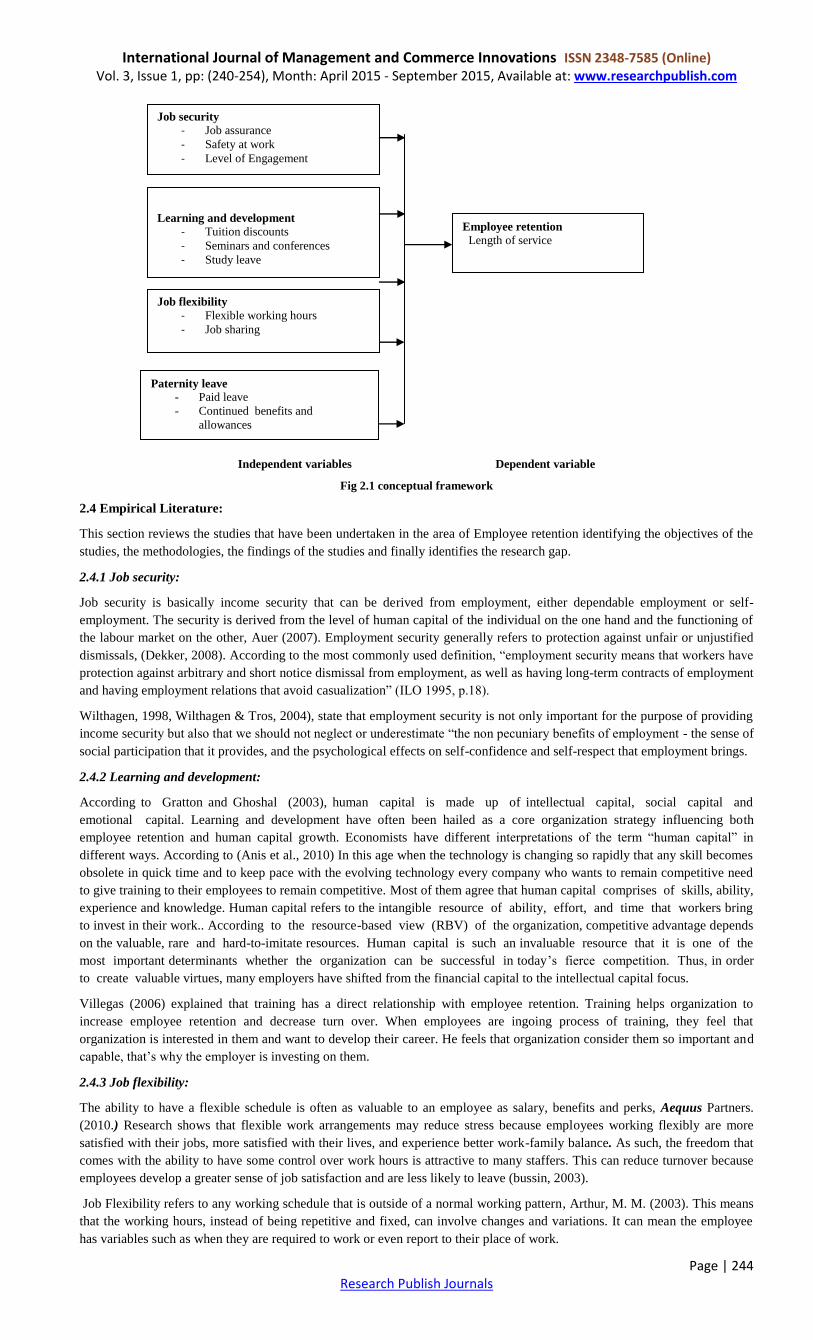
2.3 Conceptual framework:
This framework attempts to determine the influence of non-financial rewards on employee retention in private schools in
Kenya. These non-financial rewards include job security, job flexibility, paternity leave, and Learning and development.
The study will therefore determine the effects of the independent variables on the dependent variable.
International Journal of Management and Commerce Innovations ISSN 2348-7585 (Online) Vol. 3, Issue 1, pp: (240-254), Month: April 2015 - September 2015, Available at: www.researchpublish.com
Page | 244 Research Publish Journals
Independent variables Dependent variable
Fig 2.1 conceptual framework
2.4 Empirical Literature:
This section reviews the studies that have been undertaken in the area of Employee retention identifying the objectives of the
studies, the methodologies, the findings of the studies and finally identifies the research gap.
2.4.1 Job security:
Job security is basically income security that can be derived from employment, either dependable employment or self-
employment. The security is derived from the level of human capital of the individual on the one hand and the functioning of
the labour market on the other, Auer (2007). Employment security generally refers to protection against unfair or unjustified
dismissals, (Dekker, 2008). According to the most commonly used definition, “employment security means that workers have
protection against arbitrary and short notice dismissal from employment, as well as having long-term contracts of employment
and having employment relations that avoid casualization” (ILO 1995, p.18).
Wilthagen, 1998, Wilthagen & Tros, 2004), state that employment security is not only important for the purpose of providing
income security but also that we should not neglect or underestimate “the non pecuniary benefits of employment - the sense of
social participation that it provides, and the psychological effects on self-confidence and self-respect that employment brings.
2.4.2 Learning and development:
According to Gratton and Ghoshal (2003), human capital is made up of intellectual capital, social capital and
emotional capital. Learning and development have often been hailed as a core organization strategy influencing both
employee retention and human capital growth. Economists have different interpretations of the term “human capital” in
different ways. According to (Anis et al., 2010) In this age when the technology is changing so rapidly that any skill becomes
obsolete in quick time and to keep pace with the evolving technology every company who wants to remain competitive need
to give training to their employees to remain competitive. Most of them agree that human capital comprises of skills, ability,
experience and knowledge. Human capital refers to the intangible resource of ability, effort, and time that workers bring
to invest in their work.. According to the resource-based view (RBV) of the organization, competitive advantage depends
on the valuable, rare and hard-to-imitate resources. Human capital is such an invaluable resource that it is one of the
most important determinants whether the organization can be successful in today‟s fierce competition. Thus, in order
to create valuable virtues, many employers have shifted from the financial capital to the intellectual capital focus.
Villegas (2006) explained that training has a direct relationship with employee retention. Training helps organization to
increase employee retention and decrease turn over. When employees are ingoing process of training, they feel that
organization is interested in them and want to develop their career. He feels that organization consider them so important and
capable, that‟s why the employer is investing on them.
2.4.3 Job flexibility:
The ability to have a flexible schedule is often as valuable to an employee as salary, benefits and perks, Aequus Partners.
(2010.) Research shows that flexible work arrangements may reduce stress because employees working flexibly are more
satisfied with their jobs, more satisfied with their lives, and experience better work-family balance. As such, the freedom that
comes with the ability to have some control over work hours is attractive to many staffers. This can reduce turnover because
employees develop a greater sense of job satisfaction and are less likely to leave (bussin, 2003).
Job Flexibility refers to any working schedule that is outside of a normal working pattern, Arthur, M. M. (2003). This means
that the working hours, instead of being repetitive and fixed, can involve changes and variations. It can mean the employee
has variables such as when they are required to work or even report to their place of work.
Job security
- Job assurance
- Safety at work
- Level of Engagement
-
Learning and development
- Tuition discounts
- Seminars and conferences
- Study leave
Job flexibility
- Flexible working hours
- Job sharing
Paternity leave
- Paid leave
- Continued benefits and
allowances
Employee retention
Length of service
International Journal of Management and Commerce Innovations ISSN 2348-7585 (Online) Vol. 3, Issue 1, pp: (240-254), Month: April 2015 - September 2015, Available at: www.researchpublish.com
Page | 245 Research Publish Journals
2.4.4 Paternity leave:
To qualify for paternity leave, a person must be a male person and an employee. That is to say, „be employed for a salary or
wages‟, as employees are defined in the Act. Your employment rights are protected while on paternity leave. This includes
your right to: pay rises, build up (accrue) holiday, return to work. (https://www.gov.uk/paternity-pay-leave)
However, a casual employee is not included as the Act seems to define an „employee‟ and „casual employee‟ separately.
Logically, paternity and by extension a leave based on claims of paternity can only accrue to: the biological father of a baby,
husband or partner to the baby‟s mother. Under section 29 of the Employment Act, women employees are entitled to three (3)
months maternity leave with full pay besides the normal annual leave aforesaid. On the other hand, male employees are entitled to
two (2) weeks paternity leave . In Teachers service commission, A male teacher can apply for paternity leave of up to 10 days
within the period of spouse‟s maternity leave. Where a teacher has more than one wife, he will be entitled to the leave in
respect to the one whose name appears in the National Health Insurance Fund (NHIF) Card. Paternity leave is only applicable
to a man whose recognised wife delivers a baby. What this means is that paternity leave is not open to any man, but only those
who are married and whose wives are recognised by the employers. Section 29 (8) deals with the issue of paternity leave and
again the wording suggests that it is a mandatory provision. It states: "A male employer shall be entitled to two weeks
paternity leave with full pay." This also means the male employee must be allowed to proceed on paternity leave as provided
above
2.4.5 Employee retention:
As human capital plays an important role in organization‟s success, more and more employers are aware of the fact that it
is of great importance to keep talented employee in the organization. Employee retention is a serious and critical problem
for all types of organizations. As per the term “employee retention”, it first appeared on the business scene in the 1970s
and early 80s (Mckeown, 2002). Successful employee retention helps preserve the knowledge within an organization. If the
employee leaves the organization, a knowledge gap is generated. In addition, the organization will be faced with a
significant loss such as reduction in organizational performance if the turnover of talented employees is high. The
reason for this is that it is costly to replace the intelligent capital via recruiting and training. In order to preserve the
human capital, it is necessary for the organization to analyze why the employees leave the organization and come up with
employee retention solutions.
According to a seminal study conducted by Armstrong (1988), retention at work operates in two ways. First, people can
motivate themselves by doing work that intrinsically motivates them and which leads them to expect that their goals will be
achieved. Secondly, higher management can provide a motivating environment through such methods as pay and bonus
schemes. He called the former the intrinsic motivation while the latter the extrinsic motivation
2.4 Research Gap:
Various research studies have been conducted internationally and locally on employee retention and the factors that influence
it. The problem with most of these studies is that they have not looked at the different demographics of the employees. They
have generalized the employees and the rewards have not been specific to different individuals. This study therefore sought to
fill this gap by including the different employee demographics in the study because different employees have different needs.
3. RESEARCH METHODOLOGY
3.1 Introduction:
This chapter presents the methodology that was used to carry out the study. This included the study design, target population,
data collection tools and data collection technique, data analysis method and presentation. This research methodology aimed
at enabling the researcher to obtain and process the data.
3.2 Research Design:
The study used descriptive research design. Beck (2003), and Kothari (2004) define research design as the overall plan for
obtaininganswers to the questions being studied and from which the study adopted descriptive survey approach in collecting
data from the respomdents.A descriptive study aims at describing or defining a subject often by creating a profile of a group
of problems, people or events through the collection of data and tabulation of the frequencies on research variables or their
interaction. A descriptive research should define questions, people surveyed, and the method of analysis prior to beginning
data collection.
3.3 Population of study:
Target population in statistics is the specific population about which information is desired. According to Ngechu (2004),a
population is a well defined or set of people, services, elements, events or households that are being investigated. This
definition ensures that population is homogeneous. The population targeted ten private schools in Kiambu County with a total
of 98 respondents.
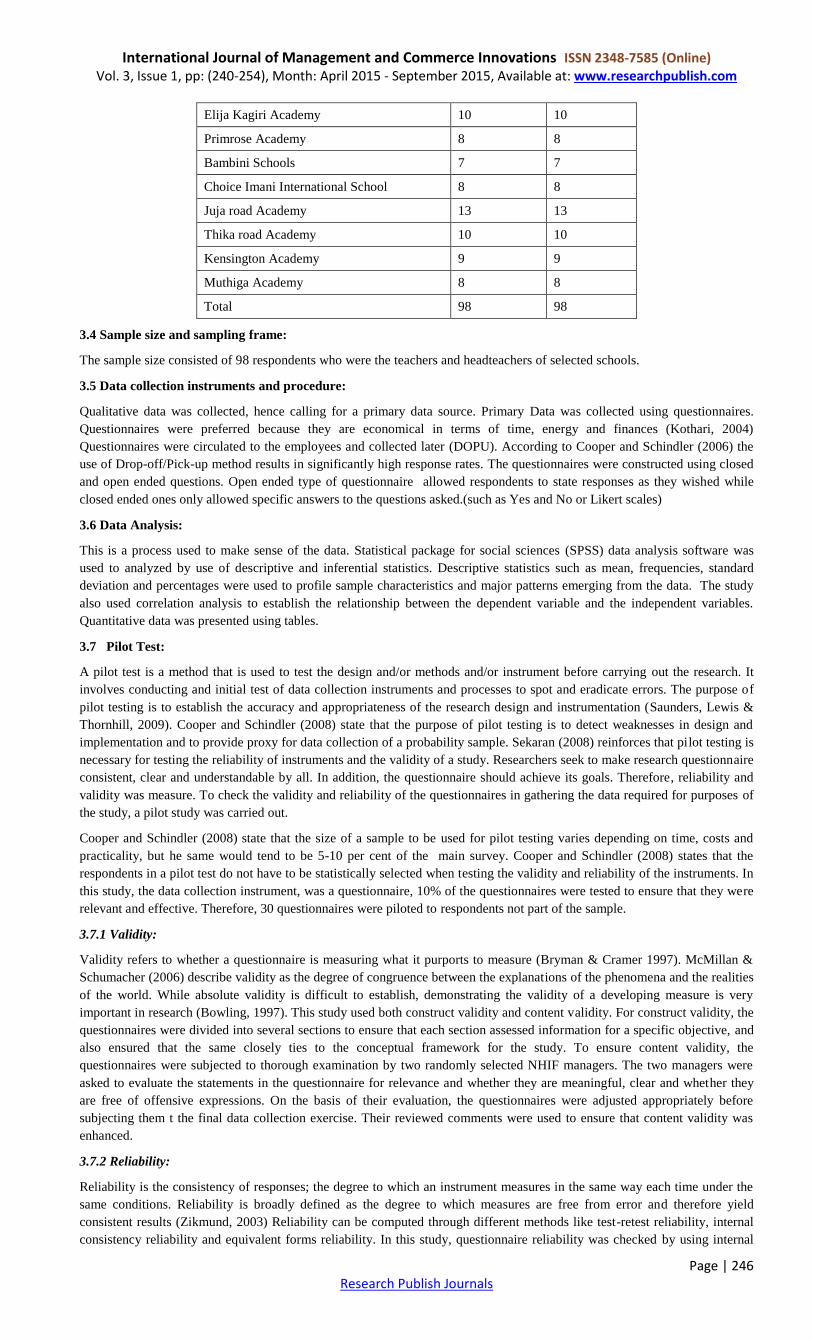
Table 3.1 Target population
School Population Sample
Moi Academy 14 14
Bishop Njuguna Academy 11 11
International Journal of Management and Commerce Innovations ISSN 2348-7585 (Online) Vol. 3, Issue 1, pp: (240-254), Month: April 2015 - September 2015, Available at: www.researchpublish.com
Page | 246 Research Publish Journals
Elija Kagiri Academy 10 10
Primrose Academy 8 8
Bambini Schools 7 7
Choice Imani International School 8 8
Juja road Academy 13 13
Thika road Academy 10 10
Kensington Academy 9 9
Muthiga Academy 8 8
Total 98 98
3.4 Sample size and sampling frame:
The sample size consisted of 98 respondents who were the teachers and headteachers of selected schools.
3.5 Data collection instruments and procedure:
Qualitative data was collected, hence calling for a primary data source. Primary Data was collected using questionnaires.
Questionnaires were preferred because they are economical in terms of time, energy and finances (Kothari, 2004)
Questionnaires were circulated to the employees and collected later (DOPU). According to Cooper and Schindler (2006) the
use of Drop-off/Pick-up method results in significantly high response rates. The questionnaires were constructed using closed
and open ended questions. Open ended type of questionnaire allowed respondents to state responses as they wished while
closed ended ones only allowed specific answers to the questions asked.(such as Yes and No or Likert scales)
3.6 Data Analysis:
This is a process used to make sense of the data. Statistical package for social sciences (SPSS) data analysis software was
used to analyzed by use of descriptive and inferential statistics. Descriptive statistics such as mean, frequencies, standard
deviation and percentages were used to profile sample characteristics and major patterns emerging from the data. The study
also used correlation analysis to establish the relationship between the dependent variable and the independent variables.
Quantitative data was presented using tables.
3.7 Pilot Test:
A pilot test is a method that is used to test the design and/or methods and/or instrument before carrying out the research. It
involves conducting and initial test of data collection instruments and processes to spot and eradicate errors. The purpose of
pilot testing is to establish the accuracy and appropriateness of the research design and instrumentation (Saunders, Lewis &
Thornhill, 2009). Cooper and Schindler (2008) state that the purpose of pilot testing is to detect weaknesses in design and
implementation and to provide proxy for data collection of a probability sample. Sekaran (2008) reinforces that pilot testing is
necessary for testing the reliability of instruments and the validity of a study. Researchers seek to make research questionnaire
consistent, clear and understandable by all. In addition, the questionnaire should achieve its goals. Therefore, reliability and
validity was measure. To check the validity and reliability of the questionnaires in gathering the data required for purposes of
the study, a pilot study was carried out.
Cooper and Schindler (2008) state that the size of a sample to be used for pilot testing varies depending on time, costs and
practicality, but he same would tend to be 5-10 per cent of the main survey. Cooper and Schindler (2008) states that the
respondents in a pilot test do not have to be statistically selected when testing the validity and reliability of the instruments. In
this study, the data collection instrument, was a questionnaire, 10% of the questionnaires were tested to ensure that they were
relevant and effective. Therefore, 30 questionnaires were piloted to respondents not part of the sample.
3.7.1 Validity:
Validity refers to whether a questionnaire is measuring what it purports to measure (Bryman & Cramer 1997). McMillan &
Schumacher (2006) describe validity as the degree of congruence between the explanations of the phenomena and the realities
of the world. While absolute validity is difficult to establish, demonstrating the validity of a developing measure is very
important in research (Bowling, 1997). This study used both construct validity and content validity. For construct validity, the
questionnaires were divided into several sections to ensure that each section assessed information for a specific objective, and
also ensured that the same closely ties to the conceptual framework for the study. To ensure content validity, the
questionnaires were subjected to thorough examination by two randomly selected NHIF managers. The two managers were
asked to evaluate the statements in the questionnaire for relevance and whether they are meaningful, clear and whether they
are free of offensive expressions. On the basis of their evaluation, the questionnaires were adjusted appropriately before
subjecting them t the final data collection exercise. Their reviewed comments were used to ensure that content validity was
enhanced.
3.7.2 Reliability:
Reliability is the consistency of responses; the degree to which an instrument measures in the same way each time under the
same conditions. Reliability is broadly defined as the degree to which measures are free from error and therefore yield
consistent results (Zikmund, 2003) Reliability can be computed through different methods like test-retest reliability, internal
consistency reliability and equivalent forms reliability. In this study, questionnaire reliability was checked by using internal
International Journal of Management and Commerce Innovations ISSN 2348-7585 (Online) Vol. 3, Issue 1, pp: (240-254), Month: April 2015 - September 2015, Available at: www.researchpublish.com
Page | 247 Research Publish Journals
consistency method to measure the correlation between each item in the questionnaire and others. Twenty customers were
picked randomly to fill questionnaires to measure its reliability. Cronbach alpha was then calculated for all statements in the
questionnaire. Likert scale questionnaires use Cronbach alpha method (Nunnally, 1978). Cronbach alpha is a correlation
coefficient between two sets of data. The results were used to establish the reliability of the questionnaire as a research tool.
According to Cooper and Schindler (2008) reliability coefficient refers to the scores obtained on a test. A reliability
coefficient of zero indicates that the test scores are unreliable. On the other hand the higher the reliability of coefficient, the
more reliable or accurate the test scores. A reliability coefficient is a numerical value that can range from zero to one. For
research purposes, tests with a reliability score of 0.7 and above is accepted as reliable, whilst for clinical decision making,
test scores of between 0.8 and 0.9 are acceptable. (Cooper & Schindler, 2008).
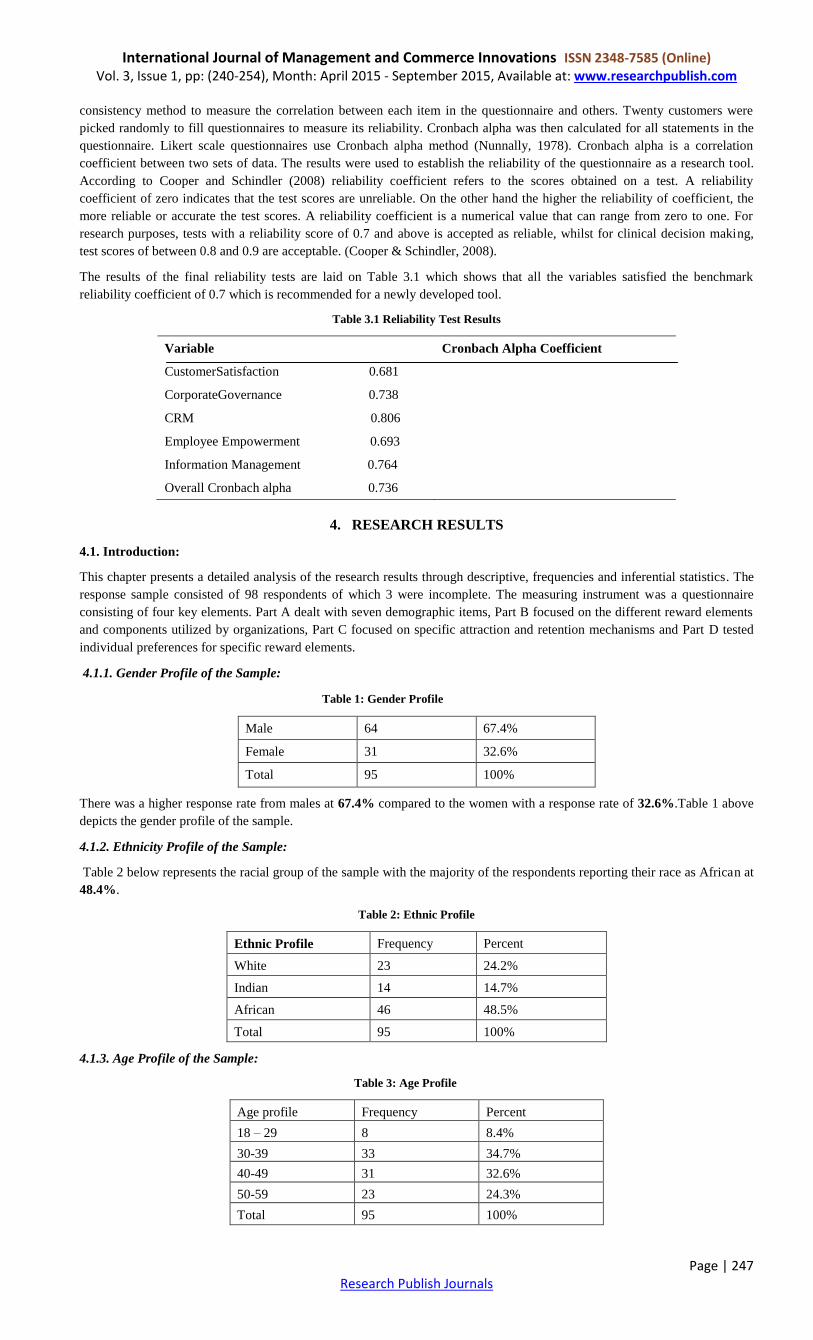
The results of the final reliability tests are laid on Table 3.1 which shows that all the variables satisfied the benchmark
reliability coefficient of 0.7 which is recommended for a newly developed tool.
Table 3.1 Reliability Test Results
Variable Cronbach Alpha Coefficient
CustomerSatisfaction 0.681
CorporateGovernance 0.738
CRM 0.806
Employee Empowerment 0.693
Information Management 0.764
Overall Cronbach alpha 0.736
4. RESEARCH RESULTS
4.1. Introduction:
This chapter presents a detailed analysis of the research results through descriptive, frequencies and inferential statistics. The
response sample consisted of 98 respondents of which 3 were incomplete. The measuring instrument was a questionnaire
consisting of four key elements. Part A dealt with seven demographic items, Part B focused on the different reward elements
and components utilized by organizations, Part C focused on specific attraction and retention mechanisms and Part D tested
individual preferences for specific reward elements.
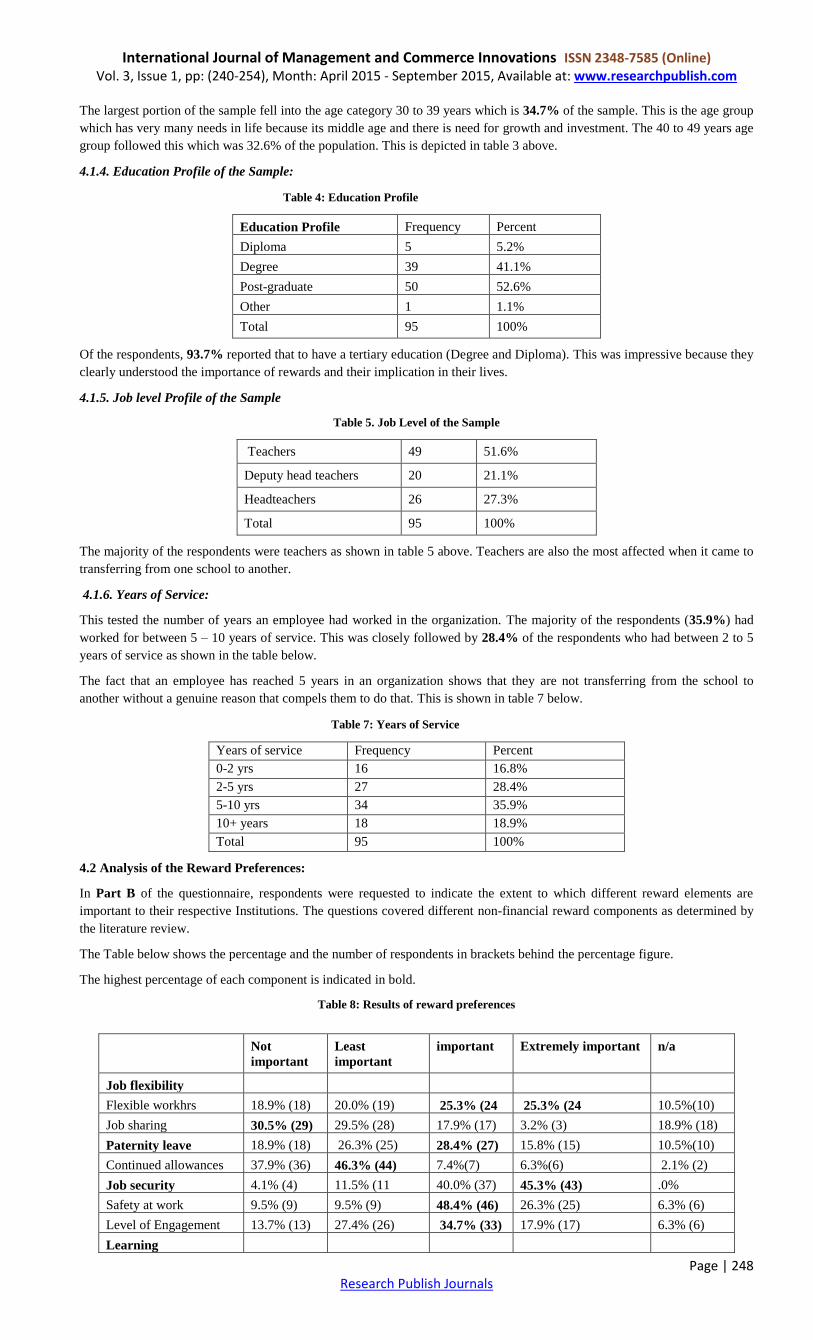
4.1.1. Gender Profile of the Sample:
Table 1: Gender Profile ncy Percent
Male 64 67.4%
Female 31 32.6%
Total 95 100%
There was a higher response rate from males at 67.4% compared to the women with a response rate of 32.6%.Table 1 above
depicts the gender profile of the sample.
4.1.2. Ethnicity Profile of the Sample:
Table 2 below represents the racial group of the sample with the majority of the respondents reporting their race as African at
48.4%.
Table 2: Ethnic Profile
Ethnic Profile Frequency Percent
White 23 24.2%
Indian 14 14.7%
African 46 48.5%
Total 95 100%
4.1.3. Age Profile of the Sample:
Table 3: Age Profile Ant
Age profile Frequency Percent
18 – 29 8 8.4%
30-39 33 34.7%
40-49 31 32.6%
50-59 23 24.3%
Total 95 100%
International Journal of Management and Commerce Innovations ISSN 2348-7585 (Online) Vol. 3, Issue 1, pp: (240-254), Month: April 2015 - September 2015, Available at: www.researchpublish.com
Page | 248 Research Publish Journals
The largest portion of the sample fell into the age category 30 to 39 years which is 34.7% of the sample. This is the age group
which has very many needs in life because its middle age and there is need for growth and investment. The 40 to 49 years age
group followed this which was 32.6% of the population. This is depicted in table 3 above.
4.1.4. Education Profile of the Sample:
Table 4: Education Profile Educaon Frequency Per
Education Profile Frequency Percent
Diploma 5 5.2%
Degree 39 41.1%
Post-graduate 50 52.6%
Other 1 1.1%
Total 95 100%
Of the respondents, 93.7% reported that to have a tertiary education (Degree and Diploma). This was impressive because they
clearly understood the importance of rewards and their implication in their lives.
4.1.5. Job level Profile of the Sample
Table 5. Job Level of the Sample
Teachers 49 51.6%
Deputy head teachers 20 21.1%
Headteachers 26 27.3%
Total 95 100%
The majority of the respondents were teachers as shown in table 5 above. Teachers are also the most affected when it came to
transferring from one school to another.
4.1.6. Years of Service:
This tested the number of years an employee had worked in the organization. The majority of the respondents (35.9%) had
worked for between 5 – 10 years of service. This was closely followed by 28.4% of the respondents who had between 2 to 5
years of service as shown in the table below.
The fact that an employee has reached 5 years in an organization shows that they are not transferring from the school to
another without a genuine reason that compels them to do that. This is shown in table 7 below.
Table 7: Years of Service Year of
Years of service Frequency Percent
0-2 yrs 16 16.8%
2-5 yrs 27 28.4%
5-10 yrs 34 35.9%
10+ years 18 18.9%
Total 95 100%
4.2 Analysis of the Reward Preferences:
In Part B of the questionnaire, respondents were requested to indicate the extent to which different reward elements are
important to their respective Institutions. The questions covered different non-financial reward components as determined by
the literature review.
The Table below shows the percentage and the number of respondents in brackets behind the percentage figure.
The highest percentage of each component is indicated in bold.
Table 8: Results of reward preferences
Not
important
Least
important
important Extremely important n/a
Job flexibility
Flexible workhrs 18.9% (18) 20.0% (19) 25.3% (24 25.3% (24 10.5%(10)
Job sharing 30.5% (29) 29.5% (28) 17.9% (17) 3.2% (3) 18.9% (18)
Paternity leave 18.9% (18) 26.3% (25) 28.4% (27) 15.8% (15) 10.5%(10)
Continued allowances 37.9% (36) 46.3% (44) 7.4%(7) 6.3%(6) 2.1% (2)
Job security 4.1% (4) 11.5% (11 40.0% (37) 45.3% (43) .0%
Safety at work 9.5% (9) 9.5% (9) 48.4% (46) 26.3% (25) 6.3% (6)
Level of Engagement 13.7% (13) 27.4% (26) 34.7% (33) 17.9% (17) 6.3% (6)
Learning
International Journal of Management and Commerce Innovations ISSN 2348-7585 (Online) Vol. 3, Issue 1, pp: (240-254), Month: April 2015 - September 2015, Available at: www.researchpublish.com
Page | 249 Research Publish Journals
4.2.1 Job security and Employee retention:
In order to make a good conclusion, the two upper sides and the two lower sides of the table were combined. 80 respondents
classified it as an important component of employee retention while 15 thought it was not important. Safety at work
and level of engagement were also used to indicate the extent of job security. Under safety at work 71 out of 95
respondents indicated it was important and 50 out of 95 respondents classified level of engagement as important. This they
explained was because it made them feel respected and valued as part of the institution and made them work harder and
longer. Therefore, job security was indicated as an important component of employee retention.
4.2.2 Job flexibility and Employee retention:
Under this component, two variables were used to measure the amount of flexibility in the job. Flexible working hours and
job sharing. Under job flexibility, flexible working hours was rated important by 48 respondents while job sharing was rated
by 20 respondents only as important. Most of the respondents classified job sharing as not important in employee retention.
This was due to the fact that job sharing can lead to mistakes which can be traced back to the employee even when done by a
different employee.
4.2.3 Paternity leave and Employee retention:
Paternity leave was a factor that had differing responses. Majority of the respondents thought it was not applicable to their
situation i.e 53 respondents out of 95. These were the ones who had passed through the phase or were not intending to go
through it. 80 respondents also classified the continued allowances during the period of paternity leave as not important.
4.2.4 Learning and development and Employee retention:
In the category of learning and development, I tested three variables, i.e. tuition discounts, tuition reimbursements and study
leave. 72 said tuition reimbursement was important while 19 said it was not important. Under tuition discounts, 42 said it was
important while 35 said it was not important. 44 respondents classified study leave as important while 33 said it was not an
important factor. This showed that tuition reimbursement was the most preferred component under learning and development
in employee retention.
Part C of the questionnaire requested respondents to indicate which reward categories has the greatest impact in retaining
employees. Respondents were requested to select only one of five categories. The results are reflected in Table 9 below.
Table 9: Part C - Retention Rank Order
Rank order Reward category Frequency %
1 Learning and development 42 44.2%
2 Job security 20 21.5%
3 Job flexibility 13 13.7%
4 Paternity leave 11 10.5%
5 Financial rewards 10 10.1%
Total 95 100%
Fig.3 Retention rank order
As can be seen from the table above and figure above, Learning and development had 42 respondents naming it number one
retention factor which was contributing to 44.2% of the population. Job security was chosen by 20 respondents as their main
retention factor making it number 2, job flexibility was chosen by 13 respondents , paternity leave was chosen by 11
respondents and financial rewards was chosen by 10 respondents. This led to financial rewards being ranked number 5 and the
last among the variables as a retention factor.
Opportunities
Tuition Reimbursement 9.5% (9) 10.5% (10) 41.1% (39) 34.7% (33) 4.2% (4)
Tuition Discounts 10.5% (10) 26.3% (25) 24.3% (23) 20.0% (19) 18.9% (18)
Study leaves 10 % (10) 26.1% (23) 27.3% (25) 20.0% (19) 18.9% (18)
0
10
20
30
40
50
Frequency
Learning and development
Job security
Job flexibility
Paternity leave
Financial rewards
International Journal of Management and Commerce Innovations ISSN 2348-7585 (Online) Vol. 3, Issue 1, pp: (240-254), Month: April 2015 - September 2015, Available at: www.researchpublish.com
Page | 250 Research Publish Journals
Part D of the questionnaire assessed individual preferences for different reward categories. Respondents were requested to
rank their individual preferences from 1 to 5, with 1 being the most preferred and 5 the least preferred.
The results of the analysis are indicated in Table 10 below.
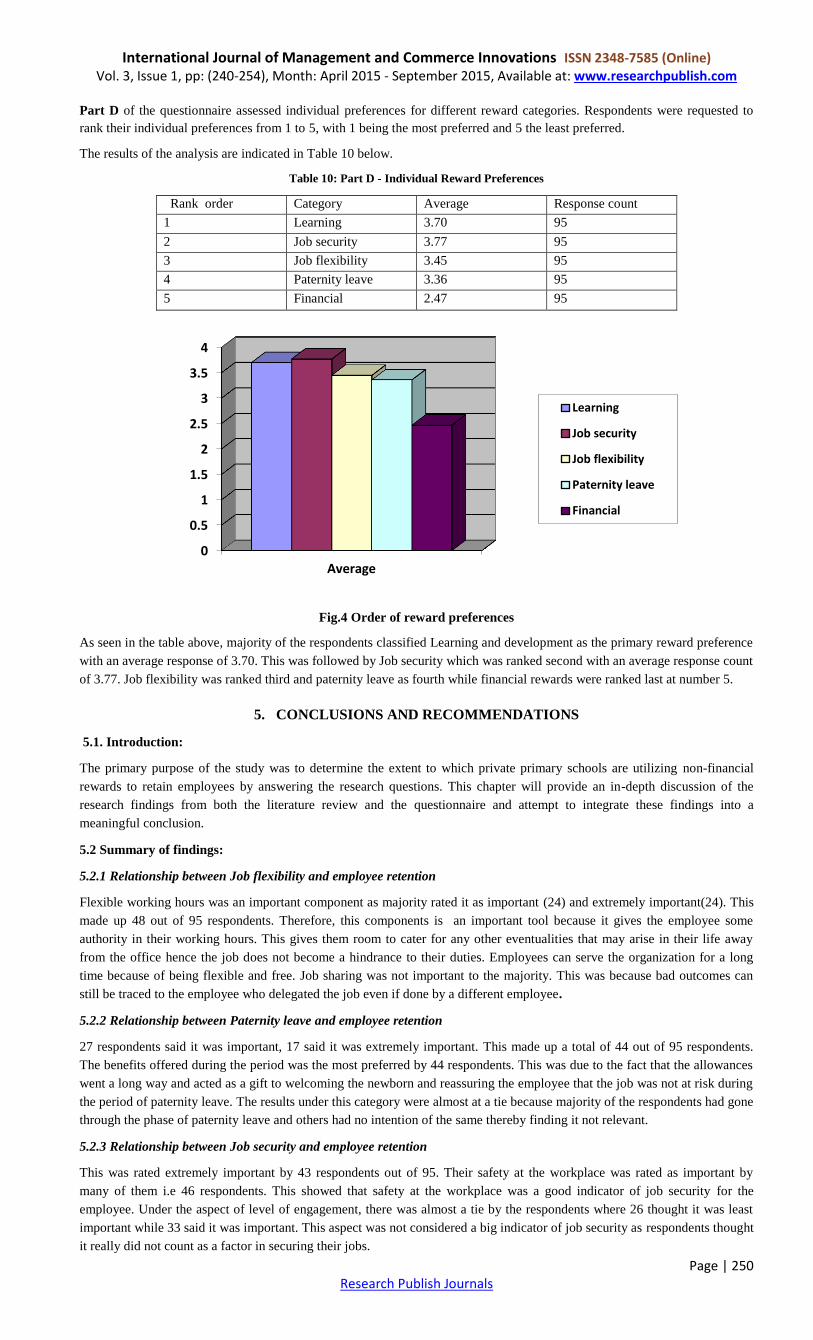
Table 10: Part D - Individual Reward Preferences
Rank order Category Average Response count
1 Learning 3.70 95
2 Job security 3.77 95
3 Job flexibility 3.45 95
4 Paternity leave 3.36 95
5 Financial 2.47 95
Fig.4 Order of reward preferences
As seen in the table above, majority of the respondents classified Learning and development as the primary reward preference
with an average response of 3.70. This was followed by Job security which was ranked second with an average response count
of 3.77. Job flexibility was ranked third and paternity leave as fourth while financial rewards were ranked last at number 5.
5. CONCLUSIONS AND RECOMMENDATIONS
5.1. Introduction:
The primary purpose of the study was to determine the extent to which private primary schools are utilizing non-financial
rewards to retain employees by answering the research questions. This chapter will provide an in-depth discussion of the
research findings from both the literature review and the questionnaire and attempt to integrate these findings into a
meaningful conclusion.
5.2 Summary of findings:
5.2.1 Relationship between Job flexibility and employee retention
Flexible working hours was an important component as majority rated it as important (24) and extremely important(24). This
made up 48 out of 95 respondents. Therefore, this components is an important tool because it gives the employee some
authority in their working hours. This gives them room to cater for any other eventualities that may arise in their life away
from the office hence the job does not become a hindrance to their duties. Employees can serve the organization for a long
time because of being flexible and free. Job sharing was not important to the majority. This was because bad outcomes can
still be traced to the employee who delegated the job even if done by a different employee.
5.2.2 Relationship between Paternity leave and employee retention
27 respondents said it was important, 17 said it was extremely important. This made up a total of 44 out of 95 respondents.
The benefits offered during the period was the most preferred by 44 respondents. This was due to the fact that the allowances
went a long way and acted as a gift to welcoming the newborn and reassuring the employee that the job was not at risk during
the period of paternity leave. The results under this category were almost at a tie because majority of the respondents had gone
through the phase of paternity leave and others had no intention of the same thereby finding it not relevant.
5.2.3 Relationship between Job security and employee retention
This was rated extremely important by 43 respondents out of 95. Their safety at the workplace was rated as important by
many of them i.e 46 respondents. This showed that safety at the workplace was a good indicator of job security for the
employee. Under the aspect of level of engagement, there was almost a tie by the respondents where 26 thought it was least
important while 33 said it was important. This aspect was not considered a big indicator of job security as respondents thought
it really did not count as a factor in securing their jobs.
0
0.5
1
1.5
2
2.5
3
3.5
4
Average
Learning
Job security
Job flexibility
Paternity leave
Financial
International Journal of Management and Commerce Innovations ISSN 2348-7585 (Online) Vol. 3, Issue 1, pp: (240-254), Month: April 2015 - September 2015, Available at: www.researchpublish.com
Page | 251 Research Publish Journals
5.2.4 Relationship between learning and development and employee retention
In this category, respondents rated tuition reimbursement as a preferred component in employee retention with 39 respondents
rating it as important and 33 as extremely important component. This made up a total of 72 respondents out of 95. This was
the category with the highest number of respondents choosing it as a factor of employee retention. Employees felt that their
growth was important in their career prospects and also for promotion purposes in their places of work.
5.3 Conclusion:
From the results of the research, non-financial rewards took dominance as a factor of employee retention. This was indicated
by the table 9 where majority rated learning and developments as number 1 and job security as number 2. Financial rewards
were number 5 and were not a motivator in retaining the employees. This clearly shows that financial rewards can attract
employees but can not retain them for long. Employees in most of the schools indicated they have been transferring from one
school to another after 5 years due to the need for growth and the threat of loosing the job in future especially in private
institutions. Guaranteed Remuneration is offered as an attraction mechanism and employees view the same as the primary
factor in their decision to join but not to retain them.
5.4 Recommendations:
Given the context and results of this study, it is safe to say that there is a place for non-financial rewards. It is recommended
that organizations continually review their reward practices to ensure alignment with the potential impact of changes
in the macro environment and to make allowance for different requirements based on the demographic factors of
their employees. The fact that most of the employees differed in their opinions of some rewards like paternity leave shows that
different employees have different needs and some rewards may not satisfy them therefore, an employer should diversify their
rewards to include the different demographics of his employees.
5.5 Suggestions for Further Research:
The study suggests that non-financial rewards have a dominant place in rewarding employees. However, given the size
of the sample and possible impact of the economic downturn, further investigation is warranted. Hence, further studies could
look at retesting these results by using a bigger sample in less demanding economic circumstances.
APPENDIX - A
QUESTIONNAIRE:
This research is meant for academic purposes. It will try to find out the influence of non-financial reward systems on
Employee retention in private schools in Kenya. You are requested to kindly provide answers to these questions as honestly
and precisely as possible. Responses to these questions will be treated as confidential.
Part A.
Demographic Profile:
1. Please tick your Gender
Male Female
2. Please tick your racial group
African White Indian
3. Please tick your age
18-29 50 – 59 30 – 39 40 – 49 60+
4. What is your highest qualification?
Degree Diploma Post graduate
Job Profile:
1. Please tick your Job position.
Principal Deputy principal Teacher
2. How long have you been working for your current employer?
0-2 yrs 5-10 yrs 2-5 yrs 10 yrs+
3. Are you provided with any non-financial rewards in your job?
Yes No Don‟t Know
4. Do you desire to be provided with non-financial rewards in your work?
Yes No Not applicable
International Journal of Management and Commerce Innovations ISSN 2348-7585 (Online) Vol. 3, Issue 1, pp: (240-254), Month: April 2015 - September 2015, Available at: www.researchpublish.com
Page | 252 Research Publish Journals
Part B: Reward Preferences.
The following questions are aimed at determining how important rewards are to you. Please indicate your preference on the 1
to 4 scale provided. 1= not important while 4 means extremely important. Please tick the appropriate box.
1. Not important 2. Least important 3. Important 4. Extremely important
Job Flexibility
Flexible working hrs
Job sharing
Job Security
Level of engagement
Paternity leave
Continued allowances
Learning and development
Tuition reimbursement
Tution discounts
Study leave
PART C. Individual’s perspective on retention.
Please indicate which of the following non-financial rewards has the greatest impact in retaining your services to the
organization. Please tick only one category.
Financial rewards
Job security
Job flexibility
Learning and development
Paternity leave
Part D. Individual preference for reward categories.
If you have the opportunity to structure your own reward package, which categories are the most preferred to you? Please rank
your preferences from 1 to 4: 1= most preferred; 4= least preferred. Indicate the numbers 1 to 6 in each category. A number
may not be used more than once.
1. Most prefered 2. Prefered 3. Not prefered 4. Least prefered
Job flexibility
Job security
Paternity leave
Learning and development
REFERENCES
[1] Aghazadeh, S.-M. (2003). The Future of Human Resource Management. Work Study, 52 (4), 201-207.
[2] Armstrong, M. (2006). A Handbook of human Resources Management Practice (10th Edition ed.). United Kingdom:
Cambridge University Press.
[3] Armstrong, M., & Brown, D. (2006). Strategic Reward: Making it Happen. USA: Kogan Page Limited.
[4] Arnolds, C., & Venter, D. (2007). The Strategic Importance of Motivational Rewards for Lower-Level Employees in
The Manufacturing and Retailing Industries. South African Journal of Industrial Psycohlogy, 33 (3), 15-23.
[5] B.M.T. (2008). Mixing Cash and Noncash Rewards. Workforce Management, 87 (15).
[6] Bartol, K., & Srivastava, A. (2002). Encouraging Knowledge Sharing: The role of organisational reward systems.
Journal of Leadership & Organisational Stidies, 9 (1), 64-76.
[7] Barwise, P., & Meehan, S. (2004). Simply Better: Winning and Keeping Customers by delivering what Matters most.
Boston: Harvard Business School Press.
[8] Bryman, A., & Cramer, D. (1997). Quantitative Data Analysis. United States of America: Routledge.
International Journal of Management and Commerce Innovations ISSN 2348-7585 (Online) Vol. 3, Issue 1, pp: (240-254), Month: April 2015 - September 2015, Available at: www.researchpublish.com
Page | 253 Research Publish Journals
[9] Bussin, M. (2003). Factors Driving Changes To Remuneration Policy and Outcomes. Ph.D. thesis. Johannesburg:
University of Johannesburg.
[10] Bussin, M. (2008). Remuneration Trends. Rosebank: 21st Century Pay Solutions Group.
[11] Bussin, M., & Fletcher, S. (2008). Managing the Generation Mix. Rosebank: 21st Century Pay Solutions Group.
[12] Bussin, M., & Moore, A. (2009). Reward Preferences for Generations in Selected ICT Companies. University of
Johannesburg, Department of Human Resources. Johannesburg: University of Johannesburg.
[13] Chaing, F. F., & Birch, T. A. (2008). Achieving task and extra-task-related behaviours: A case of gender and position
differneces in the perceived role of rewards in the hotel industry. International Journal of Hospitality Management, 491-
503.
[14] Chiu, R., Luk, V., & Tang, T. (2002). Retaining and Motivating Employees - Compensation preferences in Hong Kong
and China. Personnel Review, 31 (4), 402-431.
[15] Corporate Leadership Council. (2002b). Customizing The Employment Offer -Understanding Employee Job Offer
Preferences Across The Workforce. Washington DC: Corporate Executive Board.
[16] Corporate Leadership Council. (2002a). The Compelling Offer Revisited: Changes In Employee Preferences Over Time.
Washington DC: Corporate Executive Board.
[17] Corporate Leadership Council. (1999a). Understanding Employee Values. Corporate Executive Board. Washington DC:
Corporate Executive Board.
[18] De Winnaar, J. (2008). Employee Behaviour towards Pay-For-Performance In A Collections Environment of A
Financial institution. Gordon Institute of Buisness Science, University of Pretoria. Johannesburg: Gordon Institute of
Buisness science.
[19] Dockel, A., Basson, J., & Coetzee, M. (2006). The Effect of Retention Factors on Organisational Commitement: An
Investigation of High Technology Employees. South African Journal of Human Resources Management, 4 (2), 20-28.
[20] Employee Benefits Magazine.(2007, July).Total Reward - Interview: Defining a new era of benefits. Employee Benefits,
p.S.3.
[21] Ferguson, R., & Brohaugh, B. (2009). The Talent Wars. Journal of Consumer Marketing, 26 (5), 358-362.
[22] Giancola, F. (2008). Should Generation Profiles Influence Rewards Strategy? Employee Relations Law Journal, 34 (1),
56-64.
[23] Gross, S. E., & Friedman, H. M. (2004). Creating an Effective Total Reward Strategy: holistic Approach Better Supports
Buisness Success. Benefits Quarterly, 3.
[24] Haynes, D. (2002). Assessing Existing Remuneration Strategies of Medical Representatives in South Africa. MBA
Thesis, Gordon institute of Business Science, University of Pretoria, Johannesburg.
[25] Herman, J., & Gioia, J. (2000). How to Become An Employer of Choice. Oakhill Press.
[26] Herzberg, F. (1987). One More Time - How Do You Motivate Employees? Harvard Business Review, 65 (5), pp. 109-
120.
[27] Hijazi, S., Anwar, A., & Mehbood, S. (2007). Impact of Non-Financial Rewards on Employee Motivation. The Business
Review, 7 (2), pp. 272-277.
[28] Hiles, A. (2009). Tough Times Demand Focus - Total Rewards Strategy. Benefits Quarterly, 44-47.
[29] Kerr-Phillips, B., & Thomas, A. (2009). Macro and Micro Challenges For Talent Retention in South Africa. South
African Journal of Human Resources Management, 7 (1), 1-10.
[30] Lawler, E. (1996). Team, Pay and Business Strategies: Fnding the best mix to achieve competitive advantage. Amarican
Compensation Asscociation Journal, 12-24.
[31] Mahaney, R., & Lederer. (2006). the Effect of Intrinsic and Extrinsic Rewards for Developers on Information Systems
Project Success. Project Management Journal, 37 (4), 42-54.
[32] Manolopoulos, D. (2008). An evaluation of employee motivation in the extended public sector in Greece. Employee
Relations, 30 (1), 63-85.
[33] Matsumura, R., & Kobayashi, N. (2008). Are Increased Costs Worth Paying to Raise Non-Monetary Utility? Analysis of
Intrinsic Motivation and Fringe Benefits. International Transactions In Operational Research, 15, 705-715.
[34] McArthur, D. (2009). The Reward Challenges Facing South African Business From A Manager's Perspective. MBA.
thesis,. Johannesburg: Gordon Institue of Business Science.
[35] Morgan, S., Reichert, T., & Harrison, T. (2002). From Numbers to Words. United States of America: A Pearson
Education Company.
[36] Munsamy, M., & Venter, A. (2009). Retention Factors of Management Staff In The Maintenance Phase of Their Career
In Local Government. South African Journal of Human Resource Management, 7 (1), 187-195.
International Journal of Management and Commerce Innovations ISSN 2348-7585 (Online) Vol. 3, Issue 1, pp: (240-254), Month: April 2015 - September 2015, Available at: www.researchpublish.com
Page | 254 Research Publish Journals
[37] Nienaber, R. (2009, November). The Relationship between Personality Types and Reward Preferences. Ph.D. thesis,.
Johannesburg: University ofJohannesburg.
[38] Norusis, M. (2005). Statistical Procedures Companion. New Jersey: Prentice Hall. Osterloh, M., Frost, J., & Rota, S.
(2001). Solving Social Dilemas: The Dynamics of Motivation in the Firm. Paper, University of Zurich.
[39] Parker, O., & Wright, L. (2001). The Missing Link: Pay and Employee Commitment. Ivey Business Journal, 65 (3), 70-
79.
[40] Rynes, S., Gerhart, B., & Minette, K. (2004). The Importance of Pay In Employee Motivation: Discrepancies Between
What People Say and What They Do. Human Resource Management, 43 (4), pp. 381-394.
[41] Schepers, J. (Undated). The Power of Multiple Battery Factor Analysis on Overcoming The Effects of Differential
Skewness of Variables. University of Johannesburg. Unpublished Paper.
[42] Stander, M., & Rothmann, S. (2008). The Relationship between Leadership, Job Saticfaction and Organisational
Commitement. South African Journal of Human Resource Management, 7 (3), 7-13.
[43] Tang, T., Luna-Arocas, R., Sutarso, T., & Tang, D. (2004). Does the love of money mpderate and mediate the income-
pay satisfaction relationship? Journal of Managemet Psychology, 19 (2), 111-135.
[44] Thomas, K. (2000, October). Intrinsic Motivation and How it Works. Training, 37 (10), pp. 130-135.
[45] Thomas, K. (2009, Nov/Dec). The Four Intrinsic Rewards that Drive Employee Engagement. Ivey Business Journal
Online, pp. 1-6.
[46] WorldatWork. (2007). The WorldatWork Handbook of Compensation, Benefits and Total Rewards. Hoboken, New
Jersey: John Wiley and Sons, Inc.
[47] Zikmund, W. G. (2003). Business Research Methods. Ohio, United States of America: South-Western.
[48] Zingheim, P., & Schuster, J. (2007). High Performance Pay. USA: WorldatWork Press.
[49] Zobal, C. (1999).The "ideal" team compensation system - an overview part II.Team Performance Management, 5, 25-45.