Embed Size (px)
Citation preview

Australasian Accounting, Business and FinanceJournal
Volume 11 | Issue 2 Article 3
Non-Financial Risk Disclosure: The Case of theUK’s Distressed BanksIsmail AdelopoBristol Business School, Bristol UK, [email protected]
Follow this and additional works at: http://ro.uow.edu.au/aabfjCopyright ©2017 Australasian Accounting Business and Finance Journal and Authors.
Research Online is the open access institutional repository for the University of Wollongong. For further information contact the UOW Library:[email protected]
Recommended CitationAdelopo, Ismail, Non-Financial Risk Disclosure: The Case of the UK’s Distressed Banks, AustralasianAccounting, Business and Finance Journal, 11(2), 2017, 23-42. doi:10.14453/aabfj.v11i2.3

Non-Financial Risk Disclosure: The Case of the UK’s Distressed Banks
AbstractThis study investigates the narratives risk disclosures of the four British financial institutions that wereadversely affected during the 2008 banking crisis. This investigation uses content analysis with the aid ofConcordance software to explore the risk disclosure of these companies for the period 1998-2008. Riskdisclosures in the Business Review sections of the annual reports of the banks were analysed into their historicand forward looking contents, and current firm performance was measured with respect to earnings per share(EPS) and dividend, while future performance was measured by growth in EPS, and positive time lag in EPS.
Consistent with its predictions, the study found a significant negative relationship between the extent ofhistoric narrative disclosures and current and future firm performance, and a significant positive relationshipbetween forward looking narrative risk disclosures and both current and future firm performance. Additionalanalysis shows that optimistic and pessimistic narrative risk disclosures are not significant in explainingcurrent and future firm performance for these firms.
Findings from this study are important for users of the financial statements and regulators because theyhighlight an opportunity to detect warning signals for companies at risk of collapse. The study adds to thegrowing number of empirical investigations that provide alternative approaches to understanding businessfailures.
KeywordsRisk Disclosure, Narratives, Business failures, Content Analysis, Panel Approach, Northern Rock;, Bradfordand Bingley, Royal Bank of Scotland, Halifax Bank of Scotland
This article is available in Australasian Accounting, Business and Finance Journal: http://ro.uow.edu.au/aabfj/vol11/iss2/3

Non-Financial Risk Disclosure: The Case of the UK’s Distressed Banks Ismail Adelopo1 Abstract This study investigates the narratives risk disclosures of the four British financial institutions that were adversely affected during the 2008 banking crisis. This investigation uses content analysis with the aid of Concordance software to explore the risk disclosure of these companies for the period 1998-2008. Risk disclosures in the Business Review sections of the annual reports of the banks were analysed into their historic and forward looking contents, and current firm performance was measured with respect to earnings per share (EPS) and dividend, while future performance was measured by growth in EPS, and positive time lag in EPS. Consistent with its predictions, the study found a significant negative relationship between the extent of historic narrative disclosures and current and future firm performance, and a significant positive relationship between forward looking narrative risk disclosures and both current and future firm performance. Additional analysis shows that optimistic and pessimistic narrative risk disclosures are not significant in explaining current and future firm performance for these firms. Findings from this study are important for users of the financial statements and regulators because they highlight an opportunity to detect warning signals for companies at risk of collapse. The study adds to the growing number of empirical investigations that provide alternative approaches to understanding business failures. JEL Classification: M40 Keywords: Risk Disclosure; Narratives; Business failures; Content Analysis; Panel Approach, Nothern Rock; Bradford and Bingley; Royal Bank of Scotland; Halifax Bank of Scotland
1 Bristol Business School, Bristol U.K. [email protected]

AABFJ | Volume 11, no. 2, 2017
24
1. Introduction
There are an increasing number of studies addressing behavioural finance issues including, for example, impression management (Garcia Osman and Guillamon-Saorin, 2011; Godfrey et al., 2003; Aerts, 2005), narrative tones (Clatworthy and Jones, 2003; Smith and Taffler, 2000; Hooghiemstra, 2000), management optimism and overconfidence (Campbell et al., 2011; Doukas and Petmezas, 2007; Trevelyan, 2008; Hussainey et al., 2003). These areas of finance research are receiving increased attention as it is becoming obvious that non-financial information is also important in understanding management intentions and decision making. Although the financial crisis has been the focus on many studies, no recent study has considered the risk disclosure dimensions of this period and their information content, especially the performance related signals in the risk disclosure of the distressed UK banks.
This study examined the case of the four UK banks that were distressed during the rare and relatively (since 1866; run on Overend Gurney) unprecedented events of the banking crisis and the symbolic “Banking Run” of 2007 in the UK. The financial crisis has had far reaching implications on various aspects of finance and financial managements including, for example, banking and financial regulation, investment and financing decisions, and risk management (House of Commons, 2009). Consistent with previous studies that have addressed the recent financial crisis (Shin, 2009; Congdon et al., 2009; Hall, 2008; Chick, 2008; Lastra, 2008; Acharya et al., 2009; Goddard et al., 2009), this study adopts a case study approach which necessarily restricts the observations for the investigation although it may not prevent meaningful empirical analysis as it allows an in-depth analysis of limited number of observations (Seawright and Gerring, 2008).
The focus of analysis in this investigation is on the non-financial narrative information in the risk disclosure contained in the Business Review section of the annual reports of Northern Rock, Bradford and Bingley, Halifax Bank of Scotland and Royal Bank of Scotland. The main issue addressed in this paper is the features of the risk disclosure by these banks and whether there are credible signals about their distress in the non-financial narratives in their annual reports. The rest of the paper is structured as follow; section 2 discusses the Banking Crises in the UK. Section 3 presents the literature review and hypotheses. Section 4 presents the methodology. Section 5 presents results and analysis of findings. Section 6 concludes the paper and identifies opportunities for future research
2. The UK Banking Crisis The UK has a long and well-established banking history that dates back centuries and one of the most concentrated banking sectors with the four biggest banks accounting for about 85% of the small lending market (Liikanen, 2012). Table 1 below shows the market capitalisations of the UK banks in the FTSE 100 index during and after the financial crisis. The FTSE 100 represents 85% of the total market capitalisation of the companies listed on the London Stock Exchange. The five biggest banks (which used to be 10 biggest Major British Banking Group and used to consist of the nine institutions in Table 1 below plus Abbey National but now essentially consist
Adelopo | Non-Financial Risk Disclosure: The case of UK Distressed Banks
25
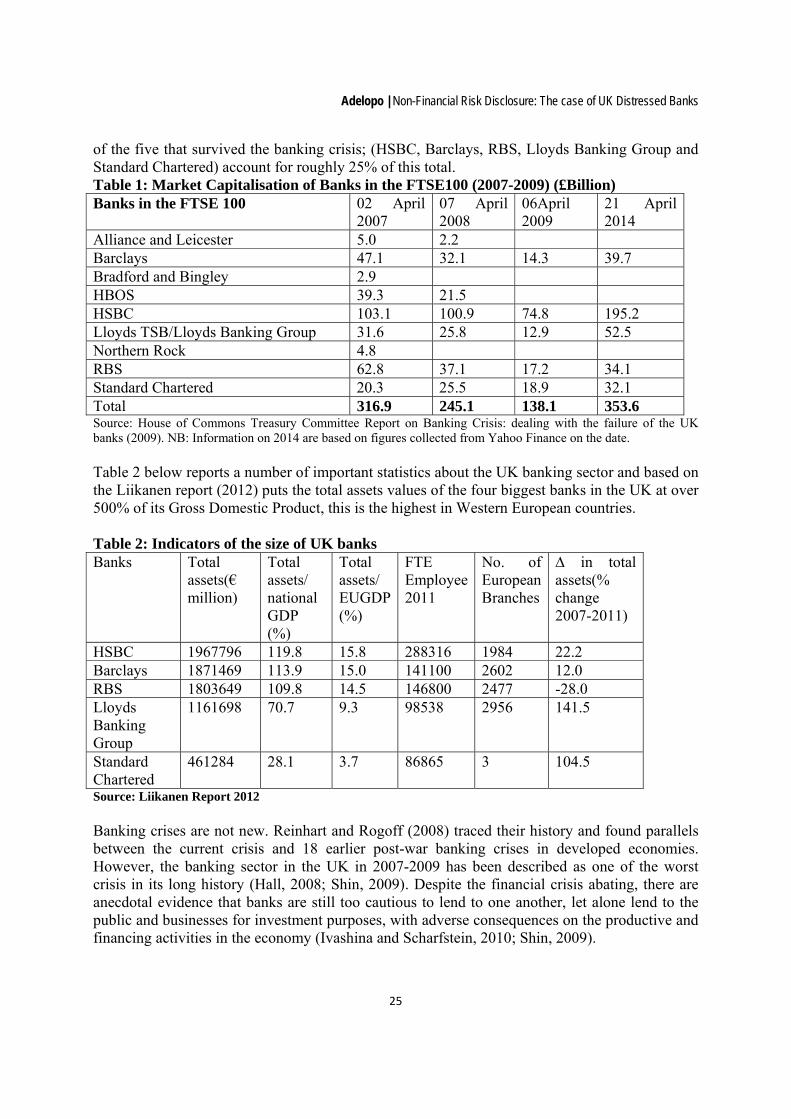
of the five that survived the banking crisis; (HSBC, Barclays, RBS, Lloyds Banking Group and Standard Chartered) account for roughly 25% of this total. Table 1: Market Capitalisation of Banks in the FTSE100 (2007-2009) (£Billion) Banks in the FTSE 100 02 April
2007 07 April 2008
06April 2009
21 April 2014
Alliance and Leicester 5.0 2.2 Barclays 47.1 32.1 14.3 39.7 Bradford and Bingley 2.9 HBOS 39.3 21.5 HSBC 103.1 100.9 74.8 195.2 Lloyds TSB/Lloyds Banking Group 31.6 25.8 12.9 52.5 Northern Rock 4.8 RBS 62.8 37.1 17.2 34.1 Standard Chartered 20.3 25.5 18.9 32.1 Total 316.9 245.1 138.1 353.6 Source: House of Commons Treasury Committee Report on Banking Crisis: dealing with the failure of the UK banks (2009). NB: Information on 2014 are based on figures collected from Yahoo Finance on the date. Table 2 below reports a number of important statistics about the UK banking sector and based on the Liikanen report (2012) puts the total assets values of the four biggest banks in the UK at over 500% of its Gross Domestic Product, this is the highest in Western European countries. Table 2: Indicators of the size of UK banks Banks Total
assets(€ million)
Total assets/ national GDP (%)
Total assets/ EUGDP (%)
FTE Employee 2011
No. of European Branches
∆ in total assets(% change 2007-2011)
HSBC 1967796 119.8 15.8 288316 1984 22.2 Barclays 1871469 113.9 15.0 141100 2602 12.0 RBS 1803649 109.8 14.5 146800 2477 -28.0 Lloyds Banking Group
1161698 70.7 9.3 98538 2956 141.5
Standard Chartered
461284 28.1 3.7 86865 3 104.5
Source: Liikanen Report 2012
Banking crises are not new. Reinhart and Rogoff (2008) traced their history and found parallels between the current crisis and 18 earlier post-war banking crises in developed economies. However, the banking sector in the UK in 2007-2009 has been described as one of the worst crisis in its long history (Hall, 2008; Shin, 2009). Despite the financial crisis abating, there are anecdotal evidence that banks are still too cautious to lend to one another, let alone lend to the public and businesses for investment purposes, with adverse consequences on the productive and financing activities in the economy (Ivashina and Scharfstein, 2010; Shin, 2009).

AABFJ | Volume 11, no. 2, 2017
26
The glimpse of the crisis appeared in the late 2001 with wave of corporate collapse that affected the global economy. It was a surprise that the banking sector escaped unhurt, and there were predictions of the likely banking crisis if banks continued to use credit derivatives to offload their risks to the insurance and long term saving institutions (Hughes, 2002). Businesses continued as usual until the crisis in Northern Rock (Shin, 2009). The company’s troubles came to the fore when it sought support from the Bank of England to prop up its finances in the wake of its troubles from the US sub-prime market (Hall, 2008). The eventual collapse and bankruptcy filing was completed in 2007. Three other legendary UK financial institutions became significant victims of the banking crisis- Bradford and Bingley, Halifax Bank of Scotland, Royal Bank of Scotland. The rest of this section presents an analysis of the alleged causes of the distress in each of the four identified financial institutions. This is useful in designing the research methodology to be used in this study. Causes of the Banking Crisis Several causes have been adduced for the 2007 global financial crisis. Reinhart and Rogoff (2008) suggested that the crisis followed an historical pattern with initial housing market boom, increasing equity returns precipitating eventual market crash. These views have been re-echoed by the Governor of the Bank of England who said: “.... Investors, including banks, overlooked the fact that higher returns could be generated only by taking higher risks. As a result, money was lent on easier terms. That helped to push up further asset prices that had already risen as real interest rates were falling. It also led to an explosion in the size of the financial sector as new instruments were created to satisfy the search for yield. As well as lending to households and businesses, banks lent to other banks which bought ever more exotic instruments created by the financial system itself. The effect was to replicate the original risky loans many times over. Over the past five years, the balance sheets of many of the world’s largest banks more than doubled” (House of Common Treasury Committee Report on the Banking Crises, 2009:15) This quote summarises the core factors that may have led to the crisis. Firstly, the chase for high yield that was pursued vigorously at the expense of proper and robust risk management procedures. International financial liberalisation meant that there was an abundance of investment capital coming from Asia and other part of the globe, aggravating the quest for yields to meet the expectations of the investors (Acharya and Richardson, 2009). So much so, that they extended credits to less credit worthy persons and purposes. The resulting debt payment default in one part of the global financial market was highly contagious leading to imported credit crisis (Barrell and Holland, 2007). Secondly, in order to meet the extreme level of expected return, a number of complicated financial engineering through the use of derivatives and financial instruments were devised which inflated the net worth of many of these companies without the underlying assets to back the exponential growth in the balance sheets (Reinhart and Rogoff, 2008; Acharya and Richardson, 2009). A further complication in the system was the lack of clarity on the use and implications of these instruments making it difficult to regulate their use. Thirdly, and closely related to the earlier point, is the regulatory laxity and failures. The House of Common Treasury Committee report on the banking crisis criticised the regulatory authority for its failures and light touch approach to regulation of the financial sector.

Adelopo | Non-Financial Risk Disclosure: The case of UK Distressed Banks
27
Buiter (2007) suggested that the failure of the tripartite financial stability arrangement between the Treasury, the Bank of England and the Financial Service Authority may have been responsible for the financial crisis in the UK along other causes which he categorised to be both microeconomic and macroeconomic causes. The microeconomic causes include securitisation, flaws in the rating agencies’ business model and pro-cyclical behaviour in the financial system. The author noted the excessive global liquidity creation, and ex ante saving gluts as part of the macroeconomic causes of the crisis. The next subsection presents a brief historical perspectives on the four banks focusing on their susceptibility to the crisis. Northern Rock (NR) Northern Rock, was at a point before its collapse, the fifth largest mortgage lender in the UK (Hall, 2008), and was formed as a result of the merger between the Northern Counties Permanent Building Society and Rock Building Society in 1965 and became listed on the London Stock Exchange in the 1990s when it demutualised. Its main business model was built around mortgage lending as well the traditional banking services. Its growth was more through acquisitions. The company had enjoyed a reasonable level of success in the mortgage lending business until the problems in the Sub-prime market forced it to seek financial support from the Bank of England as the lender of last resort having found it impossible securing lending from other financial institution even at a penal rate. The decision to seek funding from the Bank of England sent a wrong signal to the market where depositors’ confidence was already low. This led to the first ‘run’ on any British bank in over a century (Shin, 2009). The excessive use of securitisation and reliance on the wholesale funding has been identified as part of the main causes of the bank’s problems couple with poor risk management procedures. Although the management of the company insisted that their business model was good and that they would have survived if they had got the lifeline sought from the Bank of England before the whole saga became a public knowledge (Hall, 2008). Bradford and Bingley (BB) Bradford and Bingley started as a building society in 1851 and operated as such until 2000 when it demutualised and was transformed into a public limited company (Marshall, 2013; House of Common Treasury Committee Report on the Banking Crisis, 2009). Its operations as a Public Limited Company ended on the 29th September 2008. Two main factors have been identified as being crucial in its collapse. First was its business model that was hinged on the self-certified mortgage business. A self-certified mortgage is a riskier type of mortgage used by borrowers who do not have credit history. Mortgage contracts are entered without any formal credit checking or formal proof of financial ability to meet the obligations of the mortgage. The arrangement is very popular in the US and has been variously referred to as the sub-prime market. The incentive to the lender is that it offers a higher return on mortgage loans. Although this business model had been instrumental in the growth of the company, it has also played a large part in its collapse. The other factor that has been identified as playing key part in the collapse of the company was the series of deals it entered with an American company- General Motor Acceptance Corporation (GMAC). These involved a mixed portfolio of around

AABFJ | Volume 11, no. 2, 2017
28
£650m that comprise buy-to let mortgages, self-certified and normal mortgages. The terms of the commitments were so restrictive that when the global economy turned on a backward slide, it was difficult for the management to renegotiate in response to the worsening global economic climate. With the slowdown in global economies, many borrowers were unable to meet up with their mortgage payments which brought significant strains on the company’s financial situation and eventually led to its collapse in September 2008 (House of Common Treasury Committee Report on the Banking Crisis, 2009) Halifax Bank of Scotland (HBOS) HBOS was formed in 2001 as a result of a merger between the oldest commercial bank in UK- the Bank of Scotland and Halifax, which was itself a product of another merger in 1997 between two demutualised building societies-the Halifax Benefit Building and Investment Societies (French et al., 2009). The company focuses on retail and corporate lending. However, management of the company admitted that the core model of the business was on the corporate lending. It emerged from the House Committee reports on the banking crisis that while the retail part of the business was profitable, the company’s doom has been shaped more by over reliance on wholesale funding. Furthermore, the poor attitude to risk management within the organisation has also been identified as one of the key factors that led to its share of the banking crisis. Royal Bank of Scotland (RBS) RBS was founded in 1727 and had grown both organically and through series of acquisitions. In 2000, it acquired NatWest as well as the US mortgage lender Greenwich Capital which eventually exposed RBS to the US sub-prime mortgage market. The collapse of RBS was more to do with its purchase of the Dutch Bank ABN Amro in 2007 against all warnings from the Bank of England and concerns from within the organisation. The lack of due diligence on the purchase and over optimism of the economic climate and market trends were huge mistakes that have been admitted by the management in hindsight. The overarching reason for the collapse of this banking giant was poor risk management and excessive leverage (House of Common Treasury Committee Report on the Banking Crisis, 2009). An important point to draw from the analyses above is that poor business model, and more importantly, poor risk management approaches played significant part in the banking crisis and specifically in the cases of the four financial institutions that were significantly affected. In the next section, the study presents the hypotheses and explains the methodology used.
3. Literature review Previous studies (Abrahamson and Amir, 1996; Schleicher et al., 2007) have shown that investors rely on the information in the annual report for investment decisions and for its predictive potentials. It is therefore important that information in the annual report is decision useful. This could be achieved by having more forward-looking information on which various users of the annual report can base their decisions (Beattie et al., 2004). Studies have also examined specific parts of the annual report and their decision usefulness. For instance, Mayew et al. (2015) used textual disclosure in the Management Discussion and Analysis (MDandA) to predict firms’ ability to continue as a going concern for a sample of US

Adelopo | Non-Financial Risk Disclosure: The case of UK Distressed Banks
29
listed companies. Bryan (1997) examined the information content of the Management Discussion and Analysis (MDandA) as a basis for predicting firms’ future short-term performance. Tennyson et al. (1990) used content analysis of narratives in the annual report for bankruptcy predictions. Smith and Taffler (2000) used content analysis to study the chairman’s statement in the annual report. They examined the relationship between the content of the chairman’s statement and incidence of firm failures. They found that the chairman’s statement is able to classify firm as subsequently bankrupt or non-failed with a very high degree of accuracy. Previous studies have also explored the use of non-quantitative and narrative information in the annual reports as a basis for business failures prediction models. Schleicher et al. (2007) reviewed the annual reports of a sample of UK companies for forward-looking disclosure that was used as a basis for understanding the relationship between narratives in the annual reports of loss making firms and share price anticipation of earnings. This is similar to Davis et al.’s (2006) study on whether managers use optimistic and pessimistic languages in earnings press releases to provide information about expected future performance to the market, and whether the market responds to such languages. They found positive association between optimistic language usage and future firm performance, and negative association between pessimistic language in earning releases and future firm performance. This implies that positive and optimistic languages are correlated with better performance and negative and pessimistic languages are correlated with poor performance. Extant risk disclosure studies have focused, and rightly so, on risk disclosure orientation in terms of forward looking vs. historical (Dobbler et al., 2011), good vs. bad news (Linsley and Shrives, 2006) and whether risk disclosure is voluntary or mandatory (Elshandidy and Neri, 2015), and other have examined risk disclosure generally, including the impacts of corporate governance (Elshandidy et al., 2013; Elzahar and Hussainey, 2012; Miihkinen , 2012; Ntim et al., 2013). However, not many studies have examined risk disclosures in the annual reports of UK banks and certainly not in the annual reports of the distressed banks during the recent financial crisis. This study examines the characteristics of the risk disclosures of four financial institutions that were distressed in the midst of the recent financial sector crisis. Addressing risk, and especially non-financial, disclosures in these companies enhances our understanding of the causes of the financial crisis from a different perspective compared to the popular approach in the literature where focus has been more on the systemic causes of the crisis, with little emphasis on the internal risk management dimensions. It is argued that there is a need to focus on how organisations manage their exposures to risks and how this is reflected in the annual reports. Based on the explanations above, and following studies (Beattie et al., 2004) that argued that historical information might be less useful for investment and financing decisions. In the same vein, some studies have suggested that management disclose such information to mask poor firm performance (Cho et al., 2010; Clatworthy and Jones, 2001; Beattie and Jones, 2000), this study hypothesise that historical non-financial risk disclosures are negatively related to current and future firm performance. Furthermore, based on previous studies that have (Li, 2010; Beretta and Bozzolan, 2008; Smith and Taffler, 2000) argued that more forward-looking information should be provided in the annual report. Thereby prevent management impression management given that previous studies

AABFJ | Volume 11, no. 2, 2017
30
have claimed that management are more forthright with good news rather than bad news (Kothari et al., 2009; Clatworthy and Jones, 2003), this study hypothesise that forward-looking risk disclosures are positively related with current and future firm performance. These hypotheses are presented below: Hypotheses H1: non-financial historical information in the risk disclosures are negatively related to current performance H2 non-financial forward looking information in the risk disclosures are positively related to current performance H3 non-financial historical information in the risk disclosures are negatively related to future performance H4 non-financial forward looking information in the risk disclosures are positively related to future performance In testing these hypotheses, the study explores a multiple method approach that integrates content analysis in a case study context with a panel analysis of the annual reports of the UK banks that were caught up in the financial crisis. The combinations of these methods allow an in-depth analysis that would not have been possible if cross sectional or only time series were examined. The next section presents the methodology used in this study.
4. Methodology In this section, the study provides a detailed explanation of the approach to content analysis. It is observed that there is a dearth of empirical study into narrative content of risk disclosure in annual reports. This study is the first to examine this for the four distressed banks in the UK. In order to test the hypotheses above, this study reviews the risk disclosure in the Business Review section of the annual reports of the four companies between 1998 and 2008. This provides a 34 firm-year sample. To enhance the analysis and reduced human errors, the Concordance software2 was used for textual analysis. This software is powerful in text-mining and analyses. Its main features include word counts, headwords manipulations, lemmatisation facility, Key Word In Context (KWIC) analysis, stop list, and collocation. First, the ‘stop list’ device was used to remove words that are not relevant in the analysis. They include personal pronouns such as He, She, It etc, and words that show articles e. A, An, The etc. Since the study objective relates to establishing relationship between firm performance and the content analysis of the narratives in the risk disclosures, time orientation dimension of disclosure
2 This is a software for text analysis which allows extensive in-depth analysis of text to gain greater insight. Further information on it can be found at: http://www.concordancesoftware.co.uk

Adelopo | Non-Financial Risk Disclosure: The case of UK Distressed Banks
31
was used. This involves analysing the narratives along their historical, forward-looking and other dimensions (Beattie et al., 2004). To analyse the content along historical dimension, the study explored the risk disclosures for keywords that suggested historical contexts. To facilitate this process, it used the ‘sort by ending word’ facility in the software. This arranged all the keywords so that the ending letters are alphabetically arranged. All words that end with letter ‘D’ were picked. The author ensured that they are verbs and are in their past tense. This is because most of the verbs in English language form their past tense by adding ‘ed’ at the end of the word. It was observed that some words end in ‘D’ but are not past tense. All such words were deleted; words that form their past tense by changing their structure were also searched and included. This process enabled us to categorise all remaining words as historical. Next, the study analysed the risk disclosures for forward-looking context. Hussainey et al. (2003) and Schleicher et al. (2007) suggested 35 words list that indicates a forward-looking context in a report. The current study builds on this by adding more words to this list. It generated a total of 46 forward-looking word lists that could indicate forward-looking context in a report. To enhance the analysis, these words were lammatised. A lemmatising facility enhanced consistency in search and analysis process; this is because words could be brought together under a particular heading and keyword search could be undertaken for all the words under the heading. From this process the study was able to analyse the content of the risk disclosure in the annual reports of these companies along both historical and forward looking dimensions. The study then calculated the rate of change in these pieces of information over the periods for which data are available. Studies (Korol, 2013; Sharma and Mahjan, 1980) have shown that failed businesses show sign of their hailing between a couple of (2-5) years before their failure and a year afterwards. This study therefore compares the rate of change in the pieces of information over these periods for each of the companies in this investigation. Next, the study describes its measure of current and future firm performance. Qiu et el. (2006) defined their firm future performance with reference to Return on Equity, Schleicher et al. (2007) used share prices as the basis for defining a firm’s future performance. This study uses two measurement bases for current and future firm performance; Dividend (DVND) and Earnings Per Share (EPS). Information on these variables were collected from the annual reports. To test the hypotheses, panel data approach with random model was used following confirmation of its suitability after Hausman test (Baltagi and Liu, 2008). A panel data combines the advantage of the cross-sectional and time series dimensions of an investigation. Thus, this allows us to examine the same variables for the same set of companies over different time period. The panel data model is formally stated as:
)1.........(......................................................................5
4321
itit
ititititoit
SETSINCOMETOAS
SETEQUITYTOASFIRMSIZEFWDHRICPERF
The current performance regression models are based on equation 1 above. Equation 2 below is used for the growth in future performance regression model.
)2..(................................................................................5
4321
itit
ititititoit
SETSINCOMETOAS
SETEQUITYTOASFIRMSIZEFWDHRICPERF

AABFJ | Volume 11, no. 2, 2017
32
The growths in each of the base measures for these periods were calculated as a proxy for future firm performance. This is formally stated as:
ΔX= t
tt
X
XX 1
……………………………………………(3) Where: Xt= represents our measure of performance for period t Xt+1= represent our measure of performance in period t+1 (a year later) Equation 3 below is the basis of the positive time lag future performance regression model.
)4....(................................................................................5
43211
itit
ititititoitt
SETSINCOMETOAS
SETEQUITYTOASFIRMSIZEFWDHRICPERF
5. Results Table 3 below presents the summary of the panel data profile. It shows the study is based on 34 firm years. Table 3: Panel Data Profile
Company Period Total HBOS 2001-2007 7years RBS 2001-2007 7years Northern Rock 1998-2008 11years Bradford and Bingley 2000-2008 9years 34 years
Table 4 presents the variables in the data and their definitions. Tables 5 and 6 present the descriptive statistics. Table 5 shows that on average there are more historical information in the risk disclosure of the companies investigated than forward information. Table 4: Variable Definition for all variables used in the study Variable Sign Definition FP Future performance in each of the years. Proxy with growth rate
in: DND= Dividend ΔDND= this is change in dividend and it is defined as the dividend for this year less last year’s dividend divided by last year’s dividend. EPS= Earnings Per Share which is given as net operating profit divided by outstanding shares in a firm. ΔEPS= is the change in the in EPS and it is defined as the EPS for this year minus EPS last year divided by EPS last year.
HRIC +ve Historical narratives information in the risk disclosures in the annual reports
FWD -ve Forward-looking narrative Information in the risk disclosure in

Adelopo | Non-Financial Risk Disclosure: The case of UK Distressed Banks
33
the annual reports OPT +ve Optimistic enhancing narrative information in the risk disclosures
in the annual reports PESS -ve Pessimistic enhancing narratives information in the risk
disclosures in the annual reports WORD +ve Total word count in the risk disclosure. FIRMSIZE Natural log of total assets EQUITYTOASSET Equity divided by total asset INCOMETOASSET Natural log of Net income divided by total assets LNASSET +ve Natural log of total asset in a firm With historical information being 310 words on the average compared to 191 words for forward looking information. Historical information also has higher level of variations compared to forward looking information as shown by the standard deviation figures. Pessimistic enhancing words are more on the average in the risk disclosure for these companies compared to optimistic enhancing words. The average total word disclosure for the companies in the study was 1465 words with the lowest being 717 words compared to the highest of 2231 words. Table 5: Descriptive Statistics for all variables used in the study Variable Obs. Mean Std. Dev. Min Max HRIC 34 310.559 131.355 124 510 FWD 34 191.000 117.821 39 398 OPT 34 98.382 59.748 11 250 PESS 34 127.294 47.849 24 201 WORD 34 1464.824 478.152 717 2231 DND 34 23.791 14.632 0 52.5 ΔDND 34 0.065 0.549 -1 2.61 EPS 34 57.176 48.183 -65.6 159.3 ΔEPS 34 0.115 1.097 -1.69 5.54 LNASSET 34 7.39 6.36 1 14.69 EQUITYTOASSET 34 2.29 1.5 0.46 5.22 INCOMETOASSET 34 2.58 2.06 0 4.50 Tables 6 shows that, on average, 21% of the content of the risk disclosure for the companies in this study are historical information, 12% are forward looking information, and 7% are optimistic enhancing words with 9% being pessimistic enhancing words. Table 6: Percentage of Word Categories in the Risk Disclosures Variable Obs. Mean Std. Dev. Min Max HRIC 34 20.683 3.610 15.21 28.12 FWD 34 12.175 5.240 4.97 26.40 OPT 34 7.330 4.163 1.61 15.96 PESS 34 9.081 3.046 1.08 15.67 Table 7 below presents the correlation matrix for the variables in the investigation. The high correlation between the total risk disclosures and historical risk disclosures are expected as this

AABFJ | Volume 11, no. 2, 2017
34
constitutes the larger proportion of risk disclosure for these companies similarly is the correlation between net income as a function of total asset and equity as a function of total asset as both have common denominator.
Table 7: Correlation matrix for all variables used in the study Variables 1 2 3 4 5 6 7 8 9 10 1 HRIC 1.00 2 FWD 0.83 1.00 3 OPT 0.16 -0.11 1.00 4 PESS 0.62 0.24 0.56 1.00 5 WORD 0.92 0.84 0.14 0.45 1.00 6 DVND 0.38 0.60 -0.25 -
0.04 0.50 1.00
7 EPS 0.14 0.39 -0.20 -0.14
0.29 0.64 1.00
8 LNASSET 0.29 0.21 -0.00 0.12 0.31 0.39 0.38 1.00 9 EQUITYTOASSET 0.06 -0.0 0.04 0.00 0.10 0.16 0.29 0.78 1.00 10 INCOMETOASSET -
0.02 -0.12 0.16 0.01 0.00 0.00 0.20 0.66 0.96 1.00
Table 8 below presents the first set of regression results relating to current performance and non-financial risk disclosures. The regressions show high R2 at 71% and 69% respectively for model 1 and model 2. The results (model 1 and model 2) show a significant negative relationship between narrative historical information and current period performance. These results are consistent for both definition of current period performance measures (Dividend and EPS). This supports hypothesis H1 indicating that these banks had more historical information when they were having poor performance and less when their performances were positive. Hypothesis H2 regarding the relationship between forward-looking information and current performance, the results of the regression show a significant positive relationship consistent with the prediction of this study. These results indicate that firms with more forward looking information are more likely to report positive current performance, thus supporting H2. The regression results in Table 8 also show that firm size and equity over asset, which is a measure of efficiency in capital utilisation, are increasing functions of current period performance but net income as a proportion of total asset is decreasing in current period performance. Table 8: Risk disclosure and current period performance Independent variable DVND EPS Model 1 Model 2 HRIC -0.04
-1.98** -0.17 -2.43**
FWD 0.09 3.96***
0.28 3.60***
LNASSET 1.14 2.79**
4.26 3.07***
EQUITYTOASSET 5.47 4.23***
18.99 4.31***

Adelopo | Non-Financial Risk Disclosure: The case of UK Distressed Banks
35
INCOMETOASSET -3.02
-2.81** -12.43 -2.68**
Constant 2.41 0.426
2.61 0.145
R2 71% 69% F-statistics 7.98*** 8.83*** Table 9 below presents the results of the regression testing the relationship between narrative risk disclosures and measures of future performance. The results show that when future performance was measured by a positive lag performance (model 3) there was no significant relationship between narrative risk disclosures and future firm performance. However, when future firm performance was measured with respect to growth in earnings per share, there was a significant negative relationship between narrative risk disclosures and future firm performance, consistent with the prediction in the study. These results therefore support hypothesis H3 but only when future performance was defined in terms of growth. Similarly, the regression results in model 4 Table 9 support hypothesis H4 of a significant positive relationship between forward looking narrative risk disclosures and future firm performance for the distressed banks. These results simply indicate that current period narrative risk disclosures can predict future period performance when this is measured in terms of growth in earnings per share. The result was not supported when future performance was defined in terms of dividend or profit before tax. Unlike models 1 and 2, the control variables are not all significant in models 3 and 4. In model 3, future performance was only positively related to size of the firm and capital utilisation but not with net income as a fraction of total assets. In model 4, future performance was only marginally related to capital utilisation in the firm. Table 9: Risk disclosure and future performance Dependent variable EPSt+1 ∆EPS Variables Model 3 Model 4 HRIC -0.15
-0.61 -1.96 -2.36**
FWD 0.15 0.80
1.04 2.45**
LNASSET 3.59 2.61**
0.02 0.92
EQUITYTOASSET 10.92 2.17**
0.23 1.84*
INCOMETOASSET -6.91 -1.50
-0.05 -0.54
Constant 0.512 1.69
0.33 0.411
R2 60% 19% F-Statistics 3.25*** 2.56**

AABFJ | Volume 11, no. 2, 2017
36
Additional analysis: Optimistic and Pessimistic Tone in Risk Disclosure Prasad and Mir (2002) argued that the annual report is a powerful tool that management uses to signal to the intended recipients of the information in it. Also Davis et al. (2008) analysed information in the annual reports to discover the optimistic and pessimistic language which was then used as a predictive basis. In addition to the analysis above, this study followed this intuition and analysed the risk disclosures in the annual reports of the distressed banks in the UK to explore the potential that management overtly or covertly sent either optimistic or pessimistic signals to the users of the information contained in it. Davis et al. (2008) categorised words that are positive in nature as being optimistic enhancing and words that are intrinsically negative as pessimistic enhancing. For example, while words such as revenue, profit, income, increase, improve etc. were categorised as optimistic enhancing, words such as costs, taxes, decreasing, minimal, ineffective, not, fall, downwards were categorised as pessimistic enhancing words (see appendix 1). These words were lemmatised and headword search conducted. These produced two categories labelled as optimistic and pessimistic enhancing respectively. The regression results in Table 10 below show that optimistic and pessimistic languages in narrative risk disclosure were not determinants of current and future firm performance (result for future performance not reported). Table 10: Optimistic and Pessimistic Tone in Narrative risk Disclosure Dependent variable DVND EPS Variables Model 1 Model 2 HRIC -0.082
-1.84* -0.22 -1.38
FWD 0.08 3.41***
0.18 1.77*
OPT 0.02 0.37
0.06 0.34
PESS 0.01 0.13
-0.15 -1.00
WORD 0.02 1.20
0.04 1.47
LNASSET 0.21 0.23
0.66 0.20
EQUITYTOASSET -0.72 -1.53
-2.75 -1.66
INCOMETOASSET 12.33 -1.33
48.4 1.47
Constant 3.41 0.636
-10.6 0.661
R2 62% 63% F-Statistics 41.02*** 39.2***
Adelopo | Non-Financial Risk Disclosure: The case of UK Distressed Banks
37
6. Conclusion and Future Research
This study explores the risk narratives disclosures in the business review section of the annual reports of the four financial institutions in the UK that were significantly affected by the 2007/8banking crisis. The study focused on this type of disclosure in this part of the annual report because it is under researched, and also because one of the common causes of distress in these institutions was poor risk management. This study found that there is more historical than forward looking information in the annual reports of these companies. Future firm performance was proxied with growth in earning per share, and a positive lag measure of EPS. Current period performance was proxied with dividend and earnings per share. The study found a significant negative relationship between current period historical narrative risk disclosure and current period performance. The study also reports a significant positive relationship between forward looking narrative risk disclosure and current period performance. In terms of future performance, only growth in earnings per share showed a significant relationship with narrative risk disclosures. Historical risk narrative showed a significant negative relationship with future performance and forward looking risk narrative showed a significant positive relationship with future performance proxied with growth in EPS. Both historical and forward looking narrative disclosures are not related to future performance when performance was defined in terms of dividend, profit before tax (these reported were not reported) and positive lag of EPS. The results in this study show that narrative risk disclosure has decision usefulness for different stakeholders, especially investors. It shows that current risk disclosures could be a veritable indicator of potential future performance of a company. Regulators should be interested in these results because they show the value relevance of the narrative risk disclosures and are thus consistent with the request for more forward looking disclosures by firms. The findings from this study also show that it is possible to identify warning signal in the narrative in annual reports and, therefore, the integrated reporting currently being proposed should include an integration of narrative disclosures.
Being exploratory research, the results from this study should be interpreted with caution because of the following limitations. First, the study adds to the number of studies attempting to provide an alternative approach to understanding business failures using narratives in the annual reports. This approach is evolving and therefore has inherent limitations. For example, the use of content analysis still needs further development to streamline its applications and reduce the subjectivity currently involved. The study adopts a case study approach that examines a specific event within a context; the UK banking sector following the banking crisis. It is likely that the result would be different if a different approach was used. This may involve banks from other jurisdictions. Studies undertaking this type of investigation will need to control for country effects which this current study did not consider. It may then be possible to use a bigger sample size and this may allow more general results to be generated which could lead to the generalisability of findings which is not possible with this study, and is not the purpose of this current investigation. The use of words, phrases, themes and sentences frequency as indicators of subject importance could be criticised as being a soft approach to measurement. Furthermore, application of a panel data approach to a small sample size may have affected our result. However, this has been corrected by reducing the number of explanatory variables to This study

AABFJ | Volume 11, no. 2, 2017
38
was not about the quality of risk disclosures, but about their characteristics. This is an important area that is under researched. Future studies could focus on the disclosure practices of listed companies comparing profitable with non-profitable companies. References Abrahamson, E. and Amir, E. (1996). The information content of the president's letter to
shareholders, Journal of Business Finance and Accounting, 23(8), 1157-82. https://doi.org/10.1111/j.1468-5957.1996.tb01163.x Acharya, V., Philippon, T., Richardson, M., and Roubini, N. (2009). The financial crisis of
2007‐2009: Causes and remedies. Financial Markets, Institutions and Instruments, 18(2), 89-137. https://doi.org/10.1111/j.1468-0416.2009.00147_2.x
Acharya, V. V., and Richardson, M. (2009). Causes of the financial crisis. Critical Review, 21(2-3), 195-210. https://doi.org/10.1080/08913810902952903
Aerts, W. (2005). Picking up the pieces: impression management in the retrospective attributional framing of accounting outcomes. Accounting, organizations and society, 30(6), 493-517. https://doi.org/10.1016/j.aos.2004.07.001
Baltagi, B. H., and Liu, L. (2008). Testing for random effects and spatial lag dependence in panel data models. Statistics and Probability Letters, 78(18), 3304-3306.
https://doi.org/10.1016/j.spl.2008.06.014 Barrell, R. and Holland, D. (2007). Banking Crises and Economic Growth, National Institute
Economic Review No.202, 34- 41. https://doi.org/10.1177/0027950107077120 Beattie, V., McInnes, B. and Fearnley, S. (2004). A methodology for analysing and evaluating
narratives in annual reports: a comprehensive descriptive profile and metrics for disclosure quality attributes. Accounting Forum, 28, 205-236.
https://doi.org/10.1016/j.accfor.2004.07.001 Beattie, V., and Jones, M. J. (2000). Impression management: the case of inter-country financial
graphs. Journal of International Accounting, Auditing and Taxation, 9(2), 159-183 https://doi.org/10.1016/S1061-9518(00)00030-6 Beretta, S., and Bozzolan, S. (2008). Quality versus quantity: the case of forward-looking
disclosure. Journal of Accounting, Auditing and Finance, 23(3), 333-376. Beynon, M.J., Clatworthy, M.A. and Jones, M. J. (2004). Prediction of Profitability Using
Accounting Narratives: A Variable – Precision Rough Set Approach, Intelligent Systems in Accounting, Finance and Management, 12(4), 227-242.
https://doi.org/10.1002/isaf.256 Bryan, S. H. (1997). Incremental information content of required disclosures contained in
management discussion and analysis. Accounting Review, 72(2), 285-301. Buiter, W.H. (2007), Lessons from the 2007 Financial Crises. A paper submitted to the UK
Treasury Select Committee. Campbell, T. C., Gallmeyer, M., Johnson, S. A., Rutherford, J., and Stanley, B. W. (2011). CEO
optimism and forced turnover. Journal of Financial Economics,101(3), 695-712. https://doi.org/10.1016/j.jfineco.2011.03.004 Chick, V. (2008). Could the crisis at Northern Rock have been predicted?: An evolutionary
approach,. Contributions to Political Economy, 27(1), 115-124. https://doi.org/10.1093/cpe/bzn007

Adelopo | Non-Financial Risk Disclosure: The case of UK Distressed Banks
39
Cho, C. H., Roberts, R. W., and Patten, D. M. (2010). The language of US corporate environmental disclosure. Accounting, Organizations and Society,35(4), 431-443.
https://doi.org/10.1016/j.aos.2009.10.002 Clatworthy, M., and Jones, M. J. (2003). Financial reporting of good news and bad news:
evidence from accounting narratives. Accounting and business research, 33(3), 171-185. https://doi.org/10.1080/00014788.2003.9729645 Clatworthy, M., and Jones, M. J. (2001). The effect of thematic structure on the variability of
annual report readability. Accounting, Auditing and Accountability Journal, 14(3), 311-326. https://doi.org/10.1108/09513570110399890
Congdon, T., Goodhart, C. A., Eisenbeis, R. A., Kaufman, G. G., Hamalainen, P., Lastra, R. M., and Taylor, M. W. (2009). The failure of Northern Rock-A Multidimensional Case Study. SUERF-The European Money and Finance Forum.
Davis, A. K., Piger, J. M. and Sedor, L. M. (2008). Beyond the Numbers: Managers' Use of Optimistic and Pessimistic Tone in Earnings Press Releases. AAA 2008 Financial Accounting and Reporting Section (FARS) Paper. Available at SSRN: http://ssrn.com/abstract=875399.
Dobler, M, Lajili, K, and Zéghal, D (2011) Attributes of Corporate Risk Disclosure: An International Investigation in the Manufacturing Sector', Journal Of International Accounting Research, 10, (2)1-22 https://doi.org/10.2308/jiar-10081
Doukas, J. A., and Petmezas, D. (2007). Acquisitions, Overconfident Managers and Self‐attribution Bias. European Financial Management, 13(3), 531-577.
https://doi.org/10.1111/j.1468-036X.2007.00371.x Elzahar, H. and Hussainey, K. (2012) Determinants of narrative risk disclosures in UK interim
reports, Journal of Risk Finance, 13, (2)133 – 147 https://doi.org/10.1108/15265941211203189 Elshandidy, T., and Neri, L. (2015). Corporate governance, risk disclosure practices, and
market liquidity: comparative evidence from the UK and Italy. Corporate Governance: An International Review, 23(4), 331-356. https://doi.org/10.1016/j.irfa.2013.07.010
Elshandidy, T., Fraser, I., and Hussainey, K. (2013). Aggregated, voluntary, and mandatory risk disclosure incentives: Evidence from UK FTSE all-share companies. International Review of Financial Analysis, 30, 320-333.
French, S., Leyshon, A., and Thrift, N. (2009). A very geographical crisis: the making and breaking of the 2007–2008 financial crisis. Cambridge Journal of Regions, Economy and Society, 2(2), 287-302. https://doi.org/10.1093/cjres/rsp013
Garcia Osma, B., and Guillamón-Saorín, E. (2011). Corporate governance and impression management in annual results press releases. Accounting, Organizations and Society, 36(4), 187-208. https://doi.org/10.1016/j.aos.2011.03.005
Godfrey, J., Mather, P., and Ramsay, A. (2003). Earnings and impression management in financial reports: the case of CEO changes. Abacus, 39(1), 95-123.
https://doi.org/10.1111/1467-6281.00122 Goddard, J., Molyneux, P., and Wilson, J. O. (2009). The crisis in UK banking. Public Money
and Management, 29(5), 277-284. https://doi.org/10.1080/09540960903205881 Hall, M. J. (2008). The sub-prime crisis, the credit squeeze and Northern Rock: the lessons to be
learned. Journal of Financial Regulation and Compliance,16(1), 19-34. https://doi.org/10.1108/13581980810853190

AABFJ | Volume 11, no. 2, 2017
40
Hooghiemstra, R. (2000). Corporate communication and impression management–new perspectives why companies engage in corporate social reporting. Journal of business ethics, 27(1-2), 55-68. https://doi.org/10.1023/A:1006400707757
House of Commons Treasury Committee Report on Banking Crisis: dealing with the failure of the UK banks (2009)
Hughes, C. (2002). So how come the banking sector is recession proof? The Independent on line available at www.independent.co.uk/news/business/analysis and features. [accessed on 06/06/13]
Hussainey, K., Schleicher, T. and Walker, M. (2003). Undertaking large-scale disclosure studies when AMIR-FAF ratings are not available: the case of prices leading earnings, Accounting and Business Research, 33(4.), 275-294.
Ivashina, V., and Scharfstein, D. (2010). Bank lending during the financial crisis of 2008. Journal of Financial economics, 97(3), 319-338.
https://doi.org/10.1016/j.jfineco.2009.12.001 Korol, T. (2013). Early warning models against bankruptcy risk for Central European and Latin
American enterprises. Economic Modelling, 31, 22-30. https://doi.org/10.1016/j.econmod.2012.11.017 Kothari, S. P., Shu, S., and Wysocki, P. D. (2009). Do managers withhold bad news? Journal of
Accounting Research, 47(1), 241-276. https://doi.org/10.1111/j.1475-679X.2008.00318.x Lastra, R. M. (2008). Northern Rock, UK bank insolvency and cross-border bank
insolvency. Journal of Banking Regulation, 9(3), 165-186. https://doi.org/10.1057/jbr.2008.12 Li, F. (2010). The Information Content of Forward‐Looking Statements in Corporate Filings—A
Naïve Bayesian Machine Learning Approach. Journal of Accounting Research, 48(5), 1049-1102. https://doi.org/10.1111/j.1475-679X.2010.00382.x
Liikanen, E. (2012). High-level Expert Group on reforming the structure of the EU banking sector. Final report. Available at: ec.europa.eu/internal_market/bank/docs/high-level.../report_en.(Accessed on 16 April 2014)
Linsley, P.M. and Shrives, P.J. (2005). Examining Risk Reporting in UK Public Companies, The Journal of Risk Finance, 6(4), 292-305. https://doi.org/10.1108/15265940510613633
Linsley, P.M., Shrives, P.J. and Crumpton, M. (2006). Risk Disclosure: An Exploratory Study of UK and Canadian Banks, Journal of Banking Regulations 7(3-4), 268-282
Marshall, J. N. (2013). A geographical political economy of banking crises: A peripheral region perspective on organisational concentration and spatial centralisation in Britain. Cambridge Journal of Regions, Economy and Society, 6(3), 455-477.
https://doi.org/10.1093/cjres/rst002 Mayew, W. J., Sethuraman, M., and Venkatachalam, M. (2014). MDandA Disclosure and the
Firm's Ability to Continue as a Going Concern. The Accounting Review, 90(4), 1621-1651. https://doi.org/10.2308/accr-50983
Ntim, C. G., Lindop, S., and Thomas, D. A. (2013). Corporate governance and risk reporting in South Africa: A study of corporate risk disclosures in the pre-and post-2007/2008 global financial crisis periods. International Review of Financial Analysis, 30, 363-383.
https://doi.org/10.1016/j.irfa.2013.07.001 Miihkinen, A. (2012). What drives quality of firm risk disclosure?: the impact of a national
disclosure standard and reporting incentives under IFRS. The International Journal of Accounting, 47(4), 437-468. https://doi.org/10.1016/j.intacc.2012.10.005

Adelopo | Non-Financial Risk Disclosure: The case of UK Distressed Banks
41
Prasad, A. and Mir, R. (2002). Digging Deep for Meaning: A Critical Hermeneutics Analysis of CEO Letters to Shareholders in the Oil Industry. Journal of Business Communication 39, 92 – 116. https://doi.org/10.1177/002194360203900105
Qiu, X. Y., Srinivasan, P., and Street, N. (2006). Exploring the forecasting potential of company annual reports. Proceedings of the American Society for Information Science and Technology, 43(1), 1-15. https://doi.org/10.1002/meet.14504301168
Reinhart, C.M. and Rogoff, K.S. (2008). Is The 2007 US Sub-Prime Financial Crisis So Different? An International Historical Comparison. National Bureau of Economic Research (NBER) Working Paper Series. Working Paper 13761
https://doi.org/10.1257/aer.98.2.339 Seawright, J., and Gerring, J. (2008). Case Selection Techniques in Case Study Research A
Menu of Qualitative and Quantitative Options. Political Research Quarterly, 61(2), 294-308. https://doi.org/10.1177/1065912907313077
Schleicher, T., Hussainey, K., and Walker, M. (2007). Loss firms’ annual report narratives and share price anticipation of earnings. The British Accounting Review, 39(2), 153-171.
https://doi.org/10.1016/j.bar.2007.03.005 Sharma, S., and Mahajan, V. (1980). Early warning indicators of business failure. The Journal
of Marketing, 44, 80-89. https://doi.org/10.2307/1251234 Smith, M. and Taffler, R.J. (2000). The Chairman’s Statement- A Content Analysius of
Discretionary Narrative Disclosures, Accounting, Auditing and Accountability Journal, 13(5), 624-647. https://doi.org/10.1108/09513570010353738
Shin, H. S. (2009). Reflection on Northern Rock: The Bank Run That Heralded The Global Financial Crises, Journal of Economic Perspectives, 23(1), 101- 119.
https://doi.org/10.1257/jep.23.1.101 Sydserff, R. and Weetman, P. (2002). Developments in content analysis: a transitivity index and
Diction scores, Accounting, Auditing and Accountability Journal, 15(4),.523-45 https://doi.org/10.1108/09513570210440586 Tennyson, B.M., Ingram, R.W. and Dugan, M.T. (1990). Assessing the information content of
narrative disclosures in explaining bankruptcy. Journal of Business Finance and Accounting, 17(3): 391–410. https://doi.org/10.1111/j.1468-5957.1990.tb01193.x
Trevelyan, R. (2008). Optimism, overconfidence and entrepreneurial activity, Management Decision, 46(7), 986-1001 https://doi.org/10.1108/00251740810890177

AABFJ | Volume 11, no. 2, 2017
42
Appendices Forward looking Word Lists
Accelerate Anticipate Await Coming –year Months Confidence Confident Convince Current Financial year Envisage Eventual Expect Forecasts Forthcoming Hope Intend Unlikely Likely Ahead Next Novel Optimistic Outlook Plan Planning Predict Remain New Shall Scope Shortly Soon Will Target Objective Continue Goal Risk Value at risks Probability Future
Optimistic Enhancing Words
Increasing Increase Improve Improvement Improving Favourable Rise Rising Benefit Benefiting Benefits Forward Upwards Opportunity Advantage Growth Income Revenue Profit Profitable Efficiency Effectiveness Overcome Success Successful Successfully Earnings Earning
Pessimistic Enhancing Words Decrease Decreasing Lower Below Exposure Minimal Not Downward Backward Falling Fall Dangerously Unfortunately Expenses Costs Cost Taxes Loss Arrears Arrear Ineffective Inefficient Unsecured Securitize Securitisation Bad Bad debts Fails Unsure