Embed Size (px)
Citation preview
Non-Invasive Fourier Transform Infrared Microspectroscopy and Imaging Techniques: Basic Principles and Applications
P. Garidel*1, and M. Boese2 1 Institute of Physical Chemistry, Faculty of Chemistry, Martin-Luther-University Halle/Wittenberg,
Muehlpforte 1, D-06108 Halle/Saale, Germany 2 Bruker Optics GmbH, Rudolf-Plank-Str. 27, D-76275 Ettlingen, Germany The current paper describes rather new and straightforward non-invasive mid infrared spectroscopic techniques for the position sensitive identification of sample components. These techniques include mid infrared (MIR) microspectroscopy, mapping as well as imaging approaches e.g. in transmission, reflection-absorption, or attenuated total reflection mode. The basic principles of the different infrared microspectroscopy and imaging techniques are presented, with a critical evaluation of the technique compared to currently utilized other imaging techniques. The presented examples are focussed on applications in life science, e.g. exploration of the heterogeneity of a single sample, identification and biochemical characterisation of biological samples, ex-vivo monitoring the distribution of drugs in tissues. Additional applications are briefly discussed to illustrate the potentials and limitations of the presented techniques for medical diagnostics.
Keywords infrared microspectroscopy; mapping; imaging; non-invasive; tissue; FTIR
1. Introduction
The coupling of an infrared spectrometer to an optical microscope (Figs. 1 and 2) offers the unique opportunity for studying biological samples with a spatial resolution limited by the near diffraction limit of infrared light (3-10 µm). The development efforts of the last years have enlarged the potential applications of infrared microspectroscopic analysis, since measurements can be performed in transmission (Figs. 3 - 5), reflection-absorption, diffuse reflection, grazing incidence reflection and attenuated total reflection (ATR) mode, which can be associated to different micro and macro sampling accessories (Fig. 6). Additionally, the microspectroscopic imaging instruments include features enabling the conduction of polarisation experiments, experiments using differential interference contrast, or allowing Normaski measurements [11, 12]. The examination of the spectral data can be performed as univariate analysis, however the use of multivariate analysis allows the extraction of much more information [1 – 4]. Therefore, large efforts are also undertaken to develop adequate chemometry tools for data evaluation [5 – 10]. The derived information from infrared microspectroscopy is mostly presented as a false colour image, which resembles histological staining samples. The purpose of this article is to provide the basic knowledge required to conduct infrared microspectroscopy mapping and imaging experiments. Instrumentation setups as well as data analysis are briefly discussed. For introductions to microscopy or vibrational spectroscopy it is referred to educational textbooks [11, 12]. Various examples (unpublished) in the field of life science are presented to demonstrate the applicability of different microspectroscopy mapping and imaging experimental modes.
* Corresponding author: e-mail: [email protected]
©FORMATEX 2007Modern Research and Educational Topics in Microscopy. A. Méndez-Vilas and J. Díaz (Eds.) _______________________________________________________________________________________________
132
2. Basic Principles
Infrared microspectroscopy mapping and imaging techniques are non-invasive approaches in the sense that no extrinsic staining is required to generate the image contrast, as it is applied in fluorescence imaging spectroscopy. In fluorescence microscopy imaging [13] only the used fluorescence dyes are visualised in the sample, and basically no information with regard to e.g. the biochemical composition of the sample is derived. Using vibrational spectroscopy approaches intrinsic spectroscopic properties of the sample itself are monitored. Raman microspectroscopy [14-16], a spectroscopy technique that is complementary to infrared spectroscopy, has evolved fast in the last years, since Raman technology has largely benefited from the advancements in laser as well as array detector developments. However, using the Raman approach it has to be considered that possible sample damage may occur due to the use of strong laser intensities. This is especially a problem for the analysis of biological samples. Additionally, limited applications may result from interferences with fluorescence of the sample and the signal arising from Raman scattering cross sections is typically six orders of magnitude smaller compared to infrared absorptivities [14]. However, the “correct” choice of the used spectroscopic technique depends strongly on the aim of the study (analysed sample, sensitivity of the sample to the procedure, required lateral resolution etc.).
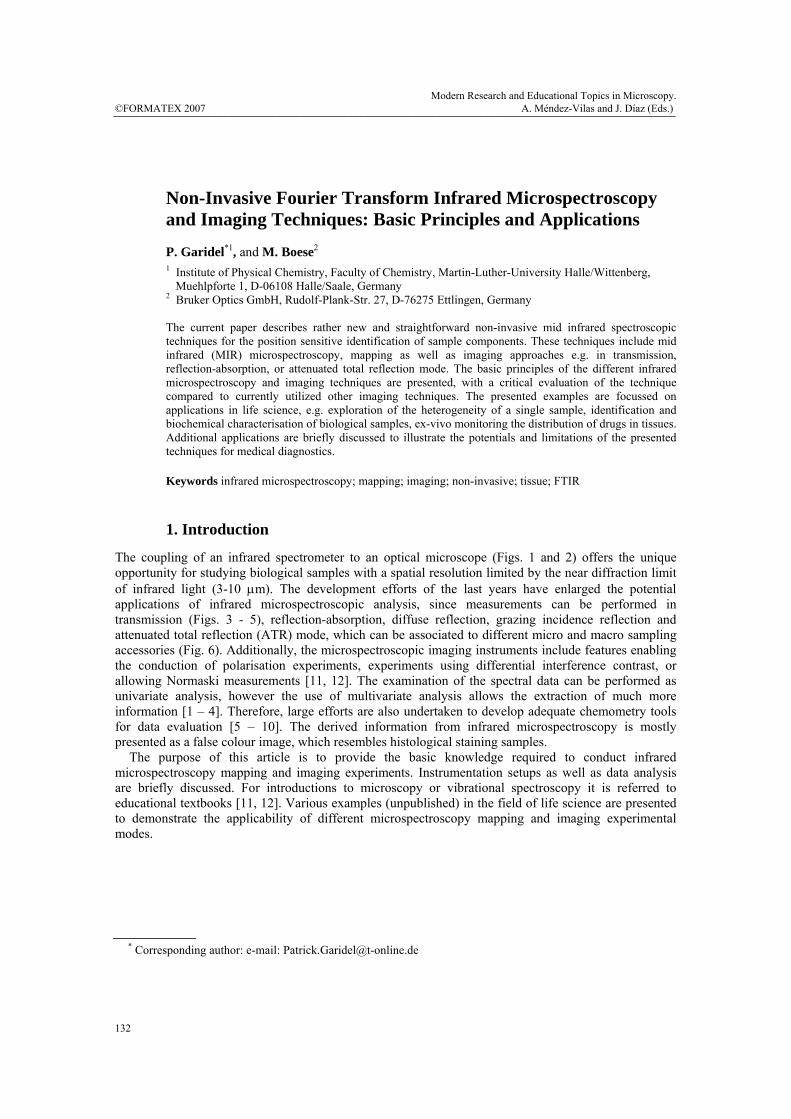
Fig. 1 Fourier transform mid infrared microspectroscopic instrumentation (Hyperion 3000). FTIR: Fourier transform infrared, ATR: attenuated total reflection.
2.1 Infrared mapping approach
The first investigations, in the early 1990’s, employed FTIR (Fourier transform infrared) microspectroscopy instruments equipped with a single infrared point detector, enabling just to analyse a single section, single spot, defined by the aperture of the microscope [17, 18] (Fig. 2a). In order to get a high lateral resolution the minimal aperture dimension is set to approximately 10 µm x 10 µm. With this set-up it is possible to investigate spectroscopically single cells, which allows the classification of “normal” versus malignant cells in medical diagnostic analysis [10, 32, 34, 43].
FTIR spectrometer microscope
Motorized stage (x-y)
Single element detector
Focal plane array (FPA)
detector
Measuring modes(transmission,
reflection, ATR)
Modern Research and Educational Topics in Microscopy. A. Méndez-Vilas and J. Díaz (Eds.) ©FORMATEX 2007 _______________________________________________________________________________________________
133
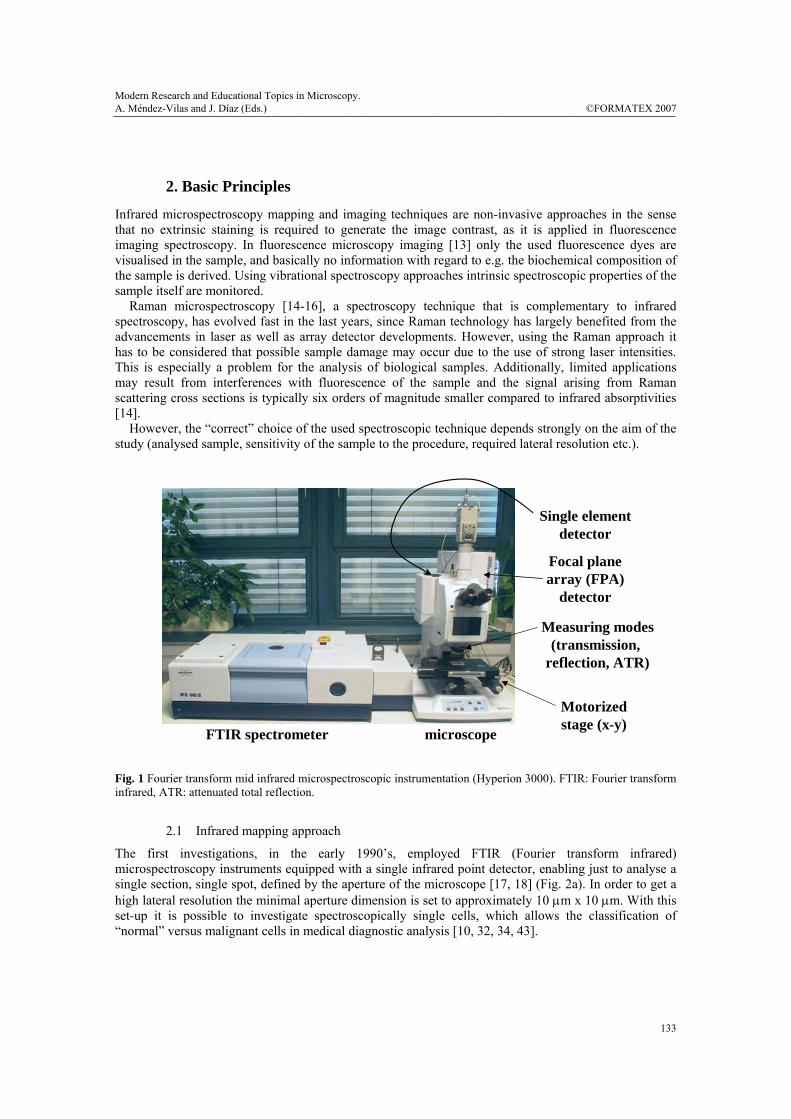
Fig. 2 Principle of infrared microspectroscopic mapping and imaging. (A) Optical micrograph of the sample being analysed using the mapping approach, (B) schematic representation of a focal plane array (FPA) detector made of a large number of pixel elements for the investigation of the sample area of interest, (C) infrared image of the analysed sample representing the lateral distribution of a chemical entity, (D) infrared spectrum obtained from a single pixel element of the FPA detector, (E) infrared image colour code: red corresponds to a high amount (intensity), blue corresponds to a low amount (intensity) of the imaged chemical entity. The mapping approach was the first technique developed for the lateral spectroscopic characterisation of larger samples. The spatially resolved spectral information is obtained by scanning the sample spot by spot across the surface using a stationary detector and collecting at each spot a complete infrared spectrum (Fig. 2A). The sample is moved by an x-y-computer controlled stage, in order to position the next spot “under” the microscope. The spot registered at each step across the sample is defined by the aperture of the microscope, which may ranges between 10 µm x 10 µm up to 200 µm x 200 µm. The mapping procedure permits the acquisition of high quality infrared spectra with spatial information, which are used to map the distribution of chemical entities in the sample. The different spots are recorded sequentially, and the image is reconstituted by matching the spectral information of each single spot to construct a larger image. The drawback of this procedure is that the investigation of larger sample areas, using a reasonable lateral resolution (between 10-40 µm), is extremely time consuming (taking up to days for larger samples in the mm range analysed at a lateral resolution of 10-40 µm) [19].
4000 3500 3000 2500 2000 1500 1000
Wavenumber / cm-1
Inte
nsity
IR spectrumD E
low
high
Inte
nsity
FPA IR imageSingle pixelelement
C
sample
Analysedarea
A
Spot #1Spot #2
B
4000 3500 3000 2500 2000 1500 1000
Wavenumber / cm-1
Inte
nsity
IR spectrumD
4000 3500 3000 2500 2000 1500 1000
Wavenumber / cm-1
Inte
nsity
IR spectrumD E
low
high
Inte
nsity
E
low
high
Inte
nsity
low
high
Inte
nsity
FPA IR imageSingle pixelelement
CC
sample
Analysedarea
A
Spot #1Spot #2
sample
Analysedarea
A
Spot #1Spot #2
B
©FORMATEX 2007Modern Research and Educational Topics in Microscopy. A. Méndez-Vilas and J. Díaz (Eds.) _______________________________________________________________________________________________
134
The obtained spatial resolution for FTIR microscopy is limited by the diffraction limit of the infrared light. The diffraction limited spatial resolution (d) depends on the wavelength of the used light (λ), the refractive index of the medium in which the measurement is performed (n’) and the angle (Θ) defining the most extreme ray exciting the optical system with respect to the central axis and thus is given by: d = (0.61 · λ) / (n’ · sinΘ) [11]. For most infrared microscope objectives the numerical aperture NA (NA = n’ · sinΘ) ranges between 0.5 and 0.7. Thus the diffraction limited spatial resolution in the infrared finger print region (4000 – 1000 cm-1) is ≈3-10 µm. Lasch and Naumann [37] have recently pointed out that the spatial resolution is one of the most critical measurement parameters in FTIR microspectroscopy. Due to the distinct levels of morphologic heterogeneity in cells and tissues the spatial resolution in a given IR imaging setup strongly affects the character of the infrared spectral pattern obtained from the biomedical sample. These authors have presented a computational procedure, three-dimensional Fourier self deconvolution, which is suitable to improve the spatial resolution in infrared imaging (for more details see [37]).
2.2 Infrared imaging approach
The breakthrough using infrared microspectroscopy was the accessibility of array detectors [20-25]. The use of a focal plane array (FPA) detector instead of using a single element detector reduced the experimental time drastically for the investigation of a larger sample area (Fig. 2B). Additionally, using these detectors superior image fidelity was gained. FPAs are made of many small, individual pixels laid out in a grid pattern. Each small pixel functions as a single small detector (Fig. 2B). For the imaging approach, no apertures are necessary to define the analysed sample area. The microscope images (Fig. 2C) of the sample plane are directly projected onto the detector array, and thus simultaneously from each pixel of the FPA spectral data are collected from a specific sample region within the field of view (Fig. 2D). The first implementations were realised using a bandpass filter [11, 12] coupled to an array detector capturing a spectral image of the sample at a single wavelength. Implementations using tunable filters for wavelength selection were also developed [11, 12]. However, in most cases a complete MIR spectrum was needed. It was soon realised that even using tunable filters this approach was not efficient enough. The next development step was the implementation of the interferometry technology, which allows taking the benefit of the multichannel as well as the multiplex advantage [11, 12]. The introduction of the multichannel technique combined with the spectral multiplexing advantage (all wavelengths of the light are monitored simultaneously by each detector pixel) allow the analysis of a complete sample field of view that is spectroscopically imaged at the detector array plane in a time period comparable to acquiring conventionally a single spectrum. Thus after the infrared light impinged on the sample, the transmitted or reflected light is subsequently focussed onto the focal plane of the array detector, preserving spatial information [1]. By using the interferometer imaging technology a broad band of infrared light source is modulated by a Michelson interferometer and focused onto the sample. In a step scan interferometer [11], the mirror retardation is quickly changed to a desired position and held constant. After the completion of the measurement at this mirror retardation, the interferometer is moved (stepped) rapidly to the next retardation position. In this way the interferogram is built point by point by recording the detector signal at discrete mirror retardations rather than discrete time intervals. During the mirror is held in place the infrared array gathers and subsequently the data are read out. The resulting data “cube” [10] consisting of a succession of image planes is recorded as a function of the interferometer optical path length. In a next step the data are Fourier transformed in order to generate images that correspond to spectral frequency and intensity. For more details consult the excellent paper published recently by Levin and Bhargava (2005) [19]. In the meantime the FPA were equipped with faster electronics, so that modern FPA instrumentations can be read out in rapid scan modes as a single element MCT detector [16].
Modern Research and Educational Topics in Microscopy. A. Méndez-Vilas and J. Díaz (Eds.) ©FORMATEX 2007 _______________________________________________________________________________________________
135

2.3 Infrared imaging detector arrays
For FTIR microspectroscopy imaging investigations in the mid infrared (MIR) spectral region, the so called fingerprint region, MCT (mercury cadmium telluride) detectors covering the spectral range from 3600 to 900 cm-1 are often employed. The predominantly utilised MCT detector array size is 64 x 64 pixels, allowing the acquisition of 4096 infrared spectra per experiment. The MCT detectors have to be cooled down with liquid nitrogen to 77 K in order to operate correctly. However, cryo cooled version are also available for applications where liquid nitrogen cooling is not practical. Pioneering works were described in order to develop MIR detectors that can be run under ambient temperature conditions, because of their probable lower costs and more uncomplicated operations [26]. However, up to now uncooled arrays have not achieved the performance parameters of cooled arrays, especially in the finger print region [27]. Using specific detector materials (see below) the spectroscopic range can be extended in the near infrared region (NIR) [28, 29]. The most commonly used NIR detectors are InSb (indium antimony) detectors, which are sensitive in the range between 1 to 5.5 µm, corresponding to 10 000 to 1800 cm-1 [30]. The NIR detectors have a size of 320 x 256 pixels although larger detectors with 640 x 512 pixels and 1024 x 1024 InSb arrays have been described [28-30]. The last ones are mostly employed for applications in astronomy. The challenge with these detectors is the high costs and that for a correct function of InSb detectors they are cooled to liquid nitrogen temperature. However, alternatives are available. InGaAs (indium gallium arsenide) detectors function under ambient conditions and are sensitive in the range between 11 000 and 6 000 cm-1. Detector with a size of 128 x 128 and 320 x 240 pixels are available. For spectroscopic operations in the far infrared region (longer wavelength region) extrinsic silicon arrays are used which are doped with arsenic or gallium. The sensitivity can thus be extended to ≈350 cm-1 and ≈555 cm-1, respectively. These array detectors have a high responsitivity (the ratio of the electrical ouput to the optical input) and excellent noise performances. NEPs (noise equivalent powers) of 10-17 or better are achieved with readout noise ranging from 1 to 500 electrons, which depend on the readout circuitry of each pixel. The main draw back of these detectors are the high costs and that they must be cooled down with liquid helium and operated at temperatures lower than 20 K [10, 17].
3. Data Evaluation
The infrared spectral analysis can range from single band intensity plots (univariate representation) versus chemometrically-extracted information (multivariate representation) using complex mathematical approaches and statistical algorithms [5-7, 31]. The benefit of the single component-band analyses is that known spectroscopic features can be plotted to generate a chemical image. However, this approach is just feasible when specific biomarker bands are known, clearly identifying the chemical entity of interest to be imaged [32-35]. However, if the differences in the spectroscopic signatures are not clear, univariate analysis should not be used because it will not provide unambiguously a description of the chemical property of the sample. For that reason, the analysis of the spectra rely on more refined, chemometrical data evaluation tools. The most common are principal component analysis (PCA), cluster analysis, multivariate statistics, or artificial neuronal network (ANN). The output of these mathematical tools can provide information about the similarity of spectra, and from these data the images are generated. Chemical information extracted from all the infrared spectra are thus directly translated back into the image and a “false” colour image is generated. For more details see [5, 10, 36, 37].
©FORMATEX 2007Modern Research and Educational Topics in Microscopy. A. Méndez-Vilas and J. Díaz (Eds.) _______________________________________________________________________________________________
136
It has to be remembered, as has been pointed out by different authors [10, 16, 19, 38], that the image contrast is generated from every image plane, but these images do not always relay chemical information, which is specific to the sample, but rather properties such as irregularities, refractive index boundaries or simply scattering differences. Therefore, care must be taken when simply analysing infrared images not to interpret these information as chemical, and it is strongly recommended to remove these “distorting” effects from the data set. Powerful software’s should be able to encounter these problems and to “prepare” the data for real chemical data evaluation [5]. The infrared spectral data shown in this paper were evaluated using the Opus software. Different data analysing strategies were applied (see text). The applied colour code in this paper is: red colour signifies a high, blue colour a low amount of the imaged chemical entity (Figs. 2C and 2E and Figs. 3B and 3C).
4. Sample Preparation, Material and Methods
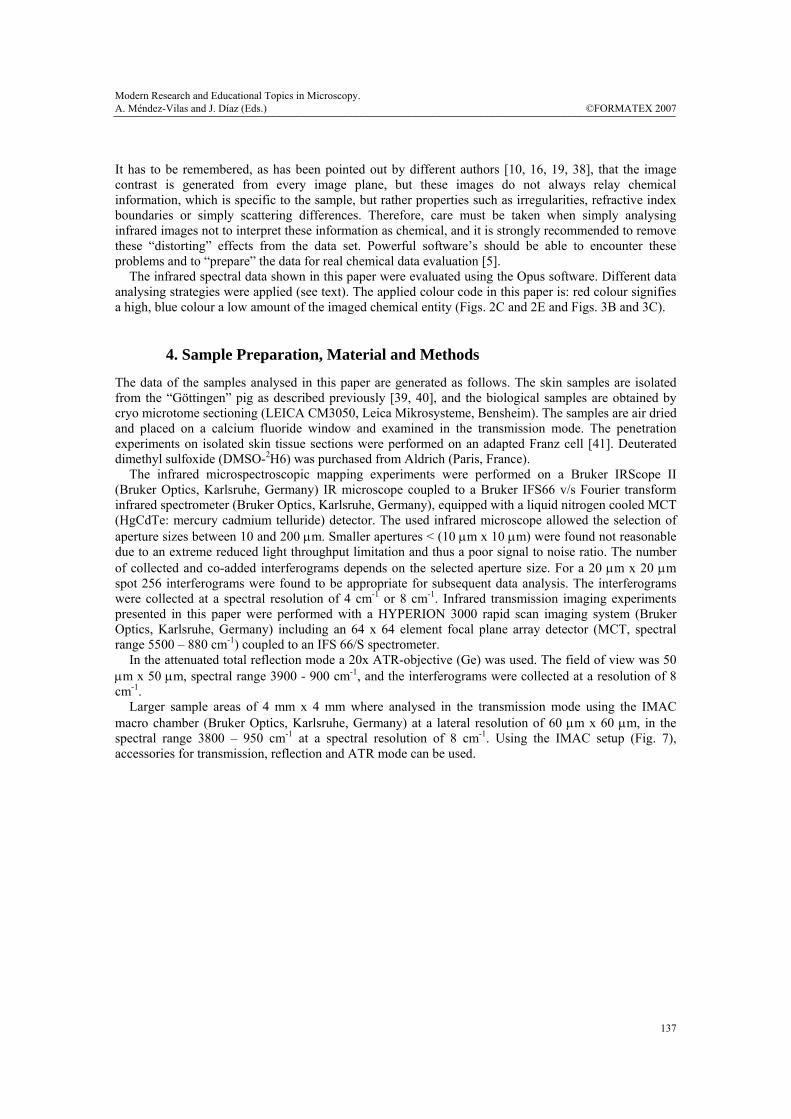
The data of the samples analysed in this paper are generated as follows. The skin samples are isolated from the “Göttingen” pig as described previously [39, 40], and the biological samples are obtained by cryo microtome sectioning (LEICA CM3050, Leica Mikrosysteme, Bensheim). The samples are air dried and placed on a calcium fluoride window and examined in the transmission mode. The penetration experiments on isolated skin tissue sections were performed on an adapted Franz cell [41]. Deuterated dimethyl sulfoxide (DMSO-2H6) was purchased from Aldrich (Paris, France). The infrared microspectroscopic mapping experiments were performed on a Bruker IRScope II (Bruker Optics, Karlsruhe, Germany) IR microscope coupled to a Bruker IFS66 v/s Fourier transform infrared spectrometer (Bruker Optics, Karlsruhe, Germany), equipped with a liquid nitrogen cooled MCT (HgCdTe: mercury cadmium telluride) detector. The used infrared microscope allowed the selection of aperture sizes between 10 and 200 µm. Smaller apertures < (10 µm x 10 µm) were found not reasonable due to an extreme reduced light throughput limitation and thus a poor signal to noise ratio. The number of collected and co-added interferograms depends on the selected aperture size. For a 20 µm x 20 µm spot 256 interferograms were found to be appropriate for subsequent data analysis. The interferograms were collected at a spectral resolution of 4 cm-1 or 8 cm-1. Infrared transmission imaging experiments presented in this paper were performed with a HYPERION 3000 rapid scan imaging system (Bruker Optics, Karlsruhe, Germany) including an 64 x 64 element focal plane array detector (MCT, spectral range 5500 – 880 cm-1) coupled to an IFS 66/S spectrometer. In the attenuated total reflection mode a 20x ATR-objective (Ge) was used. The field of view was 50 µm x 50 µm, spectral range 3900 - 900 cm-1, and the interferograms were collected at a resolution of 8 cm-1. Larger sample areas of 4 mm x 4 mm where analysed in the transmission mode using the IMAC macro chamber (Bruker Optics, Karlsruhe, Germany) at a lateral resolution of 60 µm x 60 µm, in the spectral range 3800 – 950 cm-1 at a spectral resolution of 8 cm-1. Using the IMAC setup (Fig. 7), accessories for transmission, reflection and ATR mode can be used.
Modern Research and Educational Topics in Microscopy. A. Méndez-Vilas and J. Díaz (Eds.) ©FORMATEX 2007 _______________________________________________________________________________________________
137
5. Applications
An important aspect in infrared spectroscopy is the identification of spectral patterns, e.g. spectral bands that are characteristic for certain sample constituents [16, 19]. Based on these specific marker bands the distribution of a chemical entity is investigated (Fig. 3). However, chemometrical analysis of the data are also used to extract information from the huge amount of infrared data [5, 10].
5.1 Transmission mode
In the transmission mode the infrared beam passes the sample and is detected behind the sample [11]. Infrared microspectroscopy experiments in the transmission mode provide high data quality without any distortions based on e.g. reflection artefacts. An important requirement for transmission experiments lies in the sample preparation. Scatterings effects, as an example, should be avoided by polishing the sample (for hard sample like bones) or microtomed (for soft samples like tissues) and/or sandwiched between infrared transparent supports. The sample should be prepared in order to meet the absorption criteria of the Lambert-Beer law [11]. As a rule of thumb, the sample thickness should be sufficiently thin in order to keep absorbance values in the range between 0.4 to 0.8 absorbance units. Thus the sample thickness should be on the order of 10 µm to avoid total absorption [10, 19, 42, 43].
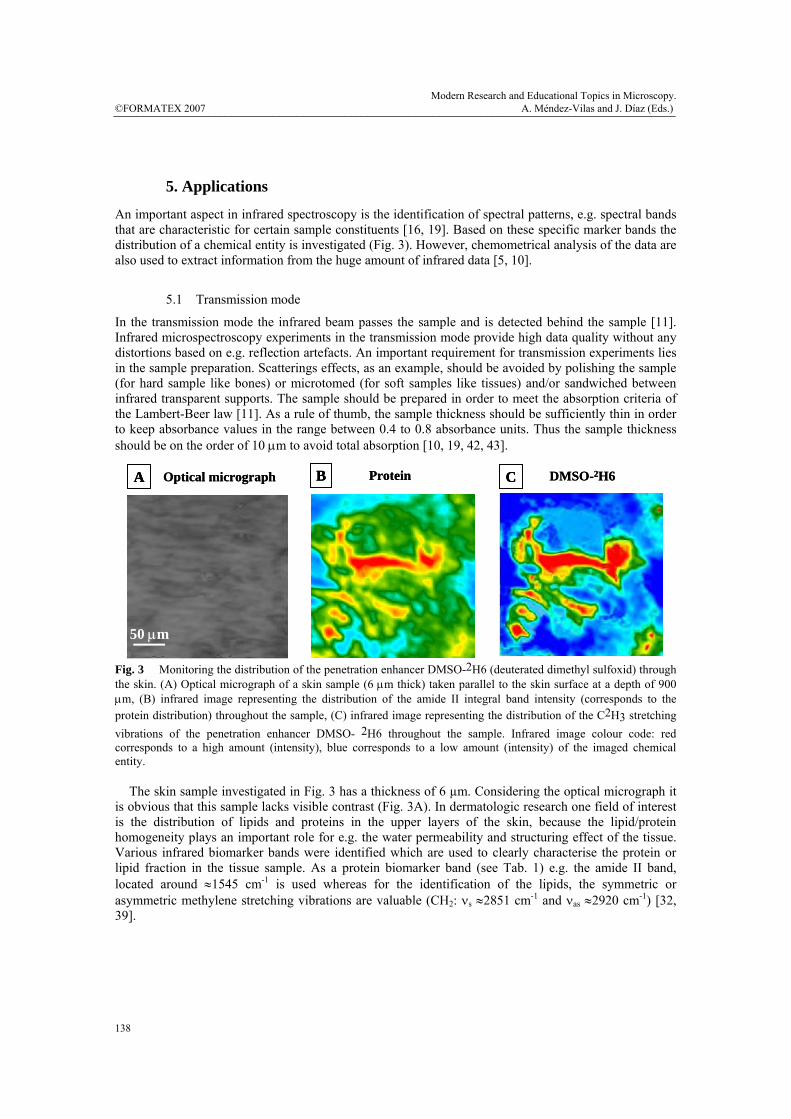
Fig. 3 Monitoring the distribution of the penetration enhancer DMSO-2H6 (deuterated dimethyl sulfoxid) through the skin. (A) Optical micrograph of a skin sample (6 µm thick) taken parallel to the skin surface at a depth of 900 µm, (B) infrared image representing the distribution of the amide II integral band intensity (corresponds to the protein distribution) throughout the sample, (C) infrared image representing the distribution of the C2H3 stretching vibrations of the penetration enhancer DMSO- 2H6 throughout the sample. Infrared image colour code: red corresponds to a high amount (intensity), blue corresponds to a low amount (intensity) of the imaged chemical entity. The skin sample investigated in Fig. 3 has a thickness of 6 µm. Considering the optical micrograph it is obvious that this sample lacks visible contrast (Fig. 3A). In dermatologic research one field of interest is the distribution of lipids and proteins in the upper layers of the skin, because the lipid/protein homogeneity plays an important role for e.g. the water permeability and structuring effect of the tissue. Various infrared biomarker bands were identified which are used to clearly characterise the protein or lipid fraction in the tissue sample. As a protein biomarker band (see Tab. 1) e.g. the amide II band, located around ≈1545 cm-1 is used whereas for the identification of the lipids, the symmetric or asymmetric methylene stretching vibrations are valuable (CH2: νs ≈2851 cm-1 and νas ≈2920 cm-1) [32, 39].
50 µm
Protein DMSO-2H6Optical micrograph
50 µm
A B C
50 µm
Protein DMSO-2H6Optical micrograph
50 µm
A B C
50 µm
A B C
©FORMATEX 2007Modern Research and Educational Topics in Microscopy. A. Méndez-Vilas and J. Díaz (Eds.) _______________________________________________________________________________________________
138

Tab. 1 Examples for biomarker bands used for the characterisation of the protein and lipid fraction in biological samples.
ν: stretch, as: asymmetric, s: symmetric Fig. 3B shows the distribution of the amide II band intensity throughout the sample. Areas with a high concentration of proteins are coloured in red, whereas areas with a reduced concentration of proteins are visualised in blue. Imaging the lipid distribution in the same sample shows that the lipid and protein distributions are mostly complementary, i.e. regions with a high amount of proteins show a reduced concentration in lipid concentration and vice versa (data not shown, see [36]). Infrared imaging (using PCA outputs) is also well suited to monitor the distribution of e.g. a topical applied drug to the skin [44]. In the presented example the distribution of the penetration enhancer dimethyl sulfoxid (DMSO) is screened. The experimental procedure has been described recently [41]. Deuterated DMSO-2H6 was used, because the isotopic substitution of deuterium (2H) atoms into extrinsic molecules provide a powerful spectroscopic marker due to the fact that the C2H3 stretching vibrations appear in a spectral region that is not overlapped by absorption bands arising from the intrinsic tissue components. The asymmetric and symmetric CH3 stretching modes appear between 2800 – 3000 cm-1, whereas the corresponding C2H3 stretching modes appear in the spectral region from 2250 – 2050 cm-1. For the example shown in Fig. 3 a certain amount (20 µl/cm2) of deuterated DMSO-2H6 was applied at 24 °C for 240 min on top of the outer layer of a skin sample, which was fixed in a Franz-cell. Thin tissue samples were obtained at various depths by cryo microtome sectioning. Under these experimental conditions the penetration enhancer could be monitored up to a skin depth of approx. 1000 µm. Comparing Fig. 3B and Fig. 3C clearly demonstrate that deuterated DMSO is partitioned in regions with a high protein concentration. Thus one can conclude from such experiments that the investigated penetration enhancer dimethyl sulfoxid is localised within protein rich regions of the tissue and suggest the penetration pathway being through the epidermal proteins of the skin. Such infrared imaging experiments have been used in dermatological research to investigate e.g. the distribution of an UV B blocker formulated in a sun cream and applied to the skin [39]. Depending on the used formulation it was possible to influence the distribution ratio in the lipid and protein fraction of the UV B blocker in the skin. The penetration of liposomes in the skin was also investigated according to the above-described protocol [41].
Band assignment Functional group Wavenumber / cm-1 Tissue characteristics
amide B N-H ~3080 Protein
νas(CH3) C-CH3 2957
amide I O=C-N-H 1655
amide II O=C-N-H 1545
νas(CH2) -(CH2)n- 2920 Lipid
νs(CH2) -(CH2)n- 2851
ν(C=O) -CH2-COOR 1738
Modern Research and Educational Topics in Microscopy. A. Méndez-Vilas and J. Díaz (Eds.) ©FORMATEX 2007 _______________________________________________________________________________________________
139
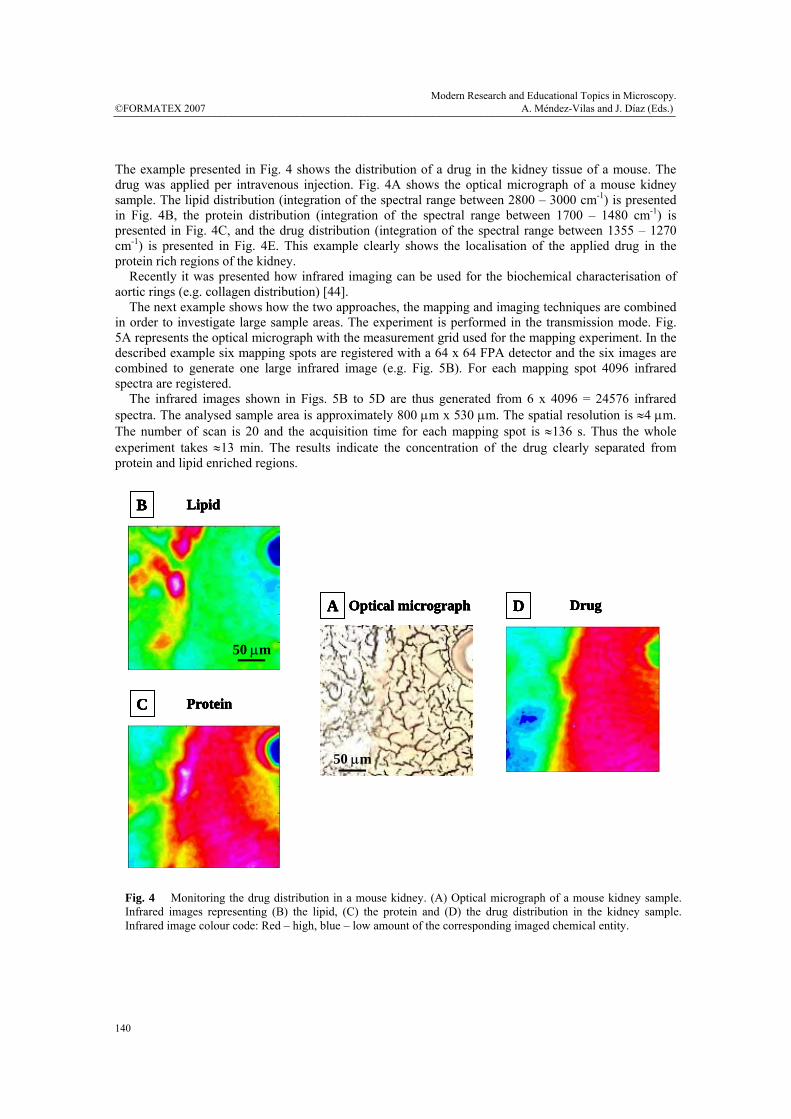
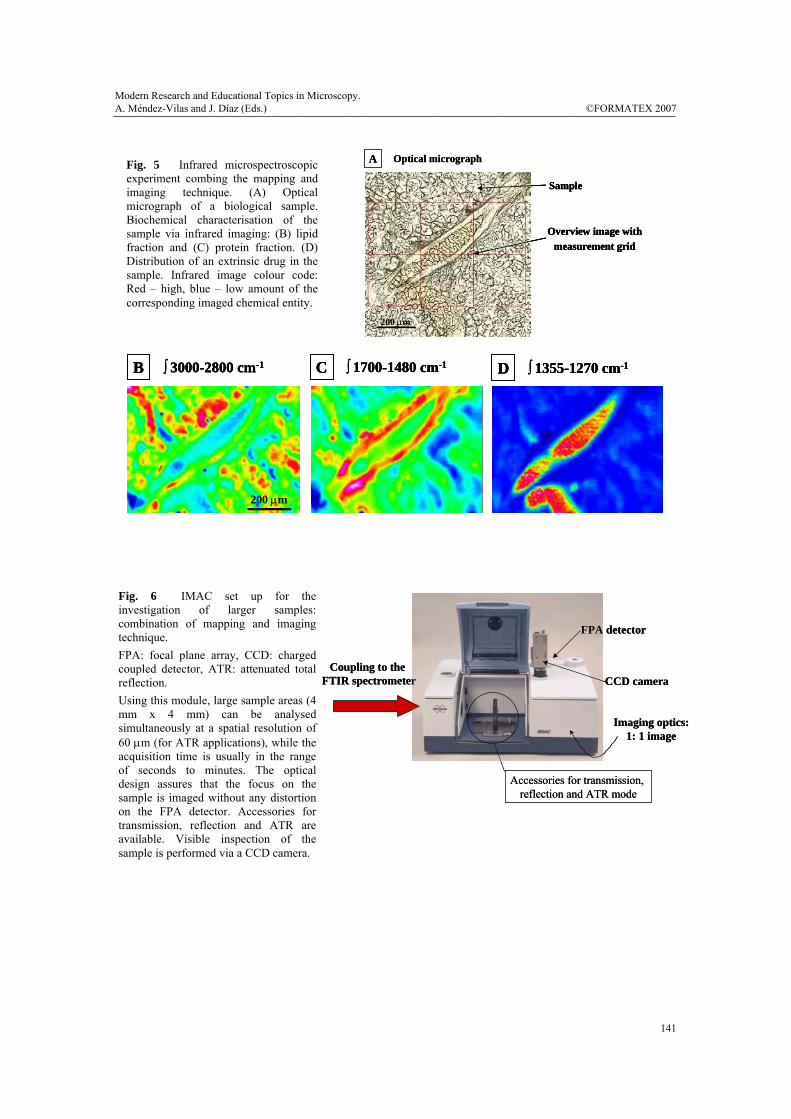
The example presented in Fig. 4 shows the distribution of a drug in the kidney tissue of a mouse. The drug was applied per intravenous injection. Fig. 4A shows the optical micrograph of a mouse kidney sample. The lipid distribution (integration of the spectral range between 2800 – 3000 cm-1) is presented in Fig. 4B, the protein distribution (integration of the spectral range between 1700 – 1480 cm-1) is presented in Fig. 4C, and the drug distribution (integration of the spectral range between 1355 – 1270 cm-1) is presented in Fig. 4E. This example clearly shows the localisation of the applied drug in the protein rich regions of the kidney. Recently it was presented how infrared imaging can be used for the biochemical characterisation of aortic rings (e.g. collagen distribution) [44]. The next example shows how the two approaches, the mapping and imaging techniques are combined in order to investigate large sample areas. The experiment is performed in the transmission mode. Fig. 5A represents the optical micrograph with the measurement grid used for the mapping experiment. In the described example six mapping spots are registered with a 64 x 64 FPA detector and the six images are combined to generate one large infrared image (e.g. Fig. 5B). For each mapping spot 4096 infrared spectra are registered. The infrared images shown in Figs. 5B to 5D are thus generated from 6 x 4096 = 24576 infrared spectra. The analysed sample area is approximately 800 µm x 530 µm. The spatial resolution is ≈4 µm. The number of scan is 20 and the acquisition time for each mapping spot is ≈136 s. Thus the whole experiment takes ≈13 min. The results indicate the concentration of the drug clearly separated from protein and lipid enriched regions.
A
50 µm
Optical micrograph D Drug
C Protein
B Lipid
50 µm
A
50 µm
Optical micrograph D DrugA
50 µm
Optical micrographA
50 µm
Optical micrograph D DrugD Drug
C Protein
B Lipid
50 µm
C ProteinC Protein
B Lipid
50 µm
B Lipid
50 µm
Fig. 4 Monitoring the drug distribution in a mouse kidney. (A) Optical micrograph of a mouse kidney sample. Infrared images representing (B) the lipid, (C) the protein and (D) the drug distribution in the kidney sample. Infrared image colour code: Red – high, blue – low amount of the corresponding imaged chemical entity.
©FORMATEX 2007Modern Research and Educational Topics in Microscopy. A. Méndez-Vilas and J. Díaz (Eds.) _______________________________________________________________________________________________
140
Coupling to the FTIR spectrometer
Imaging optics: 1: 1 image
CCD camera
FPA detector
Accessories for transmission, reflection and ATR mode
Coupling to the FTIR spectrometer
Imaging optics: 1: 1 image
CCD camera
FPA detector
Accessories for transmission, reflection and ATR mode
Fig. 6 IMAC set up for the investigation of larger samples: combination of mapping and imaging technique. FPA: focal plane array, CCD: charged coupled detector, ATR: attenuated total reflection. Using this module, large sample areas (4 mm x 4 mm) can be analysed simultaneously at a spatial resolution of 60 µm (for ATR applications), while the acquisition time is usually in the range of seconds to minutes. The optical design assures that the focus on the sample is imaged without any distortion on the FPA detector. Accessories for transmission, reflection and ATR are available. Visible inspection of the sample is performed via a CCD camera.
Fig. 5 Infrared microspectroscopic experiment combing the mapping and imaging technique. (A) Optical micrograph of a biological sample. Biochemical characterisation of the sample via infrared imaging: (B) lipid fraction and (C) protein fraction. (D) Distribution of an extrinsic drug in the sample. Infrared image colour code: Red – high, blue – low amount of the corresponding imaged chemical entity.
200 µm
B ∫ 3000-2800 cm-1 D ∫ 1355-1270 cm-1C ∫ 1700-1480 cm-1
200 µm
B ∫ 3000-2800 cm-1
200 µm
B ∫ 3000-2800 cm-1 D ∫ 1355-1270 cm-1D ∫ 1355-1270 cm-1C ∫ 1700-1480 cm-1C ∫ 1700-1480 cm-1
Overview image with measurement grid
200 µm
Sample
A Optical micrograph
Overview image with measurement grid
200 µm
Sample
Overview image with measurement grid
200 µm200 µm
Sample
A Optical micrograph
Modern Research and Educational Topics in Microscopy. A. Méndez-Vilas and J. Díaz (Eds.) ©FORMATEX 2007 _______________________________________________________________________________________________
141
5.2 Reflection mode
In the above-described examples taken in the transmission mode, it was necessary to prepare thin tissue samples via e.g. microtomisation (sectioning by ultramicrotomy). However it is also possible to directly investigate the sample without any sample preparation. This is realised using infrared imaging in the reflection mode. The most employed reflection technique in infrared spectroscopy is that of ATR (attenuated total reflection) [45 –47]. The benefit of ATR microspectroscopy is a minimal sample preparation; the sample is in direct contact to the internal reflection element (IRE e.g. Ge crystal), and using the reduced path length for the analysis of highly absorbing samples. It should be remembered that the penetration depth (dp) of the infrared beam in the sample is ≈0.5 – 3.5 µm, and depends on the wavelength of the light (dp ∝ λ) as well as the incidence angle and the refractive indices of the IRE. The sample thickness has no influence since the penetration depth of the infrared light is fix for a given internal reflection element. Furthermore, since the sample is immersed in the IRE the spatial resolution depends on the refractive index of the IRE [47], and can be improved to several folds (corresponding to the refractive index of the IRE) in comparison to the transmission mode. For more details see [37, 47, 48]. A number of new applications using infrared ATR mapping and imaging have been presented in the last years e.g. in life, material [49 - 51], pharmaceutical [53, 54] or polymer science [52, 54].
6. Conclusions
The combination of an optical microscope, an infrared spectrometer and an array detector leads to the development of a new and powerful analytical characterisation technology, denoted as infrared microspectroscopy imaging, which can be used for e.g. the identification of normal and pathological states of tissues. This fascinating technology allows the generation of a huge amount of valuable data within a few seconds. Using e.g. a 128 x 128 pixel array detector 16 384 infrared spectra are obtained from one imaging experiment. This overwhelming number of infrared spectra and data points, evidently precludes visual examination of each single spectrum. As a consequence, it was recognised that statistical methods and chemometrical tools were required for an efficient analysis and evaluation of the data. The power of infrared imaging is due to the fact that this technique is non-invasive and non-destructing, thus the sample can, after being analysed spectroscopically, be used for histopathological analysis. Compared to e.g. fluorescence imaging, no extrinsic dyes are required for the generation of the image contrast. Especially mid infrared microspectroscopy, which covers the IR finger print region, allows the discrimination of very sensitive analytical features of the sample. Thus, the method is well suited for the examination of samples with characteristic absorptions in the infrared finger print region. However, it should be mentioned that near infrared applications are also available (not further considered in this paper). Using reflection approaches (e.g. ATR imaging) direct applications (e.g. in vivo) are feasible, with basically no sample preparation required. The presented article was intended to give a short introduction to different microspectroscopic mapping and imaging techniques. Different examples were presented, illustrating the potential of this technique. As has been shown infrared microspectroscopic imaging techniques opens new insights in biomedical diagnostic analysis at a lateral resolution in the µm-size range (≈4 µm). Thus, infrared imaging allows the biochemical identification of various components of a sample based on the intrinsic properties of the sample itself.
7. References [1] R. Bhargava, I. W. Levin, Anal. Chem. 73, 5157 (2001). [2] E. N. Lewis, P. J. Reado, R. C. Reeder, G. M. Story, A. E. Dowrey, C. Marcott, I. W. Levin, Anal. Chem. 67,
3377 (1995). [3] L. M. Miller, P. Dumas, Biochim. Biophys. Acta 1758, 846 (2006). [4] E. P. Paschalis, Clin. Cases Min. Bone Metabol. 2, 143-149 (2005). [5] M. Otto, Chemometrics, Wiley-VCH (1999). [6] K. Backhaus, B. Erichson, W. Plinke, R. Weiber, Multivariate Analysemethoden, Springer-Verlag (2003).
©FORMATEX 2007Modern Research and Educational Topics in Microscopy. A. Méndez-Vilas and J. Díaz (Eds.) _______________________________________________________________________________________________
142

[7] L. Sachs, Angewandte Statistik, Springer-Verlag (2004). [8] R. Bhargava, D. C. Fernandez, S. M. Hewitt, I. W. Levin, Biochim. Biophys. Acta 1758, 830 (2006). [9] P. Lasch, M. Diem, W. Haensch, D. Naumann, J. Chemometrics 20, 209 (2006). [10] R. Bhargava, D. C. Fernandez, S. M. Hewitt, I. W. Levin, Biochim. Biophys. Acta 1758, 830 (2006). [11] H. Günzler, H. M. Heise, IR-Spektroskopie. Weinhein, VCH-Verlag (1996). [12] B. Schrader (ed.), Infrared and Raman spectroscopy: methods and applications, Weinhein, VCH-Verlag
(1995). [13] M. Hof, R. Hutterer, V. Fidler (eds), Fluorescence spectroscopy in biology, Vol. 3, Springer-Verlag (2005). [14] C. Krafft, V. Sergo, Spectroscopy 20, 195 (2006). [15] S. Schlücker, M. D. Scharberle, S. W. Huffman, I. W. Levin, Anal. Chem. 75, 4312 (2003). [16] R. Salzer, G. Steiner, H. H. Mantsch, J. Mansfield, E. N. Lewis, Fresenius J. Anal. Chem. 366, 712 (2000). [17] E. N. Lewis, I. W. Levin, Appl. Spectroscopy 49, 672 (1995). [18] E. N. Lewis, P. J. Treado, R. C. Reeder, G. M. Story, A. E. Dowrey, C. Marcott, I. W. Levin, Anal. Chem. 67,
3377 (1995). [19] I. W. Levin, R. Bhargava, Annual. Rev. Phys. Chem. 56, 429 (2005). [20] L. H. Kidder, I. W. Levin, E. N. Lewis, V. D. Kleiman, E. J. Heilweil, Opt. Letters 22, 742 (1997). [21] K. C. Liddiard, Proceedings of SPIE - The International Society for Optical Engineering 4130, 119 (2000). [22] K. C. Liddiard, M. H. Unewisse, O. Reinhold, Proceedings of SPIE - The International Society for Optical
Engineering 2225, 62 (1994). [23] E. N. Lewis, E. Lee, L. H. Kidder, E. H. Jefferson, C. D. Ellison, P. J. Faustino, R. C. Lyon, A.S. Hussain,
Microscopy and Microanalysis 9, 1076 (2003). [24] E. N. Lewis, L. H. Kidder, J. F. Arens, M. C. Peck, I. W Levin, Appl. Spec. 51, 563 (1997). [25] C. Ricci, P. Phiriyavityopas, N. Curum, K. L. A. Chan, S. Jickells, S. G. Kazarian, Appl. Spec. 61, 514
(2007). [26] I. Pelletier, C. Pellerin, D. B. Chase, J. F. Rabolt, Appl. Spec. 59, 156 (2005). [27] A. S. Haka, I. W. Levin, E. N. Lewis, Appl. Spec. 54, 753 (2000). [28] E. N. Lewis, E. Lee, L.H. Kidder, Microscopy and Microanalysis 10, 1294 (2004). [29] I. V. Koehler, E. Lee, L. H. Kidder, E. N. Lewis, Spectroscopy Europe, 14, 12 (2002). [30] P. J. Treado, I. W. Levin, E. N. Lewis, Appl. Spec. 48, 607 (1994). [31] L. Fahrmeir, R. Künstler, I. Pigeot, Statistik, Springer-Verlag (2004). [32] P. Garidel, Phys. Chem. Chem. Phys. 4, 5671 (2002). [33] P. Garidel, H . C . Chen, D. J. Moore, E. Paschalis, R. Mendelsohn, Eur. Biophys. J. 29, 363 (2000). [34] P. Lasch, A. Pacifico, M. Diem, Biopolymers 67, 335 (2002). [35] P. Garidel, Phys. Chem. Chem. Phys. 8, 2265 (2006). [36] P. Garidel. In: The essential stratum corneum. Marks R, Levêque JL, Voegli R (eds), Martin Dunitz Ltd.,
London, chap. 52, p. 335 (2002). [37] P. Lasch, D. Naumann, Biochim. Biophys. Acta 1758, 814 (2006). [38] D. C. Fernandez, R. Bhargava, S. M. Hewitt, I. W. Levin, Nature Biotech. 23, 469 (2005). [39] P. Garidel, Phys. Chem. Chem. Phys. 5, 2673 (2003). [40] P. Garidel, Exogen. Dermatol. 3, 131 (2004). [41] P. Garidel and J. Lasch, In: Stratum corneum. The vital structure. Marks R, Matts P, Levêque JL, (eds),
Stratum Corneum Group, Cardiff, chap. 23, p. 95 (2005). [42] M. Manfait, Annales Pharmaceutiques Francaises 64, 77 (2006). [43] P. Garidel, Tech. Health. Care 12, 84 (2004). [44] P. Garidel and M. Boese, Microscopy Res. Technique 70, 336 (2007). [45] E. Goormaghtigh, V. Raussens, J. M. Ruysschaert, Biochim. Biophys. Acta 1422, 105 (1999). [46] A. Carden, M. G. Yost, R. A. Fenske, Appl. Spec. 59, 293 (2005). [47] S. G. Kazarian, K. L. A. Chan, Biochim. Biophys. Acta 1758, 858 (2006). [48] B. M. Patterson, G. J. Havrilla, Applied Spec. 60, 1256 (2006). [49] E. Sudo, Y. Esaki, M. Sugiura, A. Murase, Applied Spec. 61, 269 (2007). [50] E. Wessel, G. Heinsohn, H. Schmidt-Lewer-Kuehne, K. P. Wittern, C. Rapp, H. W. Siesler, Applied Spec. 60,
1488 (2006). [51] K. L. A. Chan, S. G. Kazarian, Applied Spec. 61, 48 (2007). [52] K. L. A. Chan, S. G. Kazarian, Prog. Colloid Polymer Sci. 132, 1 (2006). [53] K. L. A. Chan, S. G. Kazarian, Lab on a Chip – Min Chem. Biol. 6, 864 (2006). [54] N. Elkhider, K. L. A. Chan, S. G. Kazarian, J. Pharm. Sci. 96, 351 (2007). [55] L. Moghaddam, L. Rintoul, P. J. Halley, P. M. Fredericks, Polymer Tes. 25, 16 (2006).
Modern Research and Educational Topics in Microscopy. A. Méndez-Vilas and J. Díaz (Eds.) ©FORMATEX 2007 _______________________________________________________________________________________________
143