Embed Size (px)
Citation preview
CHAPTER 10
Non-invasiveimaging to identify susceptibility for ventricular arrhythmias in ischaemicleft ventricular dysfunction
HEART. 2016;102:832-40.Mischa T. RijnierseCornelis P. Allaart
Stefan de HaanHendrik J. HarmsMarc C. HuismanAernout M. Beek
Adriaan A. LammertsmaAlbert C. van Rossum
Paul Knaapen
173172
9
CHAPTER 10 Non-invasive imaging to identify susceptibility for VA
10
ABSTRACTObjective: Non-invasive imaging of myocardial perfusion, sympathetic denervation, and scar size contribute to enhanced risk prediction of ventricular arrhythmias (VA). Some of these imaging parameters, however, may be intertwined as they are based on similar pathophysiology. The aim of this study was to assess the predictive role of myocar-dial perfusion, sympathetic denervation, and scar size on the inducibility of ventricular arrhythmias (VA) in patients with ischaemic cardiomyopathy in a head-to-head fashion.
Methods: 52 patients with ischaemic heart disease and left ventricular ejection frac-tion (LVEF) ≤35%, referred for primary prevention implantable cardioverter-defibrillator (ICD) implantation were included. Late gadolinium enhanced cardiovascular magnetic resonance imaging (LGE-CMR) was performed to assess LV volumes, function, and scar size. Using [15O]H2O and [11C]hydroxyephedrine positron emission tomography (PET), both resting and hyperaemic myocardial blood flow (MBF), and sympathetic innerva-tion were assessed. After ICD implantation, an electrophysiological study (EPS) was performed and was considered positive in case of sustained VA.
Results: Patients with a positive EPS (n=25) showed more severely impaired global hyperaemic MBF (P=0.003), larger sympathetic denervation size (P=0.048), and tended to have larger scar size (P=0.07) and perfusion defect size (P=0.06) compared with EPS negative patients (n=27). No differences were observed in LV volumes, LVEF, and innervation-perfusion mismatch size. Multivariable analysis revealed that impaired hyperaemic MBF was the single best independent predictor for VA inducibility (OR 0.78, 95% CI 0.65-0.94, P=0.007). A combination of risk markers did not yield incremental predictive value over hyperaemic MBF alone.
Conclusion: Of all previously validated approaches to evaluate the arrhythmic substrate, global impaired hyperaemic MBF was the only independent predictor of VA induc-ibility. Moreover, a combined approach of different imaging variables did not have incremental value.
INTRODUCTIONPrediction of ventricular arrhythmias (VA) is essential to identify patients at highest risk for sudden cardiac death (SCD). Currently, impaired left ventricular ejection frac-tion (LVEF) is the main selection criterion for eligibility of implantable cardioverter-defibrillator (ICD) therapy for primary prevention of SCD.1 Nonetheless, several long term follow-up studies report an ICD discharge rate of only 11-35% among patients with ICDs for primary prevention2, 3, whereas the majority of SCD cases occur in patients with preserved LVEF4. Multiple previous studies have investigated novel risk markers that assess the substrate of VA using different cardiac imaging modalities.5 In patients with ischaemic left ventricular dysfunction, the characterization of scar tissue using late gadolinium enhanced - cardiovascular magnetic resonance imaging (LGE-CMR) has been frequently linked to VA inducibility and SCD.6-9 More recently, nuclear imaging studies have demonstrated that evaluating the extent of denervation, which often exceeds the infarct size, might enhance risk prediction for VA.10-12 In addition, denervated yet viable myocardium may in particular be prone to VA.12, 13 Moreover, residual ischaemia even after revascularisation may serve as an important arrhythmic substrate.14, 15 Some of these different approaches to evaluate the arrhythmic substrates are however inter-twined and may actually represent similar pathophysiology. Therefore, comparison of several risk markers within a single patient population is warranted to define the best strategy to select patients that are at highest risk for SCD. The current study is a head-to-head comparison to investigate the role of positron emission tomography (PET) assessed myocardial perfusion and sympathetic denervation, as well as LGE-CMR assessed scar size in predicting VA inducibility in patients with ischaemic heart disease and left ventricular dysfunction.
METHODSStudy population
Patients with ischaemic heart disease and LVEF ≤35% who were referred for ICD implan-tation for primary prevention of sudden cardiac death according to current guidelines1 were prospectively included. Exclusion criteria were: history of documented sustained ventricular arrhythmias, no sinus rhythm, and contra-indications for CMR, PET, or an electrophysiological study (EPS). The study was approved by the Ethics Committee of the VU University Medical Center, in accordance with the Declaration of Helsinki and written informed consent was obtained from all patients.
175174
9
CHAPTER 10 Non-invasive imaging to identify susceptibility for VA
10
PET protocol
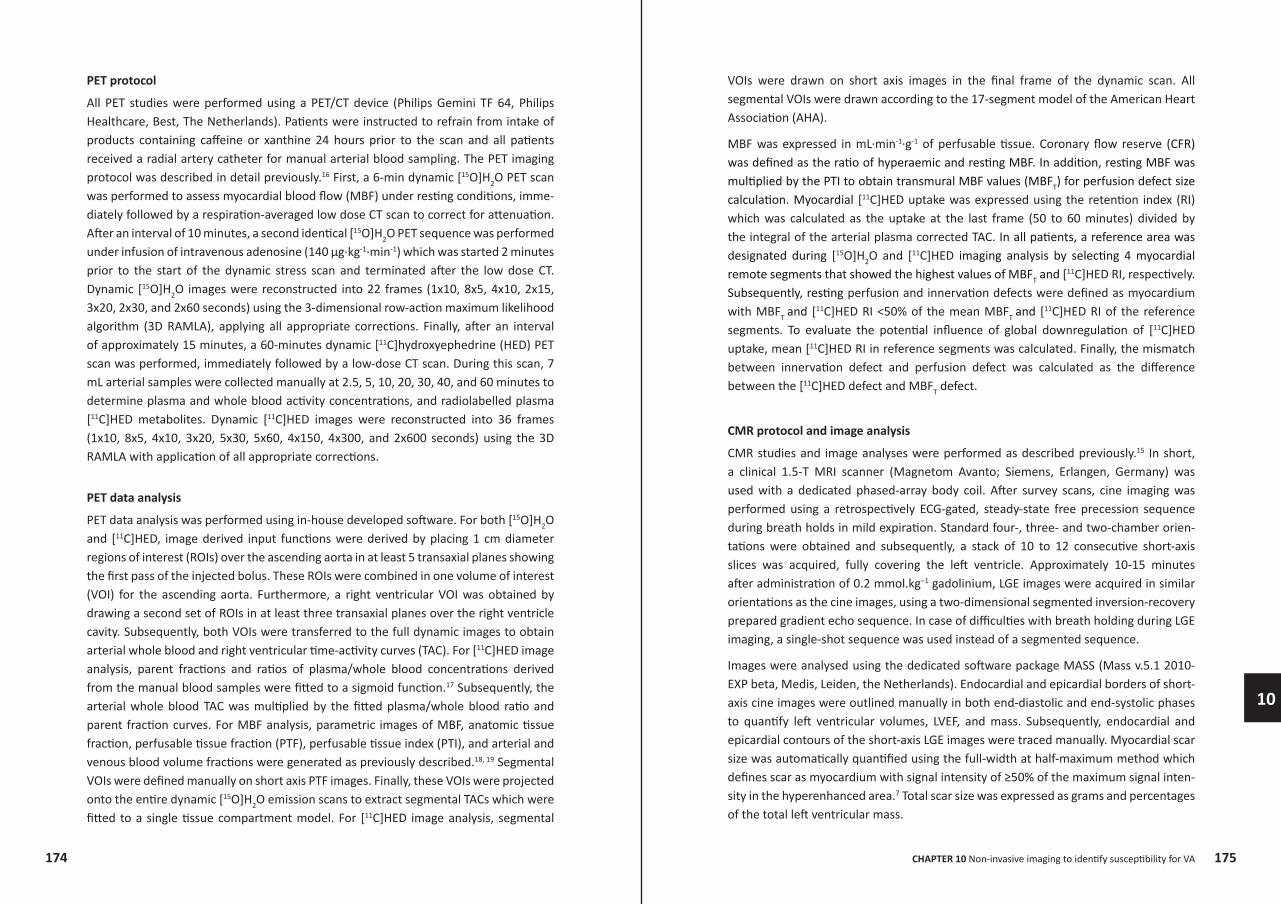
All PET studies were performed using a PET/CT device (Philips Gemini TF 64, Philips Healthcare, Best, The Netherlands). Patients were instructed to refrain from intake of products containing caffeine or xanthine 24 hours prior to the scan and all patients received a radial artery catheter for manual arterial blood sampling. The PET imaging protocol was described in detail previously.16 First, a 6-min dynamic [15O]H2O PET scan was performed to assess myocardial blood flow (MBF) under resting conditions, imme-diately followed by a respiration-averaged low dose CT scan to correct for attenuation. After an interval of 10 minutes, a second identical [15O]H2O PET sequence was performed under infusion of intravenous adenosine (140 µg∙kg-1∙min-1) which was started 2 minutes prior to the start of the dynamic stress scan and terminated after the low dose CT. Dynamic [15O]H2O images were reconstructed into 22 frames (1x10, 8x5, 4x10, 2x15, 3x20, 2x30, and 2x60 seconds) using the 3-dimensional row-action maximum likelihood algorithm (3D RAMLA), applying all appropriate corrections. Finally, after an interval of approximately 15 minutes, a 60-minutes dynamic [11C]hydroxyephedrine (HED) PET scan was performed, immediately followed by a low-dose CT scan. During this scan, 7 mL arterial samples were collected manually at 2.5, 5, 10, 20, 30, 40, and 60 minutes to determine plasma and whole blood activity concentrations, and radiolabelled plasma [11C]HED metabolites. Dynamic [11C]HED images were reconstructed into 36 frames (1x10, 8x5, 4x10, 3x20, 5x30, 5x60, 4x150, 4x300, and 2x600 seconds) using the 3D RAMLA with application of all appropriate corrections.
PET data analysis
PET data analysis was performed using in-house developed software. For both [15O]H2O and [11C]HED, image derived input functions were derived by placing 1 cm diameter regions of interest (ROIs) over the ascending aorta in at least 5 transaxial planes showing the first pass of the injected bolus. These ROIs were combined in one volume of interest (VOI) for the ascending aorta. Furthermore, a right ventricular VOI was obtained by drawing a second set of ROIs in at least three transaxial planes over the right ventricle cavity. Subsequently, both VOIs were transferred to the full dynamic images to obtain arterial whole blood and right ventricular time-activity curves (TAC). For [11C]HED image analysis, parent fractions and ratios of plasma/whole blood concentrations derived from the manual blood samples were fitted to a sigmoid function.17 Subsequently, the arterial whole blood TAC was multiplied by the fitted plasma/whole blood ratio and parent fraction curves. For MBF analysis, parametric images of MBF, anatomic tissue fraction, perfusable tissue fraction (PTF), perfusable tissue index (PTI), and arterial and venous blood volume fractions were generated as previously described.18, 19 Segmental VOIs were defined manually on short axis PTF images. Finally, these VOIs were projected onto the entire dynamic [15O]H2O emission scans to extract segmental TACs which were fitted to a single tissue compartment model. For [11C]HED image analysis, segmental
VOIs were drawn on short axis images in the final frame of the dynamic scan. All segmental VOIs were drawn according to the 17-segment model of the American Heart Association (AHA).
MBF was expressed in mL∙min-1∙g-1 of perfusable tissue. Coronary flow reserve (CFR) was defined as the ratio of hyperaemic and resting MBF. In addition, resting MBF was multiplied by the PTI to obtain transmural MBF values (MBFT) for perfusion defect size calculation. Myocardial [11C]HED uptake was expressed using the retention index (RI) which was calculated as the uptake at the last frame (50 to 60 minutes) divided by the integral of the arterial plasma corrected TAC. In all patients, a reference area was designated during [15O]H2O and [11C]HED imaging analysis by selecting 4 myocardial remote segments that showed the highest values of MBFT and [11C]HED RI, respectively. Subsequently, resting perfusion and innervation defects were defined as myocardium with MBFT and [11C]HED RI <50% of the mean MBFT and [11C]HED RI of the reference segments. To evaluate the potential influence of global downregulation of [11C]HED uptake, mean [11C]HED RI in reference segments was calculated. Finally, the mismatch between innervation defect and perfusion defect was calculated as the difference between the [11C]HED defect and MBFT defect.
CMR protocol and image analysis
CMR studies and image analyses were performed as described previously.15 In short, a clinical 1.5-T MRI scanner (Magnetom Avanto; Siemens, Erlangen, Germany) was used with a dedicated phased-array body coil. After survey scans, cine imaging was performed using a retrospectively ECG-gated, steady-state free precession sequence during breath holds in mild expiration. Standard four-, three- and two-chamber orien-tations were obtained and subsequently, a stack of 10 to 12 consecutive short-axis slices was acquired, fully covering the left ventricle. Approximately 10-15 minutes after administration of 0.2 mmol.kg−1 gadolinium, LGE images were acquired in similar orientations as the cine images, using a two-dimensional segmented inversion-recovery prepared gradient echo sequence. In case of difficulties with breath holding during LGE imaging, a single-shot sequence was used instead of a segmented sequence.
Images were analysed using the dedicated software package MASS (Mass v.5.1 2010-EXP beta, Medis, Leiden, the Netherlands). Endocardial and epicardial borders of short-axis cine images were outlined manually in both end-diastolic and end-systolic phases to quantify left ventricular volumes, LVEF, and mass. Subsequently, endocardial and epicardial contours of the short-axis LGE images were traced manually. Myocardial scar size was automatically quantified using the full-width at half-maximum method which defines scar as myocardium with signal intensity of ≥50% of the maximum signal inten-sity in the hyperenhanced area.7 Total scar size was expressed as grams and percentages of the total left ventricular mass.
177176
9
CHAPTER 10 Non-invasive imaging to identify susceptibility for VA
10
Electrophysiological study
A non-invasive EPS was performed after ICD implantation using the device program-mer and consisted of a programmed stimulation protocol including two 8-beat drive trains (cycle lengths of 600 and 400 ms) immediately followed by up to 3 extrastimuli.15 Extrastimuli were delivered at progressively shorter coupling intervals in 20-ms steps until the effective refractory period or 180 ms was reached. If no sustained VA was induced, the protocol was repeated with a basic cycle length of 400 ms under infusion of isoproterenol (aimed baseline heart rate 100-110/min). The EPS was performed and interpreted by an experienced electrophysiologist, blinded to the imaging data. A posi-tive EPS was defined as the induction of a sustained monomorphic or polymorphic VA lasting >30 seconds or requiring termination in case of hemodynamic instability.
Statistical analysis
Continuous variables are presented as mean ± SD and categorical data are summarized as frequencies and percentages. Histograms were used to evaluate if continuous data were normally distributed. Groups with positive and negative EPS were compared using the independent Student’s t test for continuous variables and two-tailed Fisher’s exact test for categorical data. Levene’s test for equality of variances was used to verify if the independent Student’s t test was appropriate. Non-normal data were compared with Mann-Whitney U test when appropriate. Comparisons of paired data were performed with the paired t test. Receiver operating characteristic (ROC) curve analysis was performed and areas under the curve (AUC) were calculated. Furthermore, univariable logistic regression analyses were performed for all clinical and imaging variables that may be associated with VAs. Variables with P-value below 0.10 at univariable analysis were entered in a multivariable model using a forward stepwise selection procedure to prevent overfitting. The following variables were entered in the multivariable model: hyperaemic MBF, resting perfusion defect size, innervation defect size, and ACE/ARB usage. Furthermore, multivariable logistic regression analyses were repeated, each time entering the most significant predictor of a positive EPS (hyperaemic MBF), combined with other imaging variables to investigate their interrelations and combined predictive power. The predictive power of each multivariable model was expressed by the Nagelkerke R2 and ROC AUC analysis. All tests were performed two-sided and were considered statistically significant if P-value was below 0.05. All statistical analyses were performed using SPSS software package (SPSS 20.0, IBM Corporation, Chicago, IL, USA).
RESULTSStudy population
52 patients with ischaemic left ventricular dysfunction who underwent an EPS after ICD implantation were included. Clinical baseline characteristics are presented in table 1 and figure 1 displays some graphical examples of the imaging protocol. Sustained VA was inducible in 25 (48%) patients. Most of the patients (n=22) with a positive EPS showed a monomorphic VA, whereas 3 patients showed a polymorphic VA. Isoproter-enol infusion was not needed to induce VA in the majority of patients with a positive EPS (n=22), while in 3 patients a monomorphic VA was induced during infusion of isoproterenol. Patients with a positive EPS used significantly less often angiotensine-II-receptor blockers (ARB) or angiotensin converting enzyme inhibitors (ACE) compared with patients having a negative EPS (68% vs. 93%, respectively, P=0.04). Among patients who underwent PCI/CABG, the revascularisation procedure was successful in 98% which did not differ significantly between EPS positive and EPS negative patients (95% vs. 100%, respectively, P=0.49). None of the patients were considered candidates for (further) revascularization. No other differences in baseline characteristics were observed between both groups.
179178
9
CHAPTER 10 Non-invasive imaging to identify susceptibility for VA
10
Table 1. Baseline characteristics
Characteristics(N (%), mean ± SD, or median (IQR))
Total(n=52)
EPS positive(n=25)
EPS negative(n=27)
P-value(EPS+ vs.
EPS-)
Age (years) 66 ± 9 66 ± 8 65 ± 10 0.70
Male gender 47 (90%) 23 (92%) 24 (89%) 1.00
Body mass index (kg/m2) 27.6 ± 4.5 28.3 ± 4.7 27.1 ± 4.3 0.34
Diabetes mellitus 10 (19%) 7 (28%) 3 (11%) 0.17
Hypertension 17 (33%) 7 (28%) 10 (37%) 0.56
Hyperlipidemia 16 (31%) 9 (36%) 7 (26%) 0.55
PCI/CABG 43 (83%) 21 (84%) 22 (82%) 1.00
Heart failure:
NYHA I 21 (40%) 11 (41%) 10 (40%) 0.91
NYHA II 28 (54%) 15 (56%) 13 (52%) 0.91
NYHA III 3 (6%) 1 (4%) 2 (8%) 0.91
QRS duration (ms) 108 (96 – 129) 102 (94 – 130) 112 (97 – 119) 0.50*
Medication:
ACE/ARB 42 (81%) 17 (68%) 25 (93%) 0.04
Beta-blockers 49 (94%) 23 (92%) 26 (96%) 0.60
Ca channel blocker 5 (10%) 4 (16%) 1 (4%) 0.18
Diuretics 30 (58%) 17 (68%) 13 (48%) 0.17
Statin 47 (90%) 24 (96%) 23 (85%) 0.35
Amiodarone 2 (4%) 2 (8%) 0 (0%) 0.23
NT-proBNP (ng/L) 766 (441-1112) 631 (339-1090) 816 (514-1421) 0.27*
Creatinine (µmol/L) 89 (77-103) 92 (80-112) 85 (75-99) 0.22*
ACE, angiotensin converting enzyme inhibitors; ARB, angiotensin-II-receptor blockers; Ca, calcium; CABG, coronary arterial bypass graft surgery; EPS, electrophysiological study; NT-proBNP, N-terminal prohormone of brain natriuretic peptide; NYHA, New York Heart Association; PCI, percutaneous coronary intervention. * tested using the Mann-Whitney U test.
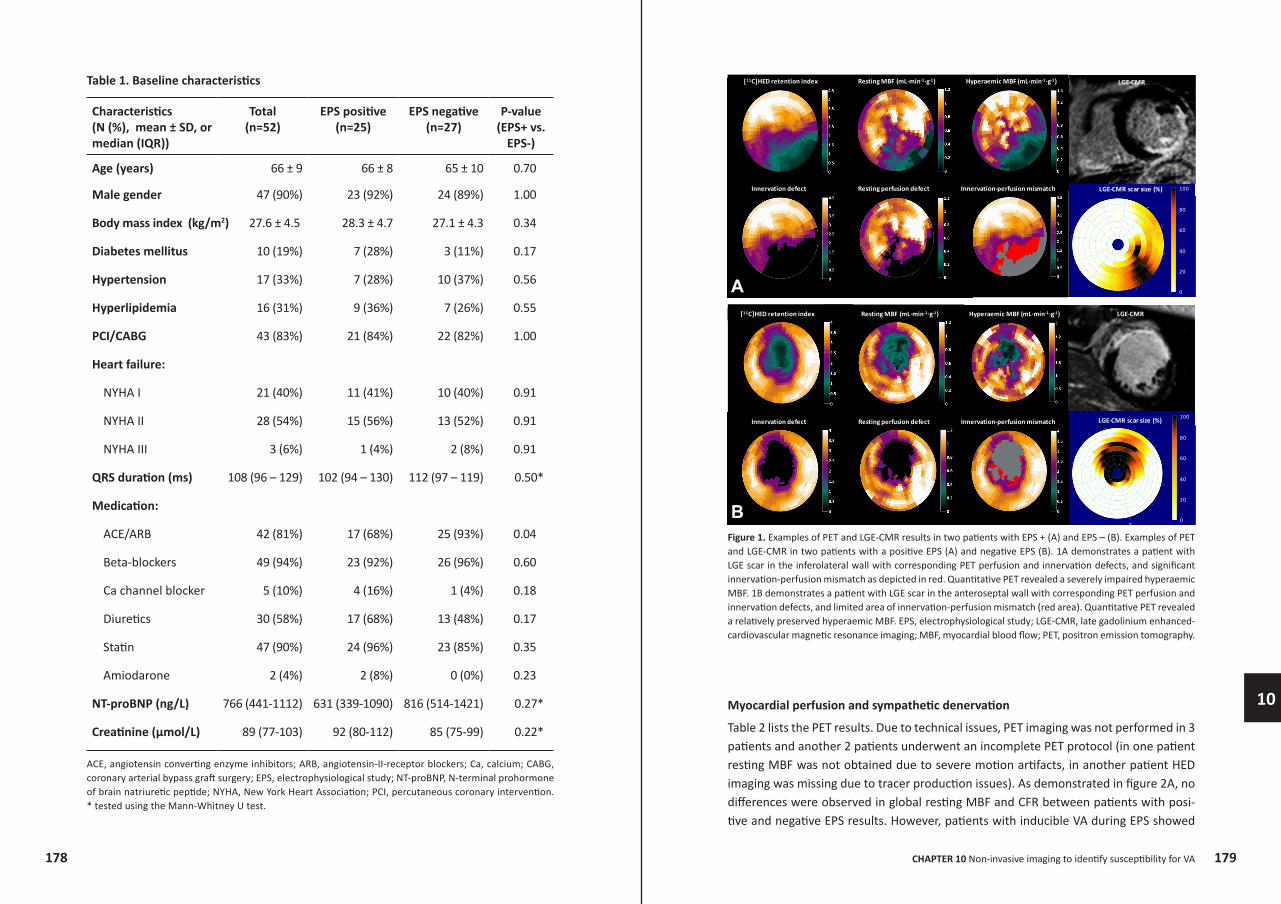
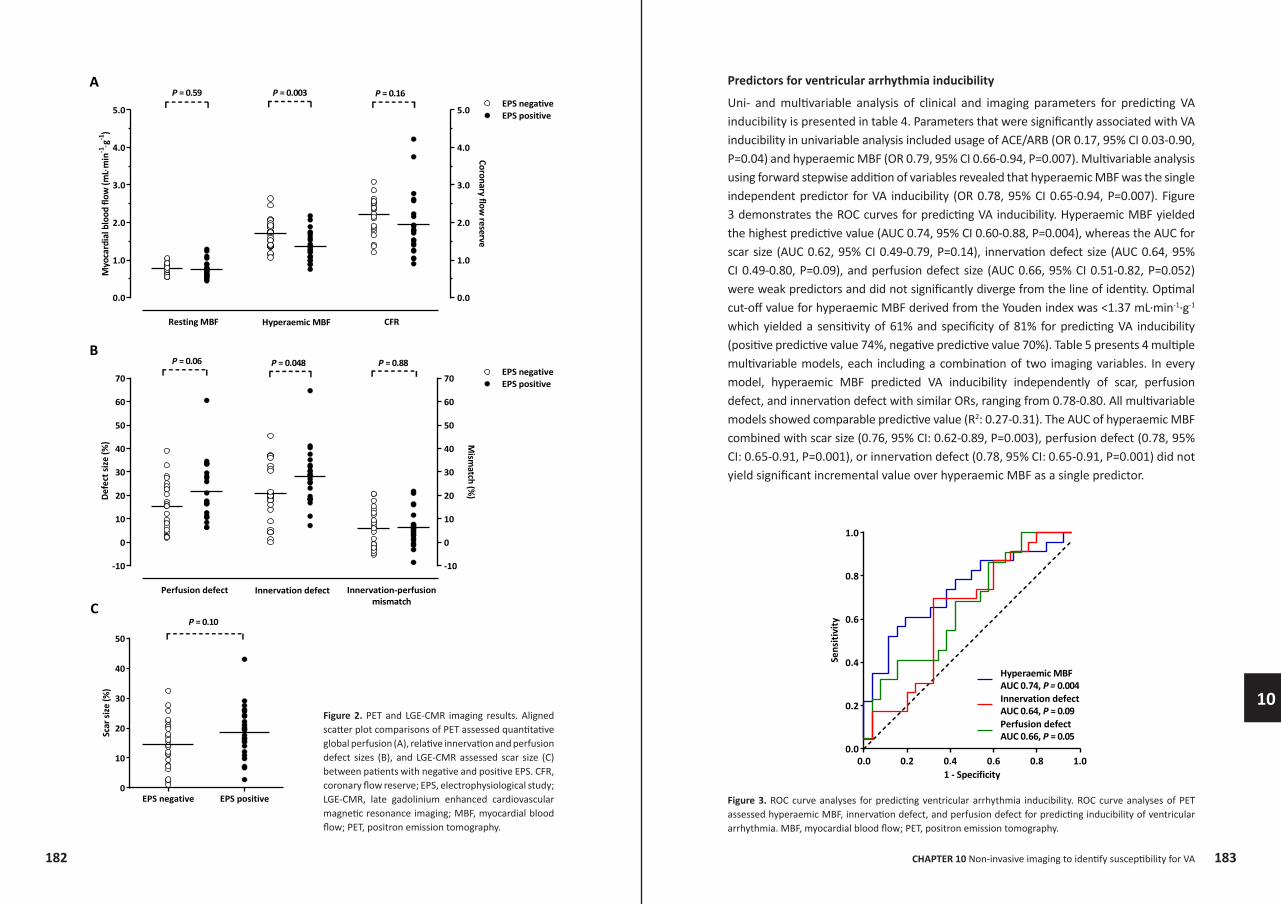
Figure 1. Examples of PET and LGE-CMR results in two patients with EPS + (A) and EPS – (B). Examples of PET and LGE-CMR in two patients with a positive EPS (A) and negative EPS (B). 1A demonstrates a patient with LGE scar in the inferolateral wall with corresponding PET perfusion and innervation defects, and significant innervation-perfusion mismatch as depicted in red. Quantitative PET revealed a severely impaired hyperaemic MBF. 1B demonstrates a patient with LGE scar in the anteroseptal wall with corresponding PET perfusion and innervation defects, and limited area of innervation-perfusion mismatch (red area). Quantitative PET revealed a relatively preserved hyperaemic MBF. EPS, electrophysiological study; LGE-CMR, late gadolinium enhanced-cardiovascular magnetic resonance imaging; MBF, myocardial blood flow; PET, positron emission tomography.
Myocardial perfusion and sympathetic denervation
Table 2 lists the PET results. Due to technical issues, PET imaging was not performed in 3 patients and another 2 patients underwent an incomplete PET protocol (in one patient resting MBF was not obtained due to severe motion artifacts, in another patient HED imaging was missing due to tracer production issues). As demonstrated in figure 2A, no differences were observed in global resting MBF and CFR between patients with posi-tive and negative EPS results. However, patients with inducible VA during EPS showed
LGE-CMRscar size (%) 100
80
60
40
20
0
Resting perfusion defect
Resting perfusion defectInnervation defect Innervation-perfusion mismatch
LGE-CMRscar size (%) 100
80
60
40
20
0
[11C]HEDretention index RestingMBF(mL·min-1·g-1) Hyperaemic MBF(mL·min-1·g-1)
Innervation defect Innervation-perfusion mismatch
LGE-CMR
LGE-CMR
A
B
[11C]HEDretention index RestingMBF(mL·min-1·g-1) Hyperaemic MBF(mL·min-1·g-1)
181180
9
CHAPTER 10 Non-invasive imaging to identify susceptibility for VA
10
significantly lower hyperaemic MBF (1.36 ± 0.39 mL∙min-1∙g-1 vs. 1.71 ± 0.39 mL∙min-1∙g-1, P=0.003). The global innervation defect size significantly exceeded the global perfusion defect size (24.2 ± 12.6 % vs. 18.3 ± 12.0 %, respectively, P<0.001). Figure 2B pres-ents global perfusion defect, innervation defect, and innervation-perfusion mismatch compared between EPS positive and negative groups. A larger area of denervation was observed in patients who showed VA inducibility as compared with negative EPS patients (27.9 ± 11.9 % vs. 20.7 ± 12.6 %, P=0.048). Furthermore, a trend was observed towards a larger perfusion defect in patients with inducible VA during EPS (21.8 ± 12.8 % vs. 15.3 ± 10.7 %, P=0.06). The mismatch between the innervation defect and perfusion defect, however, did not differ between both groups (6.2 ± 7.5 % vs. 5.9 ± 8.0 %, P=0.88). No difference was observed in mean [11C]HED RI in reference segments between EPS positive and negative patients (3.40 ± 0.93 vs. 3.73 ± 0.94, respectively, P=0.23).
Table 2. PET results
Characteristics(mean ± SD)
Total(n=49)
EPS positive(n=23)
EPS negative(n=26)
P-value(EPS+ vs.
EPS-)
Global:
Resting MBF (mL∙min−1∙g−1)*
0.77 ± 0.19 0.75 ± 0.24 0.78 ± 0.14 0.59
Hyperaemic MBF (mL∙min−1∙g−1)
1.54 ± 0.42 1.36 ± 0.39 1.71 ± 0.39 0.003
CFR* 2.09 ± 0.67 1.94 ± 0.84 2.21 ± 0.47 0.16
[11C]HED RI† 2.62 ± 0.77 2.41 ± 0.72 2.81 ± 0.77 0.07
Defect size:
Perfusion defect (MBFT) (%)*
18.3 ± 12.0 21.8 ± 12.8 15.3 ± 10.7 0.06
Innervation defect ([11C]HED RI) (%)†
24.2 ± 12.6 27.9 ± 11.9 20.7 ± 12.6 0.048
Innervation-perfusion mismatch (%) ⱡ
6.0 ± 7.7 6.2 ± 7.5 5.9 ± 8.0 0.88
CFR, coronary flow reserve; EPS, electrophysiological study; HED, hydroxyephedrine; MBF, myocardial blood flow; MBTT, transmural myocardial blood flow; PET, positron emission tomography; RI, retention index. *
Based on n=48 (n=22 EPS+ vs. n=26 EPS-). † Based on n=48 (n=23 EPS+ vs. n=25 EPS-). ⱡ Based on n=47 (n=22 EPS+ vs. n=25 EPS-).
Myocardial function and infarct size
Table 3 presents LGE-CMR results. In one patient, LGE could not be interpreted due to poor image quality. No differences were observed in LVEF, LV volumes, and mass between patients with positive and negative EPS. Patients with VA inducibility tended to have larger scar size as quantified in grams (23.8 ± 13.1 g vs. 18.1 ± 9.2 g, P=0.07). The difference in scar size expressed as percentage of the total LV mass between EPS positive and EPS negative patient groups did not reach significance either (18.6 ± 8.7 % vs. 14.7 ± 8.2 %, respectively, P=0.10) (figure 2C).
Table 3. CMR results
Characteristics(mean ± SD)
Total(n=52)
EPS positive(n=25)
EPS negative(n=27)
P-value(EPS+ vs.
EPS-)
LVEF (%) 28.7 ± 5.9 29.1 ± 5.9 28.4 ± 5.9 0.67
LVEDV (mL) 280.0 ± 61.9 284.0 ± 72.2 276.3 ± 51.8 0.66
LVEDVI (mL/m2) 141.0 ± 30.5 138.5 ± 35.7 143.3 ± 25.2 0.58
LVESV (mL) 201.3 ± 55.1 203.3 ± 63.5 199.5 ± 47.1 0.81
LVESVI (mL/m2) 101.5 ± 28.4 99.5 ± 33.0 103.5 ± 23.8 0.62
LV mass (g) 133.5 ± 36.7 129.7 ± 32.9 137.1 ± 40.3 0.47
LV mass index (g/m2) 67.0 ± 16.8 62.9 ± 13.9 70.8 ± 18.7 0.09
Scar size (%)* 16.5 ± 8.6 18.6 ± 8.7 14.7 ± 8.2 0.10
Scar size (g)* 20.8 ± 11.5 23.8 ± 13.1 18.1 ± 9.2 0.07
EPS, electrophysiological study; LV, left ventricle; LVEDV, left ventricular end-diastolic volume; LVEDVI, left ventricular end-diastolic volume index; LVEF, left ventricular ejection fraction; LVESV, left ventricular end-systolic volume; LVESVI, left ventricular end-systolic volume index. * Based on n=51 (n=24 EPS+ vs. n=27 EPS-).
183182
9
CHAPTER 10 Non-invasive imaging to identify susceptibility for VA
10
0.0
1.0
2.0
3.0
4.0
5.0
0.0
1.0
2.0
3.0
4.0
5.0
P = 0.003EPS negativeEPS positive
P = 0.59
Resting MBF Hyperaemic MBF CFR
P = 0.16M
yoca
rdia
lblo
odflo
w(m
Lm
in-1 g
-1)
Coronaryflow
reserve
-10
0
10
20
30
40
50
60
70
-10
0
10
20
30
40
50
60
70
P = 0.048P = 0.06
Perfusion defect Innervation defect Innervation-perfusionmismatch
P = 0.88EPS negativeEPS positive
Defe
ctsiz
e(%
) Mism
atch(%
)EPS negative EPS positive
0
10
20
30
40
50
P = 0.10
Scar
size
(%)
A
B
C
Figure 2. PET and LGE-CMR imaging results. Aligned scatter plot comparisons of PET assessed quantitative global perfusion (A), relative innervation and perfusion defect sizes (B), and LGE-CMR assessed scar size (C) between patients with negative and positive EPS. CFR, coronary flow reserve; EPS, electrophysiological study; LGE-CMR, late gadolinium enhanced cardiovascular magnetic resonance imaging; MBF, myocardial blood flow; PET, positron emission tomography.
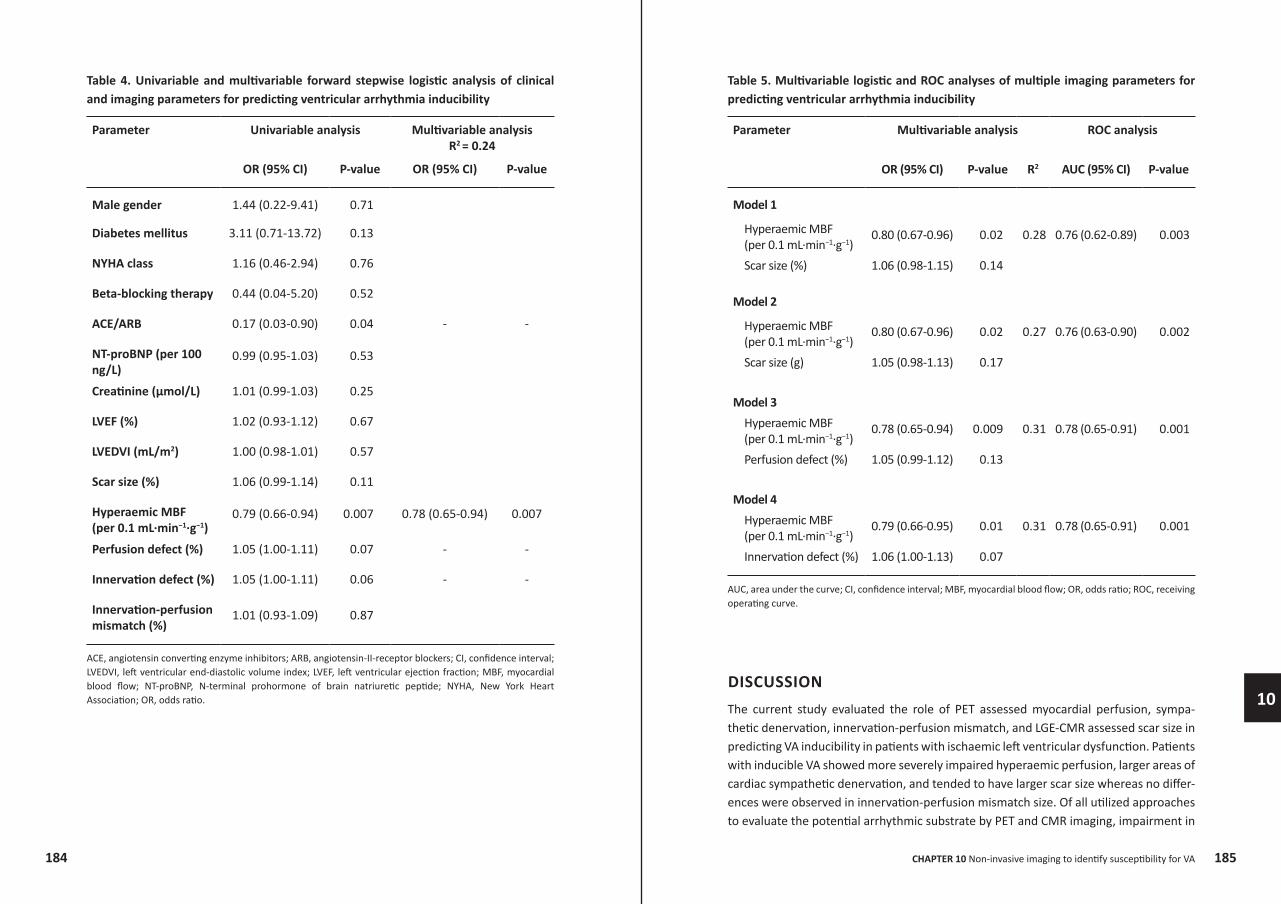
Predictors for ventricular arrhythmia inducibility
Uni- and multivariable analysis of clinical and imaging parameters for predicting VA inducibility is presented in table 4. Parameters that were significantly associated with VA inducibility in univariable analysis included usage of ACE/ARB (OR 0.17, 95% CI 0.03-0.90, P=0.04) and hyperaemic MBF (OR 0.79, 95% CI 0.66-0.94, P=0.007). Multivariable analysis using forward stepwise addition of variables revealed that hyperaemic MBF was the single independent predictor for VA inducibility (OR 0.78, 95% CI 0.65-0.94, P=0.007). Figure 3 demonstrates the ROC curves for predicting VA inducibility. Hyperaemic MBF yielded the highest predictive value (AUC 0.74, 95% CI 0.60-0.88, P=0.004), whereas the AUC for scar size (AUC 0.62, 95% CI 0.49-0.79, P=0.14), innervation defect size (AUC 0.64, 95% CI 0.49-0.80, P=0.09), and perfusion defect size (AUC 0.66, 95% CI 0.51-0.82, P=0.052) were weak predictors and did not significantly diverge from the line of identity. Optimal cut-off value for hyperaemic MBF derived from the Youden index was <1.37 mL∙min-1∙g-1 which yielded a sensitivity of 61% and specificity of 81% for predicting VA inducibility (positive predictive value 74%, negative predictive value 70%). Table 5 presents 4 multiple multivariable models, each including a combination of two imaging variables. In every model, hyperaemic MBF predicted VA inducibility independently of scar, perfusion defect, and innervation defect with similar ORs, ranging from 0.78-0.80. All multivariable models showed comparable predictive value (R2: 0.27-0.31). The AUC of hyperaemic MBF combined with scar size (0.76, 95% CI: 0.62-0.89, P=0.003), perfusion defect (0.78, 95% CI: 0.65-0.91, P=0.001), or innervation defect (0.78, 95% CI: 0.65-0.91, P=0.001) did not yield significant incremental value over hyperaemic MBF as a single predictor.
Figure 3. ROC curve analyses for predicting ventricular arrhythmia inducibility. ROC curve analyses of PET assessed hyperaemic MBF, innervation defect, and perfusion defect for predicting inducibility of ventricular arrhythmia. MBF, myocardial blood flow; PET, positron emission tomography.
0.0 0.2 0.4 0.6 0.8 1.00.0
0.2
0.4
0.6
0.8
1.0
Hyperaemic MBFAUC 0.74, P = 0.004Innervation defectAUC 0.64, P = 0.09Perfusion defectAUC 0.66, P = 0.05
1 - Specificity
Sens
itivi
ty
185184
9
CHAPTER 10 Non-invasive imaging to identify susceptibility for VA
10
Table 4. Univariable and multivariable forward stepwise logistic analysis of clinical and imaging parameters for predicting ventricular arrhythmia inducibility
Parameter Univariable analysis Multivariable analysisR2 = 0.24
OR (95% CI) P-value OR (95% CI) P-value
Male gender 1.44 (0.22-9.41) 0.71
Diabetes mellitus 3.11 (0.71-13.72) 0.13
NYHA class 1.16 (0.46-2.94) 0.76
Beta-blocking therapy 0.44 (0.04-5.20) 0.52
ACE/ARB 0.17 (0.03-0.90) 0.04 - -
NT-proBNP (per 100 ng/L)
0.99 (0.95-1.03) 0.53
Creatinine (µmol/L) 1.01 (0.99-1.03) 0.25
LVEF (%) 1.02 (0.93-1.12) 0.67
LVEDVI (mL/m2) 1.00 (0.98-1.01) 0.57
Scar size (%) 1.06 (0.99-1.14) 0.11
Hyperaemic MBF(per 0.1 mL∙min−1∙g−1)
0.79 (0.66-0.94) 0.007 0.78 (0.65-0.94) 0.007
Perfusion defect (%) 1.05 (1.00-1.11) 0.07 - -
Innervation defect (%) 1.05 (1.00-1.11) 0.06 - -
Innervation-perfusion mismatch (%)
1.01 (0.93-1.09) 0.87
ACE, angiotensin converting enzyme inhibitors; ARB, angiotensin-II-receptor blockers; CI, confidence interval; LVEDVI, left ventricular end-diastolic volume index; LVEF, left ventricular ejection fraction; MBF, myocardial blood flow; NT-proBNP, N-terminal prohormone of brain natriuretic peptide; NYHA, New York Heart Association; OR, odds ratio.
Table 5. Multivariable logistic and ROC analyses of multiple imaging parameters for predicting ventricular arrhythmia inducibility
Parameter Multivariable analysis ROC analysis
OR (95% CI) P-value R2 AUC (95% CI) P-value
Model 1
Hyperaemic MBF(per 0.1 mL∙min−1∙g−1)
0.80 (0.67-0.96) 0.02 0.28 0.76 (0.62-0.89) 0.003
Scar size (%) 1.06 (0.98-1.15) 0.14
Model 2
Hyperaemic MBF(per 0.1 mL∙min−1∙g−1)
0.80 (0.67-0.96) 0.02 0.27 0.76 (0.63-0.90) 0.002
Scar size (g) 1.05 (0.98-1.13) 0.17
Model 3Hyperaemic MBF(per 0.1 mL∙min−1∙g−1)
0.78 (0.65-0.94) 0.009 0.31 0.78 (0.65-0.91) 0.001
Perfusion defect (%) 1.05 (0.99-1.12) 0.13
Model 4Hyperaemic MBF(per 0.1 mL∙min−1∙g−1)
0.79 (0.66-0.95) 0.01 0.31 0.78 (0.65-0.91) 0.001
Innervation defect (%) 1.06 (1.00-1.13) 0.07
AUC, area under the curve; CI, confidence interval; MBF, myocardial blood flow; OR, odds ratio; ROC, receiving operating curve.
DISCUSSIONThe current study evaluated the role of PET assessed myocardial perfusion, sympa-thetic denervation, innervation-perfusion mismatch, and LGE-CMR assessed scar size in predicting VA inducibility in patients with ischaemic left ventricular dysfunction. Patients with inducible VA showed more severely impaired hyperaemic perfusion, larger areas of cardiac sympathetic denervation, and tended to have larger scar size whereas no differ-ences were observed in innervation-perfusion mismatch size. Of all utilized approaches to evaluate the potential arrhythmic substrate by PET and CMR imaging, impairment in
187186
9
CHAPTER 10 Non-invasive imaging to identify susceptibility for VA
10
quantitatively assessed global hyperaemic perfusion showed highest predictive value. Moreover, it was independent of other imaging parameters and patient characteristics. Furthermore, a combined approach of different imaging modalities did not yield incre-mental value over the sole assessment of hyperaemic perfusion in selecting patients that may be at highest risk of VA.
Myocardial perfusion
Ischaemia is an important trigger or substrate for VA.14, 20, 21 Consequently, optimal revas-cularisation strategies are crucial in patients with ischaemic left ventricular dysfunction and are generally performed prior to ICD implantation.1 The current study demonstrated that in a population referred for primary prevention ICD therapy, impairment in global hyperaemic perfusion was related to VA inducibility. These data confirm the results that were obtained in a comparable previous pilot study.15 Quantitative [15O]H2O PET assessment of global hyperaemic MBF in ischaemic left ventricular dysfunction reflect a mixture of residual subtle ischaemia, flow within areas surrounding scar, and flow in remote myocardium. Nonetheless, we have previously demonstrated that regional assessment of hyperaemic MBF within scar and remote areas, or heterogeneity, were all related with VA inducibility but did not have incremental value over the assess-ment of global hyperaemic MBF.15 The current study, therefore, only evaluated global hyperaemic MBF and showed that the relation of hyperaemic MBF and VA inducibility is independent of scar size or innervation defect size. [15O]H2O PET imaging quantifies MBF in viable tissue that is capable of exchanging water rapidly only, therefore scar size is excluded in the MBF calculation.22, 23 In contrast to the previous findings, however, the difference in CFR between EPS positive and negative patients did not reach significance. As the CFR is also dependent on resting perfusion, patients with low resting perfusion might have a high CFR whereas hyperaemic MBF is relatively impaired. Several explana-tions may account for the observed relation between global impairment in hyperaemic MBF and susceptibility for VA rather than regional damaged myocardium. Although none of the included patients were considered candidates for further revascularisation, residual perfusion abnormalities not amenable for revascularisation may still be present which can be detected and quantified by PET perfusion imaging. These perfusion abnor-malities could be caused by more severe diffuse epicardial coronary artery disease or (micro)vascular dysfunction extending beyond epicardial coronary arteries. These results suggest that the severity of perfusion abnormalities, even after revascularisa-tion, may result in (subtle) residual ischaemia which relates to susceptibility for VA.
Sympathetic denervation
The area of sympathetic denervation was found to exceed the infarct size, which has been observed previously and most likely is caused by the higher vulnerability of cardiac nerves to oxygen deprivation than myocytes.24, 25 The recently published PAREPET study
was the first to evaluate the role of PET assessed myocardial sympathetic innervation, viability, and resting perfusion in predicting the occurrence of appropriate ICD therapy in patients with ischaemic left ventricular dysfunction.12 Although the current study used a different definition of denervated myocardium than the PAREPET study (<50% of remote vs. <75% of peak, respectively), the observed total innervation defect size was comparable (24 ± 13% vs. 27 ± 11%, respectively), while both studies showed a total infarct size of 17 ± 9% and 20 ± 9%, respectively, resulting in a comparable size of denervated but viable myocardium. The current study showed that the total size of sympathetic denervation was larger in patients that displayed sustained VA during EPS. As areas of sympathetic denervation show altered refractoriness and supersensitivity to sympathetic stimulation causing electrical instability, they might serve as arrhythmic substrate.26, 27 Consistently, a previous study performed in patients with ischaemic left ventricular dysfunction revealed that patients with positive EPS showed larger areas of late [123I]metaiodobenzylguanidine (MIBG) SPECT defect size, whereas for perfusion defect size only a trend was observed.10 Moreover, the predictive value of late [123I]MIBG defect was confirmed for appropriate ICD therapy in a more recent study.11 Although the [11C]HED PET defect size is closely related to the early and late [123I]MIBG SPECT defect size, it provides superior spatial resolution and potential for absolute quantification.28 The PAREPET study demonstrated that the total size of cardiac denervation predicted appropriate ICD therapy, independent of LVEF, infarct volume, and hibernating myocar-dium. Consistent with the current study, no differences were found in peak [11C]HED RI in remote myocardium, suggesting that potential downregulation of [11C]HED uptake did not influence these results. However, in the current study the size of denervated myocardium did not predict VA inducibility independently. Furthermore, no relation was observed between VA inducibility and the size of innervation-perfusion mismatch. Although in an animal model, promising results were obtained linking the magnitude of the innervation-perfusion mismatch to increased VA inducibility and its location of origin13, clinical studies have reported inconsequential results.10-12 Studies using SPECT did not find a significant relation between the innervation-perfusion mismatch size and VA inducibility or spontaneous VA10, 11, whereas the PAREPET study revealed a signifi-cant relation with ICD therapy for fast VA.12 A potential explanation of the inconsistent findings in the current study may be the use of VA inducibility as endpoint instead of spontaneous fast VA. Second, the spatial resolution of PET imaging may still not be sufficient for a detailed mismatch calculation in every patient. The PAREPET study also showed that global innervation defect was more predictive of VA compared to the mismatch area.12 Finally, technical issues such as patient motion during the extensive scanning protocol with different serial PET scans may have occurred and introduced some difficulties in the mismatch calculation. The results in this study support these findings suggesting that the total size of denervation might be more importantly related to VA than the mismatch area itself.
189188
9
CHAPTER 10 Non-invasive imaging to identify susceptibility for VA
10
Myocardial scar
Interestingly, the current study showed only a trend towards larger scar size in patients with VA inducibility. Bello et al.6, however, revealed that scar size was related to VA inducibility, in particular for monomorphic VA. The current study also considered poly-morphic VA as positive EPS result, which might explain the inconsistencies. Further-more, it has been suggested that the CMR assessment of infarct border zone is more importantly related to VA inducibility.29 However, in a comparable previous pilot study we could not confirm these results, although the included patient population was smaller.15 The relation between scar characteristics and spontaneous VA has been more consistently demonstrated in larger follow-up studies and the predictive value of scar core and borderzone may be comparable.6-9
Limitations
Several limitations in this study need to be addressed. Inducible sustained VA during EPS is not an equivalent of SCD. Although a positive EPS is a predictor of clinical events of SCD, the predictive accuracy is limited. However, a recent study revealed that among patients with severely impaired LVEF and no inducible VA early after MI, 93% remained free from arrhythmia or death after 3 years of follow up without the protection of an ICD, designating its high negative predictive value.30 Second, the size of the patient population is relatively small which may have obscured some significant imaging param-eters and allowed only limited multivariable risk analyses. Hence, the results of the current study should be interpreted with caution and future studies with more relevant endpoints in long-term follow-up with larger number of patients are required to deter-mine the best risk stratification approach for SCD. Third, it must be acknowledged that although global PET assessed hyperaemic MBF appeared to be the single most impor-tant imaging parameter for the prediction of VA, the overlap between EPS positive and negative patients was quite substantial. This implicates that clinical decision making based on such imaging parameters will probably prove to be challenging. In addition, the frequency of ACE/ARB usage was different between EPS positive and negative patients which may be a confusing factor. The use of ACE/ARB, however, may indirectly result in reduced risk of VA susceptibility as these agents attenuate the ventricular remodeling process following myocardial infarction and may have sympatholytic effects. Indeed, previous studies have shown that no angiotensin inhibition is an independent predictor of SCD.12 The current study is in line with previous findings, although ACE/ARB did not remain significant in multivariable analysis. Finally, as compared to CMR, PET has some demerits for its use in clinical practice. It requires an on-site cyclotron for tracer produc-tion with short half-life such as [15O]H2O and [11C]HED, having a half-life of 2 and 20 minutes, respectively. Consequently, PET imaging is more costly and [15O]H2O PET or [11C]HED PET can only be performed in dedicated centres. In addition, radiation burden is of concern with PET imaging, although [15O]H2O PET imaging is accompanied by a relatively low dosimetry of ~0.5 mSv per flow measurement.
Conclusion
Impairment in global hyperaemic perfusion was the only independent predictor for inducibility of VA in patients with ischaemic left ventricular dysfunction. Other previ-ously validated approaches to evaluate the arrhythmic substrate including PET assessed sympathetic denervation, innervation-perfusion mismatch as well as LGE-CMR assessed scar size appeared of less significance. Moreover, a combined approach of different imaging variables did not have incremental value in predicting VA inducibility.
191190
9
CHAPTER 10 Non-invasive imaging to identify susceptibility for VA
10
REFERENCESZipes DP, Camm AJ, Borggrefe M et al. ACC/AHA/ESC 2006 Guidelines for Management of Patients With Ventricular Arrhythmias and the Prevention of Sudden Cardiac Death: a report of the American College of Cardiology/American Heart Association Task Force and the European Society of Cardiology Committee for Practice Guide-lines (writing committee to develop Guidelines for Management of Patients With Ventricular Arrhythmias and the Prevention of Sudden Cardiac Death): developed in collaboration with the European Heart Rhythm Association and the Heart Rhythm Society. Circulation 2006;114(10):e385-e484.
Moss AJ, Greenberg H, Case RB et al. Long-term clinical course of patients after termination of ventricular tachyarrhythmia by an implanted defibrillator. Circulation 2004;110(25):3760-3765.
Cheng A, Zhang Y, Blasco-Colmenares E et al. Protein biomarkers identify patients unlikely to benefit from primary prevention implantable cardioverter defibrillators: findings from the Prospective Observational Study of Implantable Cardioverter Defibrillators (PROSE-ICD). Circ Arrhythm Electrophysiol 2014;7(6):1084-1091.
Gorgels AP, Gijsbers C, de Vreede-Swagemakers J, Lousberg A, Wellens HJ. Out-of-hospital cardiac arrest--the relevance of heart failure. The Maastricht Circulatory Arrest Registry. Eur Heart J 2003;24(13):1204-1209.
de Haan S, Knaapen P, Beek AM et al. Risk stratification for ventricular arrhythmias in ischaemic cardiomyopathy: the value of non-invasive imaging. Europace 2010;12(4):468-474.
Bello D, Fieno DS, Kim RJ et al. Infarct morphology identifies patients with substrate for sustained ventricular tachycardia. J Am Coll Cardiol 2005;45(7):1104-1108.
de Haan S, Meijers TA, Knaapen P, Beek AM, van Rossum AC, Allaart CP. Scar size and characteristics assessed by CMR predict ventricular arrhythmias in ischaemic cardiomyopathy: comparison of previously validated models. Heart 2011;97(23):1951-1956.
Iles L, Pfluger H, Lefkovits L et al. Myocardial fibrosis predicts appropriate device therapy in patients with implantable cardioverter-defibrillators for primary prevention of sudden cardiac death. J Am Coll Cardiol 2011;57(7):821-828.
Klem I, Weinsaft JW, Bahnson TD et al. Assessment of myocardial scarring improves risk stratification in patients evaluated for cardiac defibrillator implantation. J Am Coll Cardiol 2012;60(5):408-420.
Bax JJ, Kraft O, Buxton AE et al. 123 I-mIBG scintigraphy to predict inducibility of ventricular arrhythmias on cardiac electrophysiology testing: a prospective multi-center pilot study. Circ Cardiovasc Imaging 2008;1(2):131-140.
1.
2.
3.
4.
5.
6.
7.
8.
9.
10.
Boogers MJ, Borleffs CJ, Henneman MM et al. Cardiac sympathetic denervation assessed with 123-iodine metaiodobenzylguanidine imaging predicts ventricular arrhythmias in implantable cardioverter-defibrillator patients. J Am Coll Cardiol 2010;55(24):2769-2777.
Fallavollita JA, Heavey BM, Luisi AJ, Jr. et al. Regional myocardial sympathetic denervation predicts the risk of sudden cardiac arrest in ischemic cardiomyopathy. J Am Coll Cardiol 2014;63(2):141-149.
Sasano T, Abraham MR, Chang KC et al. Abnormal sympathetic innervation of viable myocardium and the substrate of ventricular tachycardia after myocardial infarction. J Am Coll Cardiol 2008;51(23):2266-2275.
Paganelli F, Barnay P, Imbert-Joscht I et al. Influence of residual myocardial ischaemia on induced ventricular arrhythmias following a first acute myocardial infarction. Eur Heart J 2001;22(20):1931-1937.
Rijnierse MT, de Haan S, Harms HJ et al. Impaired hyperemic myocardial blood flow is associated with inducibility of ventricular arrhythmia in ischemic cardiomyopathy. Circ Cardiovasc Imaging 2014;7(1):20-30.
Rijnierse MT, Allaart CP, de Haan S et al. Sympathetic denervation is associated with microvascular dysfunction in non-infarcted myocardium in patients with cardiomy-opathy. Eur Heart J Cardiovasc Imaging 2015.
Harms HJ, De Haan S, Knaapen P et al. Quantification of [11C]-meta-hydroxyephed-rine uptake in human myocardium. EJNMMI Research 2014;4(52).
Harms HJ, Knaapen P, de Haan S, Halbmeijer R, Lammertsma AA, Lubberink M. Automatic generation of absolute myocardial blood flow images using [15O]H2O and a clinical PET/CT scanner. Eur J Nucl Med Mol Imaging 2011;38(5):930-939.
Harms HJ, de Haan S, Knaapen P, Allaart CP, Lammertsma AA, Lubberink M. Para-metric images of myocardial viability using a single 15O-H2O PET/CT scan. J Nucl Med 2011;52(5):745-749.
Di Diego JM, Antzelevitch C. Ischemic ventricular arrhythmias: experimental models and their clinical relevance. Heart Rhythm 2011;8(12):1963-1968.
Piccini JP, Horton JR, Shaw LK et al. Single-photon emission computed tomography myocardial perfusion defects are associated with an increased risk of all-cause death, cardiovascular death, and sudden cardiac death. Circ Cardiovasc Imaging 2008;1(3):180-188.
Bol A, Melin JA, Vanoverschelde JL et al. Direct comparison of [13N]ammonia and [15O]water estimates of perfusion with quantification of regional myocardial blood flow by microspheres. Circulation 1993;87(2):512-525.
11.
12.
13.
14.
15.
16.
17.
18.
19.
20.
21.
22.
193192
9
CHAPTER 10 Non-invasive imaging to identify susceptibility for VA
10
Iida H, Tamura Y, Kitamura K, Bloomfield PM, Eberl S, Ono Y. Histochemical corre-lates of (15)O-water-perfusable tissue fraction in experimental canine studies of old myocardial infarction. J Nucl Med 2000;41(10):1737-1745.
Allman KC, Wieland DM, Muzik O, Degrado TR, Wolfe ER, Jr., Schwaiger M. Carbon-11 hydroxyephedrine with positron emission tomography for serial assessment of cardiac adrenergic neuronal function after acute myocardial infarction in humans. J Am Coll Cardiol 1993;22(2):368-375.
Matsunari I, Schricke U, Bengel FM et al. Extent of cardiac sympathetic neuronal damage is determined by the area of ischemia in patients with acute coronary syndromes. Circulation 2000;101(22):2579-2585.
Calkins H, Allman K, Bolling S et al. Correlation between scintigraphic evidence of regional sympathetic neuronal dysfunction and ventricular refractoriness in the human heart. Circulation 1993;88(1):172-179.
Kammerling JJ, Green FJ, Watanabe AM et al. Denervation supersensitivity of refractoriness in noninfarcted areas apical to transmural myocardial infarction. Circulation 1987;76(2):383-393.
Matsunari I, Aoki H, Nomura Y et al. Iodine-123 metaiodobenzylguanidine imaging and carbon-11 hydroxyephedrine positron emission tomography compared in patients with left ventricular dysfunction. Circ Cardiovasc Imaging 2010;3(5):595-603.
Schmidt A, Azevedo CF, Cheng A et al. Infarct tissue heterogeneity by magnetic resonance imaging identifies enhanced cardiac arrhythmia susceptibility in patients with left ventricular dysfunction. Circulation 2007;115(15):2006-2014.
Zaman S, Narayan A, Thiagalingam A et al. Long-term arrhythmia-free survival in patients with severe left ventricular dysfunction and no inducible ventricular tachy-cardia after myocardial infarction. Circulation 2014;129(8):848-854.
23.
24.
25.
26.
27.
28.
29.
30.


![FDG-PET in Large Vessel Vasculitis...FDG-PET in Large Vessel Vasculitis 61 5. [18 F]FDG-PET and [18 F]FDG-PET/CT [18 F]FDG-PET is an operator-independent, non- invasive imaging modality](https://img.pdfslide.net/doc/110x75/5f6c13132f0609183b646bce/fdg-pet-in-large-vessel-vasculitis-fdg-pet-in-large-vessel-vasculitis-61-5.jpg)