Embed Size (px)
Citation preview

Non-iterative, regression-based estimationof haplotype associations
Benjamin French, PhDDepartment of Biostatistics and Epidemiology
University of Pennsylvania
National Cancer CenterRepublic of Korea12 September 2012

G U L F O F M E X I C O
P A
C I F
I C O
C E A N
A T
L
A
N
T I
C
O
C
E A
N
L a k e S u p e r i o r
L a k
e
M i c
h i g
a n
L a k e H u r o n
L a k e
E r i e
O n t a r i o
L a k e
GULF OF ALASKAP A C I F I C O C E A N
BERING SEA
A R C T I C O C E A N
R U S S I A
CA
NA
DA
P A C I F I C O C E A N ME X
I CO
C A N A D A
C U B A
T HE B A H A M
A S
MAINE
VERMONT
NEW HAMPSHIRE
NEW YORKMASSACHUSETTS
CONNECTICUT
RHODE ISLAND
PENNSYLVANIA
NEW JERSEY
DELAWARE
MARYLAND
VIRGINIA
WESTVIRGINIA
OHIO
INDIANAILLINOIS
WISCONSIN
KENTUCKY
TENNESSEE NORTH CAROLINA
SOUTH
CAROLINA
GEORGIAALABAMA
FLORIDA
MISSISSIPPI
LOUISIANA
TEXAS
ARKANSAS
MISSOURI
IOWA
MINNESOTA
NORTH DAKOTA
SOUTH DAKOTA
NEBRASKA
KANSAS
OKLAHOMA
NEW MEXICO
COLORADO
WYOMING
MONTANA
IDAHO
UTAH
ARIZONA
NEVADA
CALIFORNIA
OREGON
WASHINGTON
DC
MI C
HI G
AN
HAWAII
ALASKA
The National Atlas of the United States of AmericaU.S. Department of the InteriorU.S. Geological Survey
Where We Arenationalatlas.gov TM
OR
states2.pdf INTERIOR-GEOLOGICAL SURVEY, RESTON, VIRGINIA-2003
PACIFIC OCEA N
AT
LA
NT
I CO
CE
AN
HAWAII
ALASKA
200 mi0
200 km0
100 mi0
100 km0
300 mi0
300 km2000 100
100 200
STATES
Collaborators
Nandita Mitra, PhDDepartment of Biostatistics and EpidemiologyUniversity of Pennsylvania
Thomas P Cappola, MDPenn Cardiovascular InstituteUniversity of Pennsylvania
Thomas Lumley, PhDDepartment of StatisticsUniversity of Auckland
B French ([email protected]) Estimating haplotype associations September 2012 3 / 31

Goals
• To integrate haplotypes into large association studies such thathaplotype imputation is done once as a data-processing step
I Case-control studies (binary outcome) [French et al., 2006]I Prospective studies (censored survival outcome) [French et al., 2012]
• To allow haplotype associations to be estimated in general-purposestatistical software (eg R) by researchers expert in the subject matter
“In world historical terms there is a lot to be saidfor keeping data analysis out of the hands of statisticians”
— Thomas Lumley
B French ([email protected]) Estimating haplotype associations September 2012 4 / 31

Phase ambiguity
• Observed data is composed of a set of unphased genotypes
• Diplotype (pair of haplotypes) may be ambiguous; may not knowwhich allele was transmitted from maternal or paternal chromosome
• Missing data problem; impute the unobserved diplotype
Father Mother
Child
A T
C G
A T
C G
AT/CG or
AG/CT
B French ([email protected]) Estimating haplotype associations September 2012 5 / 31
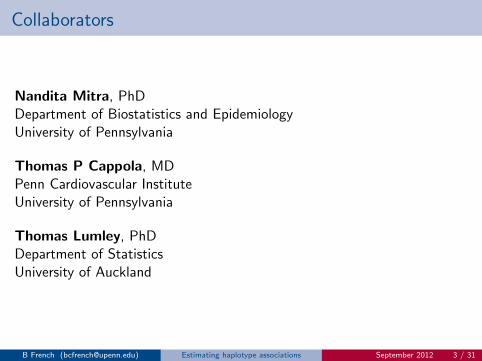
Haplotype imputation
Expectation-maximization (EM) algorithm
• E: calculate expected phase given haplotype frequencies
• M: calculate MLEs for haplotype frequencies given phase
• Software: haplo.stats [Sinnwell and Schaid, 2012]
Bayesian algorithm
• Observed genotype data combined with expected haplotype patterns
• Haplotypes estimated from posterior distribution
• Software: PHASE [Stephens and Donnelly, 2003]
B French ([email protected]) Estimating haplotype associations September 2012 6 / 31

Diplotype uncertainty
Angiotensin II receptor type 1 (AGTR1)
Haplotype Diplotype
Label Haplotype frequency probability
D TCCACGCATCTT 0.139 0.81
F TCTGTGCATCTC 0.290
C TCCACGCATCTC 0.034 0.19
G TCTGTGCATCTT 0.272
Rare TCCGCGCATCTC < 0.001 < 0.01
Rare TCTATGCATCTT < 0.001
B French ([email protected]) Estimating haplotype associations September 2012 7 / 31

Target of inference
If diplotypes were known, could fit a standard regression model includingdiplotypes Di and environmental exposures Zi (possibly with interaction)
• Logistic regression: Yi = {1 = case, 0 = control}
logit P[Yi = 1] = α + DiβD + Ziβ
Z + · · ·
• Cox regression: Yi = min(Ti ,Ci ); event indicator δi = 1[Yi = Ti ]
log λi (t) = log λ0(t) + DiβD + Ziβ
Z + · · ·
in which β = {βD , βZ} represent association parameters of interest
? We integrate the set of imputed haplotypes into these regression models
B French ([email protected]) Estimating haplotype associations September 2012 8 / 31

Estimating associations
Non-iterative weighted estimation [French et al., 2006]
1. Impute haplotypes and estimate population haplotype frequencies
2. Create multi-record data for each individual
I Design matrix: set of diplotypes consistent with observed genotype,possibly including environmental exposures
I Weights equal to conditional probability of each diplotype
Weight A B C D E F G H I Rare
0.81 0 0 0 1 0 1 0 0 0 0
0.19 0 0 1 0 0 0 1 0 0 0
0.01 0 0 0 0 0 0 0 0 0 2
3. Estimate associations using a weighted regression model
I Logistic regression for binary outcomesI Cox regression for censored survival outcomesI Robust or ‘sandwich’ standard error estimatorI Account for uncertainty in phase
B French ([email protected]) Estimating haplotype associations September 2012 9 / 31

Estimating associations
Non-iterative weighted estimation
• Estimates are obtained from estimating functions
I Logistic regression for binary outcomes
U(β) =n∑
i=1
∑d∈d(Gi )
πid(pid , β)Xid [Yid − expitXidβ]
I Cox regression for censored survival outcomes
U(β) =n∑
i=1
∑d∈d(Gi )
∂lid(β)
∂β
lid(β) = δidπid(pid , β)
Xidβ − log∑
i ′∈R(ti )
expXi ′dβ
• Inference based on univariable or multivariable Wald tests
• Estimator is valid and efficient under the null hypothesis
B French ([email protected]) Estimating haplotype associations September 2012 10 / 31

Estimating associations
Weighted haplotype combination [Rebbeck et al., 2009]
1. Impute haplotypes and estimate population haplotype frequencies
2. Create single-record data for each individual
I Design matrix: weighted combination of diplotypes consistentwith observed genotype, with weights equal to conditional probabilityof each diplotype, possibly including environmental exposures
A B C D E F G H I Rare
0 0 0.19 0.81 0 0.81 0.19 0 0 0.01
3. Estimate associations using an unweighted regression model
I Logistic regression for binary outcomesI Cox regression for censored survival outcomesI Account for uncertainty in phase
B French ([email protected]) Estimating haplotype associations September 2012 11 / 31

Estimating associations
Weighted haplotype combination
• Estimates are obtained from estimating functions
I Logistic regression for binary outcomes
U(β) =n∑
i=1
Xi [Yi − expitXiβ]
I Cox regression for censored survival outcomes
U(β) =n∑
i=1
∂li (β)
∂β
li (β) = δi
Xiβ − log∑
i ′∈R(ti )
expXi ′β
• Inference based on univariable or multivariable Wald tests
• Estimator is exactly valid under the null hypothesis
B French ([email protected]) Estimating haplotype associations September 2012 12 / 31

Simulation study
In which situations do non-iterative methods provide reliable results?
Angiotensin II receptor type 1 (AGTR1)
Label Haplotype Frequency
A ATTATGCATCTC 0.029
B ATTATGTGATCC 0.051
C TCCACGCATCTC 0.027
D TCCACGCATCTT 0.090
E TCTGTGCAACTT 0.029
F* TCTGTGCATCTC 0.223
G TCTGTGCATCTT 0.188
H TTTACACATCTC 0.038
I TTTACACATCTT 0.032
* Referent
n = 500, 25% censoring (independent)
B French ([email protected]) Estimating haplotype associations September 2012 13 / 31
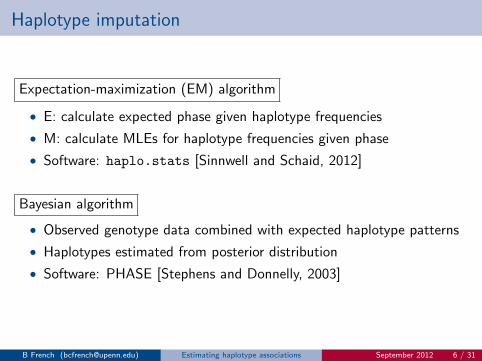
Simulation results: Moderate effects
HaplotypeHazard ratio
App
roxi
mat
e bi
as
−2
−1
01
2
A1/2.0 B1/1.75 C1.25 D1.5 E1/1.25 G1/1.5 H1.75 I2.0
Weighted estimationWeighted combinationKnown phase
B French ([email protected]) Estimating haplotype associations September 2012 14 / 31

Simulation results: Moderate effects
% coverage of 95% confidence intervals
Hazard Weighted Weighted Known
Haplotype ratio estimation combination phase
A 1/2.0 94 95 95
B 1/1.75 94 95 95
C 1.25 80 95 95
D 1.5 93 94 95
E 1/1.25 93 95 94
G 1/1.5 89 94 95
H 1.75 86 96 95
I 2.0 92 95 96
B French ([email protected]) Estimating haplotype associations September 2012 15 / 31

Simulation results: Moderate effects
Rejection rate (%) of two-sided hypothesis tests
Hazard Weighted Weighted Known
Haplotype ratio estimation combination phase
A 1/2.0 90 91 92
B 1/1.75 91 93 94
C 1.25 62 19 24
D 1.5 92 90 93
E 1/1.25 15 15 18
G 1/1.5 95 96 98
H 1.75 99 82 96
I 2.0 96 93 98
B French ([email protected]) Estimating haplotype associations September 2012 16 / 31

Simulation results: Strong SNP effects
HaplotypeHazard ratio
App
roxi
mat
e bi
as
−2
−1
01
2
A1.0 B1.0 C1.0 D4.0 E4.0 G4.0 H1.0 I4.0
Weighted estimationWeighted combinationKnown phase
B French ([email protected]) Estimating haplotype associations September 2012 17 / 31

Simulation results: Strong SNP effects
% coverage of 95% confidence intervals
Hazard Weighted Weighted Known
Haplotype ratio estimation combination phase
A 1.0 93 94 94
B 1.0 94 94 94
C 1.0 92 93 95
D 4.0 94 95 95
E 4.0 92 94 95
G 4.0 94 94 95
H 1.0 94 94 95
I 4.0 92 93 92
B French ([email protected]) Estimating haplotype associations September 2012 18 / 31

Simulation results: Strong SNP effects
Rejection rate (%) of two-sided hypothesis tests
Hazard Weighted Weighted Known
Haplotype ratio estimation combination phase
A 1.0 7 6 6
B 1.0 6 6 6
C 1.0 8 7 5
D 4.0 100 100 100
E 4.0 100 100 100
G 4.0 100 100 100
H 1.0 6 6 5
I 4.0 100 100 100
B French ([email protected]) Estimating haplotype associations September 2012 19 / 31

Simulation results: Strong non-SNP effects
HaplotypeHazard ratio
App
roxi
mat
e bi
as
−2
−1
01
2
A1.0 B1.0 C4.0 D1.0 E4.0 G4.0 H4.0 I1.0
Weighted estimationWeighted combinationKnown phase
B French ([email protected]) Estimating haplotype associations September 2012 20 / 31

Simulation results: Strong non-SNP effects
% coverage of 95% confidence intervals
Hazard Weighted Weighted Known
Haplotype ratio estimation combination phase
A 1.0 93 95 95
B 1.0 90 95 95
C 4.0 0 96 94
D 1.0 94 95 94
E 4.0 65 96 95
G 4.0 0 91 95
H 4.0 0 88 94
I 1.0 81 89 95
B French ([email protected]) Estimating haplotype associations September 2012 21 / 31
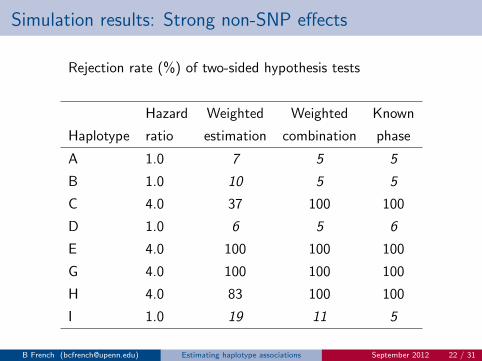
Simulation results: Strong non-SNP effects
Rejection rate (%) of two-sided hypothesis tests
Hazard Weighted Weighted Known
Haplotype ratio estimation combination phase
A 1.0 7 5 5
B 1.0 10 5 5
C 4.0 37 100 100
D 1.0 6 5 6
E 4.0 100 100 100
G 4.0 100 100 100
H 4.0 83 100 100
I 1.0 19 11 5
B French ([email protected]) Estimating haplotype associations September 2012 22 / 31

Application
HSPB7-CLCNKA haplotypes and adverse events in chronic heart failure
• Regulate renal potassium channels to control blood pressure
• SNP associated with heart failure in a large case-control study[Cappola et al., 2011]
• Genotypes available for 1150 genetically inferred Caucasianswith heart failure enrolled in a prospective study
• 70% male; median age at study entry, 58 years
• 14 pre-selected SNPsInferred 10 common haplotypes (frequency > 0.02)
• 65% had an unambiguous diplotype90% had a highest posterior probability > 0.765
B French ([email protected]) Estimating haplotype associations September 2012 23 / 31

Application
HSPB7-CLCNKA haplotypes and adverse events in chronic heart failure
• Outcome: time to all-cause mortality or cardiac transplantation
I Median follow-up, 3 years; maximum, 5 years
I 22% experienced an adverse event
• Cox regression framework
I Stratified by 4-level classification for disease severity
I Adjusted for gender, age, heart failure etiology, clinical site
I Time-varying covariate for age (exhibited non-proportional hazards)
B French ([email protected]) Estimating haplotype associations September 2012 24 / 31

Application results: Weighted estimation
Label Haplotype Frequency HR (95% CI) P
Q AGAGCGAGACGAGG 0.036 1.19 (0.80, 1.77) 0.39
R AGAGCGAGGGAAGG 0.160 1.04 (0.80, 1.35) 0.79
S AGAGCGGAGCAAGA 0.036 1.20 (0.80, 1.77) 0.38
T AGCGAGAGGCAAGA 0.066 0.55 (0.34, 0.88) 0.01
U GACGCGGAGCGCGG 0.063 0.80 (0.53, 1.20) 0.28
V GGAACAAGGGAAGG 0.037 0.49 (0.26, 0.92) 0.03
W GGAACAGAGCAAGA 0.299 Referent
X GGAACAGAGCAAGG 0.048 1.36 (0.95, 1.95) 0.09
Y GGAGCAAGGCAAGG 0.050 1.15 (0.78, 1.69) 0.49
Z GGCGCGGAGCAAGG 0.031 1.09 (0.62, 1.92) 0.76
Overall 0.02
B French ([email protected]) Estimating haplotype associations September 2012 25 / 31
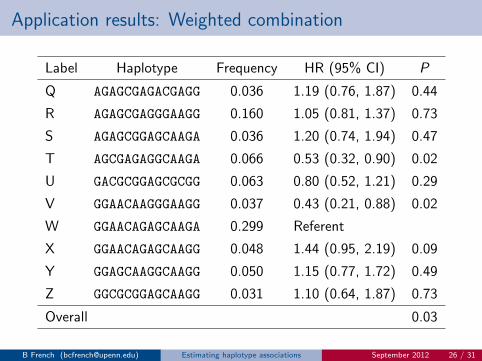
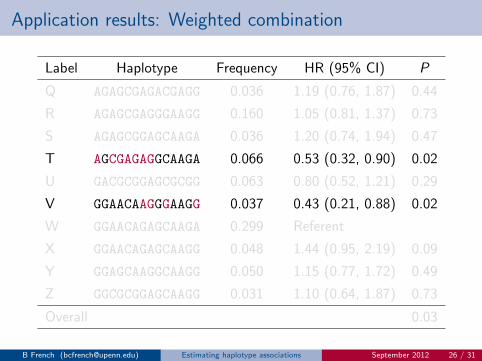
Application results: Weighted combination
Label Haplotype Frequency HR (95% CI) P
Q AGAGCGAGACGAGG 0.036 1.19 (0.76, 1.87) 0.44
R AGAGCGAGGGAAGG 0.160 1.05 (0.81, 1.37) 0.73
S AGAGCGGAGCAAGA 0.036 1.20 (0.74, 1.94) 0.47
T AGCGAGAGGCAAGA 0.066 0.53 (0.32, 0.90) 0.02
U GACGCGGAGCGCGG 0.063 0.80 (0.52, 1.21) 0.29
V GGAACAAGGGAAGG 0.037 0.43 (0.21, 0.88) 0.02
W GGAACAGAGCAAGA 0.299 Referent
X GGAACAGAGCAAGG 0.048 1.44 (0.95, 2.19) 0.09
Y GGAGCAAGGCAAGG 0.050 1.15 (0.77, 1.72) 0.49
Z GGCGCGGAGCAAGG 0.031 1.10 (0.64, 1.87) 0.73
Overall 0.03
B French ([email protected]) Estimating haplotype associations September 2012 26 / 31

R packages: Non-iterative weighted estimation
haplo.ccs [French and Lumley, 2011]
• Weighted logistic regression for binary outcomes
• Depends on haplo.stats package to impute haplotypes
• Calls glm(..., family=quasibinomial(link=logit))
• Includes GEE-type ‘sandwich’ standard error estimator
haplo.cph (in process)
• Weighted Cox regression for censored survival outcomes
• Will depend on haplo.stats package to impute haplotypes
• Will call cph(..., robust=TRUE) from Design package
• Allow stratification and time-varying exposures
B French ([email protected]) Estimating haplotype associations September 2012 27 / 31

Conclusions
• Non-iterative estimation methods
I Incorporate all diplotypes consistent with the observed genotype,either weighted (weighted estimation) or averaged (weightedcombination) by the conditional probability of each diplotype
I Provide valid tests for genetic associations and reliable estimatesof modest genetic effects of common haplotypes
• Convenient regression framework
I Adjustment for or interaction with environmental exposuresI Stratification and time-varying exposures in Cox regression
• Straightforward to implement in R
I haplo.ccs for binary outcomesI haplo.cph for censored survival outcomes
• See [French et al., 2006; 2012] for implementation in Stata
B French ([email protected]) Estimating haplotype associations September 2012 28 / 31

Target
Haplotype frequency
“Rel
ativ
e ris
k”
High
Common Rare
May not exist
Mostly known
Our focus
Probably can’t be found
Low
B French ([email protected]) Estimating haplotype associations September 2012 29 / 31

Limitations
Our methods and/or software may not be applicable to
• Related individuals
• Rare haplotypes
• Small studies
• Longitudinal outcomes
B French ([email protected]) Estimating haplotype associations September 2012 30 / 31

References
dbe.med.upenn.edu/biostat-research/bcfrench
1. Cappola TP, Matkovich SJ, et al. 2011. Loss-of-function DNA sequence variantin the CLCNKA chloride channel implicates the cardio-renal axis in interindividualheart failure risk variation. Proc Natl Acad Sci U S A 108:2456–61.
2. French B, Lumley T. 2011. haplo.ccs: Estimate haplotype relative risksin case-control data. R package 1.3.1.
3. French B, Lumley T, et al. 2006. Simple estimates of haplotype relative risksin case-control data. Genet Epidemiol 30:485–94.
4. French B, Lumley T, et al. 2012. Non-iterative, regression-based estimationof haplotype associations with censored survival outcomes. Stat App Genet MolBiol 11:4.
5. Rebbeck TR, Mitra N, et al. 2009. Modification of ovarian cancer riskby BRAC1/2-interacting genes in a multi center cohort of BRAC1/2 mutationcarriers. Cancer Res 71:5792–805.
6. Sinnwell JP, Schaid DJ. 2012. haplo.stats: Statistical analysis of haplotypes withtraits and covariates when linkage phase is ambiguous. R package version 1.5.5.
7. Stephens M, Donnelly P. 2003. A comparison of Bayesian methods for haplotypereconstruction from population genotype data. Am J Hum Genet 73:1162–69.
B French ([email protected]) Estimating haplotype associations September 2012 31 / 31