Embed Size (px)
Citation preview
SEEDS SURREY Surrey Energy Economics ENERGY Discussion paper Series ECONOMICS CENTRE
Non-linear technological progress and the substitutability of energy for
capital: an application using the translog cost function
David C. Broadstock
June 2008
SEEDS 120 Department of Economics ISSN 1749-8384 University of Surrey
The Surrey Energy Economics Centre (SEEC) consists of members of the Department of Economics who work on energy economics, environmental economics and regulation. The Department of Economics has a long-standing tradition of energy economics research from its early origins under the leadership of Professor Colin Robinson. This was consolidated in 1983 when the University established SEEC, with Colin as the Director; to study the economics of energy and energy markets.
SEEC undertakes original energy economics research and since being established it has conducted research across the whole spectrum of energy economics, including the international oil market, North Sea oil & gas, UK & international coal, gas privatisation & regulation, electricity privatisation & regulation, measurement of efficiency in energy industries, energy & development, energy demand modelling & forecasting, and energy & the environment. SEEC also encompasses the theoretical research on regulation previously housed in the department's Regulation & Competition Research Group (RCPG) that existed from 1998 to 2004.
SEEC research output includes SEEDS - Surrey Energy Economic Discussion paper Series (details at www.seec.surrey.ac.uk/Research/SEEDS.htm) as well as a range of other academic papers, books and monographs. SEEC also runs workshops and conferences that bring together academics and practitioners to explore and discuss the important energy issues of the day.
SEEC also attracts a large proportion of the department’s PhD students and oversees the MSc in Energy Economics & Policy. Many students have successfully completed their MSc and/or PhD in energy economics and gone on to very interesting and rewarding careers, both in academia and the energy industry.
Enquiries: Director of SEEC and Editor of SEEDS: Lester C Hunt SEEC, Department of Economics, University of Surrey, Guildford GU2 7XH, UK. Tel: +44 (0)1483 686956 Fax: +44 (0)1483 689548 Email: [email protected] www.seec.surrey.ac.uk
i
___________________________________________________________
Surrey Energy Economics Centre (SEEC)
Department of Economics University of Surrey
SEEDS 120 ISSN 1749-8384
___________________________________________________________
NON-LINEAR TECHNOLOGICAL PROGRESS AND THE SUBSTITUTABILITY OF ENERGY FOR CAPITAL:
AN APPLICATION USING THE TRANSLOG COST FUNCTION
David C. Broadstock
June 2008
___________________________________________________________
This paper may not be quoted or reproduced without permission.
ii
ABSTRACT
This paper analyses the production process of four industries over four separate time periods using datasets taken form Berndt and Wood (1975, 1979), Hunt (1984a, 1986), Norsworthy and Harper (1981) and Jorgensen and Stiroh (2000). In their initial paper Berndt and Wood failed to explore the alternative options available to them to represent technological progress, a deficiency noted by Hunt (1986) who tested for alternative representations of technology (inter alia) using the Berndt and Wood data. This paper extends this line of reasoning/research by allowing technological progress to take more flexible non-linear forms using both deterministic and stochastic trend models. The results reveal that ‘non-linear trend’ models are generally preferred to ‘linear trend’ or ‘no trend’ models hence raising a question over the validity of assumptions used in much previous empirical research. Further the results reveal that the different assumptions lead to different results for the energy-capital elasticity of substitution. JEL Classification: O33; O47; Q49. Key Words: Translog, energy-capital substitution, productivity
1
NON-LINEAR TECHNOLOGICAL PROGRESS AND THE SUBSTITUTABILITY OF ENERGY FOR CAPITAL: AN
APPLICATION USING THE TRANSLOG COST FUNCTION
David C. Broadstock1 Surrey Energy Economics Centre.
1. Introduction
Based upon an inspection of around 100 empirical papers on production functions featuring
energy as an included factor, approximately 35-40% of studies did not attempt to feature the
effects of technological progress (see Broadstock et al, 2007). As Koetse et al (2007)
indicated in a meta-study of elasticities of substitution between energy and capital (σke), the
effects of capturing technological progress can significantly change the value of the measured
elasticities. There is thus a need for production analysts to reconsider the empirical
measurement of technological progress effects.
Berndt and Wood (1975, 1979) generated the seminal results within the energy literature,
using a Translog model of production to place an empirical value on the elasticity of
substitution between energy and capital [for US Manufacturing]. Hunt (1986) extended these
results2 to test for the role of technological progress in production with the inclusion of non-
neutral (or factor augmenting) technological progress, achieved by the inclusion of a
deterministic linear trend. For the Berndt and Wood data (US Manufacturing) this was
rejected, whilst conversely for the UK [Industrial sector], linear technological progress was
statistically preferred. This study extends the efforts of these previous studies by testing the
hypothesis that Technological progress is not a linear function of time in the context of a
1 I am grateful for comments and questions received at the 9th annual conference of the International Association of Energy Economists (IAEE), Florence June 2007. Also I would like to thank Lester C. Hunt (SEEC) for comments received on an earlier draft of this paper. I alone am responsible for all omissions and errors. 2 Although this was not the only, or first piece empirically reviewing the results of Berndt and Wood.
2
Translog cost function. The focus of the results is directed towards their impact upon the
derived empirical elasticity of substitution between energy and capital (σKE) when applying
different representations of technology. This is pertinent due to the prominent role its
understanding plays in the development of sustainability conscious policy measures, and the
importance such measures have within wider analytical models such as general equilibrium
systems.
The order of the paper is as follows; the next section outlines the estimation methodology,
outlining the approaches to defining the linear and non-linear technological progress terms
followed by a brief description on how the elasticities of substitution are derived from these
models. Section 3 provides a short note on the data used in this study, while section 4 presents
the results of the analysis, focussing upon the empirical shape of the underlying effects of
technological progress and subsequent effects on the elasticity of substitution. Concluding
remarks are then offered in section 5.
2. Methodology
This section discusses the key methodological considerations, as well as the empirical
methods used. The most commonly used functional form for empirically estimating
production functions is the Translog specification originally due to Christensen et al (1973),
which offers increased flexibility over other forms. Alternative flexible functional forms do
exist, such as the generalised Leontief due to Diewert (1971), though these are not considered
in the present application due to their relative lack of empirical implementation. The present
application’s research hypothesis is therefore tested in the context of the Translog model
featuring four factor inputs, namely Kapital, Labour, Energy and Materials. i.e. y=f(K,L,E,M)
where y=output. The exposition of the Translog function (including hicks neutral and linear
factor augmenting trends) is well defined in the literature and so is not redefined in this paper.
3
Proxies for technological progress, such as Research and Development investment in energy
efficient technologies, are not necessarily representative of the impact of technological
progress. They do not capture the desire of technology developers to maximise the potential
wealth of their energy saving concepts, and hence the potential lag between design and
implementation. i.e. Developers may wish to delay the release of their product(s) to
consumers until the existing technology has clearly peaked past the maturity stage of its
product life cycle, when revenue streams show clear evidence of decline.
Linear trend approaches to proxy for technological progress are a useful and accessible start
point for empirical modelling, however such trends are a pre-defined assumption. Moreover
such an assumption is simply one of an infinite class of assumptions that could be made
regarding the shape of the underlying technological progress trend that should be tested for,
ideally from a very flexible form. This remainder of this section outlines two empirical
approaches which offer more realistic representation for technological progress that can take
non-linear forms.
(i) The (augmented) Almon Lag Model.
The first method applied to allow for a non-linear trend is derived from a dynamic
econometric method, albeit applied within a static setting for the present example. An Almon
lag specification is expressed in which the lag length is equal to the number of time periods in
the dataset, however this lag is only applied to the model constant(s), not the slope
coefficients, hence it is a heavily restricted form of the model. Essentially this produces a time
varying constant within the model, which is formed as the sum of the intercept plus the trend.
This therefore approximates the results of the Seemingly Unrelated Structural Time Series
Model (detailed below) in which the constant is allowed to follow a stochastic process and is
thus time varying. Hence the Almon approach is a deterministic approximation to a stochastic
4
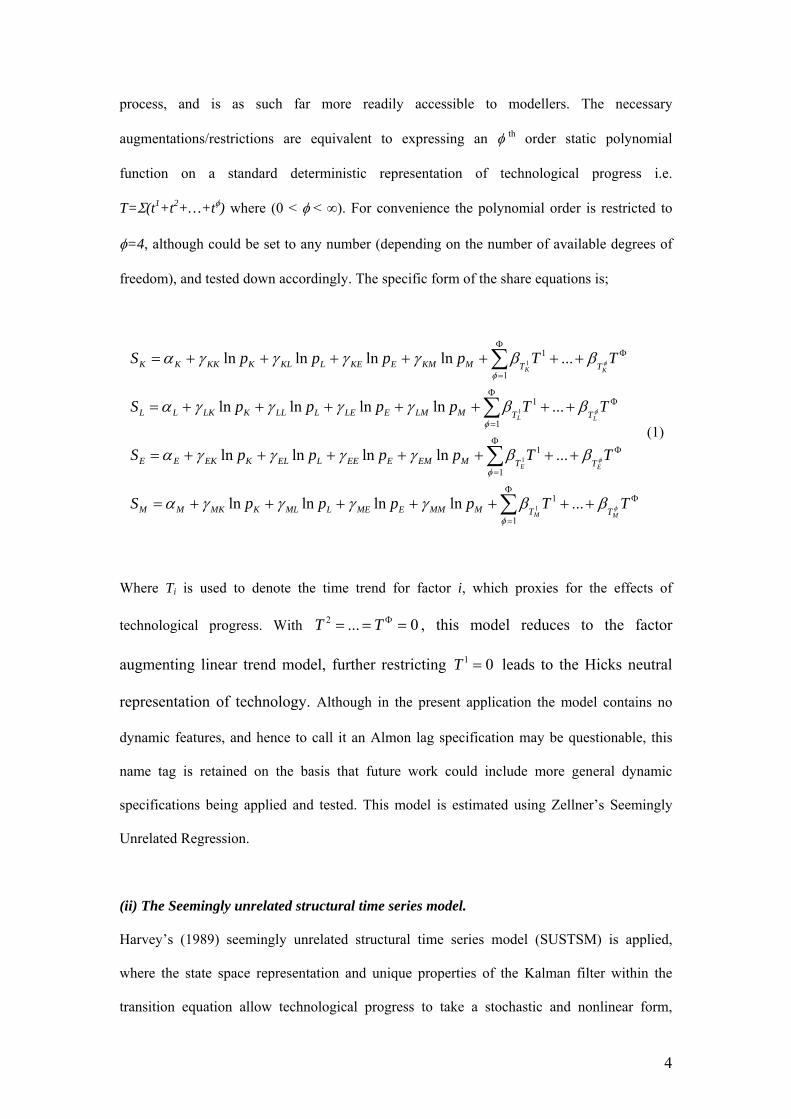
process, and is as such far more readily accessible to modellers. The necessary
augmentations/restrictions are equivalent to expressing an φ th order static polynomial
function on a standard deterministic representation of technological progress i.e.
T=Σ(t1+t2+…+tφ) where (0 < φ < ∞). For convenience the polynomial order is restricted to
φ=4, although could be set to any number (depending on the number of available degrees of
freedom), and tested down accordingly. The specific form of the share equations is;
∑
∑
∑
∑
Φ
=
Φ
Φ
=
Φ
Φ
=
Φ
Φ
=
Φ
+++++++=
+++++++=
+++++++=
+++++++=
1
1
1
1
1
1
1
1
...lnlnlnln
...lnlnlnln
...lnlnlnln
...lnlnlnln
1
1
1
1
φ
φ
φ
φ
φ
φ
φ
φ
ββγγγγα
ββγγγγα
ββγγγγα
ββγγγγα
TTppppS
TTppppS
TTppppS
TTppppS
MM
EE
LL
KK
TTMMMEMELMLKMKMM
TTMEMEEELELKEKEE
TTMLMELELLLKLKLL
TTMKMEKELKLKKKKK
(1)
Where Ti is used to denote the time trend for factor i, which proxies for the effects of
technological progress. With 0...2 === ΦTT , this model reduces to the factor
augmenting linear trend model, further restricting 01 =T leads to the Hicks neutral
representation of technology. Although in the present application the model contains no
dynamic features, and hence to call it an Almon lag specification may be questionable, this
name tag is retained on the basis that future work could include more general dynamic
specifications being applied and tested. This model is estimated using Zellner’s Seemingly
Unrelated Regression.
(ii) The Seemingly unrelated structural time series model.
Harvey’s (1989) seemingly unrelated structural time series model (SUSTSM) is applied,
where the state space representation and unique properties of the Kalman filter within the
transition equation allow technological progress to take a stochastic and nonlinear form,
5
previously only known to have been applied for this purpose by Harvey and Marshall (1991).
One advantage of this method is that it is a more parsimonious approach to estimation
compared to the deterministic non-linear approach discussed previously. In situations where
the underlying technological progress is highly non-linear, the Almon lag approach could
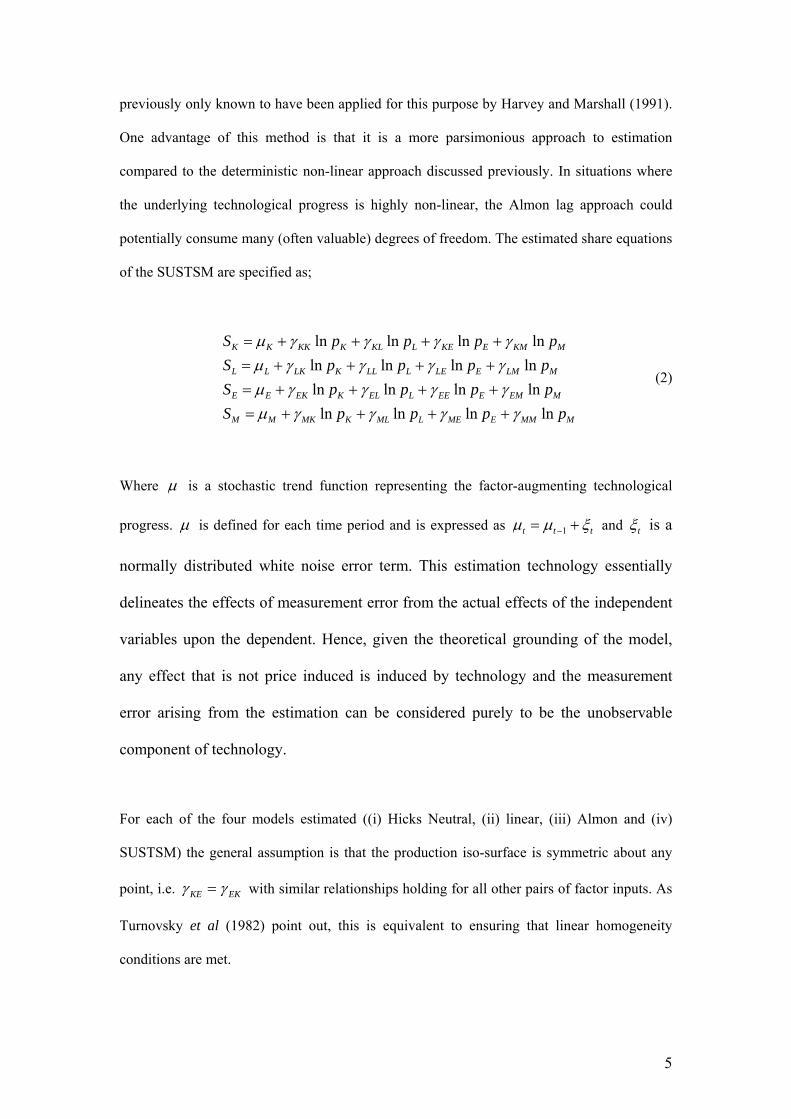
potentially consume many (often valuable) degrees of freedom. The estimated share equations
of the SUSTSM are specified as;
MMMEMELMLKMKMM
MEMEEELELKEKEE
MLMELELLLKLKLL
MKMEKELKLKKKKK
ppppSppppSppppSppppS
lnlnlnlnlnlnlnlnlnlnlnlnlnlnlnln
γγγγμγγγγμγγγγμγγγγμ
++++=++++=++++=++++=
(2)
Where μ is a stochastic trend function representing the factor-augmenting technological
progress. μ is defined for each time period and is expressed as ttt ξμμ += −1 and tξ is a
normally distributed white noise error term. This estimation technology essentially
delineates the effects of measurement error from the actual effects of the independent
variables upon the dependent. Hence, given the theoretical grounding of the model,
any effect that is not price induced is induced by technology and the measurement
error arising from the estimation can be considered purely to be the unobservable
component of technology.
For each of the four models estimated ((i) Hicks Neutral, (ii) linear, (iii) Almon and (iv)
SUSTSM) the general assumption is that the production iso-surface is symmetric about any
point, i.e. EKKE γγ = with similar relationships holding for all other pairs of factor inputs. As
Turnovsky et al (1982) point out, this is equivalent to ensuring that linear homogeneity
conditions are met.
6
The estimation results of the four alternative models are then used to derive the empirical
elasticity of substitution between capital and energy. Although these elasticities are not
directly comparable from one dataset to the next, due to the inconsistency in sector, time
period and country, this will at least provide some bearing of the effect of differing
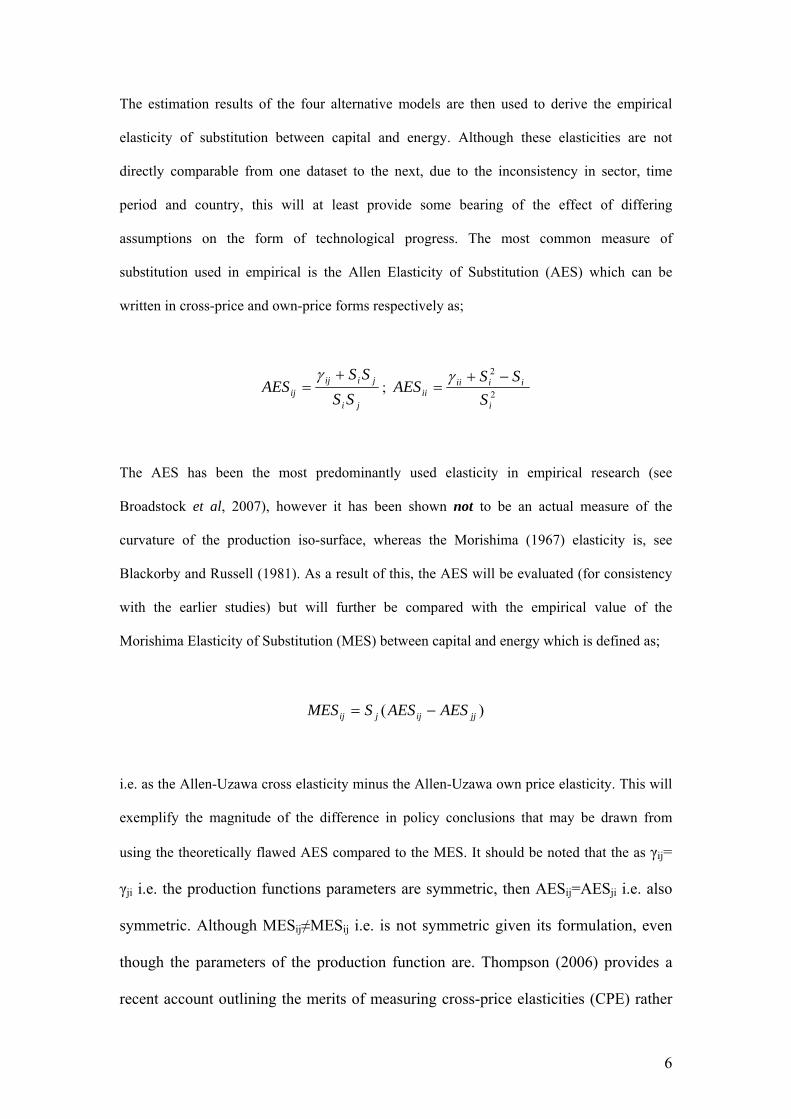
assumptions on the form of technological progress. The most common measure of
substitution used in empirical is the Allen Elasticity of Substitution (AES) which can be
written in cross-price and own-price forms respectively as;
ji
jiijij SS
SSAES
+=
γ; 2
2
i
iiiiii S
SSAES
−+=
γ
The AES has been the most predominantly used elasticity in empirical research (see
Broadstock et al, 2007), however it has been shown not to be an actual measure of the
curvature of the production iso-surface, whereas the Morishima (1967) elasticity is, see
Blackorby and Russell (1981). As a result of this, the AES will be evaluated (for consistency
with the earlier studies) but will further be compared with the empirical value of the
Morishima Elasticity of Substitution (MES) between capital and energy which is defined as;
)( jjijjij AESAESSMES −=
i.e. as the Allen-Uzawa cross elasticity minus the Allen-Uzawa own price elasticity. This will
exemplify the magnitude of the difference in policy conclusions that may be drawn from
using the theoretically flawed AES compared to the MES. It should be noted that the as γij=
γji i.e. the production functions parameters are symmetric, then AESij=AESji i.e. also
symmetric. Although MESij≠MESij i.e. is not symmetric given its formulation, even
though the parameters of the production function are. Thompson (2006) provides a
recent account outlining the merits of measuring cross-price elasticities (CPE) rather
7
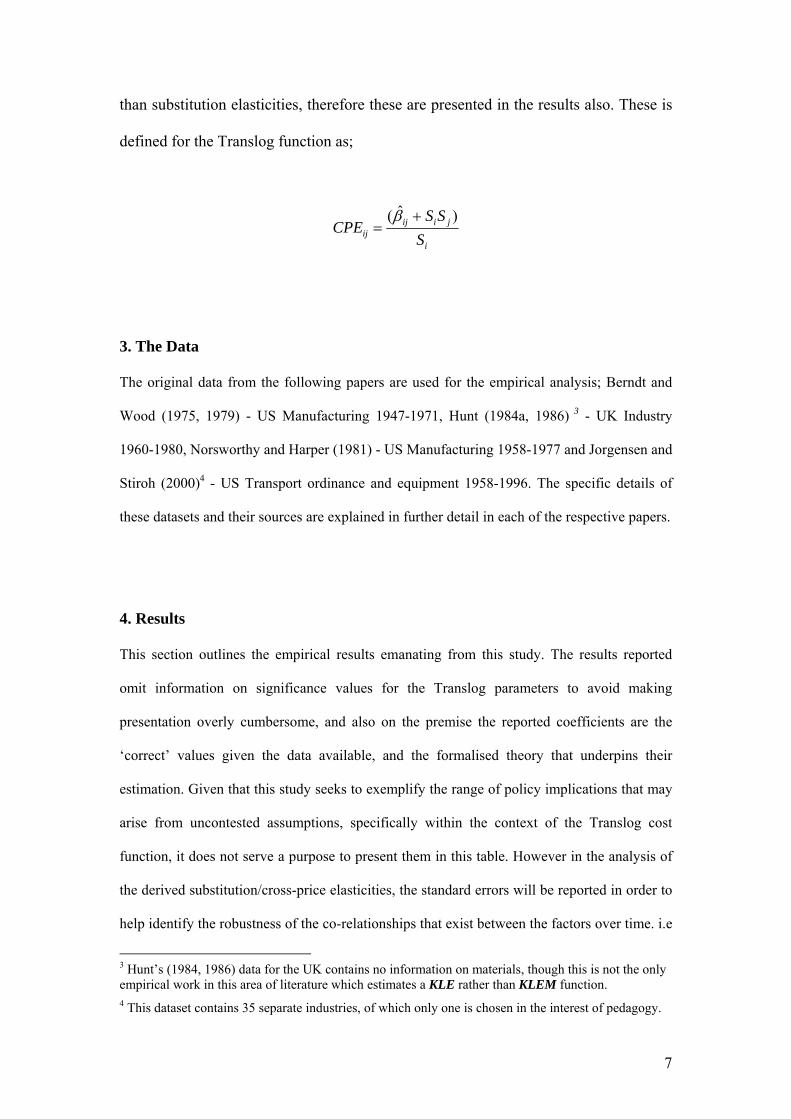
than substitution elasticities, therefore these are presented in the results also. These is
defined for the Translog function as;
i
jiijij S
SSCPE
)ˆ( +=
β
3. The Data
The original data from the following papers are used for the empirical analysis; Berndt and
Wood (1975, 1979) - US Manufacturing 1947-1971, Hunt (1984a, 1986) 3 - UK Industry
1960-1980, Norsworthy and Harper (1981) - US Manufacturing 1958-1977 and Jorgensen and
Stiroh (2000)4 - US Transport ordinance and equipment 1958-1996. The specific details of
these datasets and their sources are explained in further detail in each of the respective papers.
4. Results
This section outlines the empirical results emanating from this study. The results reported
omit information on significance values for the Translog parameters to avoid making
presentation overly cumbersome, and also on the premise the reported coefficients are the
‘correct’ values given the data available, and the formalised theory that underpins their
estimation. Given that this study seeks to exemplify the range of policy implications that may
arise from uncontested assumptions, specifically within the context of the Translog cost
function, it does not serve a purpose to present them in this table. However in the analysis of
the derived substitution/cross-price elasticities, the standard errors will be reported in order to
help identify the robustness of the co-relationships that exist between the factors over time. i.e
3 Hunt’s (1984, 1986) data for the UK contains no information on materials, though this is not the only empirical work in this area of literature which estimates a KLE rather than KLEM function. 4 This dataset contains 35 separate industries, of which only one is chosen in the interest of pedagogy.
8
whether two factors have consistently been complements (or substitutes) and whether this has
been of a consistent magnitude over the period of analysis. Given the ultimate desire to shed
light on the relationship between energy and capital, this section also omits discussion of the
results relating to labour and materials.
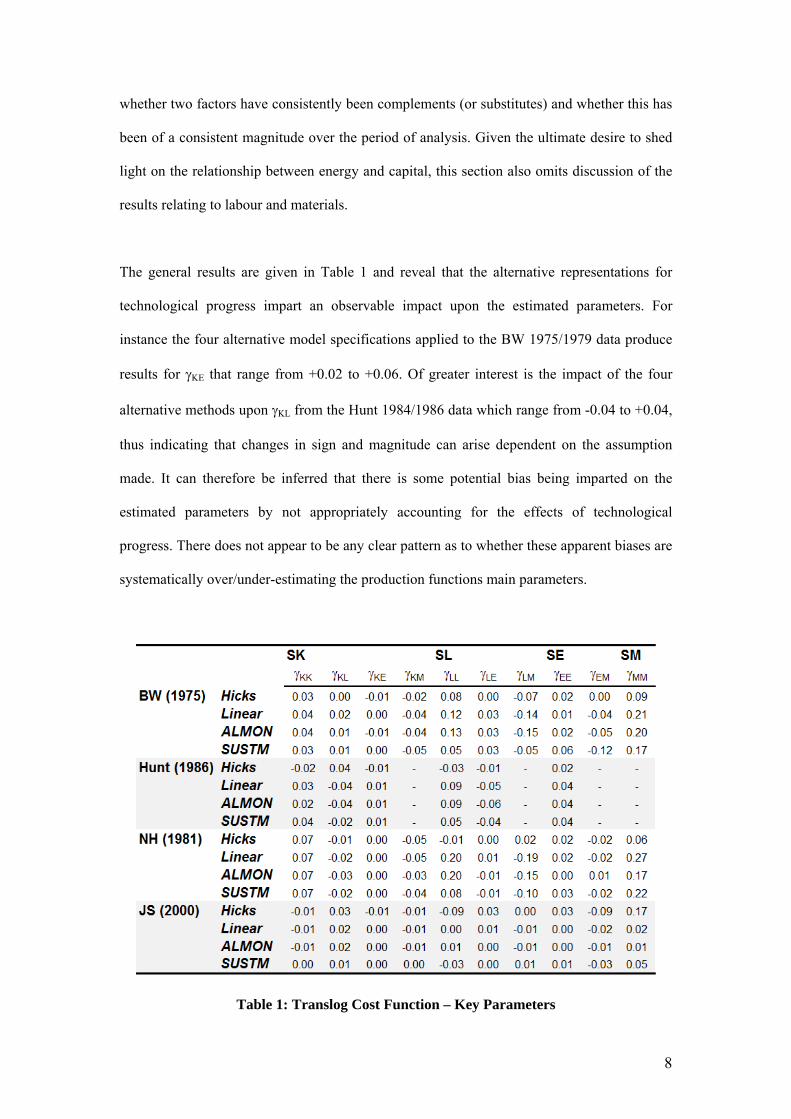
The general results are given in Table 1 and reveal that the alternative representations for
technological progress impart an observable impact upon the estimated parameters. For
instance the four alternative model specifications applied to the BW 1975/1979 data produce
results for γKE that range from +0.02 to +0.06. Of greater interest is the impact of the four
alternative methods upon γKL from the Hunt 1984/1986 data which range from -0.04 to +0.04,
thus indicating that changes in sign and magnitude can arise dependent on the assumption
made. It can therefore be inferred that there is some potential bias being imparted on the
estimated parameters by not appropriately accounting for the effects of technological
progress. There does not appear to be any clear pattern as to whether these apparent biases are
systematically over/under-estimating the production functions main parameters.
Table 1: Translog Cost Function – Key Parameters

9
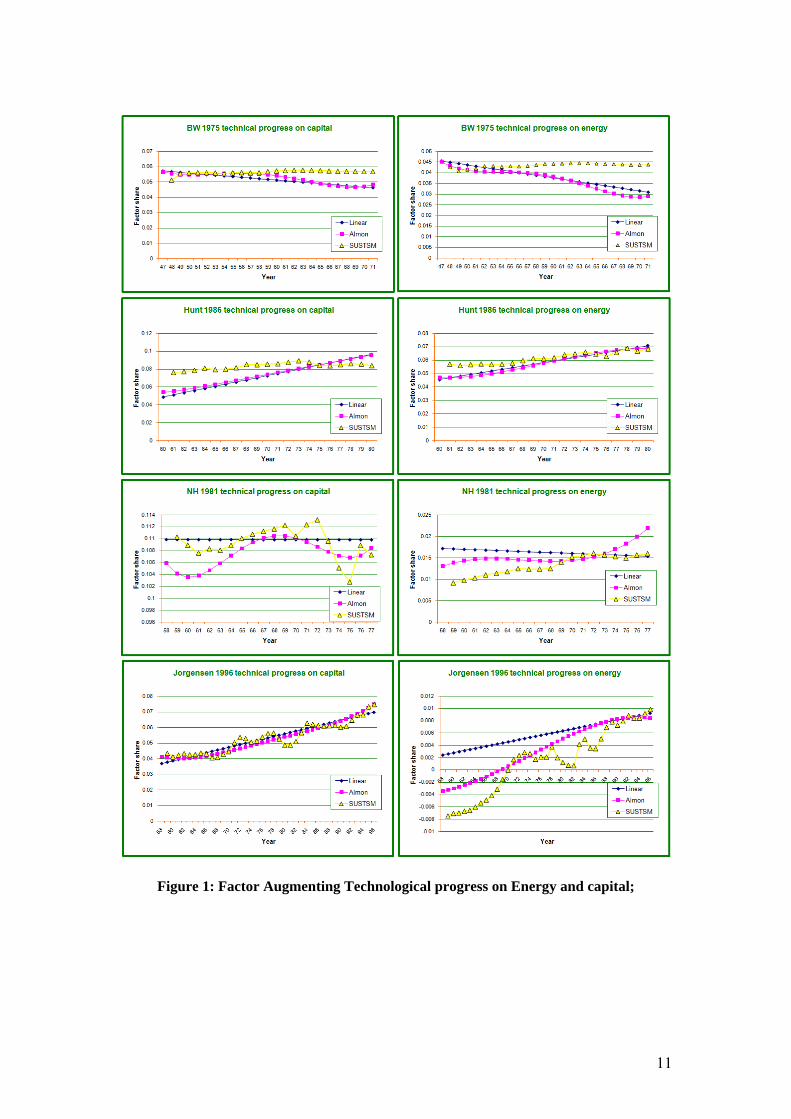
The technological progress parameters are omitted from Table 1 as it is arguably more useful
to inspect them visually, Figure 1 therefore graphs the estimated technological progress trends
derived from the capital (K) and energy (E) share equations. A downward (upward) sloping
trend reflects a factor-saving (using) effect of technological progress i.e. the effects of
technological progress over time have led to a reduction (increase) in the demand for that
factor. The details of these trends are given further consideration in the following discussions
of the particular results relating to each dataset;
Berndt and Wood (1975, 1979);
The results generated using the Berndt and Wood data would tend to imply that technological
progress is largely speaking a linear function of time. The results depicted in Figure 1 reveal
that although the SUSTSM generally supports the notion that the underlying effect of
technological progress is linear, it takes a different slope. The gradient using the deterministic
approaches is consistently steeper. Wald tests are used to determine if the SUSTSM
outperforms the models with ‘linear technological progress’ and ‘no technological progress’
given that these are restricted forms of the SUSTSM. The Almon lag approach is not strictly
nested within the SUSTSM, therefore it is not directly compared to the SUSTSM5, though the
Almon lag approach is compared to the linear trend and no trend models respectively also
using Wald tests as these are also restricted forms of the Almon model. The results for the
Wald tests, see Table 2, seek to understand (i) whether the addition of technological progress
benefits the models overall performance (ii) if this is better done using non-linear trends
compared to linear ones. Given that this is not a full general to specific econometric exercise
and that more general Translog specifications and/or alternative functional forms could be
applied, these tests are indicative of potential avenues for further research, rather than
providing a conclusive answer(s) as to the most appropriate model(s) for the data at hand.
5 This is justifiable given that the Wald tests will reveal whether or not linear technological progress is outperformed by non-linear alternatives.
10
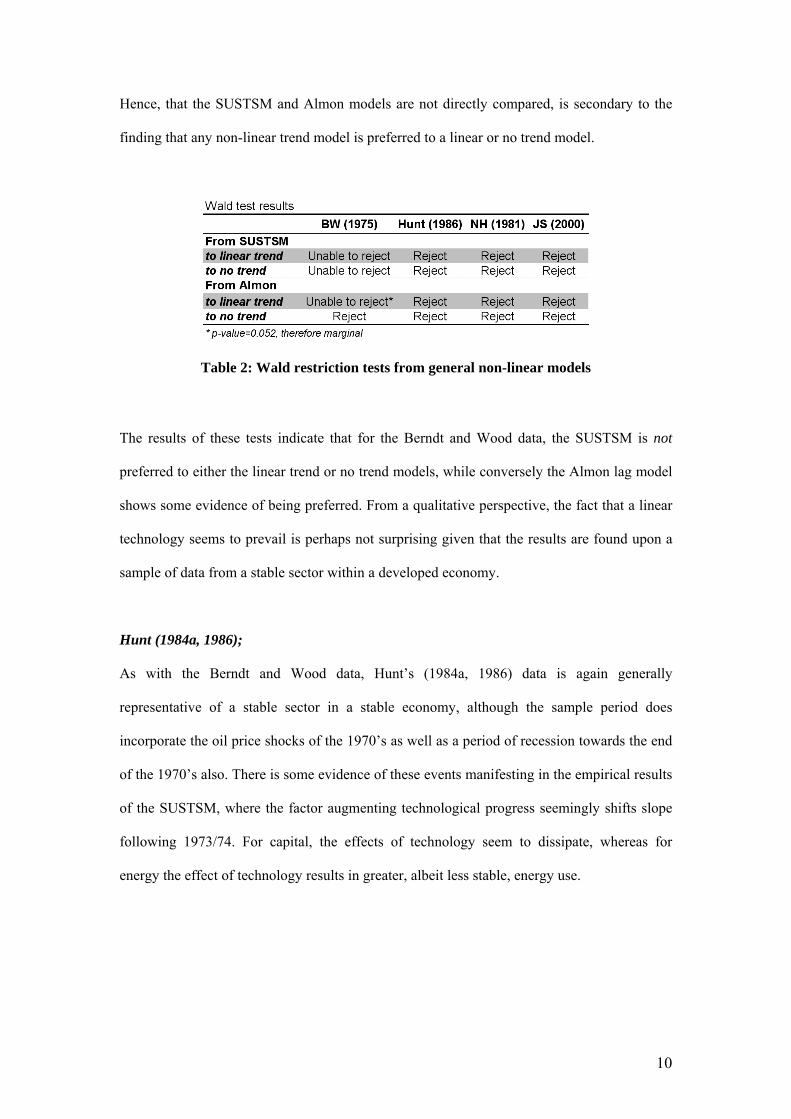
Hence, that the SUSTSM and Almon models are not directly compared, is secondary to the
finding that any non-linear trend model is preferred to a linear or no trend model.
Table 2: Wald restriction tests from general non-linear models
The results of these tests indicate that for the Berndt and Wood data, the SUSTSM is not
preferred to either the linear trend or no trend models, while conversely the Almon lag model
shows some evidence of being preferred. From a qualitative perspective, the fact that a linear
technology seems to prevail is perhaps not surprising given that the results are found upon a
sample of data from a stable sector within a developed economy.
Hunt (1984a, 1986);
As with the Berndt and Wood data, Hunt’s (1984a, 1986) data is again generally
representative of a stable sector in a stable economy, although the sample period does
incorporate the oil price shocks of the 1970’s as well as a period of recession towards the end
of the 1970’s also. There is some evidence of these events manifesting in the empirical results
of the SUSTSM, where the factor augmenting technological progress seemingly shifts slope
following 1973/74. For capital, the effects of technology seem to dissipate, whereas for
energy the effect of technology results in greater, albeit less stable, energy use.
11
Figure 1: Factor Augmenting Technological progress on Energy and capital;
12
The Wald tests clearly support that the use of a non-linear trend is preferred, with both the
deterministic and stochastic versions being preferred to the linear trend and no trend models.
Although the trends depicted in figure one may appear upon an initial cursory inspection to be
quite linear on average, the added explanation of the variation increases the model
performance sufficiently enough for it to be a preferred approach. Focussing for instance upon
the underlying trend of technological progress effects on the share of capital in the factor mix,
a number of observations can be made. Prior to 1973, the effect of technology was steadily
increasing, but for some mild variation in and around 1965 which persisted for a few years.
Post 1973, these effects dissipated and would tend to imply that a structural shift in the impact
of technological progress occurred following the oil shock6. A similar albeit less obvious
pattern appears in the energy share equation, with increased volatility in the trend post 1973.
Although this variation appears small and not far removed from the linear trend, the ability to
accurately capture the non-linearities proves to be a significant advantage to model
specification. This might be a result of the order of the model specified, and the situation that
a fourth order polynomial is insufficiently able to capture the true underlying trend.
Norsworthy and Harper (1981);
This data set represents a generally stable economy, but during a less stable time period than
compared to the Berndt and Wood data i.e. the sample incorporates the same oil price crises
that were present in Hunt’s (1984a, 1986) data. The underlying technological progress trends
generated by the non-linear models are more profoundly departed from a linear trend than
with the previous two examples. Both the Almon lag approach and the SUSTSM suggest an
almost sinusoidal underlying technological progress for capital, although the SUSTSM shows
a less fluctuating trend pre 1973 and more severely fluctuating trend post 1973. For energy
the trends from the two approaches largely follow the same pattern but with differing
6 Hunt (1984b) estimated a Translog cost function for this data allowing for the possibility of a structural break following the oil price shock and found evidence of a statistically significant structural break in the data generation process.
13
magnitudes, though post 1973 the two trends seem to separate, with the SUSTSM suggesting
no substantial effect of technology on factor use, whereas the Almon lag approach implies
factor using technological progress. The Wald tests reveal that the non-linear trends are
preferred to the linear trends.
The linear trend model results imply that for energy the effect of technological progress is
energy saving, whereas the preferred non-linear models would rather tell a different story.
Using the non-linear trends, the implication is that the effects of technological progress have
been mostly energy consuming over the period in question
Jorgensen and Stiroh (2000);
The implied technology trends for the US Transport ordnance and equipment sector when
using the non-linear trend models imply that the oil price shock of the early 1970’s had a
pronounced impact upon the effectiveness of new technology implementation, both during the
period of the shock and for some time thereafter. This is not too surprising given that the
estimation is for the transport ordnance and equipment sector, where output will be
predominantly governed by output/activity in the transport sector. Hence the volatility in the
technology trend is a by-product of a fluctuating demand for oil resulting from the price
shock/crisis during this period. The non-linear models are preferred based upon the Wald test
results.
Elasticities of substitution;
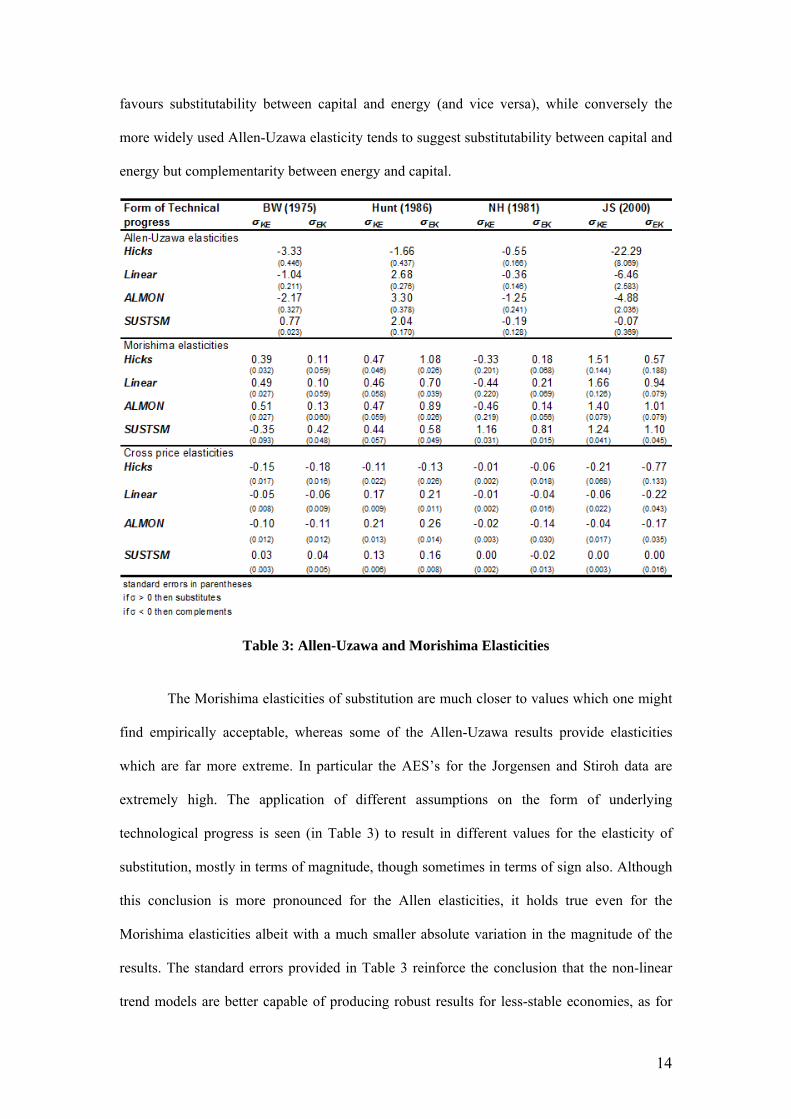
With respect to the general implications for energy-capital substitutability, Table 3 identifies
no clear-cut patterns7 as to whether they are complements or substitutes, though this is not
entirely unexpected given the unique nature of each of the datasets. The Morishima elasticity
7 Even though some of the Translog parameters show little variation, as for instance in the Norsworthy and Harper data, which shows four identical σke values. This is because of the addition and multiplication by factor shares and/or the inclusion of own-price parameters in the calculation of the final elasticities, as in the MES.
14
favours substitutability between capital and energy (and vice versa), while conversely the
more widely used Allen-Uzawa elasticity tends to suggest substitutability between capital and
energy but complementarity between energy and capital.
Table 3: Allen-Uzawa and Morishima Elasticities
The Morishima elasticities of substitution are much closer to values which one might
find empirically acceptable, whereas some of the Allen-Uzawa results provide elasticities
which are far more extreme. In particular the AES’s for the Jorgensen and Stiroh data are
extremely high. The application of different assumptions on the form of underlying
technological progress is seen (in Table 3) to result in different values for the elasticity of
substitution, mostly in terms of magnitude, though sometimes in terms of sign also. Although
this conclusion is more pronounced for the Allen elasticities, it holds true even for the
Morishima elasticities albeit with a much smaller absolute variation in the magnitude of the
results. The standard errors provided in Table 3 reinforce the conclusion that the non-linear
trend models are better capable of producing robust results for less-stable economies, as for
15
the BW and Hunt data there is an increase in the size of the standard errors as the trend
function becomes arguably unnecessarily more complex. However for the NH and JS
datasets, which include more pronounced variation, the increased flexibility in the trend
function seems to enhance the robustness of the results. These results are confirmed by the
increased robustness of the CPE.
5. Discussion and Conclusions.
With respect to the core research hypothesis, this paper has provided empirical evidence to
suggest that technological progress is not necessarily a linear function of time and
subsequently that empirical studies need to test for the alternatives. Making the wrong
assumption could lead to bias in the estimated production function parameters and hence the
derived elasticity of substitution between capital and energy may be based upon an incorrectly
specified model. Arguably the SUSTSM further provides a more econometrically efficient
estimation method than the alternative non-linear deterministic approach considered. This is
largely because it allows for non-linear technological progress to feature in the model without
adding excess variables/parameters to the model as an Almon lag structure might. Similarly,
factor augmenting linear deterministic trends are a restricted form of the SUSTSM and can be
easily tested and chosen if econometrically preferred.
It is recommended that a general to specific approach to estimation is advocated whereby the
most general form should be the SUSTSM, which allows the underlying technological
progress term to take any shape. Although the Almon lag representation is not strictly nested
within this specification, the empirical results would lend themselves to the conclusion that
the Almon lag is an approximation to the results of the SUSTSM. To this extent it may be
reasonable to suggest that the two methods are substitutes rather than anything else. In less
stable/developing economies, it may simply be infeasible to apply a technological progress
16
term which accurately reflects the underlying effects of technology in the sector. Given its
potential ability to parsimoniously specify accurate non-linear trends the SUSTSM would also
be a recommended model for small or unstable data samples.
17
Bibliography and selected references
Allen. R, (1938), Mathematical analysis for economists, MacMillan, London.
Baumol. W, (1972), Economic theory and operations analysis, Prentice Hall, UK.
Berndt. E and Christensen. L, (1971), The Translog function and the substitution of equipment, structures, and labour in US manufacturing 1929-68, Journal of Econometrics, 1, 81-114.
Berndt. E and Wood. D, (1975), Technology, prices, and the derived demand for energy, The Review of Economics and Statistics, 57(3), 259-268.
Berndt. E and Wood. D, (1979), Engineering and econometric interpretations of energy-capital complemetarity, The American Economic Review, 69(3), 342-354.
Blackorby. C and Russell. R, (1981), The Morishima elasticity of substitution: symmetry, constancy, separability, and its relation to the Hicks and Allen elasticities, The Review of Economic Studies, 48(1), 147-158.
Broadstock. D C, Hunt. L C and Sorrell. S, (2007), 'Elasticity of substitution studies', UK Energy Research Centre (UKERC) Review of Evidence for the Rebound Effect, Technical Report 3, Ref: UKERC/WP/TPA/2007/011 (www.ukerc.ac.uk/Downloads/PDF/07/0710ReboundEffect/0710Techreport3.pdf).
Christensen. L, Jorgenson. D and Lau. L, (1973), Transcendental logarithmic production frontiers, The Review of Economics and Statistics, 55, 28-45.
Diewert. W, (1971), An Application of Shephard Duality Theorem: A Generalized Leontief Production Function, Journal of Political Economy, 79(3), 481-507.
Frondel. M and Schmidt. C, (2002), The capital-energy controversy: an artefact of cost shares?, The Energy Journal, 23(2), 53-79.
Harvey. A and Marshall. P, (1991), Inter-fuel substitution, technical change and the demand for energy in the UK economy, Applied Economics, 23, 1077-1086.
Harvey. A, (1989), Forecasting, Structural Time Series Models and the Kalman Filter, Cambridge University Press, Cambridge.
Hicks. J. R, (1932), The theory of wages, Macmillan, London.
Hunt. L, (1984a), Energy and capital: Substitutes or complements? Some results for the UK industrial sector, Applied Economics, 16, 783-789.
Hunt. L, (1984b), The energy crisis of the early 1970’s and the capital-labour-energy relationship in the U.K. industrial sector, Kashmir Economic Review, 1(2), 29-38.
Hunt. L, (1986), Energy and capital: substitutes or complements? A note on the importance of testing for non-neutral technical progress, Applied Economics, 18, 729-735.
18
Jorgensen. D, and Stiroh. K, (2000), Raising the speed limit: U.S. economic growth in the information age, Brookings Papers on Economic Activity, 1, 125-211.
McNown. R, Pourgerami. A and von Hirschhausen. C, (1991), Input substitution in manufacturing for three LDCs: Translog estimates and policy implications, Applied Economics, 23, 209-218.
Morishima. M, (1967), A few suggestions on the theory of elasticity, Kezai Hyoron (Economic Review), 16, 144-150.
Koetse. M, de Groot. H, and Florax. R, (2007), Capital-energy substitution and shifts in factor demand: A meta-analysis, Energy Economics, 30(5), 2236-2251.
Norsworthy. J, and Harper. M, (1981) Dynamic Models of Energy Substitution in U.S. Manufacturing. In: Berndt ER, Field BC (Eds), Modeling and Measuring Natural Resource Substitution, MIT Press: Cambridge, Massachusetts, 177-208.
Thompson. H, (2006), The applied theory of energy substitution in production, Energy Economics, 28, 410-425.
Turnovsky. M, Folie. M, and Ulph. A, (1982), Factor substitutability in Australian manufacturing with emphasis on energy inputs, Economic Record, 58(160), 61-73
Uzawa. H, (1962), Production functions with constant elasticities of substitution, The Review of Economic Studies, 29, 291-299.

Note: This paper may not be quoted or reproduced
without permission
Surrey Energy Economics Centre (SEEC) Department of Economics
University of Surrey Guildford
Surrey GU2 7XH

SURREY
ENERGY
ECONOMICS
DISCUSSION PAPER
SERIES
For further information about SEEC please go to:
www.seec.surrey.ac.uk