Embed Size (px)
Citation preview

NON-LINGUISTIC COGNITIVE EFFECTS OF LEARNING AMERICAN SIGN
LANGUAGE AS A SECOND LANGUAGE
by
Mary Lou Vercellotti
B.A. Carlow College, 1994
M.A. University of Pittsburgh, 2007
Submitted to the Graduate Faculty of
Arts and Sciences in partial fulfillment
of the requirements for the degree of
Master of Arts
University of Pittsburgh
2007

UNIVERSITY OF PITTSBURGH ARTS AND SCIENCES
This thesis was presented
by
Mary Lou Vercellotti
It was defended on November 8, 2007 and approved by
Natasha Tokowicz, Ph.D., Assistant Professor, Psychology Department Yasuhiro Shirai, Ph.D., Professor, Linguistics Department
Thesis Director: Claude E. Mauk, Ph.D., Lecturer, Linguistics Department
ii

Copyright © by Mary Lou Vercellotti 2007
iii

Non-Linguistic Cognitive Effects of Learning American Sign Language
As a Second Language
Mary Lou Vercellotti, M.A.
University of Pittsburgh, 2007
This thesis reports the findings of four non-linguistic experiments with participants from
three second language learning groups, students in second semester American Sign Language
(ASL2), in fourth semester ASL (ASL4), and students learning Spanish as a point of comparison.
These experiments provide evidence that the spatial-visual modality of ASL impacts the effects of
language learning. Participants completed two face-processing tasks, the Benton Facial
Recognition Test (BFRT) and the Mooney Faces Closure Test (MFCT), and two spatial relations
tasks, a Mirror Reversal/Mental Rotation test (MR) and the Differential Aptitude Test-Space
Relations (SR).
Previous research has found deaf native signers have increased facial recognition skills
(McCullough & Emmorey, 1997; Bettger et al., 1997) and that hearing signers have increased face-
processing skills (Arnold & Murray, 1998). Deaf late learners of ASL and hearing signers
outperformed hearing non-signers on the BFRT (Bettger et al., 1997). However, on the MFCT,
signers showed a slight disadvantage (McCullough & Emmorey, 1997). Existing research finds
native signers have increased skills on mirror reversal tasks (Masataka, 1995) and mental rotation
tasks (Emmorey, Kosslyn, & Bellugi, 1993). Some research has found that hearing ASL L2
participants outperform new ASL L2 participants and non-signers (Talbot & Haude, 1993).
Research results are inconsistent about non-linguistic signing advantages. Research on ASL as an
L2 is limited. This paper adjoins non-linguistic task results and begins to address when in the L2
progression effects are found.
iv

Participants’ scores on these four tests were analyzed using a series of one-way ANOVAs.
When the language group was a significant (p<.05) factor, a post-hoc (Tukey’s HSD) analysis
determined which language groups significantly differed. ASL2 and ASL4 scores on the MR task
were significantly different from the Spanish group. Moreover, Wilcoxon Signed Ranks Test
confirmed significant, but not consistent, differences in accuracy between same and reversed test
items in the higher rotation categories for each language group. These results suggest that mirror
reversal and mental rotation may be separate skills that are both correlated with signing. Results
also indicate that ASL may serve as spatial relations training, supporting a psycho-social response
for gender differences on spatial relation tasks.
v

TABLE OF CONTENTS
1.0 INTRODUCTION...................................................................................................................... 1
1.1 PREVIOUS RESEARCH ON THE NON-LINGUISTIC EFFECTS OF SIGNING.... 2
1.1.1 Face Processing and Signing........................................................................................ 2
1.2 VISUAL-SPATIAL ABILITIES........................................................................................ 7
1.2.1 Visual Spatial Skills and Signing................................................................................. 9
1.3 THE CURRENT PROJECT ............................................................................................ 11
1.3.1 Introduction................................................................................................................. 11
1.3.2 Structure of the Thesis................................................................................................ 12
2.0 FACE-PROCESSING EXPERIMENTS................................................................................. 13
2.1 METHODOLOGY............................................................................................................ 13
2.1.1 Participants.................................................................................................................. 13
2.1.2 Materials ............................................................................................................... 14
2.1.3 Data collection ............................................................................................................. 15
2.2 BENTON FACIAL RECOGNITION TEST .................................................................. 17
2.2.1 BFRT Description ....................................................................................................... 17
2.2.2 BFRT Results and Discussion .................................................................................... 18
2.3 MOONEY FACES CLOSURE TEST............................................................................. 25
2.3.1 MFCT Description ...................................................................................................... 25
2.3.2 MFCT Results and Discussion................................................................................... 26
2.4 COMPARISION OF FACE-PROCESSING TEST RESULTS.................................... 33
2.4.1 Introduction................................................................................................................. 33
2.4.2 Comparison Results and Discussion ......................................................................... 34
3.0 SPATIAL RELATION TESTS ................................................................................................ 36
vi

3.1. METHODOLOGY........................................................................................................... 36
3.2 MIRROR REVERSAL TEST .......................................................................................... 36
3.2.1 MR Description ........................................................................................................... 36
3.2.2 MR Results and Discussion........................................................................................ 37
3.2.3 MR Results and Discussion - Females....................................................................... 44
3.2.4 MR Test Item Analysis ............................................................................................... 47
3.3 SPACE RELATIONS TEST ............................................................................................ 56
3.3.1 SR Test Description .................................................................................................... 56
3.3.2 SR Results and Discussion.......................................................................................... 57
3.3.3 SR Results - Females................................................................................................... 62
4.0 COMPARISION OF FACE-PROCESSING AND SPATIAL RELATIONS RESULTS... 66
4.1 INTRODUCTION ............................................................................................................. 66
4.2 RESULTS AND DISCUSSION........................................................................................ 66
4.2.1 BFRT and Spatial Relations Tests............................................................................. 66
4.2.2 MFCT and Spatial Relations Tests ........................................................................... 68
5.0 DISCUSSION AND CONCLUSIONS ..................................................................................... 71
5.1 SUMMARY OF RESULTS .............................................................................................. 71
5.2 LIMITATIONS AND FUTURE RESEARCH ............................................................... 73
5.2.1 Mirror Reversal and Mental Rotation...................................................................... 73
5.2.2 MR Individual Test Item Reaction Times ................................................................ 74
5.2.3 Stimuli .......................................................................................................................... 74
5.2.4 Amount of ASL L2 Experience.................................................................................. 75
5.2.5 Sample Size .................................................................................................................. 75
5.2.6 Spatial Relations Training ......................................................................................... 75
vii

5.2.7 Demographic Information.......................................................................................... 76
5.2.8 Proficiency Ratings ..................................................................................................... 76
BIBLOGRAPHY ............................................................................................................................. 78
APPENDIX A................................................................................................................................... 83
APPENDIX B ................................................................................................................................... 84
APPENDIX C................................................................................................................................... 85
APPENDIX D................................................................................................................................... 87
viii

LIST OF TABLES
TABLE 1-1 FACE PROCESSING: EFFECTS OF SIGNING.......................................................................................................... 6 TABLE 1-2 SIGNING EFFECTS ON VISUAL-SPATIAL ABILITIES........................................................................................... 10 TABLE 2- 1 BENTON ACCURACY VS TOTAL TEST TIME .................................................................................................... 22 TABLE 2- 2 BENTON ACCURACY VS PROFICIENCY............................................................................................................ 23 TABLE 2- 3 BENTON TOTAL TEST TIME VS PROFICIENCY ................................................................................................. 24 TABLE 2- 4 MOONEY ACCURACY VS TOTAL TEST TIME................................................................................................... 29 TABLE 2- 5 MOONEY ACCURACY VS PROFICIENCY .......................................................................................................... 31 TABLE 2- 6 MOONEY TOTAL TEST TIME VS PROFICIENCY................................................................................................ 32 TABLE 2- 7 BENTON ACCURACY VS MOONEY ACCURACY BY GROUP .............................................................................. 34 TABLE 3- 1 MIRROR REVERSAL ACCURACY PERCENTAGE VS NUMBER ATTEMPTED ....................................................... 42 TABLE 3- 2 MIRROR REVERSAL RAW ACCURACY VS PROFICIENCY BY GROUP ................................................................ 43 TABLE 3- 3 MR ACCURACY BY ROTATION AND REVERSAL CATEGORY............................................................................ 50 TABLE 3- 4 WILCOXON TEST RESULTS.............................................................................................................................. 52 TABLE 3- 5 SPACE RELATIONS ACCURACY VS PROFICIENCY............................................................................................ 59 TABLE 3- 6 ACCURACY PERCENTAGE-SPACE RELATIONS VS MIRROR REVERSAL............................................................ 60 TABLE 3- 7 RAW ACCURACY – SPACE RELATIONS VS MIRROR REVERSAL....................................................................... 61 TABLE 3- 8 ACCURACY PERCENTAGE SPACE RELATIONS VS MIRROR REVERSALS – FEMALES ........................................ 64 TABLE 4- 1 ACCURACY –MIRROR REVERSAL VS BENTON ................................................................................................ 67 TABLE 4- 2 ACCURACY – SPACE RELATIONS VS BENTON................................................................................................. 68 TABLE 4- 3 ACCURACY – MIRROR REVERSAL VS MOONEY FACES CLOSURE TEST .......................................................... 69 TABLE 4- 4 ACCURACY – SPACE RELATIONS VS MOONEY................................................................................................ 70
ix

LIST OF FIGURES
FIGURE 1 SAMPLE TEST ITEM FROM THE BENTON FACIAL RECOGNITION TEST ................................................................. 4 FIGURE 2 SAMPLE TEST STIMULI FROM THE MOONEY FACES CLOSURE TEST...................................................................... 6 FIGURE 3 SAMPLE TEST ITEM FROM THE BENTON FACIAL RECOGNITION TEST. ............................................................... 18 FIGURE 2- 1BENTON ACCURACY....................................................................................................................................... 19 FIGURE 2- 2 BENTON TOTAL TEST TIME ........................................................................................................................... 20 FIGURE 2- 3 BENTON ACCURACY VS TOTAL TEST TIME.................................................................................................... 21 FIGURE 2- 4 BENTON ACCURACY VS PROFICIENCY BY GROUP.......................................................................................... 22 FIGURE 2- 5 BENTON TOTAL TEST TIME VS PROFICIENCY BY GROUP ............................................................................... 23 FIGURE 4 SAMPLE TEST ITEM FROM THE MOONEY FACES CLOSURE TEST. ...................................................................... 26 FIGURE 2- 6 MOONEY FACES CLOSURE TEST ACCURACY ................................................................................................. 26 FIGURE 2- 7 MOONEY TOTAL TEST TIME .......................................................................................................................... 28 FIGURE 2- 8 MOONEY ACCURACY VS TOTAL TEST TIME BY GROUP ................................................................................. 29 FIGURE 2-9 MOONEY ACCURACY VS PROFICIENCY BY GROUP ......................................................................................... 31 FIGURE 2- 10 MOONEY TOTAL TEST TIME VS PROFICIENCY BY GROUP............................................................................ 32 FIGURE 2-11BENTON ACCURAY VS MOONEY ACCURACY BY GROUP ............................................................................... 34 FIGURE 5 SAMPLE TEST ITEM FROM THE MIRROR REVERSAL TEST. ................................................................................. 36 FIGURE 3- 1MIRROR REVERSAL ACCURACY ..................................................................................................................... 37 FIGURE 3- 2 MIRROR REVERSAL TEST ITEMS ATTEMPTED................................................................................................ 39 FIGURE 3- 3 MIRROR REVERSAL ACCURACY PERCENTAGE............................................................................................... 40 FIGURE 3- 4 MIRROR REVERSAL ACCURACY PERCENTAGE VS NUMBER ATTEMPTED BY GROUP ..................................... 41 FIGURE 3- 5 MIRROR REVERSAL RAW ACCURACY VS PROFICIENCY BY GROUP ............................................................... 43 FIGURE 3- 6 MIRROR REVERSAL RAW ACCURACY - FEMALES.......................................................................................... 45 FIGURE 3- 7MIRROR REVERSAL TEST ITEMS ATTEMPTED - FEMALES............................................................................... 46 FIGURE 3- 8MIRROR REVERSAL ACCURACY PERCENTAGE - FEMALES.............................................................................. 47 FIGURE 3- 9 MIRROR REVERSAL ACCURACY PERCENTAGE PER ROTATION CATEGORY ................................................... 48 FIGURE 3- 10 MIRROR REVERSAL ACCURACY BY ROTATION AND REVERSAL CATEGORY................................................ 50 FIGURE 3- 11MIRROR REVERSAL ACCURACY PERCENTAGE BY ROTATION CATEGORY-SAME........................................ 53 FIGURE 3- 12MIRROR REVERSAL ACCURACY PERCENTAGE BY ROTATION CATEGORY-REVERSED .............................. 54 FIGURE 6 SAMPLE TEST ITEM FROM THE SPACE RELATIONS TEST. .................................................................................... 56 FIGURE 3- 13 SPACE RELATIONS ACCURACY .................................................................................................................... 57 FIGURE 3- 14 SPACE RELATIONS ACCURACY VS PROFICIENCY ......................................................................................... 58 FIGURE 3- 15 ACCURACY PERCENTAGE-SPACE RELATION VS MIRROR REVERSAL .......................................................... 59 FIGURE 3- 16 RAW ACCURACY-SPACE RELATIONS VS MIRROR REVERSAL ...................................................................... 61 FIGURE 3- 17 SPACE RELATIONS ACCURACY - FEMALES .................................................................................................. 62 FIGURE 3- 18 ACCURACY PERCENTAGE-SPACE RELATIONS VS MIRROR REVERSALS - FEMALES...................................... 63 FIGURE 4- 1 ACCURACY-MIROR REVERSAL VS BENTON................................................................................................... 67 FIGURE 4- 2 ACCURACY-SPACE RELATIONS VS BENTON .................................................................................................. 68 FIGURE 4- 3 ACCURACY-MIRROR REVERSAL VS MOONEY................................................................................................ 69 FIGURE 4- 4 ACCURACY-SPACE RELATIONS VS MOONEY ................................................................................................. 70
x
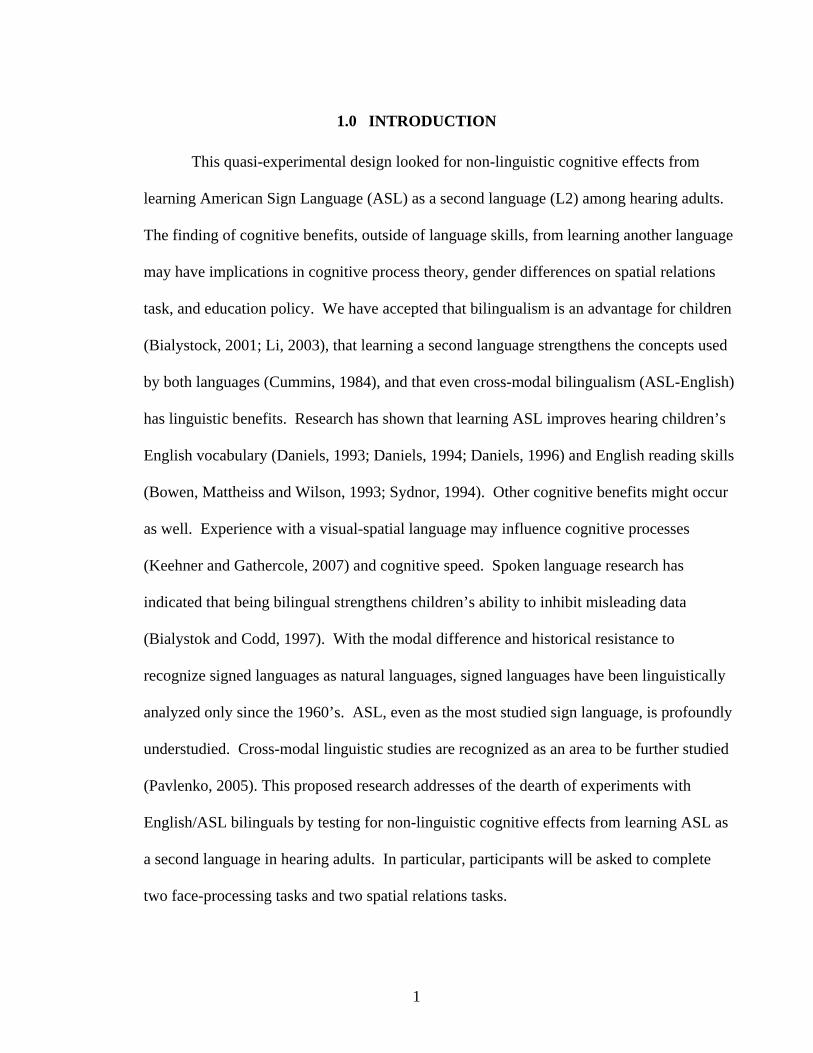
1.0 INTRODUCTION
This quasi-experimental design looked for non-linguistic cognitive effects from
learning American Sign Language (ASL) as a second language (L2) among hearing adults.
The finding of cognitive benefits, outside of language skills, from learning another language
may have implications in cognitive process theory, gender differences on spatial relations
task, and education policy. We have accepted that bilingualism is an advantage for children
(Bialystock, 2001; Li, 2003), that learning a second language strengthens the concepts used
by both languages (Cummins, 1984), and that even cross-modal bilingualism (ASL-English)
has linguistic benefits. Research has shown that learning ASL improves hearing children’s
English vocabulary (Daniels, 1993; Daniels, 1994; Daniels, 1996) and English reading skills
(Bowen, Mattheiss and Wilson, 1993; Sydnor, 1994). Other cognitive benefits might occur
as well. Experience with a visual-spatial language may influence cognitive processes
(Keehner and Gathercole, 2007) and cognitive speed. Spoken language research has
indicated that being bilingual strengthens children’s ability to inhibit misleading data
(Bialystok and Codd, 1997). With the modal difference and historical resistance to
recognize signed languages as natural languages, signed languages have been linguistically
analyzed only since the 1960’s. ASL, even as the most studied sign language, is profoundly
understudied. Cross-modal linguistic studies are recognized as an area to be further studied
(Pavlenko, 2005). This proposed research addresses of the dearth of experiments with
English/ASL bilinguals by testing for non-linguistic cognitive effects from learning ASL as
a second language in hearing adults. In particular, participants will be asked to complete
two face-processing tasks and two spatial relations tasks.
1

1.1 PREVIOUS RESEARCH ON THE NON-LINGUISTIC EFFECTS OF SIGNING
Some existing research has shown that deaf signers perform differently on some cognitive
tasks than hearing non-signers. Emmorey, Kosslyn, and Bellugi (1993) did several related studies
on mental image ability. One finding was that ASL signers are more successful than non-signers at
generating a mental image of previously seen block letters after prompted by cursive lower case
letters. Deaf ASL signers without knowledge of Chinese were more successful in reproducing
“pseudo” Chinese characters that were written in the air using point light displays than hearing non-
signers. (Klima, Tzeng, Flok, Bellugi, and Corina, 1996).
1.1.1 Face Processing and Signing
Research suggests that face processing and signing are related. During a signed
conversation, the “listener” focuses on the face while the arms and hands are perceived through
peripheral vision (Isenhath, 1990). The focus on the signer’s face facilitates the perception of
grammatical features of ASL which are encoded in facial expressions (Baker and Padden, 1978,
Liddell, 1977, 1980, Stokoe, Casterline & Croneberg, 1965). Specifically, eyebrow lowering
indicates a wh- questions and eyebrow raising indicates a yes/no question. Another example is that
adverbial intensifiers like the adverb “very” are expressed by mouthing the “oo” shape. Since facial
expressions are incorporated into the grammar of ASL and the face is the focus during
communication, many studies have tried to determine if signers have an advantage in remembering
faces, recognizing faces, or discriminating faces. Some studies have indicated that ASL does
improve face-processing skills but seemingly has no effect on others.
McCullough and Emmorey (1997) used Adobe Photoshop and the Warrington Recognition
Test for Faces (Warrignton, 1984) to create three versions of each face, with altered eyes, noses, or
mouths. Participants were shown a target face and then had to choose the matching face given two
2

choices with only one facial feature alteration. They found that deaf signers were overall more
accurate than hearing non-signers. Further, hearing signers outperformed hearing non-signers when
noticing an alteration in the eyes, similar to the deaf signers. However, deaf signers outperformed
hearing signers when the alteration was to the face’s mouth. McCullough and Emmorey attribute
the difference to the deaf participants’ additional skill of lip-reading.
McCullough and Emmorey (1997), in a memory test again using the Warrington
Recognition Test for Faces test, deaf signers and hearing non-signers were asked to rate faces as
“pleasant” or “unpleasant”. Then, participants were asked to choose as quickly as possible which
one of the two displayed faces they had seen during the “pleasant/unpleasant” task. Neither group
performed well on the task; answering accurately only about 71% of the time with similar speed.
Since both groups performed close to chance (50%), McCullough and Emmorey repeated the
memory test, removing the time pressure, with an additional group of deaf native or near-native
signers. They found that this group increased to 81% accuracy; however the standard accuracy with
hearing subjects is 87%. Thus, McCullough and Emmorey concluded that an ASL advantage does
not exist for remembering or recognizing faces.
Conversely, Arnold and Murray (1998) found that deaf and hearing signers of British Sign
Language (BSL) did have an advantage over non-signers for remembering location of specific faces
during a game of Concentration using the stimuli from the Warrington test. Deaf signers were more
successful than hearing signers; both signing groups were more successful than non-signers.
Furthermore, the success on the faces task measured in number of attempts was negatively
correlated with the hearing signers’ amount of experience with BSL; i.e. the number of attempts
needed for success decreased as the amount of experience with BSL increased. The test was also
conducted using pictures of objects; without the face stimuli, signers and non-signers performed
similarly. This finding indicates that signers did not have a task advantage but did, indeed, have a
3

face remembering advantage. Arnold and Mills (2001) also supports a signing advantage for face
memory in their study which replicated Arnold and Murray (1998) with hearing BSL L2
participants.
The Benton Facial Recognition Test (BFRT) has also been used to test for a signing
advantage. The test, which is clinically used to test for prosopagnosia (the inability to recognize
faces after brain injury) requires participants to match a target face given six test faces in three
different conditions: the correct test face image is identical to the target face image, test images
match the target image but from different camera angles, and test images match the target image but
in different lighting conditions (Benton, Hamsher, Varney, and Spreen, 1983).
Figure 1 Sample Benton Facial Recognition Test test item with different lighting conditions.
Bettger, Emmorey, McCullough, and Bellugi (1997) conducted a series of experiments with the
BFRT, noting that the task is discriminating between test faces, not recognizing a previously seen
face. Both deaf native signers of ASL and hearing non-signers performed near 100% accuracy on
the identical target test condition. Deaf native signers outperform hearing non-signers overall,
however, and particularly in the challenging shadow condition.
In another experiment, Bettger et al. (1997) attempted to separate the effects of being deaf,
lack of auditory perception, from the effects of learning a visual/spatial language, signing. This test
had four groups of participants (N=8 for each group): deaf native ASL signing participants with
4

deaf parents, hearing native signing participants with deaf parents, deaf participants who were late-
learners of ASL, and hearing participants who had no signing skills. The researchers found
statistically significant differences in the mean percentage correct for each group. First, since the
hearing native signers performed like the deaf native signers, the lack of auditory perception did not
seem to be the cause of enhanced facial discrimination. Further evidence comes from a study with
deaf children who have not learned to sign; these children with the lack of auditory perception and
the lack of signing perform like hearing non-signing children on the BFRT (Parasnis, Samar,
Bettger, and Sathe, 1996). Therefore, deafness by itself does not seem to be the cause of enhanced
facial processing. Second, since the deaf late learners of ASL performed like native signers,
learning ASL in early childhood does not seem to be a requirement for cognitive effects (Bettger et
al., 1997). To summarize, all three signing groups scored higher than the group of non-signers, and
the three signing groups did not differ significantly from one another. In addition, the researchers
tested, using a shortened form of the BFRT, three groups of children between the ages of 6 and 9:
deaf children who are native signers with deaf parents, deaf children who are not considered native
signers with hearing parents, and hearing children who are non-signers. The deaf native signers had
the highest scores, matching Bellugi et al.’s (1990) results with native signing children from 3 to 10.
However, in the Bettger et al. (1997) study, deaf children with hearing parents did not show a
signing advantage over the like non-signing children. This last finding might be the most relevant
to the current study because children with hearing parents usually begin learning ASL later and
have less exposure to ASL, as are the target population of ASL L2 students beginning learning the
language.
Although there seems to be a signing advantage on the BFRT, not all tasks involving face
processing show such advantage. For example, the Mooney Faces Closure Test uses high contrast
images that require participants to process the entire picture, not the individual facial features.
5

Figure 2 Sample test stimuli from the Mooney Faces Closure Test.
Participants are asked to view the image and label the face as a boy, a man, an old man, a girl, a
woman, or an old woman. When McCullough and Emmorey (1997) gave this test to deaf signers
and hearing non-signers, they did not find a sign advantage. In fact, they found a “marginally
significant” difference between the groups in which the signers’ mean score was lower. The authors
suggested that an overreliance on local facial features rather than global explained the lower scores
on the MFCT.
Table 1-1 Face Processing: Effects of Signing
Task Participants Reseacher(s) Identifying altered facial features Deaf signers>hearing non-signers McCullough & Emmorey, 1997 Concentration-Face Matching Deaf & hearing BSL signers>non Arnold & Murray, 1998 Benton Facial Recognition Test Deaf native signers>hearing non Bettger et al., 1997 Benton Facial Recognition Test Deaf very late learners, hearing
signers > hearing non signers Bettger, Emmorey, McCullough, & Bellugi, 1997
Warrington Test-Face Memory Deaf signers = hearing non-signers McCullough & Emmorey, 1997 Benton Facial Recognition Test Deaf children with hearing parents=
hearing children Bettger, Emmorey, McCullough, & Bellugi, 1997
Mooney Faces Closure Test Hearing non-signers > signers McCullough & Emmorey, 1997
Although several populations were tested on the BFRT to determine if signing causes
enhanced facial processing, several factors in the populations have not been addressed. Firstly, will
hearing adults learning ASL as an L2, not as a primary or preferred communication method gain
enhanced facial processing skills? If so, will the cognitive effects be seen after only 6 months
exposure to ASL or after 18 months exposure, which is even less than the deaf non-native signing
children who did not show any advantage. Also, the Bettger et al. (1997) study which showed that
signing seemed to be the important factor had a small populations (N=8) in each comparison group.
A larger scale study testing for facial processing effects of late-learning signing of a hearing
6

population has yet to be done. Lastly, we do not know if there is any correlation with learning ASL
as an L2 and success on the Mooney Faces Closure Test. If some relationship is found, it is unclear
if the hearing ASL L2 students will perform like deaf signers, i.e. slightly worse than non-signers.
This face-processing research has implications for our understanding of models of the brain,
the part-whole theory, and the possibility that the brain retains its plasticity into adulthood. Current
models of bilingualism focus on how two languages are organized in relationship to each other, not
to other cognitive skills (Kroll and Tokowicz, 2005). Some (Farah, Wilson, Drain, Tanaka, 1995;
even argue that face processing is a separate system than object recognition based on participants
with brain injury (Farah, 1996) or a domain specific skill (Nachson, 1995). If learning a second
language as an adult offers facial processing advantages, might there be other non-linguistic
cognitive effects?
1.2 VISUAL-SPATIAL ABILITIES
It is generally accepted that gender differences are found when testing visual-spatial ability
with males outperforming females (Maccoby and Jacklin, 1974). However, it is debated whether
the difference is biological (Bock and Kolakowski, 1973; Broverman, Klaiber, Kobayashi, and
Vogel, 1968; Kommenich, Lane, Dickey, and Stone, 1978) or environmental, cultural, experience-
based difference (Sherman, 1967, Maccoby and Jacklin, 1974). Men generally perform better on
tasks requiring the mental rotation of images as if the images were three-dimensional, i.e. rotation
on more than one axis (Vandenberg and Kuse, 1978; Linn and Petersen, 1985; Peters, 2005). Men
outperform women whether the mental rotation task uses block figures or human figures (Alexander
and Evardone, 2007). In a study comparing five different sets of stimuli (alphamumeric characters,
PMA symbols, animal drawings, polygons and cube figures), Jansen-Osmann and Heil’s (2007)
results challenge the conventional generalization that men always outperform women in mental
7

rotation tasks. In their study, only polygons produced male advantage in mental rotation speed and
rotational uncertainty. Geiser, Lehmann, and Eid (2006) identified five solution strategies for
solving the items on mental rotations test. Their results support that overall males perform mental
rotation tasks more accurately and faster than females. They also found that females tended to
choose a less successful analytic rather than rotation strategy, which accounted for some of the
gender difference. Some research has indicated that training and practice effect mental rotation and
mirror reversal tasks. Scores on a short (5 questions with a total of 10 possible points) mental
rotation test rose after a single one-hour lecture on spatial abilities (McGee, 1978). Burnett and
Lane (1980) treated spatially-related college courses as “training” and found that experience
significantly improved women’s scores more than men’s scores on the test, even though women’s
scores did not significantly improve overall. Likewise, Johnson, Flinn, and Tyer (1979) considered
a drafting course as training between a pre- and post-test of the Witkin’s Embedded Figures Test
(1971) which asks participants to find an embedded figure as quickly as possible within a complex
figure, testing for the spatial relations skill of field independence. They found that all groups (male
and female in the drafting course, in the mathematics course, and in the language course) improved
but females in the drafting course had significant improvement compared to the other groups. Moe
and Pazzaglia (2006) found that scores on a mental rotation test could be manipulated for better or
for worse simply by telling participants that a gender was better on that test. Therefore, experience
or confidence with spatial relation tasks seems to influence test scores despite any researched
gender differences. Emmorey, Klima, and Bellugi (1993) found no gender effects or interaction
with gender with the mental rotation and mirror reversal identification task with ASL signers and
non-signers.
8

1.2.1 Visual Spatial Skills and Signing
In addition to the obvious visual aspect of ASL, visual-spatial ability as a cognitive skill is
connected to signing because signing allows for space to be included in the language (Bellugi et al.,
1990). The pronouns “you” and “me” are obvious examples of how the movement of the sign is
dependent on the location of the signer and the referent whereas spoken language has a set
phonological form for the concepts. Emmorey, Klima, and Hickok (1998) investigated if ASL
affected the ability to reproduce scenes involving location in a space and orientation of the object,
two skills necessary for sign language comprehension. They found an advantage for ASL signers
for object orientation and for location of objects in scenes requiring mental rotation. A gender
difference among the deaf participants was noted by the researchers: males (both hearing and deaf)
outperformed females as a group, and deaf signing males outperform hearing males but do not
outperform deaf signing females (Emmorey, Klima, and Hickok). Signing, in some way, may
encourage the use of a mental rotation strategies rather than analytic strategies that were identified
by Geiser et al. (2006). In addition to mental rotation practice, signing also requires mirror reversal
detection in order to understand directions and movements given from the signer’s perspective.
Some signs include left to right movement, for example: a right-handed signer moves her hand from
the left to the right, to produce the sign SUMMER. When the sign SUMMER is perceived by the “listener”
facing the signer, the movement looks right to left from the listener’s perspective. Such mirror
reversal may be understood as a visual-spatial skill. For instance, Japanese native signing deaf
children showed fewer mirror reversal errors on a tactile perception task requiring the participants
to distinguish “p” from “q” (Masataka, 1995). Prior studies also indicate that deaf signers perform a
mirror reversal and mental rotation task more quickly than hearing non-signers (McKee, 1987;
Emmorey, Kosslyn, and Bellugi, 1993). Furthermore, hearing native signers show similar results to
deaf signers in speed and accuracy, outperforming hearing non-signers on the mental rotation
9

task/mirror reversal identification task. Emmorey, Kosslyn, and Bellugi (1993) concluded that
signing improved detection of mirror reversals. When the researchers separated the results of the
deaf native signers from the deaf non-native signers, they found that the native signers were more
accurate than the deaf signers who had later exposure to ASL (Emmorey et al., 1993). Moreover,
Talbot and Haude (1993) found that ASL skill level impacted success on a mental rotation task, but
the female participants who had increased scores on the mental rotations test were hearing student
interpreters with six years of experience. A limitation of the Talbot and Haude study is that the
groups varied greatly, in that the beginning ASL L2 learners, as a group, who had a mean of less
than one semester of signing experience compared to the successful signing group had a mean of six
years. Keehner and Gathercole (2007) studied sign language interpreters who learned British Sign
Language as adults with a Corsi blocks paradigm, in which the participants were required to
identify blocks in a rotated display. They found that the signers outperformed hearing non-signers
on spatial configurations rotated 90° and 180°, but that signers and non-signers were equally
successful at configurations rotated 0° which indicates that the rotation, not the task in general, was
difficult for the non-signers. Student interpreters (as in the Talbot and Haude study and the Keehner
and Gathercole study) may not be representative of most L2 learners. Thus, more research is
warranted within the ASL L2 population.
Table 1-2 Signing Effects on Visual-Spatial Abilities Task Participants Reseacher(s) Mirror Reversal “p” “q” Native Japanese signers-children Masataka, 1995 Mental Rotation & Mirror Reversal
Deaf signers, hearing native signers <hearing non-signers
Emmorey, Kosslyn, & Bellugi, 1993
Mental Rotation & Mirror Reversal
Deaf native signers < deaf non-native signers Emmorey, Kosslyn, & Bellugi, 1993
Mental Rotation Test Female Hearing ASL interpreters> hearing non-signers, beginning ASL L2 learners
Talbot & Haude, 1993
Corsi Blocks Paradigm Non-native hearing BSL interpreters> hearing non signers
Keehner and Gathercole, 2007
10

1.3 THE CURRENT PROJECT
1.3.1 Introduction
The main goal of this work is to attempt to discover if cognitive effects are seen within two
or four semesters of ASL L2 learning. It is unclear if exposure to ASL, without explicit training in
3-D mental rotation or mirror reversal will positively affect the mental rotation skills. A second
goal is to discover when in the L2 progression (in two semesters or in four semesters) the cognitive
effects can be found. If ASL enhances cognitive skills of mental rotation and mirror reversal
perhaps ASL should be a preferred language in the school systems. The benefits would be more
than greater communication skills, but also greater spatial skills that are used in a variety of
situations. For example, spatial ability has been found to be positively correlated with the
quantitative section of the Scholastic Aptitude Test (SAT) (Burnett, Lane, and Dratt, 1979).
Moreover, gender differences in spatial relation skills can be neutralized if signing experience is
correlated with higher spatial relations skills. From a pedagogical perspective, the results may
guide ASL teachers to additional practice activities.
This is a cross-sectional study of two face-processing tests, the Benton Facial Recognition
Test (which may be a labeled a face discrimination task) and the Mooney Faces Closure Test
(which tests gestalt face processing), and two spatial relations tests, the Mirror Reversal/Mental
Rotation Test and the Differential Aptitude Test-Space Relations. Specifically, I will determine if 6
months (ASL 2) or 18 months (ASL 4) exposure to ASL affect success on these tasks. I
hypothesized that participants with 18 months exposure to ASL will show increased success
because ASL 4 students may be able to focus on signers’ faces rather than hands; but participants
with 6 months experience will perform like non-signers on the BFRT. I predicted that all
participants (signers at both levels and non-signing controls) will perform similarly on the MFCT
because the signing experience will not be sufficient enough to cause an over-reliance on individual
11

facial features. I made two predictions concerning the mental rotations tasks. First, participants
with 18 months exposure of ASL will show increased success on both of the visual-spatial tasks, the
Mirror Reversal Test and the Space Relations test, but participants with 6 months exposure will
perform like control participants (non-signers) because they will not yet have mastery of the spatial
aspects of ASL grammar, which would improve performance on the spatial relations test. Second,
the scores on both of the visual-spatial of female participants will differ to a greater degree than the
scores of male participants; more ASL experience will positively correspond with accuracy on the
task for female participants; male participants generally will have higher scores which will show
smaller gains from ASL exposure.
1.3.2 Structure of the Thesis
Chapter Two describes the face processing experiments. Chapter Three explains the spatial
relations experiments. Chapter Four focuses on the comparison of the face-processing and spatial
relations results. Chapter Five summarizes and concludes the thesis.
12

2.0 FACE-PROCESSING EXPERIMENTS
2.1 METHODOLOGY
2.1.1 Participants
This research tested for advantages from experience of ASL as an L2. Signing participants
were recruited from students in second semester ASL classes (ASL 2) and fourth semester ASL
classes (ASL 4) at the University of Pittsburgh during the spring semester 2007. The ASL L2
population is often overlooked in linguistic research because most ASL studies strongly favor native
signers. I requested volunteers from seven (7) ASL 2 classes and from both ASL 4 classes.
Control groups of non-signers of similar age and education level were students in second
semester Spanish classes (SPAN2) and in fourth semester Spanish classes (SPAN 4) to test if
learning any second language effects scores on the tasks. I requested volunteers from seven (7) of
the twelve SPAN2 classes and from four (4) of the seven SPAN4 classes.1
During the language classroom recruitments, students were given sign-up sheets that listed
the data collection times. At this stage, 143 students had volunteered, but only 70 students
participated, approximately 50% of those who initially volunteered. 38 participants reported being
in ASL classes (21 in ASL 2 and 17 in ASL 4) with the remaining 32 participants being in the
Spanish group. The participants were not compensated for their participation. All participants
reported normal vision and hearing. Language experience data was collected. All participants were
self-reported native English speakers. The complete participant survey is found in Appendix A.
1 A third control group of non-signers were to be students who enrolled in the first semester
ASL classes for the upcoming Fall semester. This third control group was an attempt to determine if students who choose to take ASL are already better at face processing or visual-spatial abilities. The not-yet-signing ASL students were contacted by email from the enrollment list. Despite recruitment emails to over 160 students, no pre-ASL students participated in the quasi-experiment.
13

Data from three SPAN participants were excluded after the fact because they reported ASL
experience that was not “minimal.” Two of the three excluded Spanish students reported ASL
experience but did not describe what experience they had. The third had ASL classes in middle
school and in high school. Three additional SPAN students had minimal ASL experience, i.e.
knowledge of the fingerspelling alphabet or random signs, and were not excluded. A total of seven
participants (four ASL and three SPAN) were excluded from the analysis because they reported a
higher proficiency in another language (German, Hebrew, etc.) than either ASL or Spanish, which
would mean that the ASL or Spanish would not be the L2 of the participant. In sum, the data from
ten participants (six from the SPAN group, two from each of the ASL groups) were excluded after
the fact in an attempt to control for language experience.
A one-way ANOVA test revealed that the only significant demographic difference between
the groups is age (F[2,52] = 5.842, p = .005). A post-hoc Tukey’s analysis revealed that the ASL 4
group, with a mean age of 21.83 (SD 2.3), was significantly older than both the Spanish participants
who had a mean age of 19.6 (SD 1.8) (p = .004) and the ASL 2 participants, who had a mean age of
20.0 (SD 1.8) (p = .032). The ASL 2 group did not differ from the Spanish group (p = .773). The
age difference may be related to the number of classes offered in each language and the registration
preference given to students with more credits. With fewer ASL classes offered by the university,
maybe the ASL classes were filled before younger students were able to enroll. Note that one 27
year-old female in the ASL4 group is outside the rest of the population, skewing the mean.
2.1.2 Materials
The specific cognitive tests are described in detail in sections 2.2.1 and 2.3.1. In order to
computerize the data collection process, the tests were scanned to PDF format at 400 pdi using
CanoScan LiDE60. The test questions were presented using Revolution software program by
14

Runtime Revolution Limited. The tests were computerized with an effort to keep the computerized
version as close to the paper version as possible. To this end, the test directions and practice items
were maintained with only minor modifications. Participants used the computer’s mouse to click on
their answer choice rather than circling or marking an answer. One time limit was imposed from
the original test, the Benton Facial Recognition Test. See description of the individual tests below
for details. Participants could review the instructions for as much time as they wanted. The entire
testing time was approximately one-half hour. The participants were required to answer each
question before the next question was shown. The Revolution program recorded the participants’
answers and response times in seconds.
2.1.3 Data collection
Data from the language students was collected in a two-week span in March at the
University of Pittsburgh’s Robert Henderson Language Media Center during six 1-hour time slots
reserved for the experiment. The time slots were chosen by availability of the lab space and varied
by day and time for the maximum participation opportunity. There were no noticeable differences
in the environmental conditions during the different data collection sessions.
The participants were randomly given a non-identifying numeric code 1 - 200. Only the
code was attached to the study data. Participants used the identifying code to enter the Revolution
program. Since the program ran independently on each computer, the participants began the
experiment program when ready and could continue at his/her own pace within the time limits
imposed n the test (if any). Each participant took all four tests, but the order of the tests varied.
Participants who were assigned numbers 1 - 100 inclusive completed the face processing tests,
BFRT and MFCT, and then completed the space relations tests, Mirror Reversal, and DAT-Space
Relations. Participants who were assigned numbers 101-200 inclusive completed the space relations
15

tests, Mirror Reversal and DAT-Space Relations Test, and then the face processing tests, BFRT and
MFCT. I chose limited counter-balanced ordering for practical reasons. The two test order groups’
means were analyzed using independent sample t-test. Test order was not a factor for any of the
tests (p.>.10). The individual test items for both forms appeared in the same order within each
subtest. At the beginning of each subtest, instructions were displayed until the participant clicked
the continue box prompt to continue. A summary of the directions (Appendix B) were also posted
on the side of the computer. Participants were encouraged to try to answer correctly but to make the
best guess if unsure. The Revolution software program recorded the participants’ answers,
tabulated the raw scores and response times, and stored the results under the participation code.
The response times were collected to show possible increased speed effects if participants reach
accuracy ceiling on one or all subtests.
After the completion of the experiment, the participants were asked to complete the
demographic information survey, (see Appendix A). The demographic information from the survey
was stored with the participant’s answers and response times under the participants’ code.
The raw scores of the two signing levels, ASL 2 and ASL 4, and SPAN, on each of the four
subtests were imported into MicroSoft Excel and summarized. The Null Hypotheses for each test is
that the scores of the three groups will not differ significantly (p<.05) because learning a second
language, ASL or Spanish, will have no effect on the students’ non-linguistic cognitive skills tested.
Using SPSS software, participants’ scores and total test times were compared using one-way
ANOVA with language group as the independent variable. When language group was found to be a
significant factor, I ran a post hoc test -Turkey’s HSD to determine which language groups differed
significantly. SPSS was also used to determine Pearson’s bivariate correlation coefficients for
reaction times on the face-processing tests and for accuracy scores between tests. The sample size
did not allow for looking for an effect of handedness, ethnicity, other foreign language experience,
16
or ASL teacher. A separate ANOVA analyzed the data based on the participants’ proficiency as
self-reported. Language proficiency was considered because proficiency may be a more important
factor than age of acquisition (Abutalebi, Cappa, and Perani, 2005). Since the participants in this
study are adult L2 learners, proficiency may be more relevant than age of acquisition.
2.2 BENTON FACIAL RECOGNITION TEST
2.2.1 BFRT Description
The researcher purchased the Benton Facial Recognition Test from the publisher,
Psychological Assessment Resources, Inc. This face processing test was chosen to replicate
previous research by Bettger, Emmorey, McCullough, & Bellugi, (1997) but focusing on ASL L2
learners. The test presents a target face, and participants have to recognize the target face in the six
choices. The Benton Facial Recognition Test was altered to include a time constraint. This test
included two sections. The first section, in which the target faces were well-lit frontal view, had
one answer which exactly matched the target. For this first section of this test, each test item was
shown, one at a time, for exactly 20 seconds. A time limit was added as a challenge because nearly
all of the participants reached ceiling on this section of test items on a previous BTFR experiment
(Bettger, Emmorey, McCullough, and Bellugi, 1997). The second part had three correct answers per
test item asking participants to choose three faces in varied profile angles. On average, this test
took less than five minutes to complete. See section 2.2.2 BRFT Results and Discussion for details.
17

Figure 3 Sample test item for the Benton Facial Recognition Test. (Numbers 2, 4 and 6 match the target face.)
Every correct answer was counted; thus, when there were three right answers in one test item, three
points can be earned. Having all correct answers for a single test item is not necessary to earn
points. The raw scores were totaled per subtest and per section for the BTFR. Four participants had
outlier scores (<27); those participants were excluded from the analysis for this subtest.
2.2.2 BFRT Results and Discussion
I hypothesized that participants with 18 months exposure to ASL will show increased
success because ASL 4 students may be able to focus on signers’ faces rather than hands; but
participants with 6 months experience will perform like non-signers on the BFRT. The following
figure shows the mean accuracy and standard deviations of the three language groups.
18

Figure 2- 1
Benton Accuracy
0
10
20
30
40
50
Spanish (n=25) ASL 2 (n=19) ASL 4 (n=12)
Num
ber C
orre
ct (5
4)
The Benton Facial Recognition Test had a possible top score of 54, as noted on the y-axis. Scores
on this test ranged from 35 – 52. No participant achieved a perfect score on the BFRT. Adding a
twenty- second time limit for the first section of the task did not seem to have an impact, since all
but two participants had a perfect score on the timed section. The mean of the participants enrolled
in Spanish classes is 46.36 (SD 3.47). The mean of the participants enrolled in ASL 2 classes is
45.42 (SD 3.45), and in the ASL 4 classes is 45.17 (SD 2.76). Since the difference between groups
is less than the differences within each group, it is clear that there is no meaningful difference
between the accuracy of the three groups in the study (F [2, 53] =.693, p = .505). I had expected
that the Spanish group’s scores would be similar to Bettger et al.’s (1997) non-signing group and
that the ASL L2 groups would score between deaf native signers and the non-signing groups. All
three of the language groups in the current study scored between hearing non-signers and more
successful deaf signers in a previous study (Bettger et al., 1997) using the original BFRT. It is
unclear why the non-signing Spanish group in the current study (mean 86.7%) would score above
hearing non-signers in the previous study (mean 81.7%.) One plausible explanation is that the
19

current study drew participants from the college population, but the previous study drew
participants from the community; and that difference makes comparisons of the results difficult.
In addition to the participants’ accuracy on the BFRT, the participants’ total test time was
also recorded. By total test time, I mean the total time the participant took to complete one entire
test. Total test time is comparable to reaction time because the participants’ total test time is the
sum of the individual test items’ reaction times. Total test time does not include the time the
participant spent reading the test directions. Although the accuracy is approximately the same for
each group, the total time in which the groups took to complete the task may differ. Figure 2-2
shows the mean time in seconds to complete the BFRT.
Figure 2- 2
Benton Total Test Time
0
50
100
150
200
250
300
350
400
450
Spanish (n=25) ASL 2 (n=19) ASL 4 (n=12)
Tota
l Tes
t Tim
e in
Sec
onds
Participants in the Spanish condition had a mean time of 303 seconds (SD 91.09); participants at the
ASL 2 level had a mean time of 293 seconds (SD 112.94), and participants at the ASL 4 level took
285 seconds (SD 71.09). The difference between the ASL 4 group, which had the lowest mean
time, and the Spanish group, which had the highest mean time, is only 19 seconds, yet the standard
deviations are all over 70 seconds. Although the groups’ means do lower with an increase in ASL
20

experience, the difference in time the participants took in completing the test was insignificant
based on the relatively large standard deviations (F [2,53] = .146, p = .864). Bettger et al. (1997)
did not report total test time or reaction time.
One interesting trend did appear when the participants’ accuracy was plotted against the
participants’ total test time when grouped by class. The following figure compares each
participant’s accuracy against total test time.
Figure 2- 3
Benton Accuracy Vs Total Test Time
34
39
44
49
54
100 200 300 400 500 600 700
Total Test Time In Seconds
Num
ber C
orre
ct (5
4) Spanish
ASL 2
ASL 4
Linear (Spanish)
Linear (ASL 2)
Linear (ASL 4)
As the figure illustrates, more time to complete the task influenced the participants’ accuracy. Extra
time did not help nor hinder the Spanish students’ accuracy. The Spanish groups’ trend line was
almost flat. The ASL 2 students responded similarly, but there is a slight tendency that taking more
time may correlate with increased accuracy. It might be expected that an increase in time would
correlate with an increase in accuracy, i.e., slowing reaction time may increase the likelihood of a
correct answer. However, taking more time to complete the task was weakly correlated with lower
scores in the ASL 4 group. None of the correlations reached significance. The following table
summarizes each group’s Pearson’s correlation.
21

Table 2- 1 Benton Accuracy Vs Total Test Time Language Group Regression Equation R² Sig. (2-tailed)
Spanish y = 0.006x + 44.553 0.0245 .455
ASL 2 y = 0.0112x + 42.145 0.1335 .124
ASL 4 y = -0.0122x + 48.64 0.0986 .320
Proficiency level was also considered as a possible factor correlated with higher scores or
with total test time. For this analysis, one additional participant’s data was excluded in the
proficiency analysis because proficiency was not given. In the following figure, proficiency is
plotted against accuracy on the BFRT.
Figure 2- 4
Benton Accuracy Vs Proficiency by Group
34
38
42
46
50
54
2.00 3.00 4.00 5.00 6.00 7.00
Self-Rated Proficiency
Num
ber C
orre
ct (5
4) SpanishASL 2ASL 4Linear (Spanish)Linear (ASL 2)Linear (ASL 4)
This figure maps, by language group, the participants’ accuracy on the BFRT by self-rated
proficiency. The participants’ self-reported proficiency ranged from 2.25-6.5. Most scores were
between 40 and 50. Overall the Spanish group’s trend line is higher, i.e. at the same proficiency
rating, Spanish students generally had a higher accuracy. For example at the 3.5 and the 5.5 rating
levels, the participants in the Spanish classes at those levels had higher scores than the participants
in the ASL classes. The trend line for the ASL 2 participants is generally lower than the Spanish
22

group’s trend line but higher than the ASL 4 group’s trend line (except at proficiency levels above
5.0). The trend line representing the participants enrolled in Spanish is a slightly positively
correlated slope, i.e. an increase in self-rated proficiency correlates with an increase in accuracy on
the BFRT. The trend line representing the participants enrolled in ASL 4 also had a positively
correlated slope, but the trend line representing the participants enrolled in ASL 2 is nearly flat. No
distinct pattern emerged from the comparison. The following table summarizes each group’s
correlation of accuracy and self-reported proficiency.
Table 2- 2 Benton Accuracy Vs Proficiency Language Group Regression Equation R² Sig. (2-tailed)
Spanish y = 0.5699x + 43.921 0.0304 .404
ASL 2 y = -0.0882x + 45.691 0.0003 .942
ASL 4 y = 1.0811x + 40.032 0.1292 .251
The data do not indicate a difference in accuracy based on proficiency, but maybe the task
was completed more quickly by the participants who described themselves as more proficient. The
following Figure displays the participants’ total test time to complete the BFRT in seconds vs. the
participants’ self-rated proficiency level.
Figure 2- 5
Benton Total Test Time Vs Proficiency by Group
100
200
300
400
500
600
700
2.00 2.50 3.00 3.50 4.00 4.50 5.00 5.50 6.00 6.50 7.00
Sel-Rated Proficiency
Tota
l Tes
t Tim
e In
Sec
onds
Spanish
ASL 2
ASL 4
Linear (Spanish)
Linear (ASL 2)
Linear (ASL 4)
23

In this figure, the participants total test time was plotted against their self-rated proficiency levels.
The figure illustrates that participants at the same proficiency had a wide range of total test time.
For example, participants who rated themselves at 4.0 had, 198 seconds -674 seconds. Participants
at the 5.0 rating seemed to complete the test at more compact time frame (218 seconds- 340). All
three classes show a slight decrease in total test time with an increase in self-rated proficiency. The
trend lines show a possible relationship-an increase in speed with an increase in proficiency, with
approximately 60 seconds between the lowest proficiency participants and the highest. Referring
back to Figure 2-4 Benton Accuracy by Proficiency, participants generally did not sacrifice
accuracy for speed. Proficiency and total test time may be negatively correlated (i.e. with more
proficiency less time is needed to complete the task). But, again, it may be that people who think
they are proficient also confident to complete the task more quickly. However, the results do not
reach significance. The following table summarizes each group’s correlation of speed and self-
reported proficiency. Language group does not seem to affect the interaction between total test time
and proficiency.
Table 2- 3 Benton Total Test Time Vs Proficiency Language Group Regression Equation R² Sig. (2-tailed)
Spanish y = -22.777x + 400.12 0.0708 .199
ASL 2 y = -12.824x + 350.12 0.007 .741
ASL 4 y = -11.649x + 340.41 0.0226 .641
Overall, the first experiment did not yield significant results. I had predicted that
participants with 18 months signing experience (ASL 4) would have an increase in success because
ASL experience encourage more time focusing on faces, but no clear increase in accuracy or total
test time was found. Bettger et al. (1997) found that signers had significantly higher mean
percentage correct on the BFRT than the non-signers. Perhaps signing groups at this level of L2
experience (less than two years) do not differ from non-signing groups. Another possibility is that
24

the addition of a time limit on the first section of the test obscured a difference in reaction time, i.e.
without an imposed time limit, perhaps participants would have had varied total test times.
Reviewing previous BFRT research with ASL participants, the ASL L2 groups in the current study
did score between the non-signers and the native signers from the previous experiment, which is
expected. However, the non-signing group in the current experiment outscored the non-signing
group from the previous experiment, which is unexpected. Upon closer comparison, the previous
experiment tested community members (without mention of education level) and the current study
tested college students. It may be that college experience was a factor in the results.
2.3 MOONEY FACES CLOSURE TEST
2.3.1 MFCT Description
The Mooney Faces Closure Test2 (Mooney, 1956) requires participants to identify high
contrast pictures as a girl, a boy, a young woman, a young man, an old woman, or an old man. The
Mooney Faces Closure Test did not include a time constraint, but the participants were aware that
the test was being timed. The average total test time was under three minutes, but one participant
took over five minutes and another took over seven minutes to complete the MFCT. Thirty-five
stimuli were presented, and the six possible answers were offered with each stimulus. All six
answers were offered to limit guessing based on which choices were given for the stimulus.
McCullough and Emmorey (1997) only offered four possible answers for each test question. Since
the original photographs were not available to determine the correct answer, the correct answers
were chosen by consensus between the principal investigator and faculty advisor. If the test item
was ambiguous, two answers were accepted as correct. The stimuli were not evenly distributed
between the possible answers. So, although a chance score would be 1 out of 6 or 16.67%, a
participant who chose “adult man” for each test item would earn 37%, but no participant chose the 2 I thank Marianne Latinus for supplying the test stimuli.
25

same answer throughout the test. The thirty-five stimuli and accepted answers are listed in
Appendix C.
Figure 4 Sample test item from the Mooney Faces Closure Test. (This is an adult man.)
The participants are the same as the BFRT. The MFCT was conducted at the same time as the
BFRT. The MFCT always followed the BFRT.
2.3.2 MFCT Results and Discussion
I predicted that all participants (signers at both levels and non-signing controls) will perform
similarly on the MFCT because the signing experience will not be sufficient enough to cause an
over-reliance on individual facial features, which McClullough and Emmorey (1997) suggested
might have been a factor in the signing group scoring below the hearing group. The following
figure gives each group’s mean score.
Figure 2- 6
Mooney Faces Closure Test Accuracy
0
5
10
15
20
25
30
35
Spanish (n=26) ASL 2 (n=19) ASL 4 (n=15)
Num
ber C
orre
ct (3
5)
26

The three groups’ scores did not differ. The top score (from two participants) was 29 or
approximately 82% accuracy. The lowest score was 13 which equates to 37% accuracy. The mean
for all participants was 21.65 (nearly 62%), which nearly matches each groups’ mean score. The
participants taking Spanish as a foreign language had a mean of 21.65 (SD 3.47). The participants
enrolled in ASL 2 had a mean of 22.31 (SD 4.06) and the participants enrolled in ASL 4 had a mean
of 20.8 (SD 4.10) correct out of 35 test items. As the error bars illustrate, the difference in the
scores within a group is greater than the difference between groups and was not found to be
significant (F[2,57]= .656, p = .523). McCullough and Emmorey (1997) tested deaf ASL signers
and hearing non-signers with the same task, but with a slightly different procedure. In this previous
study, participants chose from only four choices, rather than six. Their results showed higher
accuracy percentages, with hearing subjects outscoring deaf signers (F[1, 46, 3.64]=3.64, p<.07).
All three language groups in the current experiment scored below both groups in the McCullough
and Emmorey experiment. Perhaps the increase in answer choices resulted in an increase in
difficulty in the current experiment. Regardless, the current experiment did not pattern with the
previous experiment. One explanation is that the ASL L2 language groups do not have an
“overreliance” on individual facial features that McCullough and Emmorey suggested might explain
the deaf participants’ poorer performance on this gestalt closure task.
Perhaps language experience has an effect on the speed in which the participants performed
this challenging test. This test had no time limit so the participants could take as much or as little
time as they needed to choose and answer and move to the next item. The following figure shows
the mean total test time for each group.
27

Figure 2- 7
Mooney Total Test Time
0
50
100
150
200
250
300
Spanish (n=26) ASL 2 (n=19) ASL 4 (n=15)
Tim
e in
Sec
onds
The participants in the Spanish group took, on average, 178 seconds (SD 66.78) to complete the 35
test items. The participants in the ASL 2 group took, on average, 140 seconds (SD 40.17) to
complete all of the test items. The participants in the ASL 4 group took, on average, 197 seconds
(SD 43.58) to complete the test. The difference between the fastest group, ASL 2 and the slowest
group, ASL 4 was 57 seconds. The one-way ANOVA test revealed significant difference based on
language group (F[2,57]=5.107, p = .009). A post-hoc analysis (Tukey’s HSD) revealed that the
Spanish group did not differ significantly from the ASL 2 group (p = .054) although the difference
approaches significance. The Spanish group did not differ significantly from the ASL 4 group (p =
.558). The ASL 2 group did differ from the ASL 4 group (p = .010). I predicted no difference
between the groups. It may be that signing experience helped the ASL 2 group complete the task
because signers have more experience looking at faces. However, the increased experience with
faces of the ASL 4 group may have acted as a hindrance in making a decision on the MFCT. This
group may have had the longest total test times because ASL 4 participants may have the most
experience with facial features processing and this task is more difficult when looking for individual
28

facial features as this faces closure test requires whole image processing. McCullough and
Emmorey (1997) did not report response times, even though their experiment also had no time limit.
Figure 2-8 plots accuracy and total test time for the three language groups.
Figure 2- 8
Mooney Test Accuracy Vs Total Test Time By Group
1012141618202224262830
50 100 150 200 250 300
Time in Seconds
Num
ber
Corr
ect (
35) Spanish
ASL 2ASL 4 Linear (Spanish)Linear (ASL 2)Linear (ASL 4 )
This scatter plot shows a cluster of scores between 15 and 28 in the time range of 100-250 seconds.
(I removed two outliers; a participant in the ASL 4 group took 302 seconds but only answered 17
items correctly and a participant in the Spanish group took 429 seconds with 17 correct items.) The
trend lines indicate that the groups may differ. Participants in the Spanish group showed no
interaction between accuracy and speed; that group scored approximately 22 regardless of how
much time was taken to complete the task. Interestingly, as the ASL 2 participants took more time
to complete the test, the accuracy decreased slightly. The following table shows the regression
equation for the groups.
Table 2- 4 Mooney Accuracy Vs Total Test Time
Language Group Regression Equation R² Sig. (2-tailed)
Spanish y = -0.0061x + 22.869 0.0062 .204
ASL 2 y = -0.0543x + 29.899 0.2875 .018
ASL 4 y = -0.0455x + 28.95 0.1811 .285
29

Although the results only reached significance for the ASL 2 group, the tendency does create
questions. Causation can not be known by correlation, but there are at least two suppositions to
consider. An increase in time might indicate that the participant was searching for individual facial
features, which is an unreliable strategy on this task, which, in turn, may decrease accuracy. It may
be that with more experience with face processing (as gained with experience with ASL because
grammar is encoded into facial expressions), the participants relied more facial features or tried to
see individual facial features, which were obscured by the high-contrast pictures. Another
possibility is that the participants may have had difficulty seeing any design in the stimuli which
explains the overall low accuracy for all of the participants (<62%) and the longer total test times
for participants who had below average accuracy.
Figure 2-9 plots accuracy and proficiency by language group. One datum was not included
in the MFCT analysis (likewise the other tests) because that participant did not report proficiency.
Following the previous analysis, the two data that exceeded five minutes were excluded from this
analysis and the remaining in this section.
30

Figure 2-9
Mooney Accuracy Vs Proficiency by Group
0
5
10
15
20
25
30
35
2.00 3.00 4.00 5.00 6.00
Self-Rated Proficiency
Num
ber C
orre
ct (3
5) SpanishASL 2ASL 4Linear (Spanish)Linear (ASL 2)Linear (ASL 4)
The Spanish group and the ASL 4 group have a slight negative correlation, indicating that with an
increase in self-rated proficiency, there is a decrease in accuracy on the MFCT. The ASL 2
group’s accuracy seems to positively correlate with an increase in self-rated proficiency, i.e. with
more proficiency the participant is more accurate. The ASL 2 and the SPAN groups’ correlation
approach statistical significance. The following table reports the correlation statistics.
Table 2- 5 Mooney Accuracy Vs Proficiency
Language Group Regression Equation R² p
Spanish y = -1.0951x + 26.549 0.1207 .065
ASL 2 y = 2.5588x + 11.956 0.2075 .057
ASL 4 y = -0.4408x + 23.197 0.0086 .540
Both the Spanish and ASL 4 groups’ accuracy seem to negatively correlate with self-rated
proficiency, i.e. with more proficiency, the participant is less accurate, but the results are not
significant and the ASL 4 correlation is extremely weak. In contrast, the ASL 2 group has a
positive correlation which almost reaches significance, i.e. participants who rated themselves as
more proficient scored higher on the MFRT. The cause of the trends is unclear.
31

Next, I compared the participants’ total test time against the proficiency ratings. The
following figure and table compare the total test time taken to complete the thirty-five test items
based on the same proficiency categories separated by language group.
Figure 2- 10
Mooney Total Test Time Vs Proficiency By Group
0
50
100
150
200
250
300
2.00 3.00 4.00 5.00 6.00
Self-rated Proficiency
Tim
e in
Sec
onds
SpanishASL 2ASL 4Linear (Spanish)Linear (ASL 2)Linear (ASL 4)
Table 2- 6 Mooney Total Test Time Vs Proficiency
Language Regression Equation R² Sig. (2-tailed)
Spanish y = -6.5422x + 196.53 0.0260 .981
ASL 2 y = -19.235x + 219.68 0.1265 .148
ASL 4 y = -12.324x + 248.49 0.1013 .982
The results are not significant. ASL 4 participants generally have the highest times. The trend line
corresponding to the ASL 4 group begins above the 200 second mark and decreases to
approximately 175 seconds as proficiency increases. The Spanish group has a mostly flat trend line
between 175 and 150 seconds, meaning that the participants total test time remained rather constant
regardless of proficiency level. The ASL 2 group’s trend line indicates that this group had the
shortest total test time, with a slight decrease in total test time with an increase in proficiency. The
32

Spanish trend line is consistent with the expert hindrance theory in that there was no correlation
with total test time and proficiency, but the ASL 4 trend line also shows no correlation.
In sum, the Mooney Faces Closure Test results did not show a difference in accuracy. This
was expected, considering McCullough and Emmorey (1997) found that signers were not more
accurate on this test; the hearing group had a higher mean than the deaf signing group. However, in
the current experiment, the groups did differ in total test time. The ASL 2 group completed the test
faster than the Spanish group (p = .054) and significantly faster than the ASL 4 group (p = .010). It
may be that looking more at faces helped the ASL 2 participants, but the ASL 4’s increased
experience with individual facial features began to hinder the decision process on this task. The
facial feature focus theory may be supported by the negative correlation between accuracy and total
test time for both ASL groups, even though only the ASL 2 group’s correlation reached significance
(p = .018). There was no clear indication of a facial feature focus when looking at accuracy and
proficiency ratings, which is plausible because language proficiency may not indicate decision
strategy. The facial feature focus explanation, proposed by McCullough and Emmorey (1997),
however, may be one explanation of the ASL 4’s longest test times when sorted by self-rated
proficiency.
2.4 COMPARISION OF FACE-PROCESSING TEST RESULTS
2.4.1 Introduction
It is not expected that the BFRT and the MFCT use the same skills, since the BFRT expect
the participant to recognize (match) faces based on individual facial features and the MFCT’s high
contrast test items obscure facial features, but it is unclear if these face-processing skills are
correlated.
33

2.4.2 Comparison Results and Discussion
I did not expect the scores on the two face-processing tests to be correlated because the two
tests require different strategies. The following Figure plots the accuracy of each participant on both
tests.
Figure 2-11
Benton Accuracy Vs Mooney Accuracy By Group
10
15
20
25
30
35
38 43 48 53
Number Correct on Benton (54)
Num
ber C
orre
ct o
n M
oone
y (3
5)
SpanishASL 2ASL 4Linear (Spanish)Linear (ASL 2)Linear (ASL 4)
Table 2- 7 Benton Accuracy Vs Mooney Accuracy by Group
Language Regression Equation R² Sig. (2-tailed)
Spanish y = 0.5966x – 6.0225 0.1976 .030
ASL 2 y = -0.163x + 29.77 0.0108 .669
ASL 4 y = -0.4622x + 41.707 0.0877 .350
The Spanish group’s data create the only positively correlated trend line, meaning that students who
answered more correctly on the Benton Facial Recognition Test also answered more correctly on
the Mooney Faces Closure Test. The correlation was statistically significant. The two ASL groups
have a slight negative correlation between tests, meaning that as the BFRT scores increases, the
MFCT scores decreases. Overall, the ASL correlations are not strong, which is expected since the
two tests seem to require different face processing skills. But the participants learning Spanish do
34

have a statistically significant correlation between the face-processing tasks. Since only the non-
signers showed this correlation, it may be that signing experience impacts performances on only one
of the tasks. If signing affects one of the two skills, but not the other, the ASL groups’ scores would
not show a correlation. With the current study and results, it is not possible to ascertain what skills
might be affected, but a possibility was found in Tanaka and Sengco (1997). They proposed that
the features and the configuration (the spatial distances between the features) are both used for
holistic face-processing. Facial features are best recognized when presented in the original
configuration and worst in isolation (Tanaka and Sengco). The Mooney test stimuli obscure this
configural information. Hence, it may be that the ASL groups use the configural information to
complete the BFRT, but that skill could not transfer to the MFRT.
35

3.0 SPATIAL RELATION TESTS
3.1. METHODOLOGY
I used the same methodology as described in section 2.1. The same participants took the face-
processing test described in Chapter 2 and the spatial relations test described here in Chapter 3.
3.2 MIRROR REVERSAL TEST
3.2.1 MR Description
The Mirror Reversal test3 was included to replicate the Emmorey, Kosslyn, and Bellugi’s
(1993) experiment with similar stimuli. Participants had to determine if the test items were the
same as the target stimuli or a mirror reversal of the target stimuli. The test items were rotated 0°,
45°, 90°, 135°, or 180°. The Mirror Reversal test included a two-minute time limit for all 50 test
items, following the researchers who designed the test. The directions included a “same” sample
test item and a “reversed” sample test item.
Figure 5 Sample test item for the Mirror Reversal test. (It is rotated 90° and mirror-reversed.)
The entire test is offered in Appendix D. Some participants completed all fifty items in the two
minutes, and some did not answer every item. Three participants (one participant from each of the
three language groups) scored below 60% and were excluded from analysis. Although chance
3 I thank Dr. Karen Emmorey for sharing this test.
36

would be 50%, I chose a higher limit because 51%, 56% and 57% are close to random and these
three scores are outliers from the rest of the data.4
3.2.2 MR Results and Discussion
I hypothesized that participants with 18 months exposure of ASL will show increased
success on both of the Mirror Reversal Test, but participants with 6 months exposure will perform
like control participants (non-signers) because they will not yet have mastery of the spatial aspects
of ASL grammar, which would improve performance on the spatial relations test. Second, the
scores on both of the visual-spatial of female participants will differ to a greater degree than the
scores of male participants; more ASL experience will positively correspond with accuracy on the
on the task for female participants; male participants generally will have higher scores which will
show smaller gains from of ASL exposure. The following figure illustrates the participants’ mean
accuracy, as determined by number correct.
Figure 3- 1
Mirror Reversal Accuracy
05
101520253035404550
Spanish (n=25) ASL 2 (n=18) ASL 4 (n=14)
Num
ber C
orre
ct (5
0)
4 In addition, four test items had zero rotation and were not reversed, i.e. exactly identical which means every participant should have answered these four test items correctly. The three excluded participants did not score even four items above chance.
37

The raw scores ranged from 13 (two participants) to 50 (seven participants). The participants in the
Spanish classes had a mean of 30.92 (standard deviation 11.38). The participants in the ASL 2
classes had a higher mean of 40.06 (SD 9.36). The participants in the ASL 4 classes had the highest
mean, 42.50 (SD 9.71). Language group was found as a significant factor for accuracy on the
Mirror Reversal task (F [2,54] = 6.996, p = .002). The post-hoc analysis (Tukey’s HSD) revealed
that the Spanish group differed from the ASL 2 group (p = .017) and from the ASL 4 group (p =
.004). The ASL 2 group and the ASL 4 group did not differ significantly (p = .787). I had
predicted that the ASL 4 group would differ from the SPAN and ASL 2 group because I thought the
ASL 2 group would not have had enough experience and success with the spatial aspect of ASL.
This experiment can not conclude causation, but an assumption can be made that if a improvement
is spatial relations skills are found with ASL experience, the improvement is found with limited
(about 6 months) ASL experience.
As a point of comparison, using similar test items, Emmorey, Kosslyn, and Bellugi (1993)
found deaf signers as accurate as hearing non-signers, but signers had significantly faster reaction
times. As mentioned above, the total test time was constant for each participant, and the number
attempted by each participant differed. In this experiment, the number of test items attempted is
related to reaction time because participants who had faster reaction times answered more test
items. The following figure compares the mean number attempted in each group.
38

Figure 3- 2
Mirror Reversal Test Items Attempted
05
101520253035404550
Spanish (n=25) ASL 2 (n=18) ASL 4 (n=14)
Num
ber A
ttem
pted
(50)
Again, the Spanish group had the lowest mean, 34.88 (SD 11.42). The ASL 2 group attempted
more items 44.06 (s.t. 7.70). The ASL 4 group had the highest mean number attempted 45.36 (SD
8.29). Overall, the scores ranged from 16 (one participant) to 50 (22 participants). Within the
language groups, the number attempted by participants in the Spanish group ranged from 16 (one
participant) to 50 (six participants). The test items attempted by ASL 2 participants ranged from 27
(one participant) to 50 (eight participants). The test items attempted by ASL 4 participants ranged
from 20 (one participant) to 50 (eight participants). Even though the Spanish group had more
participants (25) than either signing group (18 and 14), both signing groups had more participants
who answered all 50 test items in two minutes. As the raw accuracy, the language groups
difference in number attempted reached significance (F [2,54] = 7.225, p =.002). The Tukey’s HSD
analysis again found that the Spanish group differed from both the ASL 2 group (p = .009) and from
the ASL 4 group (p = .006). Similar to the MR raw score results, the ASL 2 and ASL 4 groups did
not differ in items attempted on the MR task (p = .924). As mentioned above, the number attempted
is comparable to reaction time because participants who had faster reaction times were able to
39

answer more test items in the two-minute time limit. In a similar experiment, deaf signers had
significantly faster response times than hearing participants (F [1, 64] = 4.16, p <.05) (Emmorey,
Kosslyn, and Bellugi, 1993). Therefore, both ASL L2 groups seem to pattern like deaf signers on
this task.
Since not all participants completed all of the test items, perhaps the participants’ accuracy
percentage considering number attempted by the participant is a better indicator of the participants’
success. A score based on the number correct/number attempted removes the factor of response
time. The following figure shows the mean accuracy percentage of the three language groups.
Figure 3- 3
Mirror Reversal Accuracy Percentage
0.60
0.65
0.70
0.75
0.80
0.85
0.90
0.95
1.00
Spanish (n=25) ASL 2 (n=18) ASL 4 (n=14)
Num
ber
Corr
ect/N
umbe
r Atte
mpt
ed
Overall, the scores ranged from 63% (one participant) to 100% (ten participants). With a mean of
88% accuracy (SD 10%), the Spanish group had the lowest accuracy percentage. This group scores
ranged from 75% (one participant) to 100% (four participants). The ASL 2 group had a mean
percentage of 90% (SD10%), with a range from 63% (one participant) to 100% (three participants).
The ASL 4 group had the highest mean, 92% (SD 10%) with a range of 65% (one participant) to
100% (three participants). As Figure 3-2 Mirror Reversal Test Items Attempted shows, the signing
participants attempted more items. As Figure 3-3 Mirror Reversal Accuracy Percentage shows, the
40

signing students answered better than or at least as well as non-signing participants. Thus, the
signing participants did not seem to sacrifice accuracy to complete the test in the two minute time
limit. Again, the tendency is that participants with more signing experience seem to be more
successful, in raw score, number attempted in two minutes, and in accuracy percentage, but
language was not found to be a significant factor (F [2, 54] = 1.081, p = .346).
It is expected that participants who attempted more test items would have more test items
correct because, of course, the number correct is limited to no more than the number attempted.
However, percentage is not limited to the number of attempted test items. A participant could
answer few items but still score 100%. The following figure show the participants’ success on the
Mirror Reversal task by plotting the percentage correct (raw number correct/number attempted) to
the number attempted by language group.
Figure 3- 4
Mirror Reversal Accuracy Percentage Vs Number Attempted By Group
0.60
0.70
0.80
0.90
1.00
10 20 30 40 50
Number of Test Items Attempted
Perc
enta
ge C
orre
ct Spanish
ASL 2ASL 4Linear (Spanish)Linear (ASL 2)Linear (ASL 4)
The figure illustrates that several Spanish participants attempted less than thirty test items. The
bulk of the Spanish participants attempted less than forty test items. Only eight of the twenty-five
(32%) participants in the Spanish classes attempted over forty test items in the time allotted. The
ASL2 group shows slightly more diffusion, but with a cluster of participants attempted over forty
41
test items. Eight of the eighteen (44%) ASL 2 participants attempted all fifty test items. Other than
a single outlier, the ASL 4 group cluster toward the top of the figure, over forty attempted and at or
above 90% accuracy. Eight out of the fourteen ASL 4 (57%) participants attempted all fifty test
items within the two-minute time limit. The trend lines all suggest that participants who attempted
more items tended to have a higher percentage correct. (In contrast, it might have been expected
that participants answering fewer items may have answered those items with more accurately.) The
tendency for the faster participants being more accurate seems to increase with signing experience,
and the ASL 4 group’s correlation was significant. The following table details the correlation.
Table 3- 1 Mirror Reversal Accuracy Percentage Vs Number Attempted
Language Regression Equation R² Sig. (2-tailed)
Spanish y = 0.0019x + 0.8124 0.0573 .239
ASL 2 y = 0.0045x + 0.707 0.1190 .158
ASL 4 y = 0.0087x + 0.5315 0.5597 .002
Raw accuracy, number of test items completed, and accuracy percentage all point to an increased
success correlated with an increase in signing experience.
As with the previous experiments, I also compared the participants’ results with their self-
rated proficiency. The following figure shows the raw score accuracy plotted against proficiency.
42

Figure 3- 5
Mirror Reversal Raw Accuracy Vs Proficiency By Group
10
20
30
40
50
2.00 3.00 4.00 5.00 6.00 7.00
Self-rated Proficiency
Num
ber C
orre
ct (5
0) SpanishASL 2ASL 4Linear (Spanish)Linear (ASL 2)Linear (ASL 4)
Table 3- 2 Mirror Reversal Raw Accuracy Vs Proficiency by Group
Language Regression Equation R² Sig. (2-tailed)
Spanish y = -1.1399x + 35.856 0.0120 .603
ASL 2 y = 5.5529x + 17.535 0.1953 .066
ASL 4 y = -2.4733x + 54.513 0.0535 .426
Only the ASL 2 group shows an increase in raw accuracy with an increase in self-rated proficiency.
The Spanish group showed almost no relationship but there is a slight decline in raw number correct
with an increase in proficiency, and the ASL 4 group also has a decrease in raw number correct with
an increase in proficiency. MR raw score and self-rated proficiency was not significantly
correlated. In order to consider the difference in reaction time shown in Figure 3-2 Mirror Reversal
Test Items Attempted, I also plotted the number of test items attempted against the self-rated
proficiency by language group; no correlation was significant (p>.05). The Spanish group shows no
relation between the number of completed test items and self-rated proficiency, which may be
expected because Spanish ability would not seem to be related to speed during a mirror reversal
task. It is unclear why the ASL 2 group has a trend toward an increase in the number of test items
43

attempted with an increase in proficiency. (When the accuracy percentage is plotted against
proficiency, the trend lines for each language group are recreated, but the correlations are not
significant.) Since it may be expected that an increase in proficiency would be correlated with an
increase in accuracy or that no relationship exists between mirror reversal accuracy and self-rated
language proficiency, it is unexpected that the ASL group has a positive correlation, although the
trend did not reach significance. Since all other measures of success on the mirror reversal task
indicates that signing experience and success are positively correlated, it is unexpected and
unexplained why ASL 4 does not have a positive correlation. One possible explanation is that some
participants over-estimate their proficiency. Perhaps the validity of the self-rating proficiency
scores should be questioned. Since the correlations are not statistically significant, the pattern
might be random.
3.2.3 MR Results and Discussion - Females
Since previous studies have considered gender as a factor on spatial relations tasks (but not
face-processing tasks), I separated the participants by gender. It was extremely difficult to get more
males to participant because of the lack of males enrolled in ASL 2 and ASL 4 at the University of
Pittsburgh. There were too few males in the experiments (Spanish n=8, ASL 2 n= 3, ASL 4 n= 4)
to fully analyze the males as a group. I did analyze the females in the three language groups. The
following figure shows the raw scores on the MR task for the female participants only.
44

Figure 3- 6
Mirror Reversal Raw Accuracy -Females
0
10
20
30
40
50
Spanish (n=17) ASL 2 (n=15) ASL 4 (n=10)
Num
ber
Corr
ect (
50)
As with the mixed gender population, Spanish participants, with a mean of 30.8 (SD 11.8) had the
lowest scores on the MR test. Female ASL 2 participants with a mean of 40.5 (SD 8.9) scored
similarly to female ASL 4 participants who had a mean of 40.3 (SD 10.8) Language was a
significant factor on the MR raw score (F[2, 39] = 4.530, p = .017). As expected, a post-hoc
analysis (Tukey’s HSD) showed that the ASL 2 and ASL 4 groups did not differ (p = .980), but the
Spanish group did differ from the ASL 2 group (p = .024). The difference between the female
Spanish group and the female ASL 4 group did not reach (p<.05) significance on this measure (p =
.075), but the difference did reach (p < .10) which can be justified with the decrease of ASL 4’s in
sample size. As described above, the number of attempted test items is similar to reaction time
because the test had a set time limit. Participants who made quicker decisions would be able to
view and answer more test items. The following Figure compares the number of test items
attempted for the female participants.
45

Figure 3- 7
Mirror Reversal Test Items Attempted - Females
0
10
20
30
40
50
60
Spanish (n=17) ASL 2 (n=15) ASL 4 (n=10)
MR
Atte
mpt
ed T
est I
tem
s in
Tw
o M
inut
es (5
0)
As with Figure 3-6 Mirror Reversal Raw Accuracy-Females, the ASL 2 and ASL 4 groups had
similar means on the number of test items attempted, 44.3 (SD 8.0) and 43.5 (SD 9.3), and the
Spanish group had a lower mean score, 35.4 (SD 11.4). The difference was significant (F [2, 39] =
3.839, p = .030). The post hoc analysis (Tukey’s HSD) found that the female Spanish group
differed significantly from the female ASL 2 group (p = .039). The Spanish and ASL 4 groups’
difference did not reach significance, but considering the smaller sample size of the female groups,
it nearly reaches p<.10 significance (p = .111). Of course, the ASL 2 group did not differ from the
ASL 4 group (p = .980).
I also compared the groups without penalty for slow reaction times. The following figure
shows the accuracy of the female participants in percentage of the number of test items attempted.
46

Figure 3- 8
Mirror Reversal Accuracy Percentage - Females
0.60
0.65
0.70
0.75
0.80
0.85
0.90
0.95
1.00
Spanish (n=17) ASL 2 (n=15) ASL 4 (n=10)Num
ber C
orre
ct/N
umbe
r Atte
mpt
ed
Similar to the entire populations, the Spanish group had the lowest accuracy percentage, 87% (SD
10%). ASL 2 and ASL 4 had higher scores than the Spanish group, 92% (SD 7%) and 91% (SD
10%) respectfully. As with the mixed gender population, language group was not a statistically
significant factor when using MR accuracy percentage (F [2, 39] = 2.396, p = .104).5
In sum, signing experience was correlated with more success on the mirror reversal task,
whether success is measured by raw number correct, number attempted (reaction time), or accuracy
percentage (raw number correct/number attempted). Raw accuracy and test items completed in the
two minutes time limit showed significant results by language (p= .002). Both ASL L2 groups
outperformed the Spanish group in raw accuracy (p< .01) and number attempted (p < .02). The
same pattern existed in the female population analysis.
3.2.4 MR Test Item Analysis
Since results on the MR test were promising, I also reviewed accuracy for individual test
items. I expected a negative correlation between rotation and accuracy, i.e. test items that were
5 As a point of comparison, the males had means of 93% (SD 6%) for the Spanish group (n=8), 80% (SD 16%) for the ASL 2 group (n=3), and 98% (SD 2%) for the ASL 4 group (n=3).
47
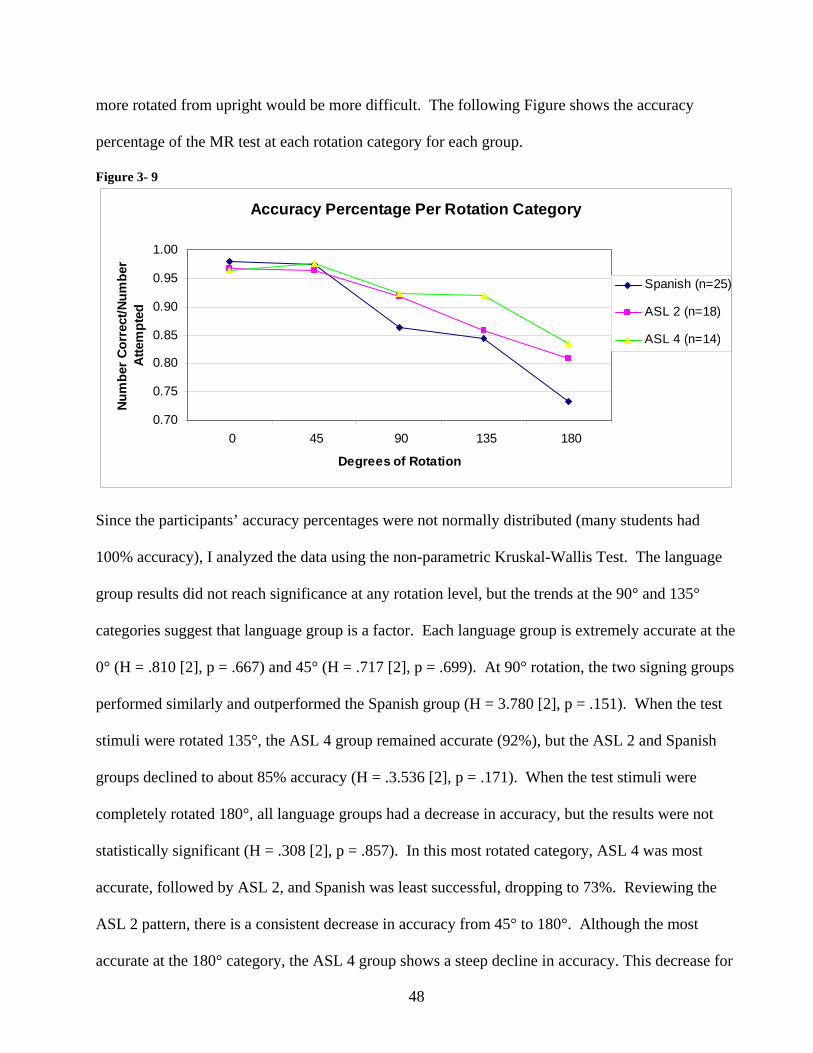
more rotated from upright would be more difficult. The following Figure shows the accuracy
percentage of the MR test at each rotation category for each group.
Figure 3- 9
Accuracy Percentage Per Rotation Category
0.70
0.75
0.80
0.85
0.90
0.95
1.00
0 45 90 135 180
Degrees of Rotation
Num
ber C
orre
ct/N
umbe
r A
ttem
pted
Spanish (n=25)
ASL 2 (n=18)
ASL 4 (n=14)
Since the participants’ accuracy percentages were not normally distributed (many students had
100% accuracy), I analyzed the data using the non-parametric Kruskal-Wallis Test. The language
group results did not reach significance at any rotation level, but the trends at the 90° and 135°
categories suggest that language group is a factor. Each language group is extremely accurate at the
0° (H = .810 [2], p = .667) and 45° (H = .717 [2], p = .699). At 90° rotation, the two signing groups
performed similarly and outperformed the Spanish group (H = 3.780 [2], p = .151). When the test
stimuli were rotated 135°, the ASL 4 group remained accurate (92%), but the ASL 2 and Spanish
groups declined to about 85% accuracy (H = .3.536 [2], p = .171). When the test stimuli were
completely rotated 180°, all language groups had a decrease in accuracy, but the results were not
statistically significant (H = .308 [2], p = .857). In this most rotated category, ASL 4 was most
accurate, followed by ASL 2, and Spanish was least successful, dropping to 73%. Reviewing the
ASL 2 pattern, there is a consistent decrease in accuracy from 45° to 180°. Although the most
accurate at the 180° category, the ASL 4 group shows a steep decline in accuracy. This decrease for
48

the ASL 4 group is somewhat misleading in that the last five test items had two 180° reversals, the
most difficult category. Since more ASL 4 participants completed all fifty test items, they had a
higher number of errors which many of the SPAN group did not attempt. If every participant
finished all fifty test items, I would expect the means to be lower at the 180° category, and the
Spanish group’s mean would separate farther from the signing groups.
Previous studies with a similar test design compared deaf native signers, hearing native
signers, and hearing non-signers (Emmorey et al., 1993). The accuracy percentage by rotation
category in the current study patterns with the results from the Emmorey et al. study6. Most
noteworthy is that the ASL 4 group is most similar to the deaf native signers. The deaf native
signers had slightly higher accuracy, noticeably at 180° rotation. The results of the Emmorey et al.
study also indicated that signers and non-signers rotated the test items at a similar speed, which
suggested to the authors that signers did not have an increase in mental rotation skills, but only in
mirror reversal judgments. However, Hamm et al. (2004) concluded that mirror reversal detection
and mental rotation skills are separate but related skills because their results found that neither rate
of rotation nor mirror detection were correlated to general processing speed as measured by upright
“same” stimuli decision times. The current data may indicate that signing experience has an effect
on both mental rotation task and mirror reversal detection task.
The mirror reversals and normal presentation test items were combined for each rotation
category in the previous figures. The mirror-reversal of test items might have been more or less
difficult when rotation increased. The following figure and table offers the accuracy percentage by
rotation category by normal or reversed presentation.
6 The previous research description did not include the 45° rotation category.
49

Figure 3- 10
MR Accuracy by Rotation and Reversal Category
0.65
0.70
0.75
0.80
0.85
0.90
0.95
1.00sa
me
reve
rsed
sam
e
reve
rsed
sam
e
reve
rsed
sam
e
reve
rsed
sam
e
reve
rsed
0° 45° 90° 135° 180°
Num
ber C
orre
ct/N
umbe
r Att
empt
ed
SpanishASL 2ASL 4
Table 3- 3 MR Accuracy by Rotation and Reversal Category
0° 45° 90° 135° 180°
same reversed same reversed same reversed same Reversed same reversed
Spanish 1.00 .96 1.00 .96 .92 .81 .86 .83 .79 .66
ASL 2 .96 .98 .96 .96 .96 .88 .92 .80 .81 .81
ASL 4 1.00 .93 1.00 .96 1.00 .85 .95 .88 .90 .76
The ASL 4 group generally is more successful in both presentations at all rotations, with the
exceptions of the 90° and the 180° reversed conditions, in which the ASL 2 group minimally
outscores ASL 4. The ASL 4 group had higher accuracy in the more rotated 180° same condition
(90%) than in the less rotated 90° reversed condition (85%) and 135° reversed condition (88%).
This finding might indicate that determining mirror reversal is a more difficult task than mental
rotation. Another possible explanation is the when mirror reversal and rotation are both present, the
task is more challenging.
50

I compared each groups’ accuracy within each rotation category, i.e. the accuracy of the
same test items was compared to the accuracy of the reversed test items in each rotation category.
Since many participants scored 100% in each category, the results were not normally distributed.
Therefore, I used the non-parametric Wilcoxon Signed Ranks Test, which allows for skewed
distribution, to test if the accuracy for reversals is significantly different from the accuracy for the
“same”s within each rotation category. At the 0° rotation, none of the language groups had
different accuracy between the test items which were the same orientation and the test items which
were reversed (SPAN Z=-1.633, p = 0.102; ASL 2 Z=.000, p = 1.000; ASL 4 Z=-1.633, p = 0.102).
Likewise, each language groups’ accuracy was not significantly different in the 45° rotation
category (SPAN Z=-1.633, p = 0.102); ASL 2 Z=-.368, p = 0.713; ASL 4 Z=-1.342, p = 0.108).
The Spanish participants had lower accuracy percentage beginning at the 90° rotation. All
three language groups decline in accuracy at the 90° and reversed condition. In the 90° category,
the SPAN group’s accuracy (Z=-1801, p = .072)7 and the ASL 4 group’s accuracy (Z=-2.032, p =
.042) were significantly different in the same and reversed conditions. In each case with a
significant difference, the language group had a lower accuracy percentage with the reversals in the
rotation category. The ASL 2 group did not show a difference in accuracy at this rotation category
(Z=-1234, p = .217).
All three groups increase accuracy when the test items are at normal presentation but have
the increase rotation to 135°. However, the Spanish group has the lowest mean, 86%. The means
for each language group decreased at 135°. The Wilcoxon tests revealed that the Spanish group’s
difference was not significant, indicating that at 135° rotation, the “same” were equally difficult as
the reversals (Z=-386, p = .700). Both ASL groups were significantly more accurate with test items
that were not reversed. The ASL 2 group dropped from 92% to 80% which is statistically 7 For the Wilcoxon Signed Ranks Test, significance is adjusted to p = < .10 for the small sample sizes in these with-in group analysis.
51

significant (Z=-1.807, p = 0.071). The ASL 4 group dropped somewhat less dramatically, but still
significantly, from 95% to 88% (Z=-1841, p = 0.066).
In the most rotated 180° category, the SPAN and the ASL 4 groups differed in accuracy
between the same presentation and the reversals. The Spanish group’s mean dropped from 79% to
66% (Z=-1.868, p = .062) and the ASL 4 group’s mean dropped from 90% to 76% (Z=-1.854, p =
.064). The same-reversal comparison revealed no difference for the ASL 2 group (Z=-.562, p =
.574). The following table summarizes the Wilcoxon results, comparing accuracy of the normally
presented test items and the mirror reversed test items. In each case with a significant difference, the
language group had a lower accuracy percentage with the reversals in the rotation category.
Significant (p< .10) findings are bolded.
Table 3- 4 Wilcoxon Test Results 0° 45° 90° 135° 180°
Spanish p = .102 p = .102 p = .072 p = .700 p = .062
ASL 2 p = 1.00 p = .713 p = .217 p = .071 p = .574
ASL 4 p = .102 p = .108 p = .042 p = .066 p = .064
The Wilcoxon Signed Ranks test results illustrate that the differences in accuracy were not
consistently significant, even within language groups. The Spanish group had significantly
different accuracy for non-reversed items rotated 90° and 180°, but this group found reversed test
items rotated 135° equally as difficult as non-reversed items (only 83% and 86% accuracy). In
contrast, the ASL 2 group only had a significant difference between the reversed and “same” test
items in the 135° category. The ASL 4 group had significantly better accuracy for non-reversed test
items at 90°, 135°, and 180°. Overall, the results indicate that the combination of rotation and
reversal affects accuracy. In order to see the participants accuracy by rotation category only, the
following figures maps the accuracy of the three groups for normal presentation test items (Figure
3-11) and for mirror reversed test items (Figure 3-12).
52

Figure 3- 11
MR Accuracy Percentage of Rotation Category -SAME
0.65
0.70
0.75
0.80
0.85
0.90
0.95
1.00
0° 45° 90° 135° 180°
Rotation Category
Num
ber C
orre
ct/N
umbe
r A
ttem
pted Spanish
ASL 2ASL 4
As mentioned above, the Spanish participants have a decrease in accuracy at a lesser degree of
rotation (90°) than the signing participants. The difference did not reach significance (H = 3.539
[2], p = .170), but the trend indicates that language group may be a factor. Again, the ASL2 and
ASL4 have similar accuracy with normally presented test items which were rotated 135°, with
SPAN have lower accuracy (H = 3.856 [2], p = .145) This difference in accuracy approaches
significance. At 180° rotation, all groups see a decrease in accuracy and the Kruskal-Wallis test
indicates that there is not a statistical difference between the groups (H = 1.077 [2], p = .584).
The effect of rotation is rather uniform. The Spanish group’s rate of decline is nearly
constant, beginning at 100% accuracy and dropping approximately 7% with each rotation. The
ASL 4 group’s rate of decline also seems constant, yet it began at 100% accuracy at 90°, dropping
approximately 5% with each rotation. The ASL 2 group’s rate of decline begins at 90°, drops only
5% at 135° and 11% at 180° rotation. The three groups all decreased in accuracy with rotation, with
the Spanish group being challenged with less rotation. The following Figure show illustrates the
effect of mirror reversal presentation at each rotation category.
53

Figure 3- 12
MR Accuracy Percentage by Rotation Category -REVERSED
0.65
0.70
0.75
0.80
0.85
0.90
0.95
1.00
0° 45° 90° 135° 180°
Rotation Category
Num
ber C
orre
ct/N
umbe
r A
ttem
pted Spanish
ASL 2 ASL 4
The overall pattern indicates the mirror reversal does not affect accuracy consistently with increased
rotation, as was indicated in Figure 3-12 MR Accuracy Percentage by Rotation Category-SAME.
All three language groups were equally accurate at 45° of rotation (H = .226 [2], p = .893). With
mirror-reversed test items with 90° rotation, all three groups decrease in accuracy, and no
significance difference is found (H = 2.088 [2], p = .352). However, with mirrored-reversed test
items rotated 135°, the Spanish and ASL 4 accuracy rebounds, but the ASL 2 continues to decrease.
The three groups’ accuracy in this category, however, does not differ statistically (H = 1.631 [2], p
= .442). The ASL 2 group’s accuracy is maintained at 180°, but the Spanish and ASL 4 groups
decrease in accuracy by 17% and 12%, respectfully. Nevertheless, the accuracy between the groups
is not statistically different (H = 1.332 [2], p = .514.
It is unclear why the ASL2 group seemed to respond differently at the 135° and 180°
rotation category. A possible explanation is that members of that group used a different strategy for
test items which were near 180° of rotation. Murray (1997) designed an experiment to test the
strategies of mentally rotating or mentally flipping. She found that participants instructed to
54

mentally “flip” the test figure out of the picture plane were faster than when “spinning” the test
figures to upright orientation, and the difference was even greater with mirror reversed test items. In
a related experiment, Murray showed that “flippers” are faster at 180° than at 120° or 240°, but
“spinners” are the slowest at 180°. It is unclear if ASL 2 participants used a mental flip to answer
more accurately at 180° rotation, and if so, it is unclear why that group might use a different
strategy.
In sum, the three language groups had lower accuracy rates at higher rotations. Generally,
ASL 4 was more accurate at each rotation category, and Spanish was the least accurate at each
rotation category. The performance of the ASL 4 group matched the native signers from previous
research. Test items that were mirror-reversed tended to be more difficult than test items with
normal presentation. Language group was not found to be statistically significant for any specific
reversal and rotation category, but the trends indicate that language group may be a factor. Reversal
and rotation did not consistently decrease the three groups’ accuracy. Whereas, rotation seemed to
uniformly lower accuracy for each language group, mirror reversal did not seem to be equally
difficult. These results may indicate that the ASL groups have an increased skill with the mirror
reversal task over the non-signing Spanish participants because the signing groups have higher
accuracy of the mirror reversed test items overall. Emmorey et al. (1993) conclude that signing
participants are better able to evaluate mirror reversals, and these results support their argument.
The results illustrated in Figure 3-13 and the results of the Wilcoxon Signed Ranks Tests, however,
do not indicate that mirror reversal is equally challenging at every rotation category. Hamm,
Johnson, and Corballis (2004) studied processing time for mirror detection of rotated objects and
concluded that mirror reversal stimuli seem to be “flipped” to normal presentation after being
mentally rotated. They propose that mental rotation and mirror detection skills are correlated, yet
separate skills, not related to general processing speed. Therefore, it is possible that signing
55

experience affects both mirror reversal detection and mental rotation skills, which may account for
the different patterns for the mirror reversed and normal presentation test items and the overall
better accuracy (and speed) of the ASL groups.
Some previous research has questioned if a third decision, rotational uncertainty, may also
be a factor in reaction time (Ilan and Miller, 1994; Jansen-Osmann and Heil, 2007). A rotational
uncertainty, which participants take extra time for upright stimuli in experiments with some rotated
stimuli than for upright stimuli in experiments with no rotated stimuli, might also be a factor in
accuracy at different rotation categories.
3.3 SPACE RELATIONS TEST
3.3.1 SR Test Description
I purchased the commercially available Differential Abilities Test-Spatial Relations from
The Psychological Corporation. Often given as part of a standardized intelligence test, the
Differential Aptitude Test’s Spatial Relations subtest requires participants to mentally fold two-
dimensional geometric figures into three-dimensional figures. The answer choices include similar
figures which may be rotated. The Space Relation Test had a fifteen minute time limit, as required
by the Directions for Administration and Scoring. The standardized directions include a sample test
item and an explanation of why the distracter choices are incorrect and why the correct answer is
the only possible correct choice.
Figure 6 Sample test item from the space relations test. (The correct answer is choice C.)
56

The test was administered as recommended, with the sole alteration of computerization of the test.
One excluded ASL 4 participant scored 8/35, which is below random, since participants chose
between four possible answers for each question.
3.3.2 SR Results and Discussion
I hypothesized that participants with 18 months exposure of ASL will show increased
success on both of the Space Relations test, but participants with 6 months exposure will perform
like control participants (non-signers) because they will not yet have mastery of the spatial aspects
of ASL grammar, which would improve performance on the spatial relations test. Second, the
scores on both of the visual-spatial of female participants will differ to a greater degree than the
scores of male participants; more ASL experience will positively correspond with accuracy on the
on the task for female participants; male participants generally will have higher scores which will
show smaller gains from of ASL exposure. The following Figure shows the means and standard
deviations of the three groups.
Figure 3- 13
Space Relations Accuracy
0
5
10
15
20
25
30
35
Spanish (n=25) ASL 2 (n=18) ASL 4 (n=13)
Num
ber C
orre
ct (3
5)
57

The top score on this test is 35. Four participants scored all 35 questions correctly. The lowest
score (two participants) was 17. The Spanish group’s mean is 27.92 (SD 5.27). The ASL 2 group’s
mean is 28.44 (SD 5.70), and the ASL 4 group’s mean is 28.92 (SD 5.48). The three language
groups show no significant difference (F [2, 53] = .151, p = .860). Rounded to the nearest whole
number, all three groups’ means are in the 6th stanine norm for combined sex groups according to
the technical manual of the DAT. Only one participant did not complete the thirty-five test items in
the fifteen minute time limit. That participant answered thirty-four items, so there was no
noticeable difference when using percentage correct to measure accuracy. The rest of the analysis
will be with raw scores except when comparing accuracy percentage between the two spatial
relations tests.
As with the other experiments, accuracy on this space relations task was plotted against the
participants’ self-reported proficiency. The following figure shows the participants’ raw accuracy
against proficiency.
Figure 3- 14
Space Relations Accuracy Vs Proficiency
15
20
25
30
35
2.00 3.00 4.00 5.00 6.00 7.00
Self-rated Proficiency
Num
ber C
orre
ct (3
5) SpanishASL 2ASL 4Linear (Spanish)Linear (ASL 2)Linear (ASL 4)
58
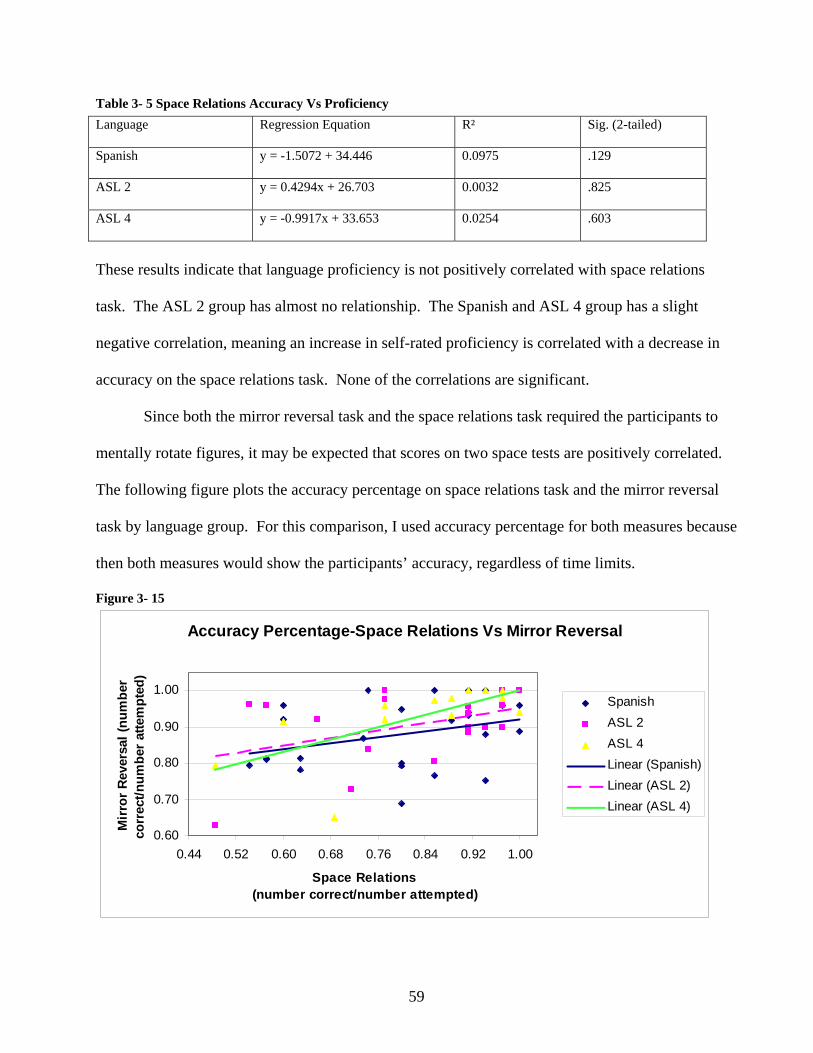
Table 3- 5 Space Relations Accuracy Vs Proficiency
Language Regression Equation R² Sig. (2-tailed)
Spanish y = -1.5072 + 34.446 0.0975 .129
ASL 2 y = 0.4294x + 26.703 0.0032 .825
ASL 4 y = -0.9917x + 33.653 0.0254 .603
These results indicate that language proficiency is not positively correlated with space relations
task. The ASL 2 group has almost no relationship. The Spanish and ASL 4 group has a slight
negative correlation, meaning an increase in self-rated proficiency is correlated with a decrease in
accuracy on the space relations task. None of the correlations are significant.
Since both the mirror reversal task and the space relations task required the participants to
mentally rotate figures, it may be expected that scores on two space tests are positively correlated.
The following figure plots the accuracy percentage on space relations task and the mirror reversal
task by language group. For this comparison, I used accuracy percentage for both measures because
then both measures would show the participants’ accuracy, regardless of time limits.
Figure 3- 15
Accuracy Percentage-Space Relations Vs Mirror Reversal
0.60
0.70
0.80
0.90
1.00
0.44 0.52 0.60 0.68 0.76 0.84 0.92 1.00
Space Relations (number correct/number attempted)
Mir
ror
Reve
rsal
(num
ber
corr
ect/n
umbe
r at
tem
pted
)
SpanishASL 2ASL 4Linear (Spanish)Linear (ASL 2)Linear (ASL 4)
59

Table 3- 6 Accuracy Percentage-Space Relations Vs Mirror Reversal
Language Regression Equation R² Sig. (2-tailed)
Spanish y = 0.2046 + 0.7161 0.1118 .097
ASL 2 y = 0.2585x + 0.6934 0.1787 .078
ASL 4 y = 0.426x + 0.5747 0.448 .065
As expected, all three groups show a positive correlation between accuracy percentage on the Space
Relations task and accuracy percentage on the Mirror Reversal task. Participants who are more
successful on the SR task tend to be more successful on the MR task, but none of the correlations
reached significance. But the trends indicate that the two skills may have at least one underlying
skill. It is also interesting to note that the correlation is closer to significance with an increase in
ASL experience. Perhaps an ASL L2 group with more experience would have a significant
correlation.
Figure 3-15 shows that the two spatial relations tasks are positively correlated for all three
language groups, if the students are judged only on the percent correct, which does not penalize
participants for being slow to complete the task. The following figure plots the accuracy in raw
score on space relations task and the mirror reversal task by language group. By using the raw
score, the comparison includes the factor of the time constraint.
60

Figure 3- 16
Raw Accuracy -Space Relations Vs Mirror Reversal
101520253035404550
15 20 25 30 35
Space Relation (number correct)
Mir
ror
Reve
rsal
(num
ber
corr
ect)
SpanishASL 2ASL 4Linear (Spanish)Linear (ASL 2)Linear (ASL 4)
Table 3- 7 Raw Accuracy – Space Relations Vs Mirror Reversal
Language Regression Equation R² Sig. (2-tailed)
Spanish y = 0.165 + 26.314 0.0058 .717
ASL 2 y = 0.6508x + 21.543 0.157 .104
ASL 4 y = 0.954x + 14.716 0.02695 .296
When considering the increased difficulty introduced with the two minute time constraint, the two
ASL groups maintain the positive correlation, but the Spanish group’s Space Relation and Mirror
Reversal scores show much less correlation. No groups’ correlation reached significance. But the
trend suggests that the non-signing Spanish group has less relationship between the two scores. For
the Spanish group, doing well on the SR task did not predict begin able to correctly answer many
more MR test items. Referring to the Spanish group’s trend line on Figure 3-16, an increase of only
three more mirror reverse test item correct would be expected with an increase of nearly fifteen
more space relations test items correct. Being able to solve the space relations test items does not
necessarily facilitate being able to make quick and accurate decisions about the mirror reversal test
61

items for the Spanish participants. The two signing groups showed a trend toward a positive
correlation between the SR and the MR raw scores. Perhaps signing strengthens a skill needed for
both tasks, but the participants in the current study have not had enough signing experience for the
correlations to reach significance.
3.3.3 SR Results - Females
Although the groups scores did not differ significantly, I also hypothesized that ASL
experience might serve as training for space relation tasks for females. The following figure
compares female participants from the Spanish class to female participants from ASL classes.
Figure 3- 17
Space Relations Accuracy - Females
0
5
10
15
20
25
30
35
Spanish (n=17) ASL 2 (n=15) ASL 4 (n=10)
Num
ber C
orre
ct (3
5)
The total range of scores is 17 (one participant) to 35 (three participants). One participant in each
language group had a perfect score on the Spatial Relations test. The females in the Spanish
classes had the lowest mean of 26.53 (SD 5.06). The female participants in the ASL 2 classes had
the highest mean of 29.67 (SD 4.82). The female participants in the ASL 4 classes had a mean of
62

28.1 (SD 5.76). Although the means excluding the males8 did not change dramatically, and
although the differences between the groups was not statistically significant (F[2, 39]= 1.480, p =
.260), it is noteworthy that the Spanish groups mean decreased from 27.92 to 26.53 when males
were excluded. The ASL 4 group’s mean dropped less than one point when the males were
excluded. Given that the gap between the Spanish and ASL scores for both spatial relations tests
widened in the female population, it may be that signing experience does serve as some form of
spatial relations training which has been shown more helpful to females than to males while in
childhood (Connor, Serbin, and Schackman, 1977) and while in college (Burnett and Lane, 1980).
Since the results of the Space Relations task indicates that females might be more affected
by the possible spatial relation training of ASL, I questioned if the female population within the
language groups would have a different correlation between the two spatial relation tasks. The
following figure is again a comparison of Accuracy Percentage of the Space Relation test to the
Mirror Reversal test, but Figure 3-18 only compares the female participants.
Figure 3- 18
Accuracy Percentage -Space Relations Vs Mirror Reversals - Females
0.60
0.70
0.80
0.90
1.00
0.45 0.55 0.65 0.75 0.85 0.95 1.05
Space Relations (number correct/number attempted)
Mirr
or R
ever
sal (
num
ber
corr
ect/n
umbe
r at
tem
pted
)
SpanishASL 2ASL 4Linear (Spanish)Linear (ASL 2)Linear (ASL 4)
8 As a point of comparison, the males had the following means: Spanish 30.88 (4.67), ASL 2 22.33 (6.81), ASL 4 31.67 (4.04).
63

Table 3- 8 Accuracy Percentage Space Relations Vs Mirror Reversals – Females
Language Regression Equation R² Sig. (2-tailed)
Spanish y = 0.1013x + 0.7812 0.0229 .554
ASL 2 y = 0.1256x + 0.8182 0.0572 .363
ASL 4 y = 0.4312x + 0.5646 0.4222 .045
Comparing Figure 3-15, which is the total population to Figure 3-18 which is the female population,
we see that the three language groups separate when the males are excluded. ASL 2 and Spanish
form nearly parallel trend lines, with the ASL 2 female participants having overall higher scores,
but those language groups’ correlations between SR accuracy percentage and MR accuracy
percentage were not significant. The ASL 4 group had a statistically significant correlation of
accuracy percentage on the two spatial relations tests. This result may indicate that a skill required
for both MR and SR, or two or more separate skills required for the two tests, are acquired by ASL
4 but not by ASL 2 or in Spanish.
In sum, there is a no difference between the three language groups on the space relations
task. However, there is a trend that indicates that ASL experience might act as training for spatial
relations tasks because female ASL 2 participants tended to be more accurate than female Spanish
participants. Previous research also using college courses as training or controls, found that all
groups (male and female) improved on the post-test, but females who received the spatial relations
training in a drafting course completed the task significantly faster on an embedded figure test
(Johnson, Flinn, and Tyer, 1979). Performance on the two spatial relations tasks are positively
correlated when the measurement excludes the time constraint. When raw scores are used, which
are affected by the time constraints and can be understood as a measure of reaction time, only the
signing students scores are positively correlated. The only significant correlation was the female
ASL 4 group’s correlation accuracy percentage between SR and MR. The correlations may also be
influenced by the participants’ own expectations of success on spatial relations tasks (Moe and
64

Pazzaglia, 2006). For example, female ASL 4 participants might think that they are good at spatial
relations tasks (because of signing experience or for unknown reasons). Overall, the results
indicate that ASL may serve as spatial relations training, supporting a psycho-social response for
gender differences on spatial relation tasks.
65

4.0 COMPARISION OF FACE-PROCESSING AND SPATIAL RELATIONS RESULTS
4.1 INTRODUCTION
All participants were in four experiments, two face-processing tasks and two space relations
tasks. As discussed in Chapter 2, the two face processing tasks are thought to tap separate skills,
even though they both involve processing faces. The two space relations experiments, although
different tasks, may use some of the same skills, namely mental rotation; and those two test results
were compared. In this section, I explore the possibility of correlations between the scores of the
spatial relations tasks and the face-processing tasks. Face-processing skills have been described to
operate in anatomically distinct system (Farah et al., 1995; Farah, 1996) or domain specific system
(Nachson, 1995), so correlations between face-processing tasks and spatial relations tasks are not
expected.
4.2 RESULTS AND DISCUSSION
4.2.1 BFRT and Spatial Relations Tests
The following figure compares the Benton Facial Recognition Test and the Mirror Reversal
scores in raw accuracy.
66

Figure 4- 1
Accuracy - Mirror Reversal Vs Benton
38
40
42
44
46
48
50
52
54
10 20 30 40 50
Mirror Reversal Number Correct (50)
Ben
ton
Num
ber C
orre
ct (5
4)
SpanishASL 2ASL 4Linear (Spanish)Linear (ASL 2)Linear (ASL 4)
Table 4- 1 Accuracy –Mirror Reversal Vs Benton
Language Regression Equation R² Sig. (2-tailed)
Spanish y = -0.024x + 49.955 0.0713 .802
ASL 2 y = 0.0557x + 43.656 0.0386 .655
ASL 4 y = -0.0508x + 47.185 0.0634 .972
As expected, scores on the MR and BFRT tests are not correlated for any language group. This
figure compares the accuracy based on raw scores for both tests; a comparison MR accuracy
percentage and BFRT raw score also showed no significant correlations.
The following figure compares the accuracy of the BFRT and the Space Relations test.
67

Figure 4- 2
Accuracy - Space Relations Vs Benton
38
40
42
44
46
48
50
52
54
15 20 25 30 35
Space Relations Number Correct (35)
Ben
ton
Num
ber C
orre
ct (5
4)
SpanishASL 2ASL 4Linear (Spanish)Linear (ASL 2)Linear (ASL 4)
Table 4- 2 Accuracy – Space Relations Vs Benton
Language Regression Equation R² Sig. (2-tailed)
Spanish y = -0.0851x + 49.354 0.0294 .646
ASL 2 y = 0.2347x + 39.173 0.2512 .064
ASL 4 y = -0.1867x + 50.533 0.1484 .216
Although the Spanish and ASL 4 groups do not seem to have a relationship between accuracy on
the space relations task and the BFRT, the ASL 2 group does show a trend toward a positive
correlation (p = .064). It is unclear why this result approaches significance.
4.2.2 MFCT and Spatial Relations Tests
The Mooney Faces Closure Test results are not expected to be correlated with either of the
spatial relations tests because the tasks do not seem to be related. The following figure correlates
the participants’ accuracy in raw score on the MFCT and the Mirror Reversal task.
68

Figure 4- 3
Accuracy - Mirror Reversal Vs Mooney
12141618202224262830
10 20 30 40 50
Mirror Reversal Number Correct (50)
Moo
ney
Num
ber
Corr
ect (
35)
SpanishASL 2ASL 4Linear (Spanish)Linear (ASL 2)Linear (ASL 4)
Table 4- 3 Accuracy – Mirror Reversal Vs Mooney Faces Closure Test
Language Regression Equation R² Sig. (2-tailed)
Spanish y = 0716x + 19.427 0.0527 .270
ASL 2 y = -0.0237x + 23.283 0.0028 .835
ASL 4 y = 0.0184x + 20.291 0.0019 .883
The nearly flat trend lines indicate that the two tasks are not correlated for any language group, and
no correlation was significant. As expected, analysis shows that the tests are, in fact, not correlated.
The next figure illustrates the correlation between the Mooney Faces Closure Test and the
Space Relations Test.
69

Figure 4- 4
Accuracy - Space Relations Vs Mooney
1012141618202224262830
15 20 25 30 35
Space Relation Raw Score (35)
Moo
ney
Face
s Cl
osur
e Te
st
Raw
Sco
re (3
5)
SpanishASL 2ASL 4Linear (Spanish)Linear (ASL 2)Linear (ASL 4)
Table 4- 4 Accuracy – Space Relations Vs Mooney
Language Regression Equation R² Sig. (2-tailed)
Spanish y = -0.0354x + 22.637 0.0029 .810
ASL 2 y = 0.1839x + 17.167 0.0703 .271
ASL 4 y = 0.3949x + 9.7432 0.3121 .074
Again, no correlation between the MFCT and the SR test was expected, and none was found.
There is trend toward a positive correlation for the ASL 4 group. This trend might be driven by
three outlier ASL 4 participants whose SR score were lower (<21) than the rest of the ASL 4 scores.
70

5.0 DISCUSSION AND CONCLUSIONS
5.1 SUMMARY OF RESULTS
The four experiments did reveal some significant findings based on language group. The
three groups did not differ in accuracy on either the Benton Facial Recognition Test or the Mooney
Faces Closure Test. The Spanish group had a positive correlation between accuracy on the BFRT
and on the MFCT. Neither of the ASL groups, however, had correlated scores on the face-
processing tests which suggests that ASL experience may affect performance on one of the two
tests. I would postulate that ASL would be more likely to affect the BFRT because those stimuli
include individual facial features, which is encoded in ASL grammar.
The ASL 2 group’s total test time for the MFCT was significantly lower from the ASL 4
group’s total test time, and almost significantly lower than the SPAN group’s total test time. Also,
the ASL 2 group’s accuracy and total test time was correlated on the MFCT.
Both of the ASL groups had significantly higher accuracy scores than the Spanish group on
the Mirror Reversal test providing further evidence that the spatial-visual modality of ASL effects
cognitive processes, such as mirror reversal detection and mental rotation. Since students within a
single year of signing experience differed significantly from the non-signing control group, it may
be the effects of signing on this task are seen early in the L2 process. In addition, both ASL groups
completed significantly more test items within the two-minute time constraint than the Spanish
group. Another measure of the ASL 4 success on the MR task, accuracy percentage, was
significantly positively correlated with number of completed test items.
The increased success of the signing groups on the MR task could be attributed to an
increase in ability to mentally rotate the figure in order to compare the test figures at the same
orientation or an increase in detecting mirror reversals. These results suggest maybe both mirror
reversal detection and mental rotation skills are affected.
71

Mental rotation is a cognitive process that is considered analog with the physical process.
The results indicate that the signing participants have an increased success on this task which
requires some mental rotation. Consequently, the results suggest that experience with signing gives
practice for this cognitive process. At least two sources of the practice may be involved. ASL may
give opportunity for the students to physically experience receiving information at different
rotations, which encourages the students to mentally rotate the information. This practice may then
increase the speed with which participants can mentally rotate objects. If so, only limited
experience (six months of ASL) impacts this skill because the ASL2 as well as the ASL4
participants significantly outperformed the non-signing SPAN participants in the number of MR test
items completed. It could be that this practice explains why the signing students maintained their
accuracy levels though 90° rotation while the SPAN participants’ accuracy began to decrease after
45° rotation. Perhaps the mental rotation practice from ASL experience enabled the signing
participants to regard 45° and 90° rotated items as upright test items. Processing time was then
available to detect mirror reversals whereas perhaps the SPAN participants spent more effort on
rotation leaving less for mirror reversal detection. Another possibility is that ASL students become
more familiar with receiving information from different rotations because of the visual-spatial
modality of ASL. In this case, the ASL participants may not mentally rotate the scene, but learn to
process the scene at the rotation. This explanation is supported by anecdotal evidence from native
signers who claim that they do not mentally rotate scenes but just understand them (Emmorey,
Klima, and Hickok, 1998). In addition, Murray’s (1997) results in which participants could be
taught to “flip” objects rather than “spin” (rotate) them in order to determine mirror reversal. ASL
experience might encourage this faster (per Murray) strategy.
The Wilcoxon same-reversal comparison revealed that accuracy was significantly decreased
in the reversal condition in certain rotation categories. However, the reversals were not consistently
72
more difficult in every rotation category for any of the language groups. At 90° rotation, for both
the SPAN and ASL 4 groups accuracy significantly decreased for reversed test items, but the ASL 2
group had similar accuracy for reversals at the rotation. Both ASL groups had significantly
decreased accuracy for the reversed items at 135°, but the SPAN group was similarly accurate at
that rotation. At 180° rotation, the SPAN and ASL4 groups were significantly less accurate with
reversals than “same’s,” but the ASL2 group had similar accuracy at this rotation. The accuracy
percentages were not consistently significant, even within language groups, which supports that the
mirror reversal task is not just another mental flip on a different axis. The results indicate that
mirror reversal detection is more difficult when the figures are at rotations closer to 180°.
The Space Relations task did not reveal significant differences based on language group.
Although the language groups did not differ significantly on the SR test, a slight gender difference
was gleaned from comparing the combined sex means and the female population means on the
spatial relations tasks. The SR test seems to be at least two skills: the mental construction of the
test figure and the rotation of the constructed three-dimensional figure. It is plausible that ASL
experience does not affect the mental construction skill, which explains why language group was
not found to be a significant factor. Overall, the significant MR results and, to a lesser extend, the
SR results indicate that ASL may serve as spatial relations training, supporting a psycho-social
response for gender differences on spatial relation tasks.
5.2 LIMITATIONS AND FUTURE RESEARCH
5.2.1 Mirror Reversal and Mental Rotation
The Mirror Reversal Test combined mental rotation and mirror reversal detection. Perhaps
the two skills, mirror reversal detection and mental rotation, could be separated in a future
experiment so that the two processes can be analyzed in isolation. The future experiment could
73

include trials in which the participants would not have to consider any rotation, thus removing
rotational uncertainty from the participants’ processing of the stimuli.
5.2.2 MR Individual Test Item Reaction Times
Future testing could include analysis of reaction times to the millisecond for each MR test
item to try to assign reaction time for the mental rotation of the figure and for the mirror reversal
decision. Shepard and Metzler (1971) found that reaction time (of correct answers) is a linear
function of the rotation of the test figures, configurations of ten connected cubes. In that experiment
the figures were either the same or different three-dimensional block figures, which was ascertained
by mentally rotating the figures (as per the participants’ post experiment interview). However,
Hamm et al. (2004) found that participants have longer response times for mirrored test items,
regardless of rotation. Therefore, recording and analyzing response times per test item for the
language groups might reveal how ASL learning is correlated with mirror reversal detection, mental
rotation skills, and general processing speed.
5.2.3 Stimuli
It would also be relevant to test the same participants with the 2-dimensional MR stimuli
and the Shephard and Metzler (1971) three dimensional stimuli. Jansen-Osmann and Heil (2007)
also found that type of stimulus (for example, animal drawings or polygons) interacted with gender;
sometimes females outperformed males, males outperformed females, and sometimes no gender
differences were found. Accordingly, future ASL L2 experiments could test rotation and reversal
skills with different stimuli. Detailed analysis of incorrect test items may indicate whether
participants are using an analytic strategy, which would make mirror reversal detection difficult, or
rotation strategy (Geiser, Lehmann, and Eid, 2006). This research’s results merit further testing of
ASL L2 participants on mirror reversal and mental rotation tasks.
74

5.2.4 Amount of ASL L2 Experience
Significant results were found on the MR test rather soon in ASL learning. It may be
enlightening to test ASL1 students for effects. Moreover, an experiment could be designed in
which mental rotation and/or mirror reversal practice was stressed with some classes and the regular
curriculum would serve as the control participants. Mental rotation practice could include activities
where signs were given at angles (for example, 45° angles) and paper and pencil worksheets asking
students to identify signs or objects that have been rotated. Mirror reversal activities include having
to mirror a partner’s movements and also producing the movement without mirror despite being
face-to-face.
It may be that not all significant effects are found with only 6 or 18 months of experience
using ASL as an L2, not as a primary language used everyday for basic communication. A future
longitudinal experiment could include ASL L2 with over two years of continued signing
experience, such as ASL interpreters. It may be possible to determine a timeline for non-linguistic
effects. A longitudinal study could also address if accuracy increases linearly or has a curvilinear
increase, i.e. that accuracy increases with ASL experience to an accuracy plateau.
5.2.5 Sample Size
The sample sizes of each group did not reach the goal for the study (n=30); larger groups
may have produced more statistically significant results. Convenience samples are challenging, but
participation incentives could increase sample sizes. An increase in sample sizes would also make
analysis of factors such as gender more informative.
5.2.6 Spatial Relations Training
A pre- and post-test design could attempt to answer if signing experience does act as training
for spatial relations skills particularly for the female signers. This question is relevant as the DAT-
75

Space Relations test is used an IQ test. If the results are driven in part by experience, then the test is
questionable as an intelligent quotient. Moreover, if spatial relation skills are improved by learning
ASL as an L2, people may be more motivated to choose ASL as an L2. And more schools may
want to offer ASL as a foreign language. Furthermore, ASL teachers could use the testing and
results to improve instruction. For example, perhaps some students need additional practice in
mental rotation or mirror reversal detection which would then improve their ASL learning.
5.2.7 Demographic Information
For any future experiments, I would improve the requested demographic information screen.
The participants could have chosen language class and then language level. This improvement
would have created four language groups, SPAN 2, SPAN 4, ASL 2 and ASL 4. Separating the two
levels of Spanish participants might have revealed if the language level groups (level 2 and level 4)
were more alike than language groups (Spanish and ASL).
It might also be interesting to recruit control group participants from another less-
commonly-taught language, for example, Arabic.
5.2.8 Proficiency Ratings
The separate ANOVA analysis for proficiency did not yield significant results. It may be
that proficiency is not relevant to the tasks, or conversely, the proficiency ratings were not accurate.
Proficiency was not determined by any administered language proficiency test. No standard ASL
proficiency test is in use. Proficiency can be based on instruction level (Carrell, 1991; Brisbois,
1995), and so the language levels included could be considered a type of proficiency. Nonetheless,
as described above, proficiency was solely self-rated. However, the proficiency rating used in this
experiment was superficial. An improvement would be administering a more thorough
questionnaire about the participants’ language skills, like Clarke’s three-point scale which asks “can
76

do” questions (Clarke, 1981). Rather than a language production proficiency rating like Clarke’s, a
receptive ASL proficiency test might be a more valid measure to use with non-linguistic tests.
Participants could be asked to answer questions after watching video clips of ASL. The questions
could be designed to ascertain proficiency in the spatially related grammar of ASL. The designed
proficiency test could then be used by the ASL teacher as an assessment tool for material mastery or
student placement into levels.
In summary, language group was only found to be a significant factor on the Mirror
Reversal Test (p = .002). Both ASL groups were significantly more successful on this task than the
Spanish group (p< .02). The signing groups were able to attempt more test items in the challenging
two-minute time limit which enabled the signing groups to answer more correctly. The results
indicate that experience with ASL, even adult L2 with less than a year experience, is correlated with
an increase skill on the Mirror Reversal Test. All groups had a decrease in accuracy with test items
at higher rotations. Mirror reversal detection was generally more difficult at higher rotations.
Wilcoxon analysis revealed that each groups’ accuracy on reversed test items sometimes differed
significantly within each rotation category, but reversal was not consistently more difficult. Taking
together, these results support that mental rotation and mirror reversal detection are separate skills.
With focus on spatial relations tasks for future experiments, improvements in test design
would include increased sample sizes, additional language groups, recording participants’ reaction
times for individual test items, and separating mirror reversal detection from mental rotation tasks.
77

BIBLOGRAPHY Abutalebi, J., Cappa, S.F., Perani, D. (2005). What can functional neuromimaging tell us about
the bilingual brain?. In J.F. Kroll & A. M. B. DeGroot (Eds.) Handbook of Bilingualism.
(pp. 497-515). New York, NY: Oxford University Press, Inc.
Alexander, G.M., Evardone, M. (2007). Blocks and bodies: Sex differences in a novel version of the
mental rotations test. Hormones and Behavior. Accepted manuscript.
Arnold, P., & Mills, M. (2001). Memory for faces, shoes, and objects by deaf and hearing signers
and hearing non-signers. Journal of Psycholinguistic Research 30, 185-195.
Arnold, P., & Murray, C (1998). Memory for faces and objects by deaf and hearing signers and
non-signers. Journal of Psycholinguistic Research, 27(4), 481-497.
Baker, C. & Padden, C. (1978). Focusing on the nonmanual components of American Sign
Language. In P. Siple (Ed.). Understanding language through sign language research.
New York: Academic Press. 59-90.
Bellugi, U., O’Grady, L., Lillo-Martin, D., O’Grady, M., van Hoek, K., & Corina, D. (1990).
Enhancement of spatial cognition in deaf children. In V. Volterr & C. Erting (Eds.) From
gesture to language in hearing and deaf children (pp. 278-298). New York: Springer-
Verlag.
Bennett, G.K., Seashore, H. G., Wesman, A. G. (1991). Differential Aptitude Tests Technical
Manual. The Psychological Corporation. 17.
Benton, A.L., Hamsher, K., Varney, N.R., & Spreen, O. (1983). Contributions to
Neuropsychological Assessment. New York: Oxford University Press.
Bettger, J. (1992). The effects of experience on spatial cognition: Deafness and
knowledge of ASL. Unpublished doctoral dissertation, University of Illinois,
Urbana-Champaign.
Bettger, J., Emmorey, K., McCullough, S., & Bellugi, U. (1997). Enhanced facial
discrimination: Effects of experience with American Sign Language. Journal of
Deaf Studies and Deaf Education, 2(4), 223-233.
Bialystok, E. (2001). Bilingualism in Development: Language, Literacy, and Cognition.
New York: Cambridge University Press.
Bialystok, E., & Codd, J. (1997). Cardinal limits evidence from language awareness and
bilingualism for developing concepts of number. Cognitive Development, 12, 85-106.
78

Bock, R.D. & Kolakowski, D. (1975). Further evidence of sex-linked major-gene influence on
human spatial visualizing ability. American Journal of Human Genetics, 25, 1-14.
Bosworth, R.G., & Dobkins, K.R. (1999). Left hemisphere dominance for motion processing in
deaf signers. Psychological Science, 10 (3). 256-262.
Bosworth, R.G., & Dobkins, K.R. (2002). The effects of spatial attention on motion
processing in deaf signers, hearing signers, and hearing nonsigners. Brain and
Cognition, 49, 152-169.
Bosworth, R.G., & Dobkins, K.R. (2002). Visual field asymmetries for motion
processing in deaf and hearing signers. Brain and Cognition, 49, 170-181.
Bowen, C., Mattheiss, J.H., & Wilson, R.M. (1993). The signing for reading success study
group: An approach to staff development. Literacy: Issues and Practices, 10, 48-52.
Brisbois, J.I. (1995). Connections between first- and second-language reading ability. Journal of
Reading Behavior, 27. 565-584.
Broverman, D.M., Klaiber, E.L., Kobayashi, Y., & Vogel, W. (1968). Roles of activation and
inhibition in sex differences in cognitive abilities. Psychological Review, 75, 23-50.
Burnett, S.A., & Lane, D.M. (1980) Effects of Academic Instruction on Spatial Visualization.
Intelligence 4, 233-242.
Carrell, P.L. (1991). Second language reading, reading ability or language proficiency? Applied
Linguistics, 12. 59-179.
Clarke, J. L. (1981). Language. In T.S. Barrows (Ed.) College students’ knowledge and beliefs:
A survey of global understanding. New Rochelle, NY: Change Magazine Press. 25-36.
Connor, J.M., Serbin, L.A., & Schackman, M. (1977). Sex differences in children’s response to
training on a visual-spatial test. Developmental psychology, 13 (3), 293-294.
Cummins, J. (1984). Bilingualism and special education: Issues in assessment and pedagogy.
San Diego, CA: College Hill Press.
Daniels, M. (1993). ASL as a factor in acquiring English. Sign Language Studies, 78, 23-29.
Daniels, M. (1994). The effect of sign language on hearing children’s language development.
Communication Education, 43, 291-298.
Daniels, M. (1996). Bilingual, bimodal education for hearing kindergarten students, Sign
Language Studies, 90, 25-36
Emmorey, K. (2003). Language, cognition, and the brain: Insights from sign language
research. Mahwah, New Jersey: Lawrence Erlbaum Associates, Publishers.
79

Emmorey, K., Klima, E., Hickok, G. (1998). Mental rotation within linguistic and non-linguistic
domains in users of American sign language. Cognition, 68, 221-246
Emmorey, K., Kosslyn, S., & Bellugi, U. (1993). Visual imagery and visual-spatial
language: Enhanced imagery abilities in deaf and hearing ASL signers. Cognition,
46, 139-181.
Evans, C.J. (2004). Literacy Development in deaf Students: Case Studies in Bilingual Teaching
and Learning. American Annals of the Deaf, 129 (1), 17-27.
Farah, M.J. (1996). Is face recognition “special”? Evidence from neuropsychology. Behavioural
Brain Research, 76(1-2), 181-189.
Farah, M.J., Wilson, K.D., Drain, H. M., Tanaka, J. R. (1995). The inverted face inversion effect in
prosopagnosia: Evidence for mandatory, face-specific perceptual mechanisms.
Vision Research, 35 (14), 2089-2093.
Geiser, C., Lehmann, W., Eid, M. (2006). Separating “rotators” from “nonrotators” in the mental
rotations test: A multigroup latent class analysis. Multivariate Behavioral Research, 41 (3).
261-293.
Hamm, J.P., Johnson, B.W., Corballis, M.C. (2004). One good turn deserves another: An event-
related brain potential study of rotated mirror-normal letter discrimination.
Neuropsychologia, 42. 810-820.
Ilan, A.B., Miller, J. (1994). A violation of pure insertion: Mental rotation and choice reaction time.
Journal of Experimental Psychology: Human Perception and Psychophysics, 42. 782-790.
Isenhath, J.O. (1990). The linguistics of American Sign Language. Jefferson, NC: McFarland &
Company, Inc. Publishers.
Jansen-Osmann, P., Heil, M. (2007). Suitable stimuli to obtain (no) gender differences in the speed
of cognitive processes involved in mental rotation. Brain and Cognition 64. 217-227.
Johnson, S., Flinn, J.M., & Tyer, Z.E. (1979). Effect of practice and training in spatial skills on
embedded figures scores of males and females. Perceptual and Motor Skills, 48,
975-984.
Keehner, M. and Gathercole, S.E. (2007). Cognitive adaptations arising from nonnative experience
of sign language in hearing adults. Memory & Cognition, 35. (4). 752-761.
Klima, E.S., Tzeng, O., Fok, A., Bellugi, U., & Corina, D. (1996) From sign to script: Effects of
linguistic experience on perceptual categorization. (Tech. Rep. No. INC-9604). Institute
for Neural Computation, University of California, San Diego.
80

Komnenich, P., Lane, D.M., Dickey, R.P., & Stone, S. C. (1978). Gonadal hormones and
cognitive performance. Physiological Psychology, 6 (1), 115-120.
Kroll, J.F., & Tokowicz, N. (2005). Models of Bilingual representation and processing: Looking
back and to the future. In J.F. Kroll & A. M. B. DeGroot (Eds.) Handbook of
Bilingualism. (pp. 531-553). New York, NY: Oxford University Press, Inc.
Li, P. (2003). Raising children bilingual: Should we, and when? Contemporary Psychology
APA Review of Books, 48, (5), 667-669.
Liddell, S. (1977). An investigation into the syntactic structure of American Sign Language.
Unpublished doctoral dissertation, university of California, San Diego.
Liddell, S. (1980). American Sign Language syntax. The Hague: Mouton.
Linn, M.C. & Petersen, A.C. (1985). Emergence and characterization of sex differences in spatial
ability: A meta-analysis. Child Development, 56. 1479-1498)
Maccoby, E. & Jacklin, D. The psychology of sex differences. Stanford: Standford University
Press, 1974.
Masataka, N. (1995). Absence of mirror-reversal tendency in cutaneous pattern perception and
acquisition of a signed language in deaf children. Journal of Developmental Psychology,
13, 97-106.
McCullough, S., Emmorey, K. (1997). Face processing by deaf ASL signers: evidence for
expertise in distinguishing local features. Journal of Deaf Studies and Deaf Education 2
(4), 212-222.
McGee, M.G., Effects of training and practice on sex differences in mental rotation test scores.
Journal of Psychology, 100, 87-90.
McKee. D. (1987). An analysis of specialized cognitive functions in deaf and hearing
signers. Unpublished doctoral dissertation. University of Pittsburgh,
Pittsburgh, PA.
Moe, A. & Pazzaglia, F. (2006). Following the instructions! Effects of gender beliefs in mental
rotation. Learning and Individual Differences 16. 369-377.
Mooney, C. M. (1956). Closure with negative after-images under flickering light.
Canadian Journal of Psychology 10, (4). 191-199
Murray, J. (1997). Flipping and spinning: Spatial transformation procedures in the identification of
rotated natural objects. Memory & Cognition, 25 (1). 96-105.
Nachson, I. (1995). On the modularity of face recognition: The riddle of domain specificity.
81

Journal of Clinical & Experimental Neuropsychology, 17, 256-275
Neville, H., Lawson, D., (1987) Attention to central and peripheral visual space in a movement
detection task: an event-related potential and behavioral study. Separate effects of
auditory deprivation and acquisition of a visual language. Brain Research 405, 284-294.
Parasnis, I., Samar, V., Bettger, J., & Sathe, K. (1996) Does deafness lead to enhancement of
visual spatial cognition in children? Negative evidence from deaf nonsigners. Journal of
Deaf Studies and Deaf Education, 1(2), 145-152.
Pavlenko, A. (2005) Bilingualism and thought. In J.F. Kroll & A. M. B. DeGroot (Eds.)
Handbook of Bilingualism. (pp. 433-453). New York, NY: Oxford University Press, Inc.
Peters, M. (2005). Sex differences and the factor of time in solving Vanderberg and Kuse mental
rotation problems. Brain and Cognition, 57. 179-184.
Shepard, R., & Metzler, J. (1971). Mental rotation of three-dimensional objects.
Science, 171, 701-703.
Stokoe, W.C., Casterline, D. & Croneberg, C. (1965). The Dictionary of American Sign
Language on Linguistic Principles. Washington, DC: Gallaudet College Press.
Revised 1978, Silver Spring, MD: Linstok Press.
Sydnor, M.H. (1994). The silent sins of learning: Using signing to reinforce reading skills.
Literacy Issues and Practices, 11, 30-37.
Talbot. K. F., & Haude, R. H. (1993). The relationship between sign language skill and
spatial visualization ability: Mental rotation of three-dimensional objects.
Perceptual and Motor Skills, 77, 1387-1391.
Tanaka, J.W., Sengco, J.A. (1997). Features and their configuration in face recognition. Memory &
Cognition 25 (5). 583-592.
Vandenberg, S.G. & Kuse, A.R. (1978). Mental Rotations, a group test of three-dimensional
spatial visualization. Perceptual and Motor Skills, 47, 599-604.
Warrington, E. (1984). Recognition Memory Test. Windsor, England: NFER-NELSON
Publishing Company, Ltd.
Yin, R.K. (1969). Looking at upside-down faces. Journal of Experimental Psychology, 81,
141-145.
Yin, R.K. (1970). Face recognition: A special process? Unpublished doctoral dissertation,
Massachusetts Institute of Technology, Cambridge.
82

APPENDIX A Age ________ Gender Male Female
Major __________________________________________________________________
African-American Asian Caucasian Hawaiian/Pacific Islander
Hispanic/Latino Native American Other _______________________
Do you have normal hearing? Yes No
Do you have normal vision (with or without corrective lenses)? Yes No
Are you Right-Handed Left-Handed Ambidextrous
Is English your native and preferred language? Yes No
List all foreign/second languages you know in order of most proficient to least proficient.
Rate your language ability on the following aspects.
(1-very poor, 2-poor, 3-fair, 4-functional, 5-goood, 6- very good, 7-native like, n/a-not applicable)
Language speaking/signing listening/receptive reading writing
1. _________________ ______ ______ ______ _____
2. _________________ ______ ______ ______ _____
3. _________________ ______ ______ ______ _____
Do you have experience with American Sign Language (ASL)? Yes No
If yes, are you currently taking ASL 2 ASL 4
If yes, did you have signing experience before taking classes at Pitt? Yes No
Please describe your signing experience, including length of experience.
ASL students:
Who is (has been) your teacher(s)
ASL 1 ____________________________________________________________
ASL 2 ____________________________________________________________
ASL 3 ____________________________________________________________
ASL 4 ____________________________________________________________
83

APPENDIX B
NLCE Enter the CODE Number that you were assigned. Enter only the number. It will take a few seconds for the program to load; please wait. You should not enter the code twice. This experiment is in five (5) sections. Before each section, there will instructions for that section. If you have any questions about what you are to do, please ask on the instruction pages. Before a testing section, the continue button will read, “Continue to test.” Since the program records response time, please do not wait to ask questions during the testing sections. Below are summaries of the instructions for each section. In each section, make a choice (your best guess), even if you are unsure. The program may present the sections in a different order than presented below.
Face 1 part 1 Choose the single matching face from the choices (1-6) to the target face. Face 1 part 2 Choose the three (3) matching faces from the choices (1-6) to the target face. Face 2 Label each image as either -a boy -a girl -a man -a woman -an old man -an old woman
Space 1 Decide if the figure to the right is the same or mirror-reversed image of the figure on the left, regardless of the figure’s rotation. Space 2 Decide which one of the choices (A-D) could be made from the pattern shown.
84

APPENDIX C Mooney Faces Closure Test items and answers
old man
adult woman
woman/girl
adult woman
adult man
old man
man/old man
adult man
adult woman
man/old man
adult woman
girl
adult woman
woman/old woman
woman
old man
boy/girl
adult man
adult man
girl
adult man
adult woman
old man
adult man
85

adult man
old man/old woman
man/old man/old woman
old man/old woman
old man
adult man
adult man
adult man
old man
adult woman
boy/girl 86

APPENDIX D
87

88