Embed Size (px)
Citation preview

Non-native Invasive Plant Species
The National Resources Inventory (NRI) is a statistical survey of natural resource conditions
and trends on non-Federal land in the United States. Non-Federal land includes privately
owned lands, tribal and trust lands, and lands controlled by state and local governments.
The NRI rangeland results presented here address current conditions. In the future, the NRI
rangeland survey sample will include revisited sites. These data will allow estimates for change
in rangeland resource conditions to be made.
Importance to the Nation
Certain non-native plant species have the potential to outcompete native species. Loss of
native species negatively impacts quality of forage for grazing animals and can lead to fire
risks, land degradation and erosion. Land managers and policymakers need this information to
support strategic decisions and to identify areas of risk and implement strategies to eradicate
and control the spread of invasive species.
Introduction
The NRI findings presented here provide information about non-native plant species growing
on non-Federal rangeland. The term non-native refers to plants that have been introduced
from other regions or countries. Plants included in the summaries are those identified as non-
native species by the USDA Plants Database.
Most non-native plant species are not a problem, and some are considered beneficial. Crested
wheatgrass (Agropyron cristatum (L.) Gaertn), for example, is an introduced species that is
commonly recommended for forage production and for soil stabilization in semi-arid regions.
Other non-native species such as cheatgrass (Bromus tectorum L.) have become severe
weeds that often out-compete native grasses and forbs in arid regions.
Some non-native species have become invasive. Where these species replace significant
proportions of native plant communities, they may modify vegetation structure, the fire
regime, hydrology, soil erosion rates, and forage production. These changes in turn can have
significant effects on both livestock production and wildlife populations.

Additional findings are presented here for nine groups of non-native invasive herbaceous
species selected because of their ubiquitous nature in rangeland plant communities. Plant
species in these groups were introduced from other countries and once established, have been
very difficult to eradicate. The nine non-native invasive herbaceous species groups include:
o Annual bromes (Bromus spp.) – Annual brome grasses included in this group are
highly invasive in shrub communities including sagebrush, and pinyon-juniper and often
completely out-compete native grasses and forbs. Communities of annual bromes can be
highly flammable in the late spring through early fall.
o Cheatgrass (Bromus tectorum L.) is one of the more prevalent types of annual brome
grasses. It has the potential to dramatically alter the ecosystems it invades, and can
completely replace native vegetation and can change fire regimes.
o Medusahead (Taeniatherum caput-medusae (L.) Nevski) typically invades rangeland
communities, displacing desirable vegetation. Medusahead has a high silica content
making it generally unpalatable to livestock and wildlife. Its seeds are avoided by most
seed eating birds. Dense communities present risk of wildfire and alteration of the
hydrologic cycle.
o Kentucky and Canada bluegrass (Poa pratensis L. and Poa compressa L.) – Although
native in some areas of the U.S., these grasses are introduced into most rangelands and
widely used for erosion control, lawns, and forage. They have become weedy or invasive
in some regions and habitats and can displace desirable plants.
o Buffelgrass (Pennisetum ciliare) is an invasive perennial grass that is highly resistant to
drought events and can choke out native grasses. When dry, this grass burns rapidly if
ignited, making it especially dangerous during wildfire season.
o Halogeton glomeratus was introduced from Eurasia to the United States early in the
20th century. It is highly toxic to both sheep and cattle. Salt from the soil accumulates in
the plant tissues and is also leached from roots back onto the soil surface increasing
salinity and favoring establishment of halogeton over other species.
o Centaurea spp. - The roots of species in this group produce toxins that stunt the growth
of many native plant species. These Centaurea species are inedible to most livestock and
poisonous to some.
o Cirsium spp. – Canada thistles and bull thistles in this group can form dense stands that
can shade out native vegetation. The species are unpalatable to many livestock and
wildlife.
o Leafy spurge (Euphorbia esula L.) is a deep-rooted invasive plant that is highly
competitive with native species causing degradation of grazing land and wildlife habitat.
The plant produces milky latex that causes irritation to the skin and is poisonous to some
animals.
Table 1 provides a list of species in each group.
Key Findings
• Non-native species are present on over half (53.8% ±1.0%) of the Nation’s non-
Federal rangeland, but many of these are not invasive (Table 2, Figure 1).
Figure 1. Non-Federal Rangeland Where Non-native Plant Species Are Present. (Source: Table 2)
• Plant canopy cover represents the proportion of the soil surface covered by an
individual species. Nationally, non-native species make up at least 25 and 50 percent
of the plant canopy cover on 18.1 (±0.7) and 8.6 (±0.5) percent, respectively, of non-
Federal rangeland (Table 2, Figures 2 and 3).
• Relative plant canopy cover is an indicator of species composition and therefore
relative dominance. Nationally, non-native species make up at least 25 and 50 percent
of the relative plant canopy cover on 19.4 (±0.7) and 9.0 (±0.5) percent, respectively,
of non-Federal rangeland (Table 2).

Figure 2. Non-Federal Rangeland Where Non-native Plant Species Cover at Least 25% of the Soil Surface. (Source: Table 2)
Figure 3. Non-Federal Rangeland Where Non-native Plant Species Cover at Least 50% of the Soil Surface. (Source: Table 2)

• Annual bromes are widespread (Table 3, Figure 4). Species in this group are present
on 30.1 (±1.0) percent of the Nation’s non-Federal rangeland.
• Nationally, annual bromes cover at least 30 and 50 percent of the soil surface on 7.1
(±0.4) and 3.0 (±0.3) percent, respectively, of non-Federal rangeland (Table 3).
• Annual bromes make up at least 30 and 50 percent of the relative plant canopy cover
on 6.3 (±0.4) and 1.7 (±0.2) percent, respectively, of non-Federal rangeland (Table
4).
Figure 4. Non-Federal Rangeland Where Annual Bromes Are Present. (Source: Table 3)

• Cheatgrass, Bromus tectorum L., is one of the more common species of annual bromes
(Table 1). This species is present on 18.2 (±0.6) percent of the Nation’s non-Federal
rangeland (Table 5, Figure 5).
• Nationally, cheatgrass covers at least 30 and 50 percent of the soil surface on 3.6
(±0.3) and 1.5 (±0.2) percent, respectively, of non-Federal rangeland (Table 5).
• Cheatgrass makes up at least 30 and 50 percent of the relative plant canopy cover on
3.9 (±0.3) and 1.2 (±0.1) percent, respectively, of non-Federal rangeland (Table 6).
Figure 5. Non-Federal Rangeland Where Cheatgrass Is Present. (Source: Table 5)

• Medusahead is present on only 1.7 (±0.3) percent of the Nation’s non-Federal
rangeland (Table 7, Figure 6). This species is most common in California, Idaho,
Oregon, and Washington where it present on 20.1 (±4.5), 18.6 (±5.0), 17.9 (±4.8),
and 7.0 (±3.3) percent, respectively, of non-Federal rangeland (Table 7).
• Nationally, medusahead covers at least 30 and 50 percent of the soil surface on 0.5
(±0.1) and 0.2 (±0.1) percent, respectively, of non-Federal rangeland (Table 7).
• Medusahead makes up at least 30 percent of the relative plant canopy cover on 0.5
(±0.1) percent of non-Federal rangeland (Table 8). Figure 6. Non-Federal Rangeland Where Medusahead Is Present. (Source: Table 7)

• Invasive bluegrass species are most common in North Dakota, South Dakota,
Nebraska, and Kansas (Table 9, Figure 7) where they are present on 81.6 (±2.3),
60.7 (±3.7), 41.2 (±3.4), and 40.5 (±4.3) percent, respectively, of non-Federal
rangeland. Nationally, species in this group are present on 13.8 (±0.5) percent of the
Nation’s non-Federal rangeland.
• Invasive bluegrass species cover at least 30 and 50 percent of the soil surface on 4.3
(±0.2) and 2.7 (±0.2) percent, respectively, of the nation’s non-Federal rangeland
(Table 9).
• Invasive bluegrass species make up at least 30 and 50 percent of the relative plant
canopy cover on 2.9 (±0.2) and 0.8 (±0.1) percent, respectively, of non-Federal
rangeland (Table 10). Figure 7. Non-Federal Rangeland Where Kentucky and Canada Bluegrass Is Present. (Source: Table 9)

• Buffelgrass is present in 3.4 (±0.8) percent of non-Federal rangeland in Texas (Tables
11 and 12, Figure 8).
Figure 8. Non-Federal Rangeland Where Buffelgrass Is Present. (Source: Table 11)

• Halogeton is most common in Utah and Nevada, where the species is present on 7.7
(±2.5) and 4.6 (±1.7) percent, respectively, of non-Federal rangeland (Tables 13 and
14, Figure 9).
Figure 9. Non-Federal Rangeland Where Halogeton Is Present. (Source: Table 13)

• Centaurea species are most common in California and Washington, where the species
are present on 12.8 (±3.6) and 6.7 (±3.2) percent, respectively, of non-Federal
rangeland (Tables 15 and 16, Figure 10).
Figure 10. Non-Federal Rangeland Where Centaurea Is Present. (Source: Table 15)

• Certain invasive Cirsium species are most common in North Dakota and South Dakota,
where the species are present on 6.5 (±1.4) and 4.7 (±1.2) percent, respectively, of
non-Federal rangeland (Tables 17 and 18, Figure 11).
Figure 11. Non-Federal Rangeland Where Circium Is Present. (Source: Table 17)

• Leafy spurge is most common in North Dakota where the species is present on 6.8
(±2.0) percent of non-Federal rangeland (Tables 19 and 20, Figure 12).
Figure 12. Non-Federal Rangeland Where Leafy Spurge Is Present. Source: Table 19)
Significance of Findings
Non-native invasive plants negatively impact rangeland throughout the western United States
by displacing desirable species, altering ecological and hydrological processes, reducing wildlife
habitat, degrading systems, altering fire regimes, and decreasing productivity (Sheley 2010).
The extent and spread of invasive exotic plants is poorly documented and poorly understood
by the public. Without these facts, policymakers lack critical information to make decisions and
to sustain public support relating to invasive species management (Mack et al. 2000).
NRI Rangeland on-site data present a unique resource for addressing the paucity of
information on invasive species. The findings here are an initial attempt at providing science-
based quantitative data that is deemed critical for management and policy makers. NRI uses a
"unified sample design across natural resources and through space and time…a cornerstone to
investigating the dynamics of change in an ecological system" (Nusser et al. 1998).

The lack of regional scale maps of invasive plant distribution and abundance inhibits
monitoring, management and research (Marvin et al. 2009). While the need for a "national
system to detect, assess, and respond to invasive species infestations in their early stages of
establishment" led to conceptual plans by the Federal Interagency Committee for the
Management of Noxious and Exotic Weeds (FICMNEW 2003), these new NRI data exhibit our
ability to develop current maps to describe presence, extent, and relative dominance of non-
native plants.
Tables and Results
Estimates presented here are based upon rangeland data collected on-site as part of the NRI,
a sample survey based upon scientific statistical principles and procedures. These results are
based upon NRI rangeland data collected in the field on rangeland during the period 2004 to
2011 and address current conditions. These estimates cover non-Federal rangeland in 17
western states (extending from North Dakota south to Texas and west) and to a limited extent
in Florida and Louisiana.
Margins of error are reported for each NRI estimate and must be considered at all scales of
analysis. The margin of error is used to construct the 95 percent confidence interval for the
estimate. The lower bound of the interval is obtained by subtracting the margin of error from
the estimate; the upper bound is obtained by adding the margin of error to the estimate. A 95
percent confidence interval means that in repeated samples from the same population, 95
percent of the time the true underlying population parameter will be contained within the
lower and upper bounds of the interval. In the following tables, if there are instances where
the margin of error is greater than or equal to the estimate, the confidence interval includes
zero and the estimate should not be used. In those cases, the estimate in the table is replaced
by the word "Trace."

Table 1. Non-native invasive herbaceous species groups. (source: USDA PLANTS database (http://plants.usda.gov/index.html) accessed November 2009) Annual Bromes
• BRTE - Bromus tectorum L., cheatgrass • BRJA - Bromus japonicus Thunb. ex Murr., Bromus arvensis • BRST2 - Bromus sterilis L., poverty brome • BRRU2 - Bromus rubens, red brome • BRDI3 - Bromus diandrus ssp. diandrus, ripgut brome • BRDID2 - Bromus diandrus ssp. diandrus, ripgut brome • BRDIR - Bromus diandrus ssp. rigidus, ripgut brome • BRHO2 - Bromus hordeaceus, soft brome • BRHOH - Bromus hordeaceus ssp. hordeaceus, soft brome • BRHOD - Bromus hordeaceus ssp. divaricatus, soft brome • BRSE - Bromus secalius, rye brome
Summaries are provided for two groups of annual bromes: • All eleven species including cheatgrass • Only cheatgrass
Medusahead
• TACA8 - Taeniatherum caput-medusae (L.) Nevski, medusahead • TAENI2 - Taeniatherum Nevski, medusahead
Kentucky and Canada bluegrass
• POPR - Poa pratensis L., Kentucky bluegrass
• POCO - Poa compressa L., Canada bluegrass
Buffelgrass • PECI - Pennisetum ciliare (L.) Link, buffelgrass
Halogeton • HALOG - Halogeton C.A. Mey., saltlover • HAGL - Halogeton glomeratus (M. Bieb.) C.A. Mey., saltlover
Centaurea
• CENTA - Centaurea L., knapweeds* • CESO3 - Centaurea solstitialis L., yellow star-thistle • CEDI3 - Centaurea diffusa Lam., diffuse knapweed • CEME2 - Centaurea melitensis L., Maltese star-thistle • ACRE3 - Acroptilon repens (L.) DC., hardheads • CEBI2 - Centaurea biebersteinii DC., spotted knapweed
* CENTA not included from AZ, KS, NM, OK, TX since in those states the genus Centaurea may include both native and introduced species.
Cirsium
• CIAR4 - Cirsium arvense (L.) Scop., Canada thistle • CIVU - Cirsium vulgare (Savi) Ten., bull thistle
Leafy spurge
• EUES - Euphorbia esula L., leafy spurge

Tabular Results
Table 2. Non-federal rangeland where non-native plant species are present; where they cover at least 25 percent or 50 percent of the soil surface; and where they make up at least 25 percent or 50 percent of the relative plant canopy cover (composition); by state, with margins of error.
State
Non-Native Species
Presence
Nonnative Species Cover at
least 25% of the Soil Surface
Nonnative Species Cover at
least 50% of the Soil Surface
Nonnative Species Make
Up at least 25% of the
Relative Plant Canopy Cover (Composition)
Nonnative Species Make
Up at least 50% of the
Relative Plant Canopy Cover (Composition)
Percent Percent Percent Percent Percent
Arizona 35.6 ±4.3
3.7 ±1.3
1.1 ±0.9
12.2 ±2.7
4.2 ±1.6
California 90.4 ±4.3
69.0 ±5.6
52.0 ±5.2
77.7 ±5.0
61.4 ±5.8
Colorado 51.4 ±4.0
10.4 ±1.7
4.1 ±1.2
15.2 ±2.2
6.5 ±1.4
Florida 38.6 ±10.0
3.5 ±2.8
Trace 2.9 ±2.7
Trace
Idaho 85.2 ±3.4
47.0 ±6.8
23.1 ±4.9
51.2 ±5.9
29.7 ±5.3
Kansas 78.7 ±2.6
30.1 ±2.7
14.4 ±2.2
19.6 ±2.6
3.3 ±0.9
Louisiana 56.6 ±17.2
28.3 ±12.4
22.6 ±11.8
18.9 ±11.8
Trace
Montana 66.0 ±3.2
17.2 ±1.9
6.0 ±1.4
18.6 ±2.1
6.3 ±1.3
Nebraska 55.2 ±5.2
16.2 ±2.8
6.2 ±1.5
10.5 ±2.4
1.9 ±0.8
Nevada 64.6 ±4.7
21.8 ±4.1
8.9 ±3.5
38.0 ±5.2
19.9 ±4.1
New Mexico 21.3 ±3.1
2.2 ±0.8
0.6 ±0.4
5.1 ±1.3
2.2 ±0.9

North Dakota 72.6 ±3.3
15.4 ±3.0
5.3 ±1.9
8.6 ±2.4
3.7 ±1.6
Oklahoma 64.0 ±4.7
20.7 ±3.3
10.0 ±2.8
14.0 ±3.0
3.6 ±1.5
Oregon 90.5 ±3.8
42.8 ±5.1
17.9 ±4.4
53.9 ±5.4
26.7 ±4.3
South Dakota 83.9 ±2.0
37.7 ±3.3
19.4 ±3.1
27.9 ±3.5
7.5 ±1.8
Texas 36.3 ±2.3
9.6 ±1.2
4.0 ±1.0
9.2 ±1.2
3.6 ±1.0
Utah 73.0 ±4.9
30.5 ±5.6
12.1 ±3.9
44.4 ±5.5
27.8 ±5.3
Washington 95.3 ±2.5
48.8 ±5.4
21.3 ±4.5
64.5 ±5.1
35.9 ±4.8
Wyoming 57.1 ±6.5
16.1 ±4.3
6.4 ±2.8
17.4 ±4.0
5.1 ±1.5
Nation 53.8 ±1.0
18.1 ±0.7
8.6 ±0.5
19.4 ±0.7
9.0 ±0.5
Note: Estimates where margins of error are at least as large as the estimates are denoted as
"Trace."

Table 3. Non-Federal rangeland where annual brome species are present and where they cover at least 5%, 15%, 30%, or 50% of the soil surface, by state, with margins of error.
State Present At least
5% At least
15%
At least
30%
At least
50%
Percent
Percent
Percent
Percent
Percent
Arizona 9.0 ±2.2
3.8 ±1.7
1.7 ±1.2
Trace Trace
California 76.6 ±4.8
61.5 ±5.3
44.3 ±5.9
25.9 ±4.4
10.5 ±2.7
Colorado 19.8 ±2.7
9.1 ±2.2
4.6 ±1.2
2.3 ±0.8
0.8 ±0.5
Florida 0 0 0 0 0
Idaho 68.2 ±4.4
50.2 ±6.3
32.0 ±4.9
17.4 ±4.7
5.3 ±2.3
Kansas 62.7 ±3.1
44.2 ±2.8
30.2 ±2.8
19.1 ±2.3
10.6 ±1.9
Louisiana 0 0 0 0 0
Montana 44.4 ±3.7
25.8 ±3.2
14.4 ±2.7
7.0 ±1.5
2.6 ±0.8
Nebraska 43.2 ±5.1
28.3 ±3.9
18.1 ±2.9
11.5 ±2.5
5.4 ±1.3
Nevada 48.1 ±6.4
34.7 ±6.6
22.5 ±5.2
11.1 ±4.2
5.4 ±3.0
New Mexico 2.6 ±1.0
1.4 ±0.7
0.9 ±0.6
Trace Trace
North Dakota 8.4 ±2.3
4.3 ±1.3
2.4 ±1.1
1.1 ±0.8
0.7 ±0.6
Oklahoma 30.3 ±4.1
16.7 ±2.8
9.8 ±2.1
4.0 ±1.3
1.4 ±0.8
Oregon 81.5 ±4.2
64.5 ±5.3
39.9 ±5.0
22.0 ±4.2
7.6 ±3.4

South Dakota 62.0 ±3.3
46.7 ±3.9
32.3 ±3.1
20.9 ±2.6
10.3 ±2.0
Texas 6.4 ±1.1
3.3 ±0.8
1.5 ±0.5
0.6 ±0.3
0.4 ±0.3
Utah 50.0 ±5.2
32.1 ±4.3
20.4 ±2.9
9.8 ±2.9
2.6 ±1.7
Washington 90.8 ±3.5
71.7 ±6.4
49.4 ±5.1
25.5 ±5.2
7.6 ±2.3
Wyoming 44.2 ±6.4
29.1 ±4.7
17.5 ±3.7
9.0 ±2.9
3.8 ±1.8
Nation 30.1 ±1.0
20.2 ±0.7
12.8 ±0.6
7.1 ±0.4
3.0 ±0.3
Note: Estimates where margins of error are at least as large as the estimates are denoted as
"Trace."
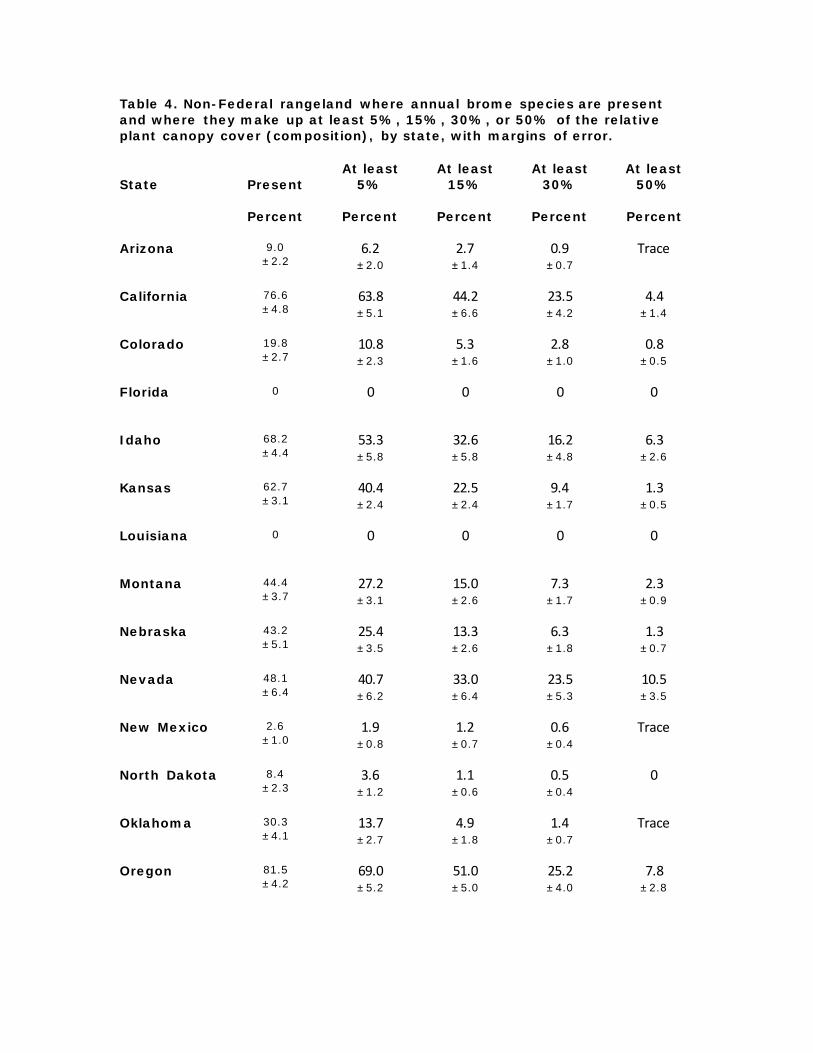
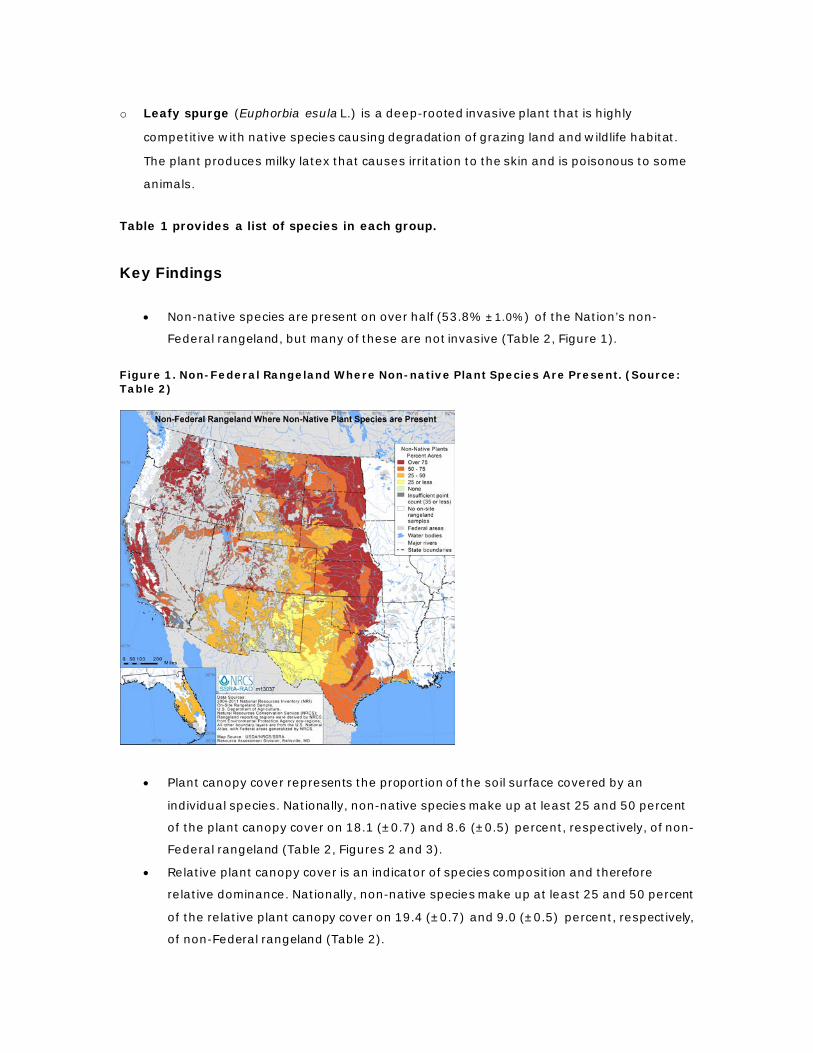
Table 4. Non-Federal rangeland where annual brome species are present and where they make up at least 5%, 15%, 30%, or 50% of the relative plant canopy cover (composition), by state, with margins of error.
State Present At least
5% At least
15%
At least
30%
At least
50%
Percent Percent Percent Percent Percent
Arizona 9.0 ±2.2
6.2 ±2.0
2.7 ±1.4
0.9 ±0.7
Trace
California 76.6 ±4.8
63.8 ±5.1
44.2 ±6.6
23.5 ±4.2
4.4 ±1.4
Colorado 19.8 ±2.7
10.8 ±2.3
5.3 ±1.6
2.8 ±1.0
0.8 ±0.5
Florida 0 0 0 0 0
Idaho 68.2 ±4.4
53.3 ±5.8
32.6 ±5.8
16.2 ±4.8
6.3 ±2.6
Kansas 62.7 ±3.1
40.4 ±2.4
22.5 ±2.4
9.4 ±1.7
1.3 ±0.5
Louisiana 0 0 0 0 0
Montana 44.4 ±3.7
27.2 ±3.1
15.0 ±2.6
7.3 ±1.7
2.3 ±0.9
Nebraska 43.2 ±5.1
25.4 ±3.5
13.3 ±2.6
6.3 ±1.8
1.3 ±0.7
Nevada 48.1 ±6.4
40.7 ±6.2
33.0 ±6.4
23.5 ±5.3
10.5 ±3.5
New Mexico 2.6 ±1.0
1.9 ±0.8
1.2 ±0.7
0.6 ±0.4
Trace
North Dakota 8.4 ±2.3
3.6 ±1.2
1.1 ±0.6
0.5 ±0.4
0
Oklahoma 30.3 ±4.1
13.7 ±2.7
4.9 ±1.8
1.4 ±0.7
Trace
Oregon 81.5 ±4.2
69.0 ±5.2
51.0 ±5.0
25.2 ±4.0
7.8 ±2.8

South Dakota 62.0 ±3.3
44.0 ±3.7
26.5 ±3.2
11.9 ±2.5
1.3 ±0.9
Texas 6.4 ±1.1
2.6 ±0.7
1.0 ±0.4
0.3 ±0.2
0
Utah 50.0 ±5.2
39.3 ±4.4
27.1 ±3.6
15.6 ±3.3
7.3 ±2.8
Washington 90.8 ±3.5
80.6 ±6.1
61.4 ±5.2
36.7 ±5.1
13.4 ±3.8
Wyoming 44.2 ±6.4
31.2 ±4.9
17.0 ±3.3
8.3 ±2.6
2.1 ±0.9
Nation 30.1 ±1.0
20.7 ±0.7
12.5 ±0.6
6.3 ±0.4
1.7 ±0.2
Note: Estimates where margins of error are at least as large as the estimates are denoted as
"Trace."

Table 5. Non-Federal rangeland where cheatgrass is present and where it covers at least 5%, 15%, 30%, or 50% of the soil surface, by state, with margins of error.
State Present At least 5%
At least 15%
At least 30%
At least 50%
Percent Percent Percent Percent Percent
Arizona 3.9 ±1.4
1.0 ±0.8
Trace 0 0
California 13.7 ±4.4
7.4 ±3.1
4.4 ±2.5
2.4 ±1.5
Trace
Colorado 15.6 ±2.9
7.4 ±2.1
3.8 ±1.3
1.8 ±0.7
0.7 ±0.5
Florida 0 0 0 0 0
Idaho 60.7 ±4.7
39.4 ±6.7
24.5 ±6.0
13.7 ±4.7
4.3 ±2.3
Kansas 18.9 ±2.5
11.2 ±1.7
7.0 ±1.5
4.5 ±1.4
2.4 ±0.9
Louisiana 0 0 0 0 0
Montana 20.9 ±3.1
10.6 ±2.2
5.2 ±1.6
2.4 ±0.8
1.0 ±0.6
Nebraska 21.4 ±3.3
13.5 ±2.3
9.1 ±1.8
5.5 ±1.4
2.5 ±1.0
Nevada 47.7 ±6.4
34.4 ±6.9
22.2 ±5.4
11.1 ±4.2
5.4 ±3.0
New Mexico 2.5 ±1.0
1.4 ±0.7
0.9 ±0.6
Trace Trace
North Dakota 3.9 ±1.5
1.9 ±1.0
Trace 0.7 ±0.6
Trace
Oklahoma 18.8 ±3.1
10.8 ±2.6
6.5 ±2.1
2.6 ±1.0
1.1 ±0.8
Oregon 75.9 ±5.2
56.5 ±5.6
32.0 ±4.6
16.3 ±4.5
4.9 ±2.6

South Dakota 46.9 ±3.4
33.1 ±3.5
22.6 ±3.1
14.8 ±2.5
7.5 ±1.9
Texas 2.0 ±0.5
0.8 ±0.4
0.3 ±0.2
Trace Trace
Utah 49.2 ±5.2
30.5 ±4.3
19.3 ±3.1
9.4 ±3.0
2.5 ±1.7
Washington 88.3 ±3.9
67.6 ±6.2
44.0 ±5.4
21.4 ±4.4
7.1 ±2.4
Wyoming 33.0 ±5.1
20.2 ±3.5
11.4 ±2.5
5.6 ±1.8
2.2 ±1.2
Nation 18.2 ±0.6
11.4 ±0.5
6.8 ±0.4
3.6 ±0.3
1.5 ±0.2
Note: Estimates where margins of error are at least as large as the estimates are denoted as
"Trace."

Table 6. Non-Federal rangeland where cheatgrass is present and where it makes up at least 5%, 15%, 30%, or 50% of the relative plant canopy cover (composition), by state, with margins of error.
State Present At least
5% At least
15%
At least
30%
At least
50%
Percent Percent Percent Percent Percent
Arizona 3.9 ±1.4
1.9 ±0.9
0.7 ±0.5
Trace Trace
California 13.7 ±4.4
9.6 ±3.9
6.1 ±3.7
3.6 ±2.5
0.7 ±0.6
Colorado 15.6 ±2.9
8.8 ±2.3
4.5 ±1.6
2.7 ±1.1
0.8 ±0.5
Florida 0 0 0 0 0
Idaho 60.7 ±4.7
42.5 ±6.2
26.3 ±6.3
13.0 ±4.8
5.6 ±2.7
Kansas 18.9 ±2.5
10.3 ±1.7
5.5 ±1.3
2.6 ±0.9
0.4 ±0.3
Louisiana 0 0 0 0 0
Montana 20.9 ±3.1
11.3 ±2.2
5.5 ±1.9
3.0 ±1.1
1.0 ±0.7
Nebraska 21.4 ±3.3
12.9 ±2.1
7.2 ±1.6
3.1 ±1.3
0.6 ±0.3
Nevada 47.7 ±6.4
40.3 ±6.2
32.6 ±6.7
23.4 ±5.4
10.5 ±3.5
New Mexico 2.5 ±1.0
1.8 ±0.9
1.2 ±0.7
0.6 ±0.4
Trace
North Dakota 3.9 ±1.5
1.6 ±1.0
Trace Trace 0
Oklahoma 18.8 ±3.1
9.2 ±2.7
3.0 ±1.4
1.1 ±0.6
Trace
Oregon 75.9 ±5.2
60.8 ±5.9
42.6 ±5.6
20.0 ±4.5
5.8 ±2.8
South Dakota 46.9 ±3.4
31.1 ±3.4
18.7 ±3.0
8.5 ±2.1
1.1 ±0.9

Texas 2.0 ±0.5
0.7 ±0.3
Trace Trace 0
Utah 49.2 ±5.2
37.5 ±4.4
25.9 ±4.0
15.3 ±3.3
7.1 ±2.8
Washington 88.3 ±3.9
76.4 ±6.1
53.4 ±5.5
30.9 ±5.2
12.1 ±3.4
Wyoming 33.0 ±5.1
21.9 ±3.8
11.6 ±2.2
5.8 ±2.0
1.6 ±0.8
Nation 18.2 ±0.6
12.2 ±0.6
7.3 ±0.5
3.9 ±0.3
1.2 ±0.1
Note: Estimates where margins of error are at least as large as the estimates are denoted as
"Trace."

Table 7. Non-Federal rangeland where medusahead is present and where it covers at least 5%, 15%, 30%, or 50% of the soil surface, by state, with margins of error.
State Present At least
5% At least
15%
At least
30%
At least
50%
Percent Percent Percent Percent Percent
Arizona 0 0 0 0 0
California 20.1 ±4.5
14.9 ±4.2
10.0 ±3.1
4.8 ±1.9
2.1 ±1.4
Colorado 0 0 0 0 0
Florida 0 0 0 0 0
Idaho 18.6 ±5.0
15.0 ±4.4
12.5 ±4.1
10.6 ±3.9
5.9 ±2.5
Kansas 0 0 0 0 0
Louisiana 0 0 0 0 0
Montana 0 0 0 0 0
Nebraska 0 0 0 0 0
Nevada 0 0 0 0 0
New Mexico 0 0 0 0 0
North Dakota 0 0 0 0 0
Oklahoma 0 0 0 0 0
Oregon 17.9 ±4.8
11.3 ±3.9
6.9 ±2.8
3.2 ±2.3
1.3 ±0.8

South Dakota 0 0 0 0 0
Texas 0 0 0 0 0
Utah Trace Trace 0 0 0
Washington 7.0 ±3.3
5.2 ±2.7
2.7 ±2.1
Trace Trace
Wyoming 0 0 0 0 0
Nation 1.7 ±0.3
1.2 ±0.2
0.8 ±0.2
0.5 ±0.1
0.2 ±0.1
Note: Estimates where margins of error are at least as large as the estimates are denoted as
"Trace."

Table 8. Non-Federal rangeland where medusahead is present and where it makes up at least 5%, 15%, 30%, or 50% of the relative plant canopy cover (composition), by state, with margins of error.
State Present At least
5% At least
15%
At least
30%
At least
50%
Percent Percent Percent Percent Percent
Arizona 0 0 0 0 0
California 20.1 ±4.5
15.4 ±4.4
9.6 ±3.2
5.6 ±2.6
Trace
Colorado 0 0 0 0 0
Florida 0 0 0 0 0
Idaho 18.6 ±5.0
15.2 ±4.4
12.6 ±4.1
9.4 ±3.5
4.6 ±2.9
Kansas 0 0 0 0 0
Louisiana 0 0 0 0 0
Montana 0 0 0 0 0
Nebraska 0 0 0 0 0
Nevada 0 0 0 0 0
New Mexico 0 0 0 0 0
North Dakota 0 0 0 0 0
Oklahoma 0 0 0 0 0
Oregon 17.9 ±4.8
12.0 ±3.7
7.2 ±2.8
3.5 ±1.7
Trace

South Dakota 0 0 0 0 0
Texas 0 0 0 0 0
Utah Trace Trace 0 0 0
Washington 7.0 ±3.3
5.7 ±3.2
3.2 ±2.1
1.5 ±1.3
Trace
Wyoming 0 0 0 0 0
Nation 1.7 ±0.3
1.3 ±0.2
0.8 ±0.2
0.5 ±0.1
Trace
Note: Estimates where margins of error are at least as large as the estimates are denoted as
"Trace."

Table 9. Non-Federal rangeland where invasive bluegrass species are present and where they cover at least 5%, 15%, 30%, or 50% of the soil surface, by state, with margins of error.
State Present At least
5% At least
15%
At least
30%
At least
50%
Percent Percent Percent Percent Percent
Arizona 0 0 0 0 0
California Trace Trace Trace 0 0
Colorado 9.0 ±1.9
5.5 ±1.4
3.2 ±0.9
1.4 ±0.7
0.5 ±0.4
Florida 0 0 0 0 0
Idaho 15.2 ±3.4
10.5 ±2.7
5.5 ±2.3
2.2 ±1.9
Trace
Kansas 40.5 ±4.3
22.2 ±2.8
12.7 ±1.7
4.7 ±1.2
1.6 ±0.7
Louisiana 0 0 0 0 0
Montana 25.4 ±2.9
12.9 ±2.0
6.7 ±1.3
3.5 ±0.9
1.4 ±0.6
Nebraska 41.2 ±3.4
29.8 ±2.7
22.7 ±2.5
15.5 ±2.1
8.8 ±1.9
Nevada 1.9 ±1.6
0 0 0 0
New Mexico Trace Trace Trace Trace 0
North Dakota 81.6 ±2.3
68.0 ±3.7
55.0 ±3.9
44.7 ±4.1
32.6 ±3.7
Oklahoma Trace 0 0 0 0
Oregon 9.7 ±3.3
5.0 ±2.4
2.6 ±2.1
Trace Trace

South Dakota 60.7 ±3.7
45.9 ±3.4
35.2 ±3.5
26.4 ±2.7
19.4 ±2.5
Texas 0 0 0 0 0
Utah 6.7 ±3.0
2.7 ±1.6
1.2 ±1.1
Trace 0
Washington 4.7 ±2.2
1.7 ±1.3
Trace Trace Trace
Wyoming 11.0 ±2.6
5.9 ±1.5
3.1 ±1.2
1.8 ±0.8
0.7 ±0.5
Nation 13.8 ±0.5
9.2 ±0.3
6.4 ±0.3
4.3 ±0.2
2.7 ±0.2
Note: Estimates where margins of error are at least as large as the estimates are denoted as
"Trace."

Table 10. Non-Federal rangeland where invasive bluegrass species are present and where they make up at least 5%, 15%, 30%, or 50% of the relative plant canopy cover (composition), by state, with margins of error.
State Present At least
5% At least
15%
At least
30%
At least
50%
Percent Percent Percent Percent Percent
Arizona 0 0 0 0 0
California Trace Trace Trace 0 0
Colorado 9.0 ±1.9
5.7 ±1.4
3.1 ±1.0
0.7 ±0.5
Trace
Florida 0 0 0 0 0
Idaho 15.2 ±3.4
10.2 ±2.8
5.3 ±2.2
1.8 ±1.5
0
Kansas 40.5 ±4.3
17.3 ±2.3
5.7 ±1.4
0.7 ±0.4
0
Louisiana 0 0 0 0 0
Montana 25.4 ±2.9
13.1 ±2.2
5.2 ±1.0
1.8 ±0.6
Trace
Nebraska 41.2 ±3.4
28.6 ±2.8
18.2 ±2.3
9.2 ±1.8
0.9 ±0.5
Nevada 1.9 ±1.6
Trace 0 0 0
New Mexico Trace Trace Trace Trace 0
North Dakota 81.6 ±2.3
64.7 ±3.6
48.0 ±4.2
33.3 ±4.1
10.6 ±2.3
Oklahoma Trace 0 0 0 0
Oregon 9.7 ±3.3
5.0 ±2.6
2.6 ±2.0
1.1 ±0.9
Trace

South Dakota 60.7 ±3.7
43.2 ±3.5
29.7 ±3.1
20.8 ±2.5
8.5 ±1.8
Texas 0 0 0 0 0
Utah 6.7 ±3.0
3.1 ±1.6
1.4 ±1.2
Trace 0
Washington 4.7 ±2.2
1.9 ±1.4
1.1 ±0.9
Trace Trace
Wyoming 11.0 ±2.6
5.8 ±1.4
2.6 ±0.9
1.1 ±0.5
Trace
Nation 13.8 ±0.5
8.7 ±0.4
5.2 ±0.3
2.9 ±0.2
0.8 ±0.1
Note: Estimates where margins of error are at least as large as the estimates are denoted as
"Trace."

Table 11. Non-Federal rangeland where buffelgrass is present and where it covers at least 5%, 15%, 30%, or 50% of the soil surface, by state, with margins of error.
State Present At least
5% At least
15%
At least
30%
At least
50%
Percent Percent Percent Percent Percent
Arizona 0 0 0 0 0
California 0 0 0 0 0
Colorado 0 0 0 0 0
Florida 0 0 0 0 0
Idaho 0 0 0 0 0
Kansas 0 0 0 0 0
Louisiana 0 0 0 0 0
Montana 0 0 0 0 0
Nebraska 0 0 0 0 0
Nevada 0 0 0 0 0
New Mexico 0 0 0 0 0
North Dakota 0 0 0 0 0
Oklahoma 0 0 0 0 0
Oregon 0 0 0 0 0

South Dakota 0 0 0 0 0
Texas 3.4 ±0.8
2.3 ±0.6
1.6 ±0.5
1.0 ±0.5
0.5 ±0.4
Utah 0 0 0 0 0
Washington 0 0 0 0 0
Wyoming 0 0 0 0 0
Nation 0.8 ±0.2
0.5 ±0.2
0.4 ±0.1
0.2 ±0.1
Trace
Note: Estimates where margins of error are at least as large as the estimates are denoted as
"Trace."

Table 12. Non-Federal rangeland where buffelgrass is present and where it makes up at least 5%, 15%, 30%, or 50% of the relative plant canopy cover (composition), by state, with margins of error.
State Present At least
5% At least
15%
At least
30%
At least
50%
Percent Percent Percent Percent Percent
Arizona 0 0 0 0 0
California 0 0 0 0 0
Colorado 0 0 0 0 0
Florida 0 0 0 0 0
Idaho 0 0 0 0 0
Kansas 0 0 0 0 0
Louisiana 0 0 0 0 0
Montana 0 0 0 0 0
Nebraska 0 0 0 0 0
Nevada 0 0 0 0 0
New Mexico 0 0 0 0 0
North Dakota 0 0 0 0 0
Oklahoma 0 0 0 0 0
Oregon 0 0 0 0 0

South Dakota 0 0 0 0 0
Texas 3.4 ±0.8
2.5 ±0.7
1.6 ±0.5
1.0 ±0.5
0.5 ±0.4
Utah 0 0 0 0 0
Washington 0 0 0 0 0
Wyoming 0 0 0 0 0
Nation 0.8 ±0.2
0.6 ±0.2
0.4 ±0.1
0.2 ±0.1
Trace
Note: Estimates where margins of error are at least as large as the estimates are denoted as
"Trace."

Table 13. Non-Federal rangeland where halogeton is present and where it covers at least 5%, 15%, 30%, or 50% of the soil surface, by state, with margins of error.
State Present At least
5% At least
15%
At least
30%
At least
50%
Percent Percent Percent Percent Percent
Arizona Trace 0 0 0 0
California 0 0 0 0 0
Colorado Trace Trace Trace Trace 0
Florida 0 0 0 0 0
Idaho Trace Trace Trace Trace 0
Kansas 0 0 0 0 0
Louisiana 0 0 0 0 0
Montana Trace Trace Trace 0 0
Nebraska 0 0 0 0 0
Nevada 4.6 ±1.7
1.6 ±1.4
Trace 0 0
New Mexico Trace 0 0 0 0
North Dakota 0 0 0 0 0
Oklahoma 0 0 0 0 0
Oregon Trace 0 0 0 0

South Dakota 0 0 0 0 0
Texas Trace 0 0 0 0
Utah 7.7 ±2.5
3.9 ±2.0
1.2 ±1.0
Trace 0
Washington 0 0 0 0 0
Wyoming 2.2 ±1.2
Trace Trace 0 0
Nation 0.6 ±0.1
0.2 ±0.1
0.1 ±0.0
Trace 0
Note: Estimates where margins of error are at least as large as the estimates are denoted as
"Trace."

Table 14. Non-Federal rangeland where halogeton is present and where it makes up at least 5%, 15%, 30%, or 50% of the relative plant canopy cover (composition), by state, with margins of error.
State Present At least
5% At least
15%
At least
30%
At least
50%
Percent Percent Percent Percent Percent
Arizona Trace Trace Trace 0 0
California 0 0 0 0 0
Colorado Trace Trace Trace Trace Trace
Florida 0 0 0 0 0
Idaho Trace Trace Trace Trace Trace
Kansas 0 0 0 0 0
Louisiana 0 0 0 0 0
Montana Trace Trace Trace 0 0
Nebraska 0 0 0 0 0
Nevada 4.6 ±1.7
2.9 ±1.9
2.0 ±1.7
Trace Trace
New Mexico Trace Trace 0 0 0
North Dakota 0 0 0 0 0
Oklahoma 0 0 0 0 0
Oregon Trace 0 0 0 0
South Dakota 0 0 0 0 0
Texas Trace 0 0 0 0
Utah 7.7 ±2.5
5.5 ±2.1
4.2 ±2.1
2.8 ±1.6
1.1 ±0.9
Washington 0 0 0 0 0
Wyoming 2.2 ±1.2
1.1 ±0.8
Trace Trace 0
Nation 0.6 ±0.1
0.4 ±0.1
0.2 ±0.1
0.2 ±0.1
0.1 ±0.0
Note: Estimates where margins of error are at least as large as the estimates are denoted as
"Trace."

Table 15. Non-Federal rangeland where Centaurea species are present and where they cover at least 5%, 15%, 30%, or 50% of the soil surface, by state, with margins of error.
State Present At least
5% At least
15%
At least
30%
At least
50%
Percent Percent Percent Percent Percent
Arizona 0 0 0 0 0
California 12.8 ±3.6
6.0 ±2.6
3.3 ±2.3
Trace Trace
Colorado 1.2 ±0.6
Trace Trace Trace Trace
Florida 0 0 0 0 0
Idaho 1.6 ±1.2
1.2 ±1.1
1.2 ±1.1
Trace Trace
Kansas Trace 0 0 0 0
Louisiana 0 0 0 0 0
Montana 1.7 ±0.8
1.0 ±0.5
Trace
Trace Trace
Nebraska 0 0 0 0 0
Nevada Trace Trace 0 0 0
New Mexico Trace Trace Trace 0 0
North Dakota 0 0 0 0 0
Oklahoma 0 0 0 0 0
Oregon 2.5 ±1.7
0.9 ±0.8
Trace Trace Trace

South Dakota Trace 0 0 0 0
Texas Trace 0 0 0 0
Utah Trace Trace Trace Trace Trace
Washington 6.7 ±3.2
3.0 ±1.8
1.3 ±0.9
Trace Trace
Wyoming Trace Trace Trace Trace Trace
Nation 1.1 ±0.2
0.5 ±0.1
0.2 ±0.1
0.1 ±0.0
Trace
Note: Estimates where margins of error are at least as large as the estimates are denoted as
"Trace."

Table 16. Non-Federal rangeland where Centaurea species are present and where they make up at least 5%, 15%, 30%, or 50% of the relative plant canopy cover (composition), by state, with margins of error.
State Present At least
5% At least
15%
At least
30%
At least
50%
Percent Percent Percent Percent Percent
Arizona 0 0 0 0 0
California 12.8 ±3.6
6.3 ±2.5
2.5 ±2.1
Trace Trace
Colorado 1.2 ±0.6
0.5 ±0.4
Trace Trace Trace
Florida 0 0 0 0 0
Idaho 1.6 ±1.2
1.2 ±1.1
Trace Trace 0
Kansas Trace 0 0 0 0
Louisiana 0 0 0 0 0
Montana 1.7 ±0.8
0.9 ±0.5
0.5 ±0.4
Trace 0
Nebraska 0 0 0 0 0
Nevada Trace Trace 0 0 0
New Mexico Trace Trace Trace Trace Trace
North Dakota 0 0 0 0 0
Oklahoma 0 0 0 0 0
Oregon 2.5 ±1.7
1.1 ±0.9
Trace Trace Trace

South Dakota Trace 0 0 0 0
Texas Trace 0 0 0 0
Utah Trace Trace Trace Trace 0
Washington 6.7 ±3.2
2.9 ±1.7
1.4 ±1.0
Trace Trace
Wyoming Trace Trace Trace Trace 0
Nation 1.1 ±0.2
0.5 ±0.1
0.2 ±0.1
Trace Trace
Note: Estimates where margins of error are at least as large as the estimates are denoted as
"Trace."

Table 17. Non-Federal rangeland where Cirsium species are present and where they cover at least 5%, 15%, 30%, or 50% of the soil surface, by state, with margins of error.
State Present At least
5% At least
15%
At least
30%
At least
50%
Percent Percent Percent Percent Percent
Arizona 0 0 0 0 0
California Trace Trace Trace 0 0
Colorado 0.9 ±0.4
Trace 0 0 0
Florida 0 0 0 0 0
Idaho 3.0 ±1.6
0.7 ±0.6
Trace 0 0
Kansas 1.0 ±0.5
Trace 0 0 0
Louisiana 0 0 0 0 0
Montana 2.5 ±0.8
Trace 0 0 0
Nebraska 0.8 ±0.7
0 0 0 0
Nevada Trace 0 0 0 0
New Mexico 0.4 ±0.3
0 0 0 0
North Dakota 6.5 ±1.4
1.4 ±0.8
Trace 0 0
Oklahoma Trace 0 0 0 0
Oregon 1.6 ±1.3
Trace Trace 0 0

South Dakota 4.7 ±1.2
1.1 ±0.6
Trace Trace 0
Texas 0.2 ±0.1
0 0 0 0
Utah 1.2 ±1.0
Trace 0 0 0
Washington 1.3 ±0.9
Trace 0 0 0
Wyoming 1.5 ±0.7
Trace Trace 0 0
Nation 1.2 ±0.1
0.2 ±0.1
0.1 ±0.0
Trace 0
Note: Estimates where margins of error are at least as large as the estimates are denoted as
"Trace."

Table 18. Non-Federal rangeland where Cirsium species are present and where they make up at least 5%, 15%, 30%, or 50% of the relative plant canopy cover (composition), by state, with margins of error.
State
Present At least 5%
At least 15%
At least
30%
At least
50%
Percent Percent Percent Percent Percent
Arizona 0 0 0 0 0
California Trace Trace Trace 0 0
Colorado 0.9 ±0.4
Trace 0 0 0
Florida 0 0 0 0 0
Idaho 3.0 ±1.6
Trace Trace 0 0
Kansas 1.0 ±0.5
Trace 0 0 0
Louisiana 0 0 0 0 0
Montana 2.5 ±0.8
Trace 0 0 0
Nebraska 0.8 ±0.7
0 0 0 0
Nevada Trace 0 0 0 0
New Mexico 0.4 ±0.3
0 0 0 0
North Dakota 6.5 ±1.4
0.9 ±0.6
0 0 0
Oklahoma Trace 0 0 0 0
Oregon 1.6 ±1.3
Trace 0 0 0

South Dakota 4.7 ±1.2
0.8 ±0.5
Trace Trace 0
Texas 0.2 ±0.1
0 0 0 0
Utah 1.2 ±1.0
Trace 0 0 0
Washington 1.3 ±0.9
Trace 0 0 0
Wyoming 1.5 ±0.7
Trace 0 0 0
Nation 1.2 ±0.1
0.2 ±0.1
Trace Trace 0
Note: Estimates where margins of error are at least as large as the estimates are denoted as
"Trace."

Table 19. Non-Federal rangeland where leafy spurge is present and where it covers at least 5%, 15%, 30%, or 50% of the soil surface, by state, with margins of error.
State
Present At least 5%
At least 15%
At least 30%
At least 50%
Percent Percent Percent Percent Percent
Arizona 0 0 0 0 0
California 0 0 0 0 0
Colorado Trace 0 0 0 0
Florida 0 0 0 0 0
Idaho Trace 0 0 0 0
Kansas 0 0 0 0 0
Louisiana 0 0 0 0 0
Montana 1.7 ±0.7
1.0 ±0.6
0.4 ±0.3
Trace Trace
Nebraska 0.5 ±0.4
Trace Trace 0 0
Nevada 0 0 0 0 0
New Mexico 0 0 0 0 0
North Dakota 6.8 ±2.0
2.7 ±1.2
1.2 ±0.8
0.5 ±0.4
Trace
Oklahoma 0 0 0 0 0
Oregon 0 0 0 0 0

South Dakota 0.8 ±0.6
Trace Trace 0 0
Texas Trace 0 0 0 0
Utah Trace 0 0 0 0
Washington 0 0 0 0 0
Wyoming Trace Trace Trace Trace 0
Nation 0.5 ±0.1
0.2 ±0.1
0.1 ±0.0
Trace Trace
Note: Estimates where margins of error are at least as large as the estimates are denoted as
"Trace."

Table 20. Non-Federal rangeland where leafy spurge is present and where it makes up at least 5%, 15%, 30%, or 50% of the relative plant canopy cover (composition), by state, with margins of error.
State
Present At least 5%
At least 15%
At least 30%
At least 50%
Percent Percent Percent Percent Percent
Arizona 0 0 0 0 0
California 0 0 0 0 0
Colorado Trace 0 0 0 0
Florida 0 0 0 0 0
Idaho Trace 0 0 0 0
Kansas 0 0 0 0 0
Louisiana 0 0 0 0 0
Montana 1.7 ±0.7
1.1 ±0.6
Trace Trace Trace
Nebraska 0.5 ±0.4
Trace Trace 0 0
Nevada 0 0 0 0 0
New Mexico 0 0 0 0 0
North Dakota 6.8 ±2.0
2.0 ±1.1
Trace Trace Trace
Oklahoma 0 0 0 0 0
Oregon 0 0 0 0 0

South Dakota 0.8 ±0.6
Trace Trace 0 0
Texas Trace 0 0 0 0
Utah Trace 0 0 0 0
Washington 0 0 0 0 0
Wyoming Trace Trace Trace Trace 0
Nation 0.5 ±0.1
0.2 ±0.1
0.1 ±0.0
Trace Trace
Note: Estimates where margins of error are at least as large as the estimates are denoted as
"Trace."

About the Data
Estimates presented here are based upon rangeland data collected on-site as part of the
National Resources Inventory (NRI). Rangeland is defined by the NRI as a land cover/use
category on which the climax or potential plant cover is composed principally of native
grasses, grass-like plants, forbs, or shrubs suitable for grazing and browsing, and introduced
forage species that are managed like rangeland. This includes areas where introduced hardy
and persistent grasses, such as crested wheatgrass, are planted and such practices as
deferred grazing, burning, chaining, and rotational grazing are used, with little or no chemicals
or fertilizer being applied. Grasslands, savannas, many wetlands, some deserts, and tundra
are considered to be rangeland. Certain communities of low forbs and shrubs, such as
mesquite, chaparral, mountain shrub, and pinyon-juniper, are also included as rangeland.
These results are based upon NRI rangeland data collected in the field on rangeland during the
period 2004 to 2011. Current estimates cover non-Federal rangeland in 17 western states
(extending from North Dakota south to Texas and west) and to a limited extent in Florida and
Louisiana.
Findings are presented here for non-Federal rangeland where non-native plant species (as
defined by the NRCS Plants Database) are present and where at least 25 or 50 percent of the
plant canopy cover or relative plant canopy cover (composition) is composed of non-native
species. Additional information is provided for nine non-native invasive herbaceous species
groups. Findings are presented for non-Federal rangeland where plant species in those groups
are present and where at least 5, 15, 30 or 50 percent of the plant canopy cover or relative
plant canopy cover (composition) is composed of species in those groups:
• Annual bromes
• Cheatgrass
• Medusahead
• Invasive bluegrass
• Buffelgrass
• Halogeton
• Centaurea
• Cirsium
• Leafy spurge

Quality assurance and statistical procedures are designed/developed to ensure data are
scientifically legitimate. Irrespective of the scale of analysis, margins of error must be
considered. Margins of error (at the 95 percent confidence level) are presented for all NRI
estimates.
About the Line Point Intercept Protocol
Line point intercept data are utilized in summaries of non-native plant species, non-native
invasive herbaceous species, native invasive woody species, and bare ground. Line point
intercept data are collected along two intersecting 150-foot transects centered on each sample
location. Data collectors record plant species, litter, lichen, moss, rock fragment, bedrock,
and/or bare soil present at each 3-foot interval (mark).
About the Non-Native Plant Species Tables
The tables are constructed with NRI rangeland data collected in the field on rangeland during
the period 2004 to 2011. Tables summarize the percent of non-Federal land where the species
groups: (1) are present; (2) make up at least 5, 15, 30 or 50 percent of the plant canopy
cover; and (3) make up at least 5, 15, 30 or 50 percent of the relative plant canopy cover
(composition).
Presence is calculated as the percent of non-Federal rangeland where at least one of the
species is observed. Plant canopy cover represents the proportion of the soil surface covered
by an individual species. For each sample site, plant canopy cover is calculated as the percent
of marks at which a plant in the species group is observed. Relative plant canopy cover is an
indicator of species composition and is calculated for each sample site as the percent of foliar
observations that were in the species group.
About the Non-Native Plant Species Maps
The maps are constructed with NRI rangeland data collected in the field on rangeland during
the period 2004 to 2011. The regions are based on level IV ecoregion boundaries defined by
the U.S. Environmental Protection Agency Western Ecology Division
(http://www.epa.gov/wed/pages/ecoregions/level_iii_iv.htm). In some cases level IV
ecoregions were combined to include more sample sites. An additional category, referred to as
"Insufficient point count (35 or less)", represents areas where there were too few data points.

Regions without non-Federal rangeland are described as "No on-site rangeland samples".
Areas of Federal land are depicted with cross-hatching.
Non-native plant species maps are displayed by classes (none, 25% or less, 25-50%, 50-75%,
over 75%) of non-Federal rangeland where non-native plant species are present or where they
compose at least 25 or 50 percent of the plant cover.
Additional maps for non-native invasive herbaceous species groups are displayed by classes
(none, 1% or less, 1-5%, 5-20%, over 20%) of non-Federal rangeland where these non-
native invasive species groups are present.
Literature Cited
Archer, S.R., K.W. Davies, T. E. Fulbright, K.C. McDaniel, B.P. Wilcox, and K.I. Predick. 2010.
Brush Management as a Rangeland Conservation Tool: A Critical Evaluation. In: Briske, D.D.,
editor. 2011. Conservation Benefits of Rangeland Practices: Assessment, Recommendations,
and Knowledge Gaps. United States Department of Agriculture, Natural Resources
Conservation Service.
(http://www.nrcs.usda.gov/wps/portal/nrcs/detail/national/technical/nra/ceap/?cid=stelprdb1
045811 (last accessed 05/22/2014).
Daly, C., D. Bachelet, J. Lenihan, R. Neilson, W. Parton, and D. Ojima. 2000. Dynamic
simulation of tree-grass interactions for global change studies. Ecological Applications. 10(2):
449-469.
Gillette, D.A. and A.M. Pitchford. 2004. Sand flux in the northern Chihuahuan desert, New
Mexico, USA, and the influence of mesquite-dominated landscapes. Journal of Geophysical
Research, [Earth Surface]. 109, F04003, doi:10.1029/2003JF000031.
Houghton, R.A., J.L. Hackler, K.T. Lawrence. 1999. The U.S. carbon budget: Contributions
from land-use change. Science. 285(5427):574-578.
Marvin, D.C., B.A. Bradley, AND D.S. Wilcove. 2009. A novel, web-based ecosystem mapping tool using expert opinion. Natural Areas Journal 29:281–292.

Richard N. Mack, Daniel Simberloff, W. Mark Lonsdale, Harry Evans, Michael Clout, and Fakhri A. Bazzaz
2000. BIOTIC INVASIONS: CAUSES, EPIDEMIOLOGY, GLOBAL CONSEQUENCES, AND CONTROL.
Ecological Applications 10:689–710. http://dx.doi.org/10.1890/1051-0761(2000)010[0689:BICEGC]2.0.CO;2
Sheley, R.L., J.J. James, M.J. Rinella, D. Blumenthal, and J.M. DiTomaso. 2011. Invasive Plant
Management on Anticipated Conservation Benefits: A Scientific Assessment, pp. 291-336. In:
Briske, D.D., editor. 2011. Conservation Benefits of Rangeland Practices: Assessment,
Recommendations, and Knowledge Gaps. United States Department of Agriculture, Natural
Resources Conservation Service.
http://www.nrcs.usda.gov/wps/portal/nrcs/detail/national/technical/nra/ceap/?cid=stelprdb10
4581120 (last accessed 05/22/2014).
Schimel, D., J. Melillo, H. Tian, A.D. McGuire, D. Kicklighter, T. Kittel, N. Rosenbloom, S.
Running, P. Thornton, D. Ojima, W. Parton, R. Kelly, M. Sykes, R. Neilson, and B. Rizzo. 2004.
Contribution of Increasing CO2 and Climate to Carbon Storage by Ecosystems in the United
States. Science 287 (5460) [DOI: 10.1126/science.287.5460.2004]
More Information
More information about the USDA Plants Database may be found at http://plants.usda.gov/.
Related journal article: National Ecosystem Assessments Supported by Scientific and Local
Knowledge, Frontiers in Ecology and the Environment, October 2010
Send comments and questions to the NRI Help Desk