Embed Size (px)
Citation preview
Non-Nuclear, Low-Carbon, or Both? The Case of Taiwan
Y.H. Henry Chen
Report No. 235December 2012
The MIT Joint Program on the Science and Policy of Global Change is an organization for research, independent policy analysis, and public education in global environmental change. It seeks to provide leadership in understanding scientific, economic, and ecological aspects of this difficult issue, and combining them into policy assessments that serve the needs of ongoing national and international discussions. To this end, the Program brings together an interdisciplinary group from two established research centers at MIT: the Center for Global Change Science (CGCS) and the Center for Energy and Environmental Policy Research (CEEPR). These two centers bridge many key areas of the needed intellectual work, and additional essential areas are covered by other MIT departments, by collaboration with the Ecosystems Center of the Marine Biology Laboratory (MBL) at Woods Hole, and by short- and long-term visitors to the Program. The Program involves sponsorship and active participation by industry, government, and non-profit organizations.
To inform processes of policy development and implementation, climate change research needs to focus on improving the prediction of those variables that are most relevant to economic, social, and environmental effects. In turn, the greenhouse gas and atmospheric aerosol assumptions underlying climate analysis need to be related to the economic, technological, and political forces that drive emissions, and to the results of international agreements and mitigation. Further, assessments of possible societal and ecosystem impacts, and analysis of mitigation strategies, need to be based on realistic evaluation of the uncertainties of climate science.
This report is one of a series intended to communicate research results and improve public understanding of climate issues, thereby contributing to informed debate about the climate issue, the uncertainties, and the economic and social implications of policy alternatives. Titles in the Report Series to date are listed on the inside back cover.
Ronald G. Prinn and John M. ReillyProgram Co-Directors
For more information, please contact the Joint Program Office Postal Address: Joint Program on the Science and Policy of Global Change 77 Massachusetts Avenue MIT E19-411 Cambridge MA 02139-4307 (USA) Location: 400 Main Street, Cambridge Building E19, Room 411 Massachusetts Institute of Technology Access: Phone: +1.617. 253.7492 Fax: +1.617.253.9845 E-mail: [email protected] Web site: http://globalchange.mit.edu/
Printed on recycled paper
1
Non-Nuclear, Low-Carbon, or Both? The Case of Taiwan
Y.-H. Henry Chen*
Abstract
The Fukushima nuclear accident in Japan has renewed debates on the safety of nuclear power, possibly hurting the role of nuclear power in efforts to limit CO2 emissions. I develop a dynamic economy-wide model of Taiwan with a detailed set of technology options in the power sector to examine the implications of adopting different nuclear power policies on CO2 emissions and the economy. Absent a carbon mitigation target, limiting nuclear power has a small economic cost for Taiwan, but CO2 emissions may increase by more than 3.5% by 2035 when nuclear is replaced by fossil-based generation. With a low-carbon target of a 50% reduction from year 2000 levels by 2050, if the nuclear option and carbon sequestration are not viable, gas-fired power would provide almost 90% of electricity output due to the limited renewable resources. In particular, wind power would account for 1.6% to 4.9% of that output, depending on how it relies on other back-up capacities. With both non-nuclear and low-carbon policies, deploying carbon sequestration on fossil-based generation can significantly reduce the negative GDP impact on the economy. Lastly, lowering carbon mitigation costs further is possible with expanded nuclear capacity.
Contents
1. INTRODUCTION ................................................................................................................... 1 2. ENERGY AND POLICY BACKGROUND OF TAIWAN .................................................... 3 3. THE MODEL .......................................................................................................................... 6
3.1 Basic Structure ............................................................................................................... 6 3.2 Dynamic Settings ........................................................................................................... 9 3.3 Strategy in Modeling Electricity Sectors ........................................................................ 9
4. DATA .................................................................................................................................... 11 5. POLICY IMPACTS .............................................................................................................. 14
5.1 Scenarios ...................................................................................................................... 14 5.2 Business-As-Usual Projection ...................................................................................... 14 5.3 GDP Impact .................................................................................................................. 15 5.4 Additional CO2 Emissions of Non-Nuclear Scenario ................................................... 16 5.5 Carbon Price ................................................................................................................. 17 5.6 Sectoral Impact ............................................................................................................. 18 5.7 Changes in Net Exports and the Implication for Carbon Leakage ............................... 19 5.8 Electricity Sector and Sensitivity Analyses .................................................................. 20
6. CONCLUSIONS ................................................................................................................... 24 7. REFERENCES ...................................................................................................................... 26
1. INTRODUCTION
Concern about global warming seems to make nuclear power an attractive option. The Fukushima nuclear accident in Japan, however, has renewed the debate on the safety of nuclear power, possibly hurting the role of nuclear power in efforts to limit CO2 emissions. For instance, Japan has decided to increase its renewable energy supply and abandon the expansion of nuclear industry, and Germany will shut all nuclear reactors by 2022 (Fackler, 2011; Mcgroarty and Fuhrmans, 2011).
* Joint Program on the Science and Policy of Global Change, Massachusetts Institute of Technology. 77
Massachusetts Ave, E19-429N. Cambridge, MA 02139-4307. Email: [email protected]. Tel: 1-(617)-715-5432.
2
In Taiwan, the ongoing nuclear power project is intensely debated as well. Because of safety concerns and challenges in finding repository sites for nuclear waste, many people are urging the government to stop building the Longmen Nuclear Power Station. The concern persists, even after the government announced that Longmen will be Taiwan’s fourth and last nuclear power project. On the other hand, others argue that the nuclear option should be kept since it is a viable approach to curb CO2 emissions effectively without reducing electricity supply. This is especially important for Taiwan since, because of resource constraints, the role of renewable power sources may remain insignificant. While more and more countries try to cut CO2 emissions to reduce the threat of global warming, we still have limited understanding about the potential effects of pursuing low-carbon growth with or without the nuclear option. Thus, an economy-wide analysis that studies the role of nuclear power in pursuing a low-carbon economy is crucial, especially for a small economy such as Taiwan, which lacks natural resources and must import most of its energy supply. Until now, existing studies have found that nuclear power is an effective tool to curb CO2 emissions from the power sector, especially in the long run (Wang et al., 2011; Yang, 2011; Bensmann, 2010; Yun and Baker, 2009; Mori, 2000). They do not, however, analyze cases where nuclear power is no longer an option. One exception is Mori (2000), which found that limiting CO2 emissions without nuclear power expansion requires a higher level of carbon sequestration implementation and would incur a greater negative impact on global GDP. Nevertheless, higher resolutions on regions and sectors are not presented in the research. A number of studies, on the other hand, examined energy and nuclear policies in Taiwan separately (Lin, 1997; Hsu et al., 1998; Huang, 2000; Liang and Kuo, 2003; Huang, 2007; Lin and Su, 2008; Liang, 2008; Yang, 2009; and Ko et al., 2010). None of the research, however, has presented a framework that can simultaneously assess the potential effects of pursuing a non-nuclear and low-carbon growth scenario. While other studies have explored CO2 reduction impacts on different sectors or technologies (Bureau, 2011; Chen et al., 2011; Karplus et al., 2009; McFarland, 2009), the interaction between non-nuclear option and low-carbon policy is beyond their research scopes. To fill this gap, this study takes Taiwan as an example and explores the policy implications of pursuing low-carbon growth with or without the nuclear option. With the low-carbon policy, Taiwan will eventually cut its CO2 emissions to 50% of 2000 levels by 2050. Under the non-nuclear policy, while the existing three nuclear power plants of Taiwan will continue to operate until the end of their lives in 2020s, the coming nuclear power plant under construction will never be allowed to join the grid. In addition, under the low-carbon policy, a counterfactual scenario that allows further expansion of nuclear power beyond the government’s plan will also be discussed. This study will answer the following questions: (1) what will be the economic implications of carrying out the low-carbon policy with or without the nuclear option; and (2) what will be the roles of various generation technologies under different policy scenarios? To conduct the analysis, a multi-sector recursive dynamic general equilibrium model is built. The model takes
3
into account the optimized behaviors of distinct producers and a representative household, and their interactions through various market transactions. This study also disaggregates the electricity sector into six sub-sectors to account for the diversified carbon footprints of various generation technologies, and to represent the cost of CO2 reduction, it considers a hypothetical carbon tax that covers all combustion CO2 emissions, which constitute about 96% and 88% of Taiwan’s total CO2 emissions and GHG emissions as of 2008, respectively (EPA, 2009).1 Further, this study presents a new approach that improves the modeling for the relationship between dispatchable generation (gas and hydro power for instance) and non-dispatchable generation (wind power in particular). The rest of this study is organized as follows: Section 2 provides the energy and policy background of Taiwan; Section 3 describes model settings and the strategy of modeling dispatchable and non-dispatchable electricity generation; Section 4 presents the economic, demographic, technological, and emissions data used in this study; Section 5 explores the economy-wide effects of various policies; and Section 6 provides conclusions, which summarize contributions of this study and discuss future research directions.
2. ENERGY AND POLICY BACKGROUND OF TAIWAN
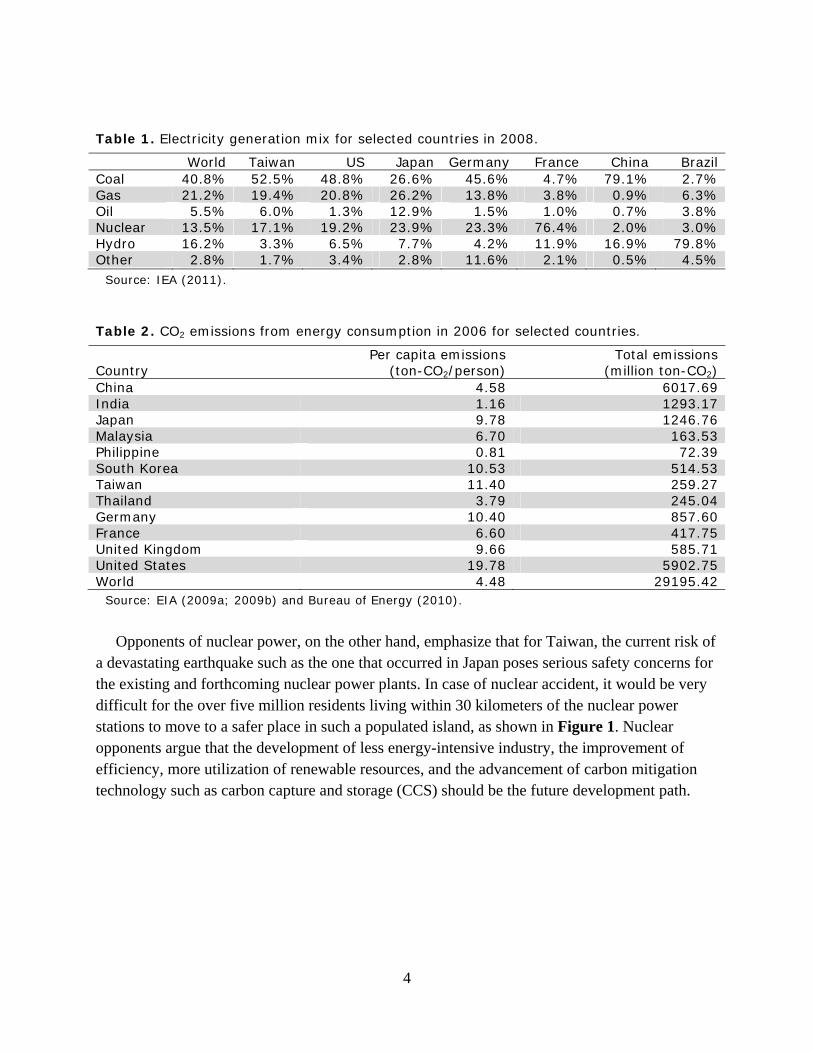
Taiwan currently imports 99% of its energy supply (Bureau of Energy, 2011a). In addition to encouraging energy saving measures, the government has tried to promote the use of different energy types and to diversify energy imports sources. For the electricity sector, as of 2008, coal-fired, gas-fired, oil-fired, nuclear, and hydro-powered generation accounted for roughly 52.5%, 19.4%, 6.0%, 17.1%, and 3.3% of the total electricity supply, respectively, as shown in Table 1. At this time, the government was expanding the country’s nuclear power capacity by building the Longmen Nuclear Power Station, now in the last construction phase (Bureau of Energy, 2011b; The Nuclear Association of Taiwan, 2011). With a capacity of 2750 MWe, the plant would need only 80 tons of uranium feedstock in a year to generate the same amount of electricity as 515 million tons of coal or 143 million tons of natural gas (The New Taipei City Government, 2011).2 The government has set a target of reducing total CO2 emissions to the 2005 and 2000 levels by 2020, and 2025, respectively, and finally cutting emissions to the half of 2000 levels by 2050 (Environmental Protection Administration, 2012). Nuclear power proponents assert that nuclear power is a feasible way to curb CO2 emissions in Taiwan, which have more than doubled in the last two decades and have made Taiwan become one of the highest per capita CO2 emissions countries in Asia, as shown in Table 2. They argue that without the nuclear option, achieving the emissions reduction target would be next to impossible.
1 The hypothetical carbon tax requires individuals to internalize the cost of emissions imposed on others and on
future generation (Metcalf and Weisbach, 2009). In particular, the larger tax base ensures a less distortionary impact on resource allocation and thus avoids overestimating the economic burden of cutting emissions.
2 As a result, even at the highest historical uranium price level at $136 per pound in 2007 (Scott, 2011), the fuel cost of a nuclear power plant still constitutes a minor part of its production cost compared to fossil-based power plants.
4
Table 1. Electricity generation mix for selected countries in 2008.
World Taiwan US Japan Germany France China Brazil Coal 40.8% 52.5% 48.8% 26.6% 45.6% 4.7% 79.1% 2.7% Gas 21.2% 19.4% 20.8% 26.2% 13.8% 3.8% 0.9% 6.3% Oil 5.5% 6.0% 1.3% 12.9% 1.5% 1.0% 0.7% 3.8% Nuclear 13.5% 17.1% 19.2% 23.9% 23.3% 76.4% 2.0% 3.0% Hydro 16.2% 3.3% 6.5% 7.7% 4.2% 11.9% 16.9% 79.8% Other 2.8% 1.7% 3.4% 2.8% 11.6% 2.1% 0.5% 4.5%
Source: IEA (2011).
Table 2. CO2 emissions from energy consumption in 2006 for selected countries.
Country Per capita emissions
(ton-CO2/person) Total emissions
(million ton-CO2) China 4.58 6017.69 India 1.16 1293.17 Japan 9.78 1246.76 Malaysia 6.70 163.53 Philippine 0.81 72.39 South Korea 10.53 514.53 Taiwan 11.40 259.27 Thailand 3.79 245.04 Germany 10.40 857.60 France 6.60 417.75 United Kingdom 9.66 585.71 United States 19.78 5902.75 World 4.48 29195.42
Source: EIA (2009a; 2009b) and Bureau of Energy (2010).
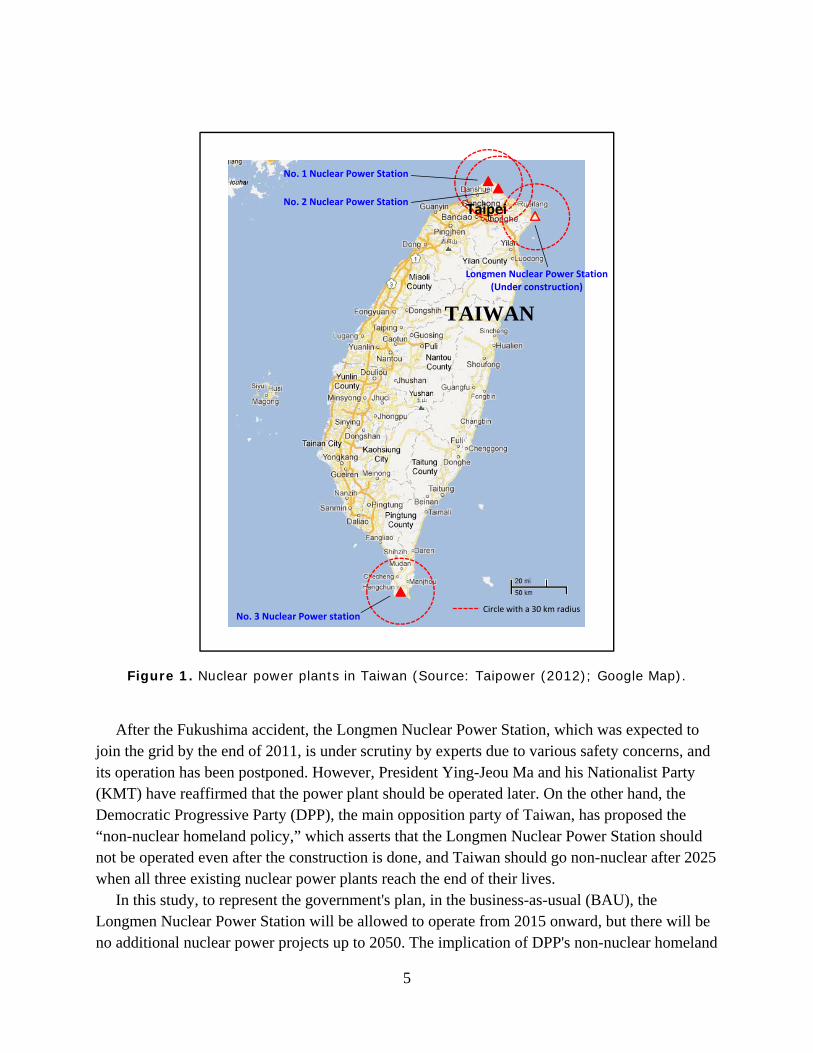
Opponents of nuclear power, on the other hand, emphasize that for Taiwan, the current risk of a devastating earthquake such as the one that occurred in Japan poses serious safety concerns for the existing and forthcoming nuclear power plants. In case of nuclear accident, it would be very difficult for the over five million residents living within 30 kilometers of the nuclear power stations to move to a safer place in such a populated island, as shown in Figure 1. Nuclear opponents argue that the development of less energy-intensive industry, the improvement of efficiency, more utilization of renewable resources, and the advancement of carbon mitigation technology such as carbon capture and storage (CCS) should be the future development path.
5
Figure 1. Nuclear power plants in Taiwan (Source: Taipower (2012); Google Map).
After the Fukushima accident, the Longmen Nuclear Power Station, which was expected to join the grid by the end of 2011, is under scrutiny by experts due to various safety concerns, and its operation has been postponed. However, President Ying-Jeou Ma and his Nationalist Party (KMT) have reaffirmed that the power plant should be operated later. On the other hand, the Democratic Progressive Party (DPP), the main opposition party of Taiwan, has proposed the “non-nuclear homeland policy,” which asserts that the Longmen Nuclear Power Station should not be operated even after the construction is done, and Taiwan should go non-nuclear after 2025 when all three existing nuclear power plants reach the end of their lives. In this study, to represent the government's plan, in the business-as-usual (BAU), the Longmen Nuclear Power Station will be allowed to operate from 2015 onward, but there will be no additional nuclear power projects up to 2050. The implication of DPP's non-nuclear homeland
Taipei
No. 1 Nuclear Power Station
No. 3 Nuclear Power station
Longmen Nuclear Power Station (Under construction)
Circle with a 30 km radius
TAIWAN
No. 2 Nuclear Power Station
6
policy with or without the carbon mitigation target also will be considered. Finally, the potential role of CCS and nuclear power in cutting the cost of carbon reduction will be discussed.
3. THE MODEL
The multi-sector recursive dynamic general equilibrium model built for this study belongs to the class of Arrow-Debreu model, which assumes markets are perfectly competitive, and the utility function is strictly concave and twice continuously differentiable to ensure the existence and uniqueness of the solution (Arrow and Debreu, 1954). The model is formulated in a series of mixed complementary problems (MCP) (Mathiesen, 1985) using the MPSGE modeling language (Rutherford, 1999). The base year is 2006, and from 2010 onward, it is solved at five-year intervals up to 2050.
3.1 Basic Structure
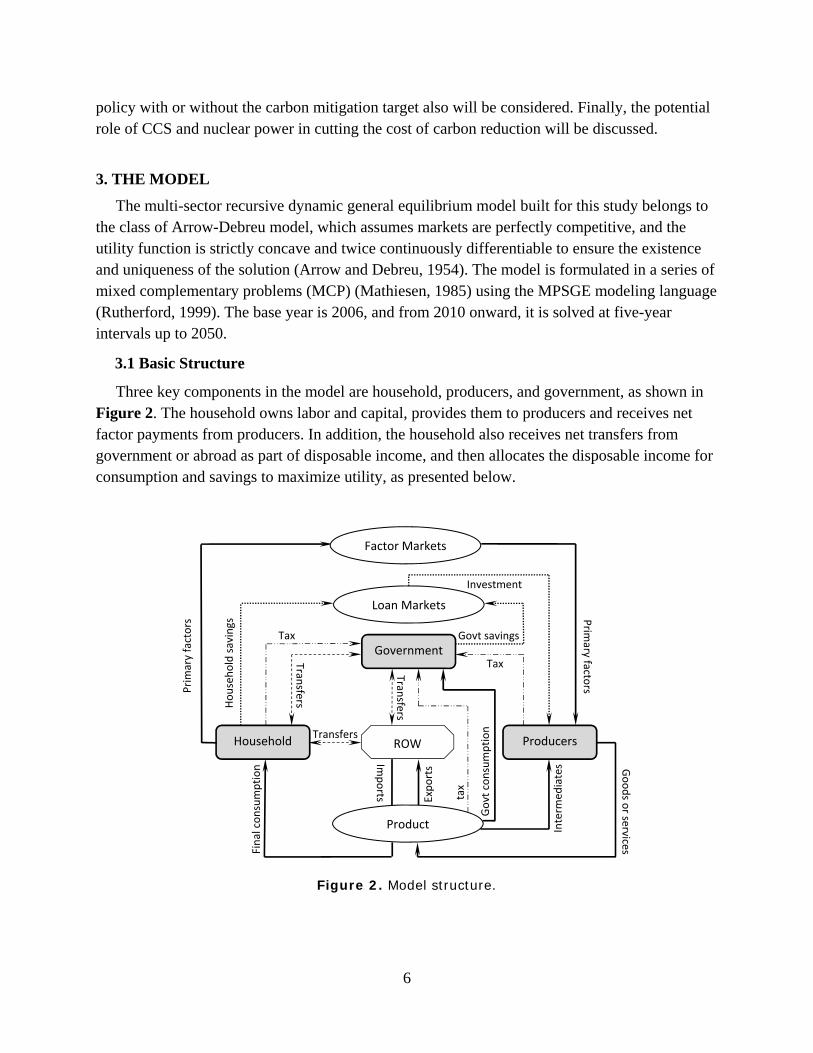
Three key components in the model are household, producers, and government, as shown in Figure 2. The household owns labor and capital, provides them to producers and receives net factor payments from producers. In addition, the household also receives net transfers from government or abroad as part of disposable income, and then allocates the disposable income for consumption and savings to maximize utility, as presented below.
Figure 2. Model structure.
Final consumption
Primary factors P
rimary facto
rs
Goods o
r services
Interm
ediates
Exports
Imports
Govt consumption
Tax
Government
Product
Loan Markets
Household savings
Govt savings
Investment
Household Producers
Transfers
TaxTransfers
Transfers
tax
ROW
Factor Markets
7
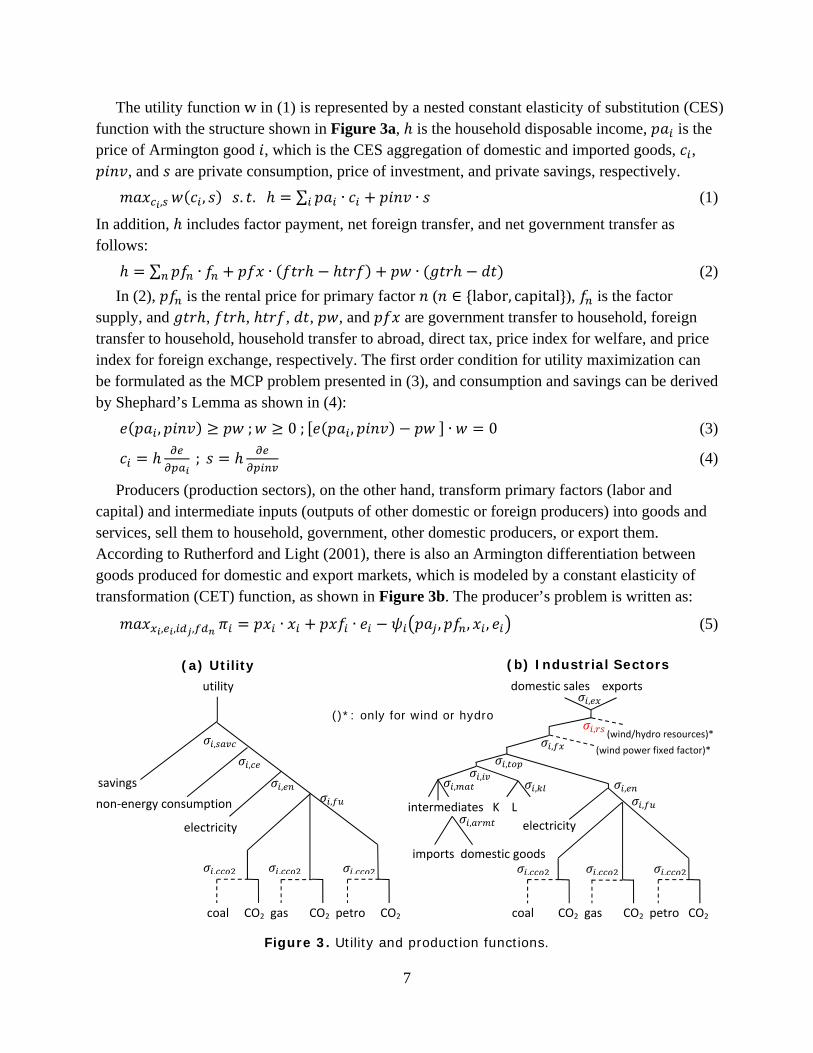
The utility function w in (1) is represented by a nested constant elasticity of substitution (CES) function with the structure shown in Figure 3a, is the household disposable income, is the price of Armington good , which is the CES aggregation of domestic and imported goods, ,
, and are private consumption, price of investment, and private savings, respectively.
, , . . ∑ ∙ ∙ (1)
In addition, includes factor payment, net foreign transfer, and net government transfer as follows:
∑ ∙ ∙ ∙ (2)
In (2), is the rental price for primary factor ( ∈ labor, capital ), is the factor supply, and , , , , , and are government transfer to household, foreign transfer to household, household transfer to abroad, direct tax, price index for welfare, and price index for foreign exchange, respectively. The first order condition for utility maximization can be formulated as the MCP problem presented in (3), and consumption and savings can be derived by Shephard’s Lemma as shown in (4):
, ; 0; , ∙ 0 (3)
; (4)
Producers (production sectors), on the other hand, transform primary factors (labor and capital) and intermediate inputs (outputs of other domestic or foreign producers) into goods and services, sell them to household, government, other domestic producers, or export them. According to Rutherford and Light (2001), there is also an Armington differentiation between goods produced for domestic and export markets, which is modeled by a constant elasticity of transformation (CET) function, as shown in Figure 3b. The producer’s problem is written as:
, , , ∙ ∙ , , , (5)
Figure 3. Utility and production functions.
(a) Utility
savings
non‐energy consumption
electricity
utility
,
,
,
,
domestic sales exports
(b) Industrial Sectors
,
,
intermediates K L
,
,
,
electricity
coal CO2 gas CO2 petro CO2
, (wind power fixed factor)*
,
, , ,, , ,
coal CO2 gas CO2 petro CO2
,
imports domestic goods
,
(wind/hydro resources)*,
()*: only for wind or hydro
8
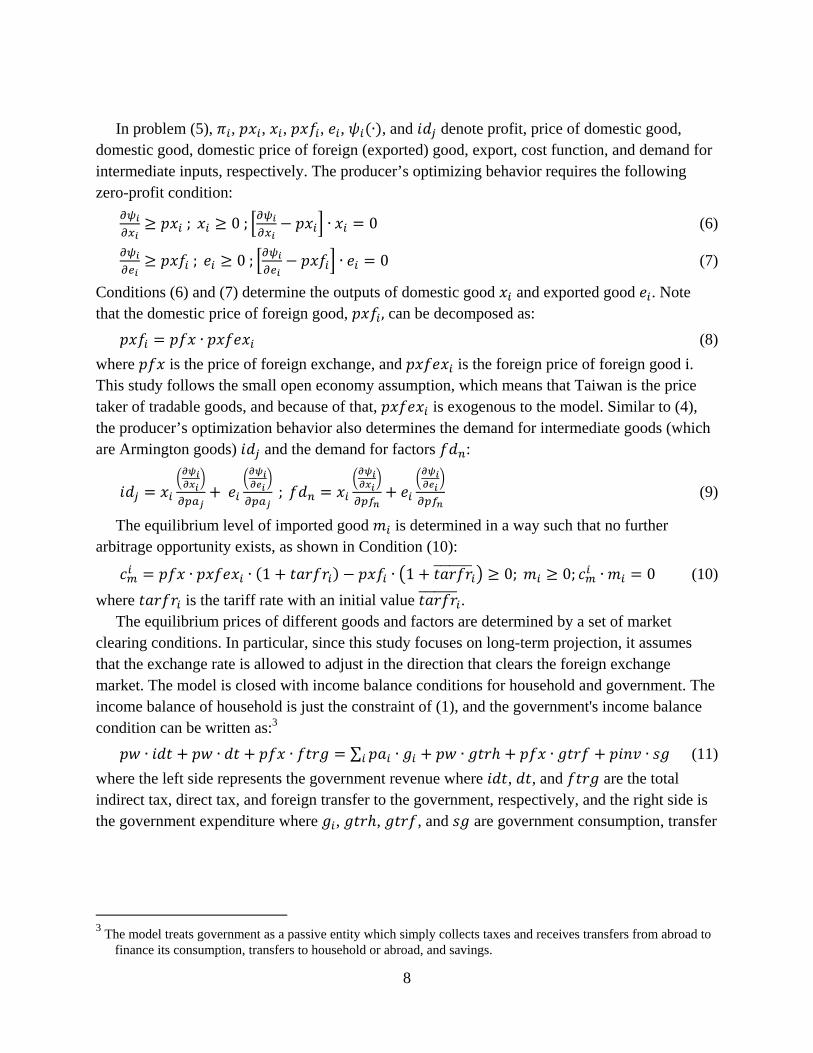
In problem (5), , , , , , ∙ , and denote profit, price of domestic good, domestic good, domestic price of foreign (exported) good, export, cost function, and demand for intermediate inputs, respectively. The producer’s optimizing behavior requires the following zero-profit condition:
; 0; ∙ 0 (6)
; 0; ∙ 0 (7)
Conditions (6) and (7) determine the outputs of domestic good and exported good . Note that the domestic price of foreign good, , can be decomposed as:
∙ (8)
where is the price of foreign exchange, and is the foreign price of foreign good i. This study follows the small open economy assumption, which means that Taiwan is the price taker of tradable goods, and because of that, is exogenous to the model. Similar to (4), the producer’s optimization behavior also determines the demand for intermediate goods (which are Armington goods) and the demand for factors :
; (9)
The equilibrium level of imported good is determined in a way such that no further arbitrage opportunity exists, as shown in Condition (10):
∙ ∙ 1 ∙ 1 0; 0; ∙ 0 (10)
where is the tariff rate with an initial value . The equilibrium prices of different goods and factors are determined by a set of market clearing conditions. In particular, since this study focuses on long-term projection, it assumes that the exchange rate is allowed to adjust in the direction that clears the foreign exchange market. The model is closed with income balance conditions for household and government. The income balance of household is just the constraint of (1), and the government's income balance condition can be written as:3
∙ ∙ ∙ ∑ ∙ ∙ ∙ ∙ (11)
where the left side represents the government revenue where , , and are the total indirect tax, direct tax, and foreign transfer to the government, respectively, and the right side is the government expenditure where , , , and are government consumption, transfer
3 The model treats government as a passive entity which simply collects taxes and receives transfers from abroad to
finance its consumption, transfers to household or abroad, and savings.
9
to household, transfer to abroad, and government savings, respectively. Finally, , the Hicksian welfare index, is chosen to be the numeraire of the model.4
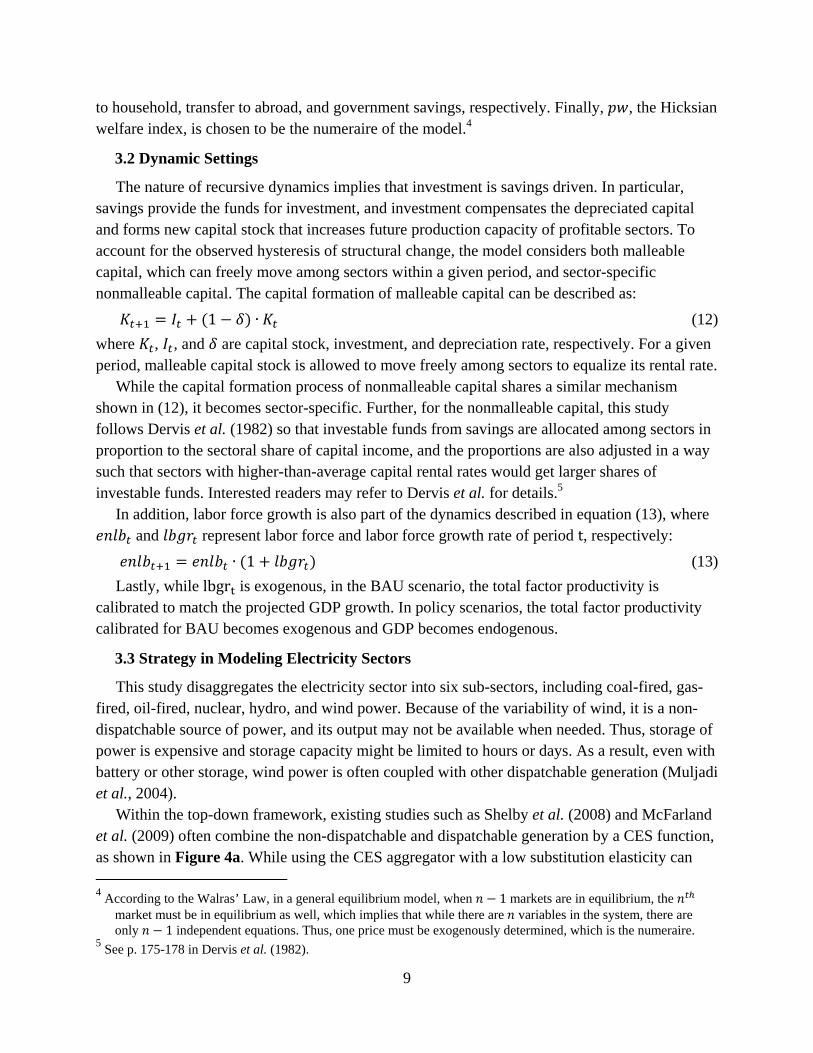
3.2 Dynamic Settings
The nature of recursive dynamics implies that investment is savings driven. In particular, savings provide the funds for investment, and investment compensates the depreciated capital and forms new capital stock that increases future production capacity of profitable sectors. To account for the observed hysteresis of structural change, the model considers both malleable capital, which can freely move among sectors within a given period, and sector-specific nonmalleable capital. The capital formation of malleable capital can be described as:
1 ∙ (12)
where , , and are capital stock, investment, and depreciation rate, respectively. For a given period, malleable capital stock is allowed to move freely among sectors to equalize its rental rate. While the capital formation process of nonmalleable capital shares a similar mechanism shown in (12), it becomes sector-specific. Further, for the nonmalleable capital, this study follows Dervis et al. (1982) so that investable funds from savings are allocated among sectors in proportion to the sectoral share of capital income, and the proportions are also adjusted in a way such that sectors with higher-than-average capital rental rates would get larger shares of investable funds. Interested readers may refer to Dervis et al. for details.5 In addition, labor force growth is also part of the dynamics described in equation (13), where
and represent labor force and labor force growth rate of period t, respectively:
∙ 1 (13)
Lastly, while lbgr is exogenous, in the BAU scenario, the total factor productivity is calibrated to match the projected GDP growth. In policy scenarios, the total factor productivity calibrated for BAU becomes exogenous and GDP becomes endogenous.
3.3 Strategy in Modeling Electricity Sectors
This study disaggregates the electricity sector into six sub-sectors, including coal-fired, gas-fired, oil-fired, nuclear, hydro, and wind power. Because of the variability of wind, it is a non-dispatchable source of power, and its output may not be available when needed. Thus, storage of power is expensive and storage capacity might be limited to hours or days. As a result, even with battery or other storage, wind power is often coupled with other dispatchable generation (Muljadi et al., 2004). Within the top-down framework, existing studies such as Shelby et al. (2008) and McFarland et al. (2009) often combine the non-dispatchable and dispatchable generation by a CES function, as shown in Figure 4a. While using the CES aggregator with a low substitution elasticity can 4 According to the Walras’ Law, in a general equilibrium model, when 1 markets are in equilibrium, the
market must be in equilibrium as well, which implies that while there are variables in the system, there are only 1 independent equations. Thus, one price must be exogenously determined, which is the numeraire.
5 See p. 175-178 in Dervis et al. (1982).
10
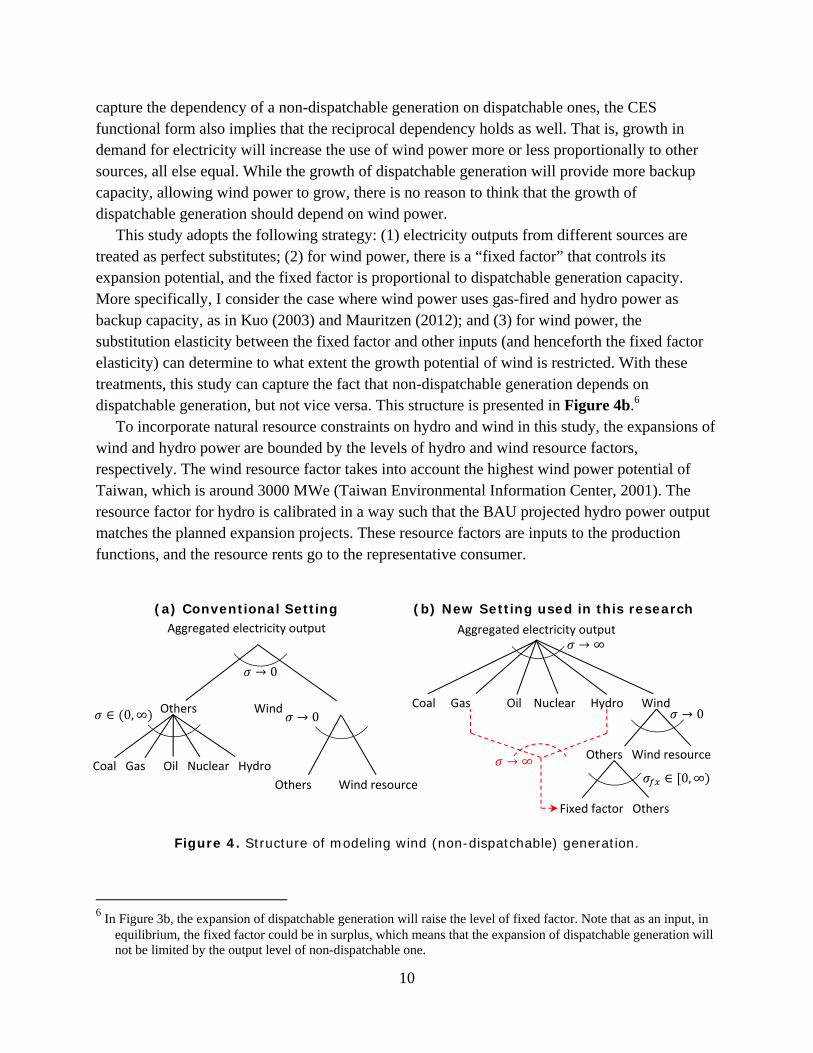
capture the dependency of a non-dispatchable generation on dispatchable ones, the CES functional form also implies that the reciprocal dependency holds as well. That is, growth in demand for electricity will increase the use of wind power more or less proportionally to other sources, all else equal. While the growth of dispatchable generation will provide more backup capacity, allowing wind power to grow, there is no reason to think that the growth of dispatchable generation should depend on wind power. This study adopts the following strategy: (1) electricity outputs from different sources are treated as perfect substitutes; (2) for wind power, there is a “fixed factor” that controls its expansion potential, and the fixed factor is proportional to dispatchable generation capacity. More specifically, I consider the case where wind power uses gas-fired and hydro power as backup capacity, as in Kuo (2003) and Mauritzen (2012); and (3) for wind power, the substitution elasticity between the fixed factor and other inputs (and henceforth the fixed factor elasticity) can determine to what extent the growth potential of wind is restricted. With these treatments, this study can capture the fact that non-dispatchable generation depends on dispatchable generation, but not vice versa. This structure is presented in Figure 4b.6 To incorporate natural resource constraints on hydro and wind in this study, the expansions of wind and hydro power are bounded by the levels of hydro and wind resource factors, respectively. The wind resource factor takes into account the highest wind power potential of Taiwan, which is around 3000 MWe (Taiwan Environmental Information Center, 2001). The resource factor for hydro is calibrated in a way such that the BAU projected hydro power output matches the planned expansion projects. These resource factors are inputs to the production functions, and the resource rents go to the representative consumer.
Figure 4. Structure of modeling wind (non-dispatchable) generation.
6 In Figure 3b, the expansion of dispatchable generation will raise the level of fixed factor. Note that as an input, in
equilibrium, the fixed factor could be in surplus, which means that the expansion of dispatchable generation will not be limited by the output level of non-dispatchable one.
(a) Conventional Setting Aggregated electricity output
(b) New Setting used in this research
Others Wind
→ 0
Others Wind resource
→ ∞ Aggregated electricity output
Coal Gas Oil Nuclear Hydro Wind → 0
Coal Gas Oil Nuclear Hydro
∈ 0,∞
→ ∞
Fixed factor Others
∈ 0,∞ Others Wind resource
→ 0
11
4. DATA
The data needed for the analysis include: (1) the input-output and national accounting data, which describe the base year economy-wide production and consumption structures; (2) labor force growth projection; (3) the BAU real GDP growth projection; (4) the sectoral energy consumption and the associated CO2 emissions from combustion; (5) the substitution elasticities characterizing how different inputs can be replaced by others when relative prices change; (6) the output projection of the electricity sector, which also determines the growth potential of each generation technology; (7) the autonomous energy efficiency improvement (AEEI) coefficient, which represents the non-price driven energy efficiency improvement over time; (8) the world price levels for different commodities; and (9) the cost and effectiveness of CCS. This study classifies the industry into four energy supply sectors and thirteen other industrial sectors, as presented in Table 3. In addition to disaggregating the electricity sector, sectors that fall into the following categories are separated out from others: (1) energy-intensive sectors such as transportation, iron, and chemical industries; and (2) sectors that account for higher shares of GDP, such as electronic and computer, and service sectors.
Table 3. Industrial sectors in the model.
Energy supply sectors Other industrial sectors 1 Gas 5 Agriculture 2 Coal 6 Food, alcohol & tobacco 3 Petroleum 7 Textile & clothes 4 Electricity supply 8 Paper products 4-1 coal-fired 9 Chemical industry 4-2 gas-fired 10 Plastic & rubber 4-3 oil-fired 11 Cement & non-metallic 4-4 nuclear 12 Iron 4-5 hydro 13 Electronic & computer 4-6 wind 14 Other manufacturing 15 Construction 16 Transportation 17 Service
The 17-sector Social Accounting Matrix (SAM), which summarizes the input-output and national accounting data of Taiwan, is compiled based on the input-output table published by the Directorate-General of Budget, Accounting and Statistics (DGBAS, 2011), Taiwan’s chief statistics and accounting agency. A simplified representation for the input structure of production sectors is presented in Table 4.
12
Table 4. Input structure of industrial sectors.
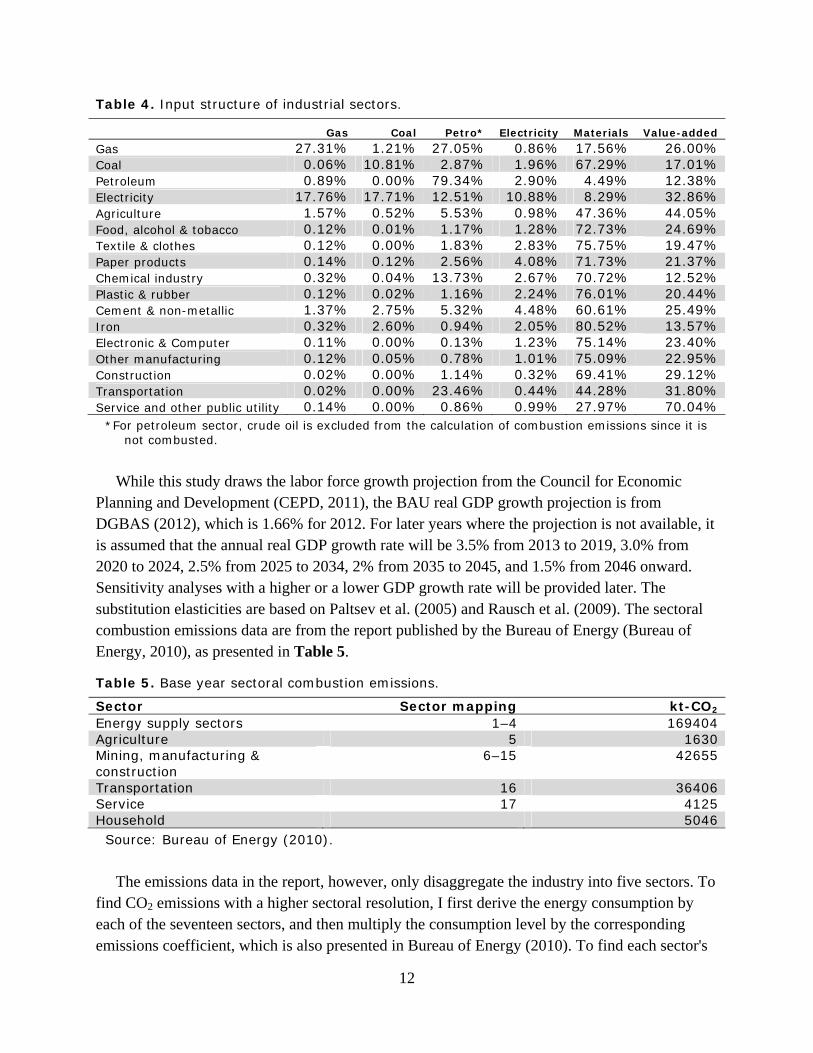
Gas Coal Petro* Electricity Materials Value-added Gas 27.31% 1.21% 27.05% 0.86% 17.56% 26.00% Coal 0.06% 10.81% 2.87% 1.96% 67.29% 17.01% Petroleum 0.89% 0.00% 79.34% 2.90% 4.49% 12.38% Electricity 17.76% 17.71% 12.51% 10.88% 8.29% 32.86% Agriculture 1.57% 0.52% 5.53% 0.98% 47.36% 44.05% Food, alcohol & tobacco 0.12% 0.01% 1.17% 1.28% 72.73% 24.69% Textile & clothes 0.12% 0.00% 1.83% 2.83% 75.75% 19.47% Paper products 0.14% 0.12% 2.56% 4.08% 71.73% 21.37% Chemical industry 0.32% 0.04% 13.73% 2.67% 70.72% 12.52% Plastic & rubber 0.12% 0.02% 1.16% 2.24% 76.01% 20.44% Cement & non-metallic 1.37% 2.75% 5.32% 4.48% 60.61% 25.49% Iron 0.32% 2.60% 0.94% 2.05% 80.52% 13.57% Electronic & Computer 0.11% 0.00% 0.13% 1.23% 75.14% 23.40% Other manufacturing 0.12% 0.05% 0.78% 1.01% 75.09% 22.95% Construction 0.02% 0.00% 1.14% 0.32% 69.41% 29.12% Transportation 0.02% 0.00% 23.46% 0.44% 44.28% 31.80% Service and other public utility 0.14% 0.00% 0.86% 0.99% 27.97% 70.04%
*For petroleum sector, crude oil is excluded from the calculation of combustion emissions since it is not combusted.
While this study draws the labor force growth projection from the Council for Economic Planning and Development (CEPD, 2011), the BAU real GDP growth projection is from DGBAS (2012), which is 1.66% for 2012. For later years where the projection is not available, it is assumed that the annual real GDP growth rate will be 3.5% from 2013 to 2019, 3.0% from 2020 to 2024, 2.5% from 2025 to 2034, 2% from 2035 to 2045, and 1.5% from 2046 onward. Sensitivity analyses with a higher or a lower GDP growth rate will be provided later. The substitution elasticities are based on Paltsev et al. (2005) and Rausch et al. (2009). The sectoral combustion emissions data are from the report published by the Bureau of Energy (Bureau of Energy, 2010), as presented in Table 5.
Table 5. Base year sectoral combustion emissions.
Sector Sector mapping kt-CO2 Energy supply sectors 1–4 169404 Agriculture 5 1630 Mining, manufacturing & construction
6–15 42655
Transportation 16 36406 Service 17 4125 Household 5046
Source: Bureau of Energy (2010). The emissions data in the report, however, only disaggregate the industry into five sectors. To find CO2 emissions with a higher sectoral resolution, I first derive the energy consumption by each of the seventeen sectors, and then multiply the consumption level by the corresponding emissions coefficient, which is also presented in Bureau of Energy (2010). To find each sector's
13
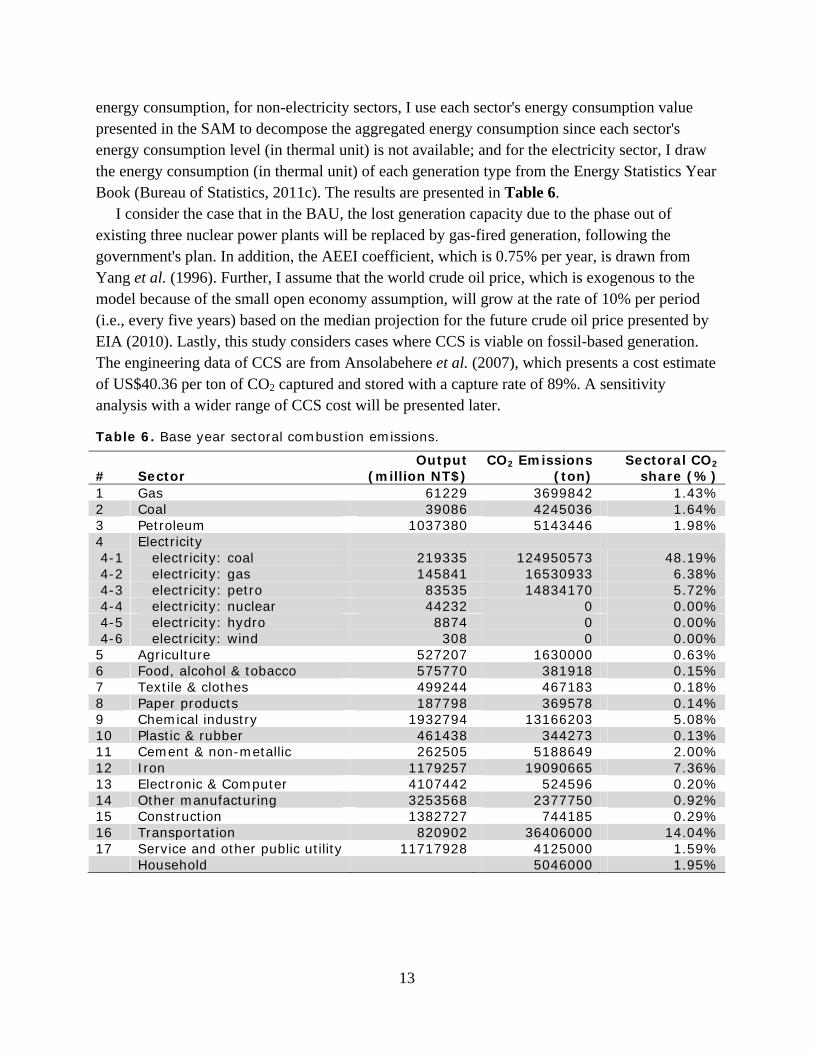
energy consumption, for non-electricity sectors, I use each sector's energy consumption value presented in the SAM to decompose the aggregated energy consumption since each sector's energy consumption level (in thermal unit) is not available; and for the electricity sector, I draw the energy consumption (in thermal unit) of each generation type from the Energy Statistics Year Book (Bureau of Statistics, 2011c). The results are presented in Table 6. I consider the case that in the BAU, the lost generation capacity due to the phase out of existing three nuclear power plants will be replaced by gas-fired generation, following the government's plan. In addition, the AEEI coefficient, which is 0.75% per year, is drawn from Yang et al. (1996). Further, I assume that the world crude oil price, which is exogenous to the model because of the small open economy assumption, will grow at the rate of 10% per period (i.e., every five years) based on the median projection for the future crude oil price presented by EIA (2010). Lastly, this study considers cases where CCS is viable on fossil-based generation. The engineering data of CCS are from Ansolabehere et al. (2007), which presents a cost estimate of US$40.36 per ton of CO2 captured and stored with a capture rate of 89%. A sensitivity analysis with a wider range of CCS cost will be presented later.
Table 6. Base year sectoral combustion emissions.
# Sector Output
(million NT$) CO2 Emissions
(ton) Sectoral CO2
share (%) 1 Gas 61229 3699842 1.43% 2 Coal 39086 4245036 1.64% 3 Petroleum 1037380 5143446 1.98% 4 Electricity 4-1 electricity: coal 219335 124950573 48.19% 4-2 electricity: gas 145841 16530933 6.38% 4-3 electricity: petro 83535 14834170 5.72% 4-4 electricity: nuclear 44232 0 0.00% 4-5 electricity: hydro 8874 0 0.00% 4-6 electricity: wind 308 0 0.00%
5 Agriculture 527207 1630000 0.63% 6 Food, alcohol & tobacco 575770 381918 0.15% 7 Textile & clothes 499244 467183 0.18% 8 Paper products 187798 369578 0.14% 9 Chemical industry 1932794 13166203 5.08% 10 Plastic & rubber 461438 344273 0.13% 11 Cement & non-metallic 262505 5188649 2.00% 12 Iron 1179257 19090665 7.36% 13 Electronic & Computer 4107442 524596 0.20% 14 Other manufacturing 3253568 2377750 0.92% 15 Construction 1382727 744185 0.29% 16 Transportation 820902 36406000 14.04% 17 Service and other public utility 11717928 4125000 1.59% Household 5046000 1.95%
14
5. POLICY IMPACTS
The scenarios considered include both policy and technology dimensions. In addition to BAU, various combinations of non-nuclear policy, low-carbon target, and the viability of CCS on fossil-based generation are presented below.
5.1 Scenarios
In the BAU scenario, there are no policy interventions, and the existing three nuclear power plants of Taiwan will phase out in 2018, 2021, and 2024, respectively, when they reach the end of their designed life spans. Since the model runs in five-year intervals from 2010 onward, this scenario is represented by assuming the No. 1 nuclear power plant, with the capacity of 1272 MWe, will phase out in 2020, the No. 2 and No. 3 nuclear power plants, with the capacities of 1970 MWe and 1902 MWe, respectively, will both phase out in 2025. Lastly, the Longmen nuclear power station, with the capacity of 2750MWe, is assumed to join the grid in 2015. In the non-nuclear policy scenario, everything is the same as the BAU scenario except that the Longmen Nuclear Power Station will never operate. In the low-carbon policy scenario, the Longmen Nuclear Power Station will be in service from 2015 onward. The government will achieve its CO2 reduction target, which aims at cutting the emissions to half of the 2000 levels by 2050 (see Section II for details), by levying a hypothetical carbon tax on all sources of domestic combustion emissions. In the non-nuclear and low-carbon policies scenario, both the non-nuclear and low-carbon targets will be implemented. Two additional scenarios with different technology and policy assumptions are considered: non-nuclear and low-carbon policies with CCS, and low-carbon with CCS and tripled-nuclear capacity. The latter allows tripling the nuclear power capacity by 2050 relative to the BAU level of 2015, while the existing four nuclear power stations of Taiwan are in service, when the low-carbon target is pursued. While both scenarios represent optimistic projections of CO2 mitigation opportunity created by cutting fossil-based emissions, the later scenario presents a counterfactual case to show the potential role of nuclear power if the low-carbon target is the policy priority.
5.2 Business-As-Usual Projection
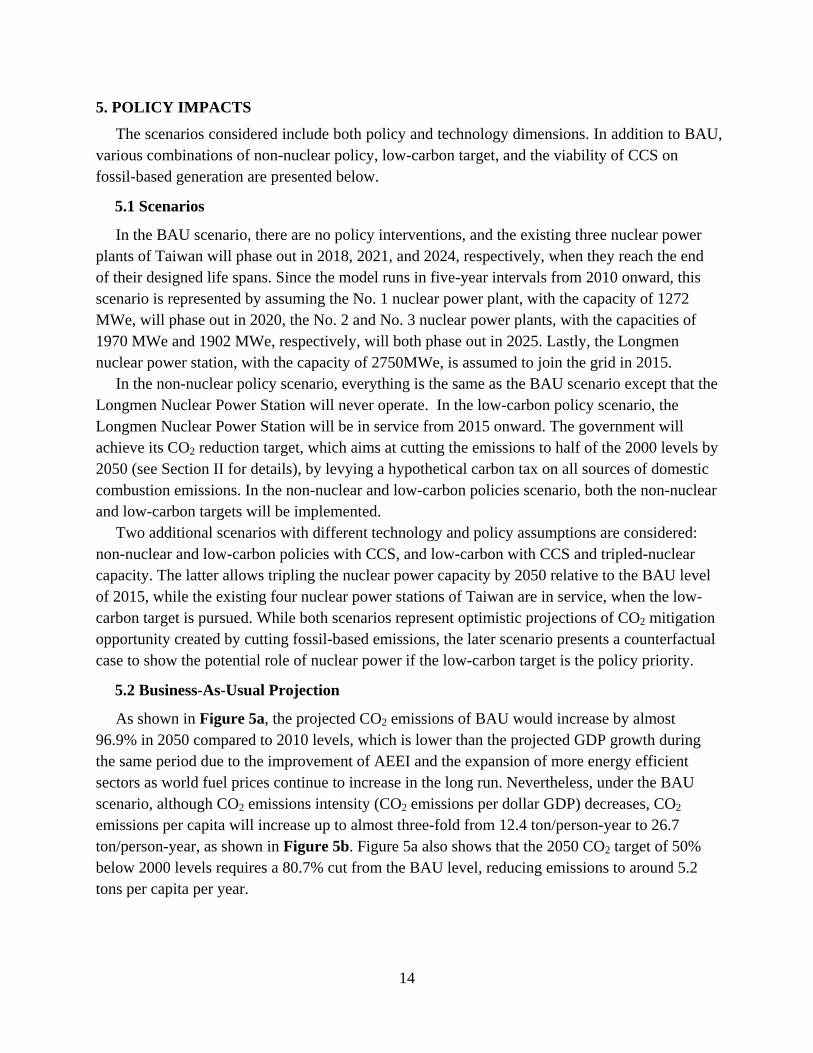
As shown in Figure 5a, the projected CO2 emissions of BAU would increase by almost 96.9% in 2050 compared to 2010 levels, which is lower than the projected GDP growth during the same period due to the improvement of AEEI and the expansion of more energy efficient sectors as world fuel prices continue to increase in the long run. Nevertheless, under the BAU scenario, although CO2 emissions intensity (CO2 emissions per dollar GDP) decreases, CO2 emissions per capita will increase up to almost three-fold from 12.4 ton/person-year to 26.7 ton/person-year, as shown in Figure 5b. Figure 5a also shows that the 2050 CO2 target of 50% below 2000 levels requires a 80.7% cut from the BAU level, reducing emissions to around 5.2 tons per capita per year.
15
Figure 5. Projections for Taiwan’s total and per capita CO2 emissions.
5.3 GDP Impact
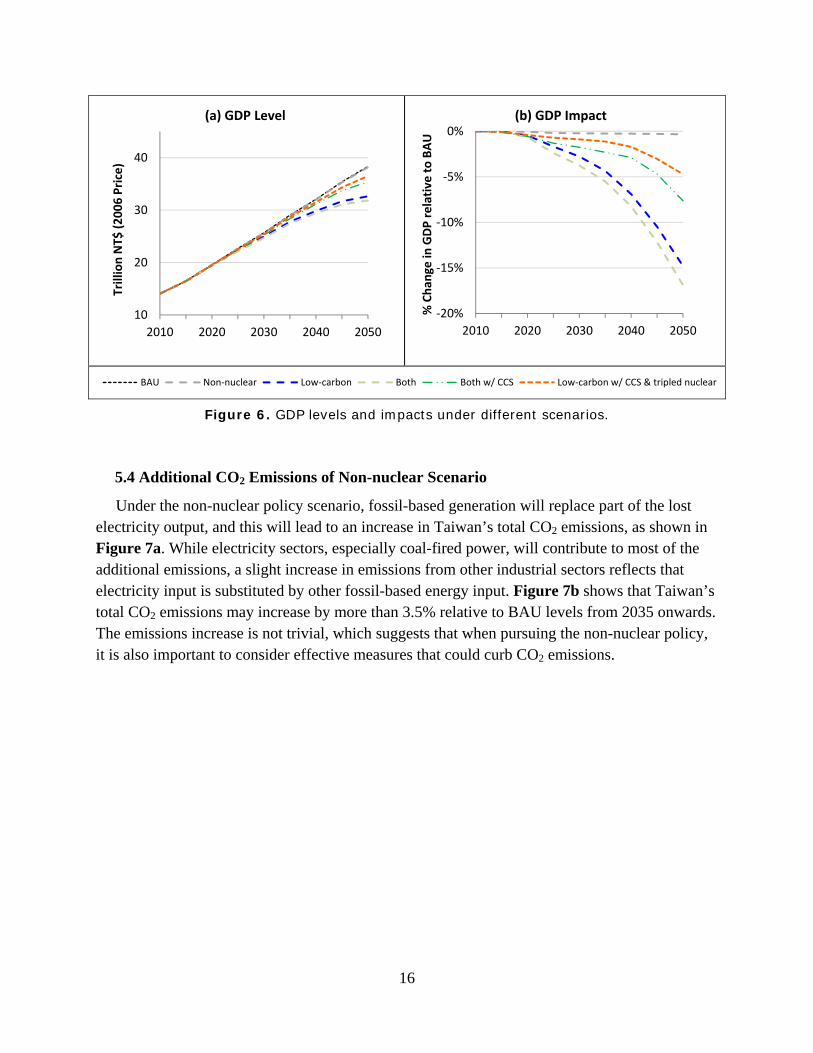
Figure 6 presents the changes in real GDP relative to the BAU level. It shows that the negative impact on real GDP under the non-nuclear policy scenario is relatively small. This could be explained by the fact that the BAU scenario takes into account the government’s plan, which will only operate the Longmen Nuclear Power Station once ready without adding any additional nuclear capacity in later years. Under this benchmark, with the non-nuclear scenario, the reduced nuclear capacity only comes from excluding the Longmen Nuclear Power Station from joining the grid, and this explains why the GDP impact is mild if the non-nuclear policy were carried out alone. For other countries where the BAU nuclear power projects are unrestricted, enforcing non-nuclear policies may have a greater negative impact on their GDPs. Implementation of the low-carbon policy would have a more significant impact on Taiwan’s economy, and if CCS is not feasible, with both non-nuclear and low-carbon policies, the real GDP will decrease by around 16.9% relative to the BAU projected GDP level in 2050. Alternatively, under the same scenario, the implementation of CCS on fossil-based generation, when viable, has the potential of lowering the negative GDP impact down to about 7.6% by reducing the carbon penalty of fossil-based generation when the shadow carbon price exceeds the cost of CCS. Lastly, the negative GDP impact under the low-carbon target could be lowered to around 4.7% if the capacity of nuclear power were tripled, as shown in the result for the low-carbon with CCS and tripled-nuclear capacity scenario.
0
12,500
25,000
37,500
50,000
0
200
400
600
2010 2020 2030 2040 2050
Million tons CO
2per year
(a) National CO2 Emissions and GDP
Reduction from BAULow‐carbon scenariosBAU GDP (Billion NT$; 2006 price)
0
5
10
15
20
25
30
35
40
2010 2020 2030 2040 2050
Annual CO
2Em
issions
(ton per capita)
(b) Per Capita CO2 Emissions
BAU Low‐carbon scenarios
16
Figure 6. GDP levels and impacts under different scenarios.
5.4 Additional CO2 Emissions of Non-nuclear Scenario
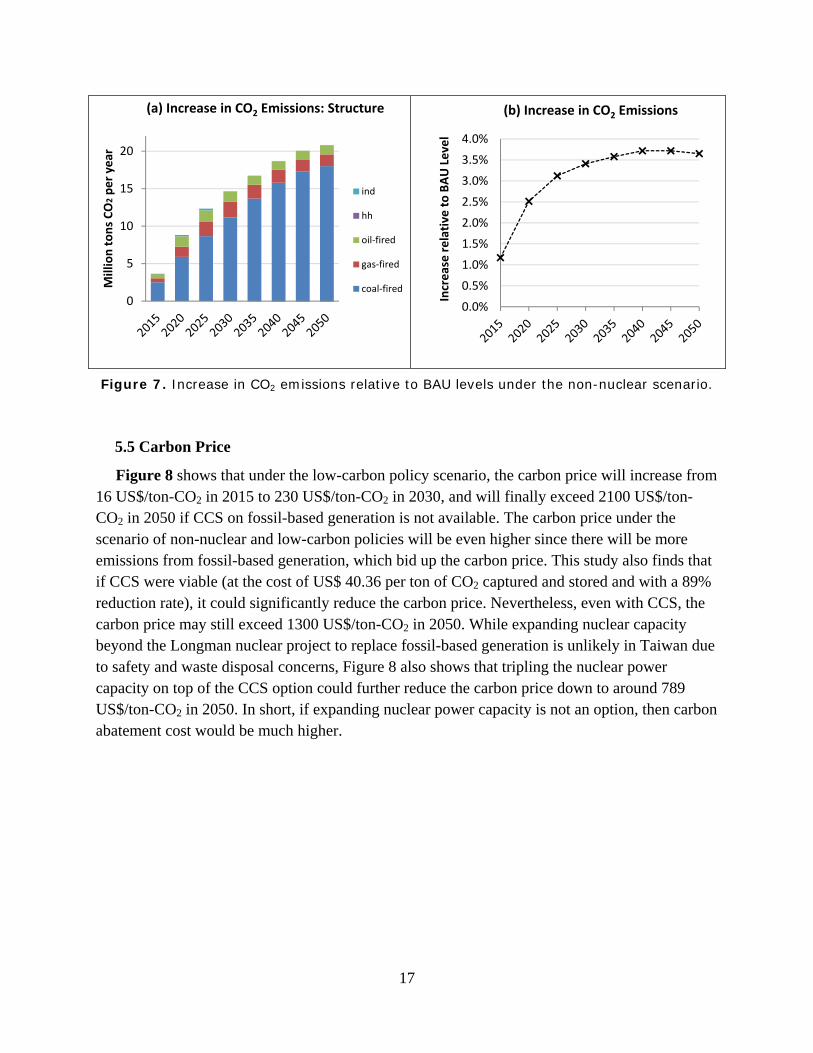
Under the non-nuclear policy scenario, fossil-based generation will replace part of the lost electricity output, and this will lead to an increase in Taiwan’s total CO2 emissions, as shown in Figure 7a. While electricity sectors, especially coal-fired power, will contribute to most of the additional emissions, a slight increase in emissions from other industrial sectors reflects that electricity input is substituted by other fossil-based energy input. Figure 7b shows that Taiwan’s total CO2 emissions may increase by more than 3.5% relative to BAU levels from 2035 onwards. The emissions increase is not trivial, which suggests that when pursuing the non-nuclear policy, it is also important to consider effective measures that could curb CO2 emissions.
10
20
30
40
2010 2020 2030 2040 2050
Trillion NT$
(2006 Price)
(a) GDP Level
‐20%
‐15%
‐10%
‐5%
0%
2010 2020 2030 2040 2050
% Chan
ge in
GDP relative to BAU
(b) GDP Impact
‐20%‐15%‐10%‐5%0%BAU Non‐nuclear Low‐carbon Both Both w/ CCS Low‐carbon w/ CCS & tripled nuclear
17
Figure 7. Increase in CO2 emissions relative to BAU levels under the non-nuclear scenario.
5.5 Carbon Price
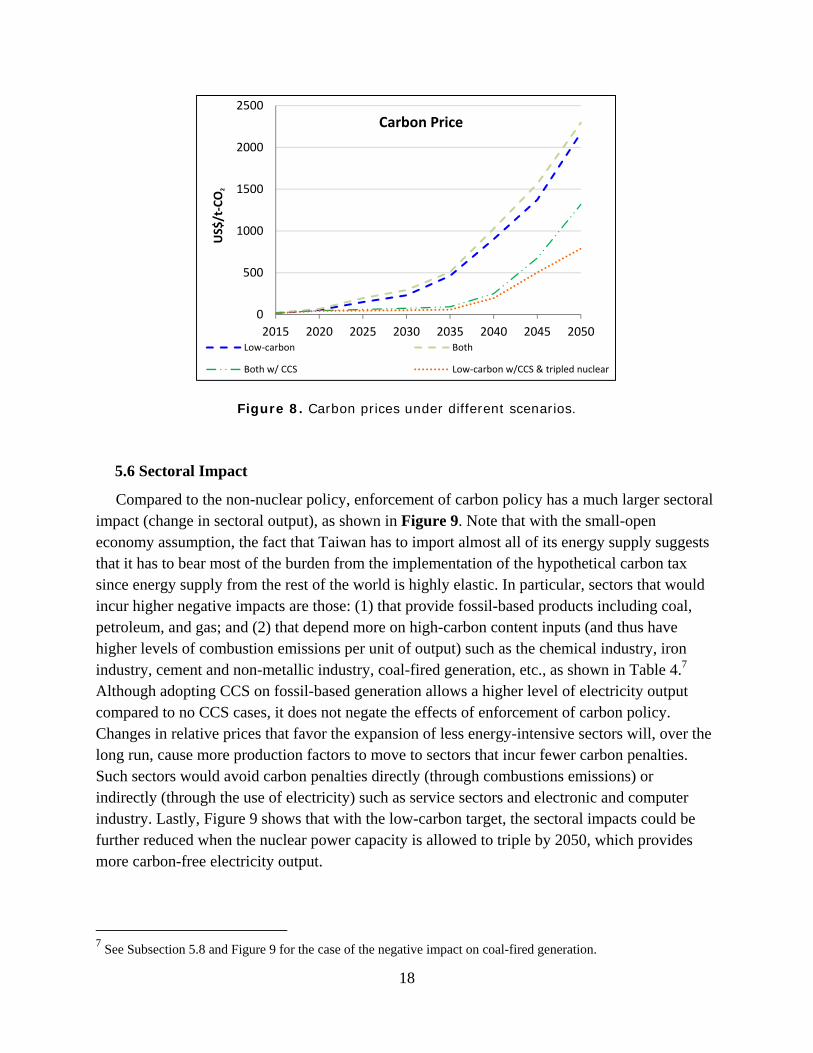
Figure 8 shows that under the low-carbon policy scenario, the carbon price will increase from 16 US$/ton-CO2 in 2015 to 230 US$/ton-CO2 in 2030, and will finally exceed 2100 US$/ton-CO2 in 2050 if CCS on fossil-based generation is not available. The carbon price under the scenario of non-nuclear and low-carbon policies will be even higher since there will be more emissions from fossil-based generation, which bid up the carbon price. This study also finds that if CCS were viable (at the cost of US$ 40.36 per ton of CO2 captured and stored and with a 89% reduction rate), it could significantly reduce the carbon price. Nevertheless, even with CCS, the carbon price may still exceed 1300 US$/ton-CO2 in 2050. While expanding nuclear capacity beyond the Longman nuclear project to replace fossil-based generation is unlikely in Taiwan due to safety and waste disposal concerns, Figure 8 also shows that tripling the nuclear power capacity on top of the CCS option could further reduce the carbon price down to around 789 US$/ton-CO2 in 2050. In short, if expanding nuclear power capacity is not an option, then carbon abatement cost would be much higher.
0
5
10
15
20
Million tons CO2per year
(a) Increase in CO2 Emissions: Structure
ind
hh
oil‐fired
gas‐fired
coal‐fired
0.0%
0.5%
1.0%
1.5%
2.0%
2.5%
3.0%
3.5%
4.0%
Increase relative to BAU Level
(b) Increase in CO2 Emissions
18
Figure 8. Carbon prices under different scenarios.
5.6 Sectoral Impact
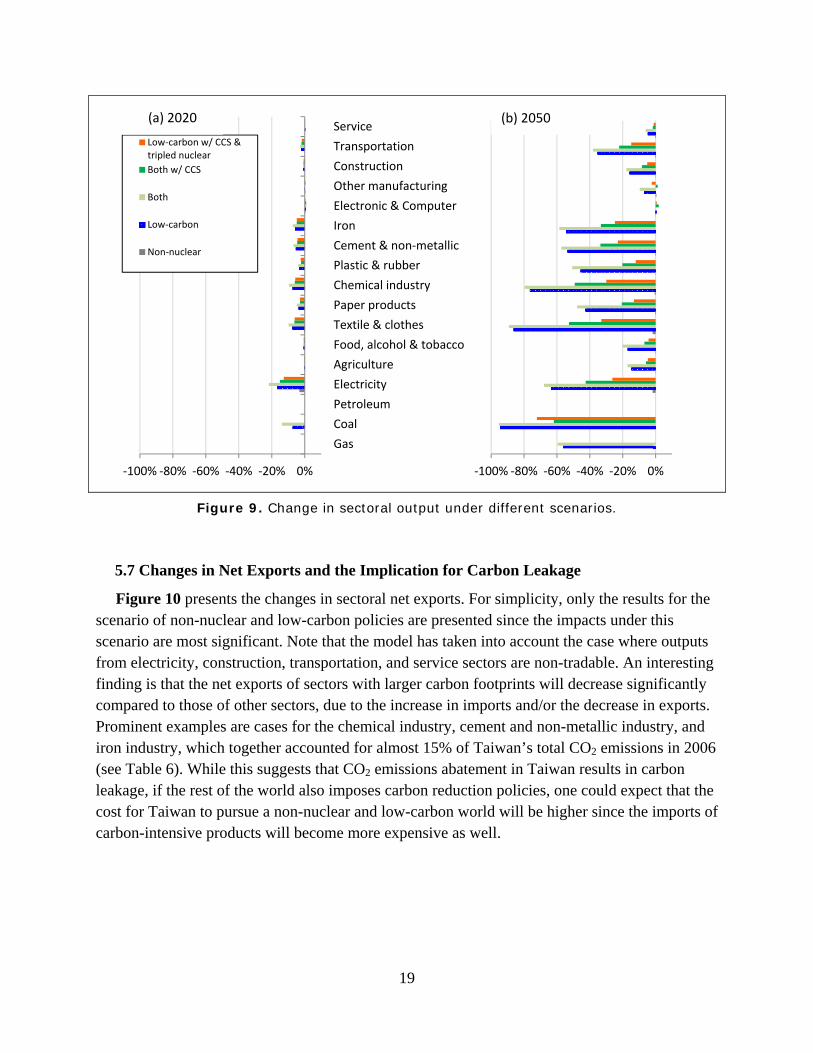
Compared to the non-nuclear policy, enforcement of carbon policy has a much larger sectoral impact (change in sectoral output), as shown in Figure 9. Note that with the small-open economy assumption, the fact that Taiwan has to import almost all of its energy supply suggests that it has to bear most of the burden from the implementation of the hypothetical carbon tax since energy supply from the rest of the world is highly elastic. In particular, sectors that would incur higher negative impacts are those: (1) that provide fossil-based products including coal, petroleum, and gas; and (2) that depend more on high-carbon content inputs (and thus have higher levels of combustion emissions per unit of output) such as the chemical industry, iron industry, cement and non-metallic industry, coal-fired generation, etc., as shown in Table 4.7 Although adopting CCS on fossil-based generation allows a higher level of electricity output compared to no CCS cases, it does not negate the effects of enforcement of carbon policy. Changes in relative prices that favor the expansion of less energy-intensive sectors will, over the long run, cause more production factors to move to sectors that incur fewer carbon penalties. Such sectors would avoid carbon penalties directly (through combustions emissions) or indirectly (through the use of electricity) such as service sectors and electronic and computer industry. Lastly, Figure 9 shows that with the low-carbon target, the sectoral impacts could be further reduced when the nuclear power capacity is allowed to triple by 2050, which provides more carbon-free electricity output.
7 See Subsection 5.8 and Figure 9 for the case of the negative impact on coal-fired generation.
0
500
1000
1500
2000
2500
2015 2020 2025 2030 2035 2040 2045 2050
US$/t‐CO
2
Carbon Price
Low‐carbon Both
Both w/ CCS Low‐carbon w/CCS & tripled nuclear
19
Figure 9. Change in sectoral output under different scenarios.
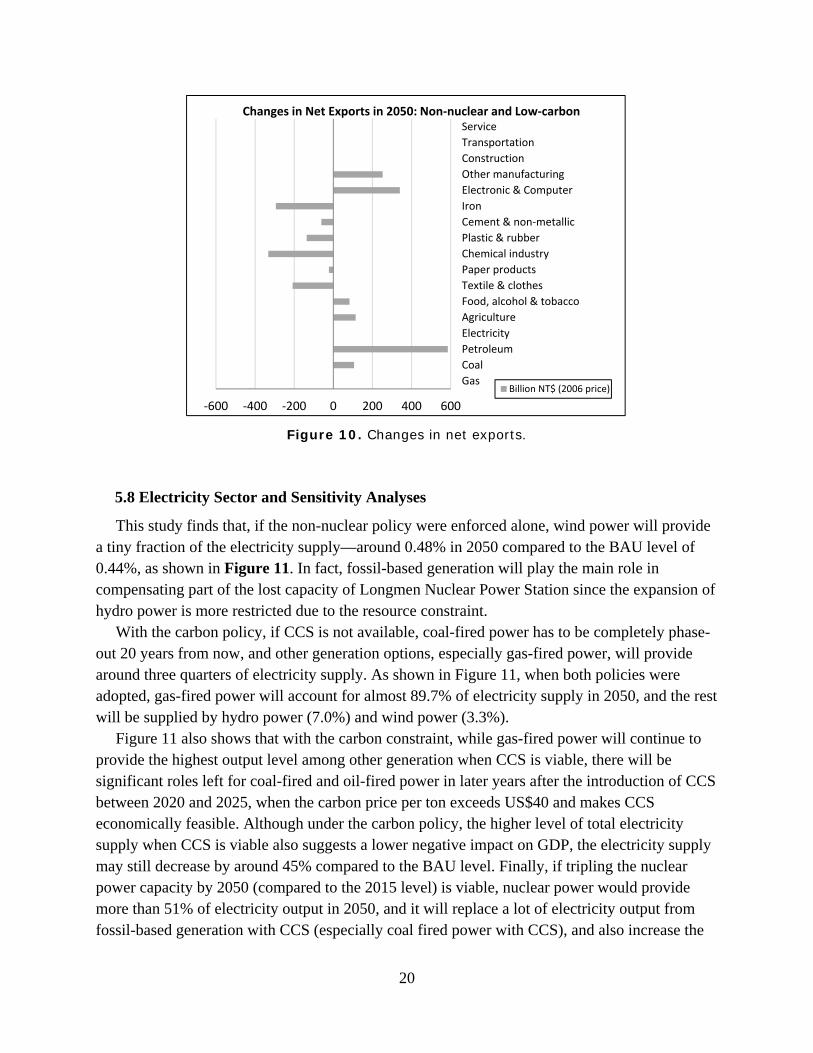
5.7 Changes in Net Exports and the Implication for Carbon Leakage
Figure 10 presents the changes in sectoral net exports. For simplicity, only the results for the scenario of non-nuclear and low-carbon policies are presented since the impacts under this scenario are most significant. Note that the model has taken into account the case where outputs from electricity, construction, transportation, and service sectors are non-tradable. An interesting finding is that the net exports of sectors with larger carbon footprints will decrease significantly compared to those of other sectors, due to the increase in imports and/or the decrease in exports. Prominent examples are cases for the chemical industry, cement and non-metallic industry, and iron industry, which together accounted for almost 15% of Taiwan’s total CO2 emissions in 2006 (see Table 6). While this suggests that CO2 emissions abatement in Taiwan results in carbon leakage, if the rest of the world also imposes carbon reduction policies, one could expect that the cost for Taiwan to pursue a non-nuclear and low-carbon world will be higher since the imports of carbon-intensive products will become more expensive as well.
‐100% ‐80% ‐60% ‐40% ‐20% 0%
Gas
Coal
Petroleum
Electricity
Agriculture
Food, alcohol & tobacco
Textile & clothes
Paper products
Chemical industry
Plastic & rubber
Cement & non‐metallic
Iron
Electronic & Computer
Other manufacturing
Construction
Transportation
ServiceLow‐carbon w/ CCS &tripled nuclear
Both w/ CCS
Both
Low‐carbon
Non‐nuclear
‐100% ‐80% ‐60% ‐40% ‐20% 0%
(a) 2020 (b) 2050
20
Figure 10. Changes in net exports.
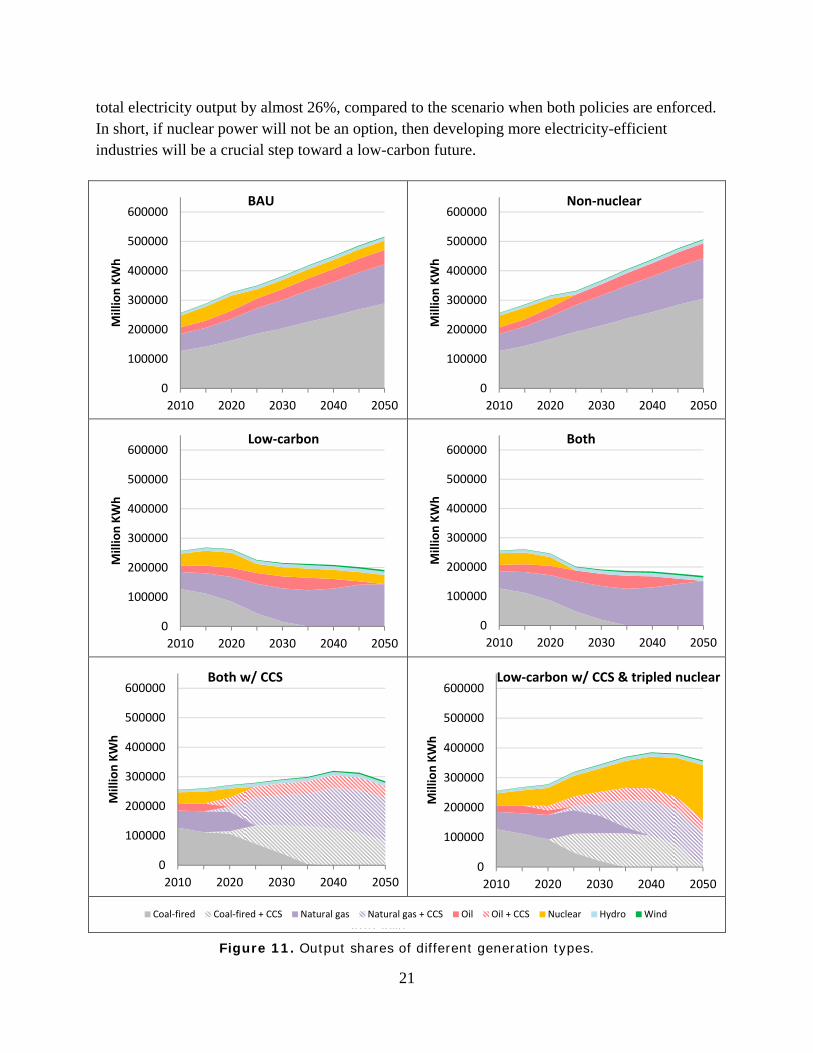
5.8 Electricity Sector and Sensitivity Analyses
This study finds that, if the non-nuclear policy were enforced alone, wind power will provide a tiny fraction of the electricity supply—around 0.48% in 2050 compared to the BAU level of 0.44%, as shown in Figure 11. In fact, fossil-based generation will play the main role in compensating part of the lost capacity of Longmen Nuclear Power Station since the expansion of hydro power is more restricted due to the resource constraint. With the carbon policy, if CCS is not available, coal-fired power has to be completely phase-out 20 years from now, and other generation options, especially gas-fired power, will provide around three quarters of electricity supply. As shown in Figure 11, when both policies were adopted, gas-fired power will account for almost 89.7% of electricity supply in 2050, and the rest will be supplied by hydro power (7.0%) and wind power (3.3%). Figure 11 also shows that with the carbon constraint, while gas-fired power will continue to provide the highest output level among other generation when CCS is viable, there will be significant roles left for coal-fired and oil-fired power in later years after the introduction of CCS between 2020 and 2025, when the carbon price per ton exceeds US$40 and makes CCS economically feasible. Although under the carbon policy, the higher level of total electricity supply when CCS is viable also suggests a lower negative impact on GDP, the electricity supply may still decrease by around 45% compared to the BAU level. Finally, if tripling the nuclear power capacity by 2050 (compared to the 2015 level) is viable, nuclear power would provide more than 51% of electricity output in 2050, and it will replace a lot of electricity output from fossil-based generation with CCS (especially coal fired power with CCS), and also increase the
‐600 ‐400 ‐200 0 200 400 600
Gas
Coal
Petroleum
Electricity
Agriculture
Food, alcohol & tobacco
Textile & clothes
Paper products
Chemical industry
Plastic & rubber
Cement & non‐metallic
Iron
Electronic & Computer
Other manufacturing
Construction
Transportation
ServiceChanges in Net Exports in 2050: Non‐nuclear and Low‐carbon
Billion NT$ (2006 price)
21
total electricity output by almost 26%, compared to the scenario when both policies are enforced. In short, if nuclear power will not be an option, then developing more electricity-efficient industries will be a crucial step toward a low-carbon future.
Figure 11. Output shares of different generation types.
0
100000
200000
300000
400000
500000
600000
2010 2020 2030 2040 2050
Million KWh
BAU
0
100000
200000
300000
400000
500000
600000
2010 2020 2030 2040 2050
Million KWh
Non‐nuclear
0
100000
200000
300000
400000
500000
600000
2010 2020 2030 2040 2050
Million KWh
Low‐carbon
0
100000
200000
300000
400000
500000
600000
2010 2020 2030 2040 2050
Million KWh
Both
0
100000
200000
300000
400000
500000
600000
2010 2020 2030 2040 2050
Million KWh
Both w/ CCS
0
100000
200000
300000
400000
500000
600000
2010 2020 2030 2040 2050
Million KWh
Low‐carbon w/ CCS & tripled nuclear
0
2010 2040Coal‐fired Coal‐fired + CCS Natural gas Natural gas + CCS Oil Oil + CCS Nuclear Hydro Wind
22
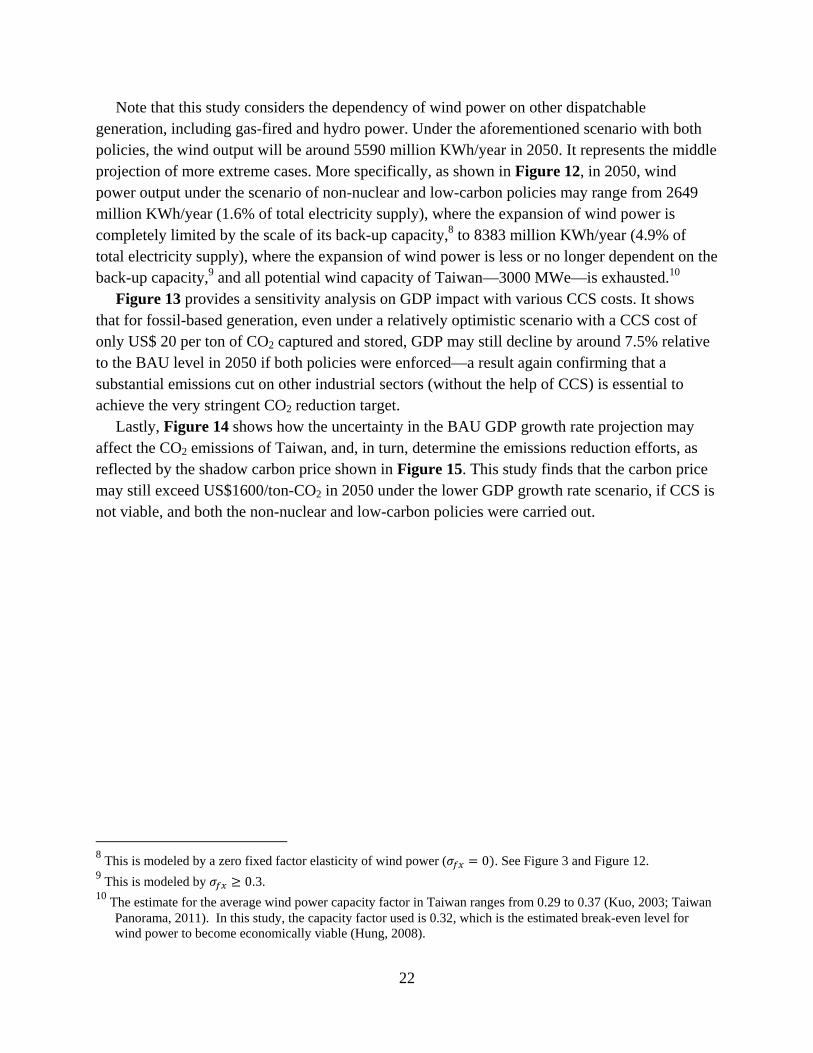
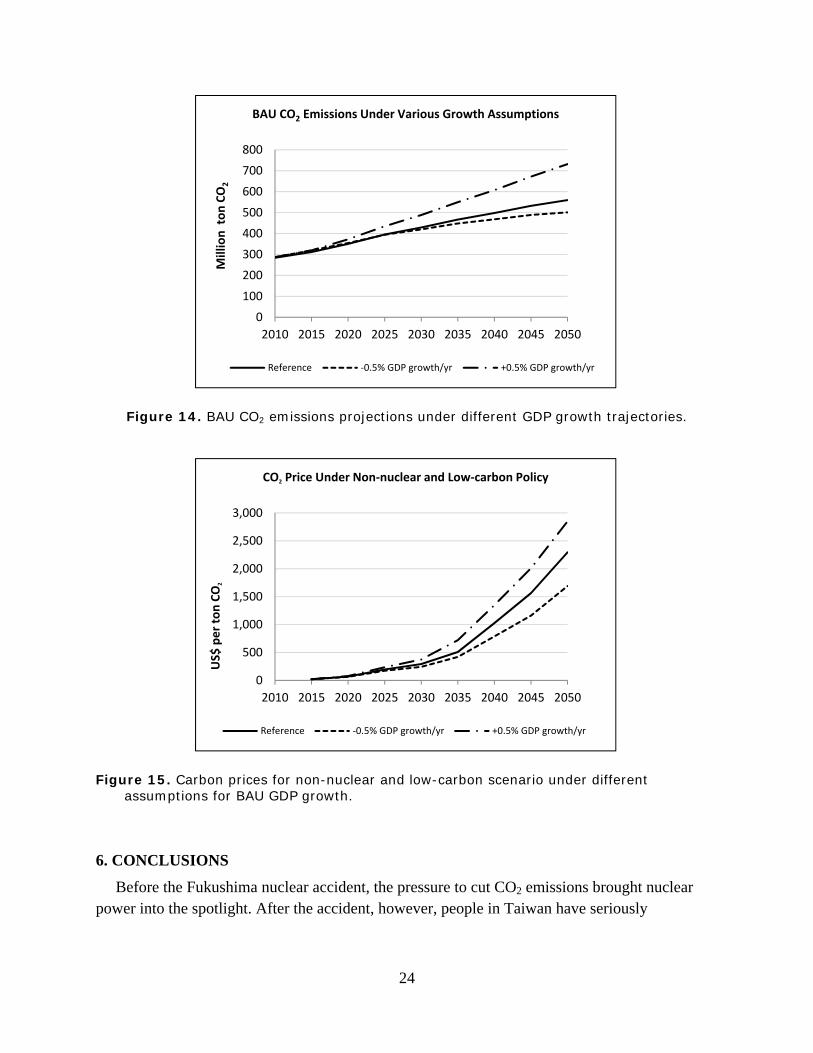
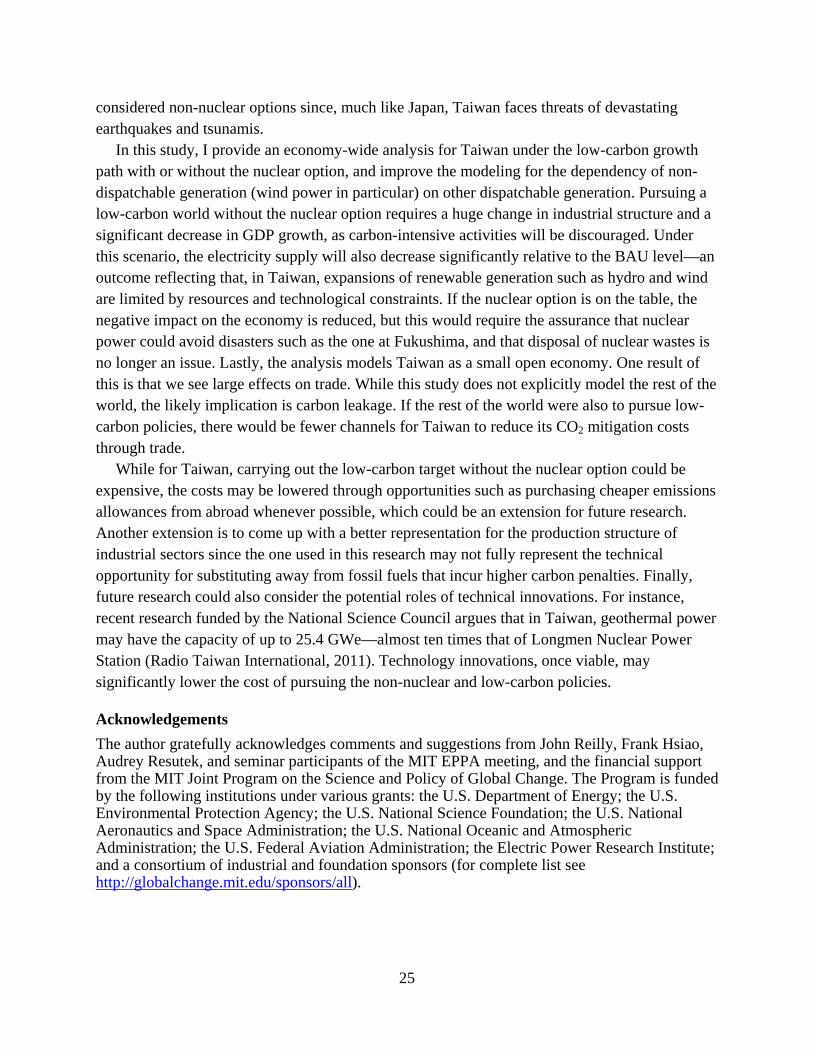
Note that this study considers the dependency of wind power on other dispatchable generation, including gas-fired and hydro power. Under the aforementioned scenario with both policies, the wind output will be around 5590 million KWh/year in 2050. It represents the middle projection of more extreme cases. More specifically, as shown in Figure 12, in 2050, wind power output under the scenario of non-nuclear and low-carbon policies may range from 2649 million KWh/year (1.6% of total electricity supply), where the expansion of wind power is completely limited by the scale of its back-up capacity,8 to 8383 million KWh/year (4.9% of total electricity supply), where the expansion of wind power is less or no longer dependent on the back-up capacity,9 and all potential wind capacity of Taiwan—3000 MWe—is exhausted.10 Figure 13 provides a sensitivity analysis on GDP impact with various CCS costs. It shows that for fossil-based generation, even under a relatively optimistic scenario with a CCS cost of only US$ 20 per ton of CO2 captured and stored, GDP may still decline by around 7.5% relative to the BAU level in 2050 if both policies were enforced—a result again confirming that a substantial emissions cut on other industrial sectors (without the help of CCS) is essential to achieve the very stringent CO2 reduction target. Lastly, Figure 14 shows how the uncertainty in the BAU GDP growth rate projection may affect the CO2 emissions of Taiwan, and, in turn, determine the emissions reduction efforts, as reflected by the shadow carbon price shown in Figure 15. This study finds that the carbon price may still exceed US$1600/ton-CO2 in 2050 under the lower GDP growth rate scenario, if CCS is not viable, and both the non-nuclear and low-carbon policies were carried out.
8 This is modeled by a zero fixed factor elasticity of wind power ( 0 . See Figure 3 and Figure 12. 9 This is modeled by 0.3. 10 The estimate for the average wind power capacity factor in Taiwan ranges from 0.29 to 0.37 (Kuo, 2003; Taiwan
Panorama, 2011). In this study, the capacity factor used is 0.32, which is the estimated break-even level for wind power to become economically viable (Hung, 2008).
23
Figure 12. Wind power output under different fixed factor elasticity.
Figure 13. Change in GDP under different CCS costs (US$/ton-CO2).
0
1,000
2,000
3,000
4,000
5,000
6,000
7,000
8,000
9,000
2010 2020 2030 2040 2050
Million KWh
Sensitivity Analysis of Fixed Factor Elasticity of Wind Power on Wind Output: Non‐nuclear and Low‐carbon
0.00
0.05
0.10
0.17 (Benchmark)
0.20
0.30
0.40
Infinity
‐20%
‐15%
‐10%
‐5%
0%
2010 2020 2030 2040 2050
Change in GDP under different CCS costs:Non‐nulcear and Low‐carbon Scenario
20 40.36 100 250 Infinity
24
Figure 14. BAU CO2 emissions projections under different GDP growth trajectories.
Figure 15. Carbon prices for non-nuclear and low-carbon scenario under different assumptions for BAU GDP growth.
6. CONCLUSIONS
Before the Fukushima nuclear accident, the pressure to cut CO2 emissions brought nuclear power into the spotlight. After the accident, however, people in Taiwan have seriously
0
100
200
300
400
500
600
700
800
2010 2015 2020 2025 2030 2035 2040 2045 2050
Million ton CO
2
BAU CO2 Emissions Under Various Growth Assumptions
Reference ‐0.5% GDP growth/yr +0.5% GDP growth/yr
0
500
1,000
1,500
2,000
2,500
3,000
2010 2015 2020 2025 2030 2035 2040 2045 2050
US$
per ton CO
2
CO2 Price Under Non‐nuclear and Low‐carbon Policy
Reference ‐0.5% GDP growth/yr +0.5% GDP growth/yr
25
considered non-nuclear options since, much like Japan, Taiwan faces threats of devastating earthquakes and tsunamis. In this study, I provide an economy-wide analysis for Taiwan under the low-carbon growth path with or without the nuclear option, and improve the modeling for the dependency of non-dispatchable generation (wind power in particular) on other dispatchable generation. Pursuing a low-carbon world without the nuclear option requires a huge change in industrial structure and a significant decrease in GDP growth, as carbon-intensive activities will be discouraged. Under this scenario, the electricity supply will also decrease significantly relative to the BAU level—an outcome reflecting that, in Taiwan, expansions of renewable generation such as hydro and wind are limited by resources and technological constraints. If the nuclear option is on the table, the negative impact on the economy is reduced, but this would require the assurance that nuclear power could avoid disasters such as the one at Fukushima, and that disposal of nuclear wastes is no longer an issue. Lastly, the analysis models Taiwan as a small open economy. One result of this is that we see large effects on trade. While this study does not explicitly model the rest of the world, the likely implication is carbon leakage. If the rest of the world were also to pursue low-carbon policies, there would be fewer channels for Taiwan to reduce its CO2 mitigation costs through trade. While for Taiwan, carrying out the low-carbon target without the nuclear option could be expensive, the costs may be lowered through opportunities such as purchasing cheaper emissions allowances from abroad whenever possible, which could be an extension for future research. Another extension is to come up with a better representation for the production structure of industrial sectors since the one used in this research may not fully represent the technical opportunity for substituting away from fossil fuels that incur higher carbon penalties. Finally, future research could also consider the potential roles of technical innovations. For instance, recent research funded by the National Science Council argues that in Taiwan, geothermal power may have the capacity of up to 25.4 GWe—almost ten times that of Longmen Nuclear Power Station (Radio Taiwan International, 2011). Technology innovations, once viable, may significantly lower the cost of pursuing the non-nuclear and low-carbon policies.
Acknowledgements
The author gratefully acknowledges comments and suggestions from John Reilly, Frank Hsiao, Audrey Resutek, and seminar participants of the MIT EPPA meeting, and the financial support from the MIT Joint Program on the Science and Policy of Global Change. The Program is funded by the following institutions under various grants: the U.S. Department of Energy; the U.S. Environmental Protection Agency; the U.S. National Science Foundation; the U.S. National Aeronautics and Space Administration; the U.S. National Oceanic and Atmospheric Administration; the U.S. Federal Aviation Administration; the Electric Power Research Institute; and a consortium of industrial and foundation sponsors (for complete list see http://globalchange.mit.edu/sponsors/all).
26
7. REFERENCES
Ansolabehere, S., J. Beer, J. Deutch, A.D. Ellerman, S.J. Friedmann and H. Herzog et al., 2007: The future of coal: An interdisciplinary MIT study, Massachusetts Institute of Technology: Cambridge, MA, 175p.
Arrow, K. J. and G. Debreu, 1954: Existence of an Equilibrium for a Competitive Economy. Econometrica, 22(3): 265–290.
Bensmann, T., 2010: Projections of US GHG Reductions from Nuclear Power New Capacity Based On Historic Levels of Investment. Energy Policy, 38: 2431–2437.
Bureau, B., 2011: Distributional effects of a carbon tax on car fuels in France. Energy Economics, 33(1): 121–130.
Bureau of Energy, 2011a: Energy Supply. Energy Statistics Year Book. Ministry of Economic Affairs: Taiwan (http://www.moeaboe.gov.tw/Download/opengovinfo/Plan/all/energy_year/main/files/06/table-6-01.xls).
Bureau of Energy, 2011b: Electricity Generation Capacity and Output by Type (In Chinese). Energy Statistics Year Book. Ministry of Economic Affairs: Taiwan (http://www.moeaboe.gov.tw/Download/opengovinfo/Plan/all/energy_year/main/files/07/table-7-28.xls).
Bureau of Energy, 2011c: Energy Balance Sheet. Energy Statistics Year Book. Ministry of Economic Affiars: Taiwan (http://www.moeaboe.gov.tw/Download/opengovinfo/Plan/all/energy_year/main/files/06/table-6-04.xls).
Bureau of Energy, 2010: Statistics and Analysis for Taiwan’s CO2 Combustion Emissions (In Chinese). Ministry of Economic Affairs: Taiwan (http://www.moeaboe.gov.tw/promote/greenhouse/PrGHMain.aspx?PageId=pr_gh_list).
Böhringer, C. and Rutherford, T., 1997: Carbon Taxes with Exemptions in an Open Economy: A General Equilibrium Analysis of the German Tax Initiative. Journal of Environmental Economics and Management, 32: 189–203.
The Council for Economic Planning and Development (CEPD), 2011: The Population Forecast for Taiwan: From 2010 to 2060 (in Chinese) (http://www.cepd.gov.tw/m1.aspx?sNo=0000455).
CEPD, 2006: The Impact of Cutting Greenhouse Gas Emissions on Industrial Development of Taiwan (in Chinese). (http://www.cepd.gov.tw/dn.aspx?uid=4915)
Dervis, K., De Melo, J., and Robinson S., 1982: General Equilibrium Models for Development Policy. Cambridge University Press: N.Y., USA.
The Directorate-General of Budget, Accounting and Statistics (DGBAS), 2011: The Input output Table of Taiwan for 2006 (http://www.dgbas.gov.tw/ct.asp?xItem=26194&ctNode=3294).
DGBAS, 2012: The GDP Growth Forecast for 2012 (http://www.dgbas.gov.tw/ct.asp?xItem=30564&ctNode=5624).
Energy Information Adminstration (EIA), 2009a: Per Capita Total Carbon Dioxide Emissions from the Consumption of Energy, Most Countries, 1980–2006 for the International Energy Annual 2006 (http://www.eia.gov/pub/international/iealf/tableh1cco2.xls).
Energy Information Adminstration (EIA), 2009b: Total Emissions from the Consumption of Energy (http://www.eia.gov/pub/international/iealf/tableh1co2.xls).
27
Energy Information Administration (EIA), 2010: Annual Energy Outlook 2011: Washington, DC (http://www.eia.gov/neic/speeches/newell_12162010.pdf).
Environmental Protection Administration, 2012: The Energy Conservation and CO2 Mitigation Policy (In Chinese): Taipei, Taiwan (http://www.epa.gov.tw/ch/aioshow.aspx?busin=12379&path=12403&guid=3c1ee813-33d2-4c79-9579-834c089dd983&lang=zh-tw).
Fackler, M., 2011: Japan to Cancel Plan to Build More Nuclear Plants. The New York Times, 10 May (http://www.nytimes.com/2011/05/11/world/asia/11japan.html).
Hung, C.-J., 2008: A Cost Analysis of Wind Power for the Taiwan Power Company. Master Thesis. Institute of Business and Management. National Chiao-Tung University.
Ho, C.-S., C.-F. Lin, and C. Chou, 2008: The Macroeconometric Analysis for the Effect of Cutting CO2 Emissions (in Chinese). Paper presented for the Ninth National Empirical Economics Analysis Conference (http://bioagri.agec.ntu.edu.tw/ecmeeting/02/D2-033.pdf).
Hsu, S.-H., H.-L. Lee, P.-C. Li, and C.-H. Huang, 1998: The Effects of Energy Efficiency Improvement on Taiwan’s Economy and CO2 Emission Reduction–An Application of Taiwan General Equilibrium Model(TAIGEM) (in Chinese). Taiwan Economics Association Annual Conference Paper, 1998: 273–315.
Huang, C.-H., 2000: The Estimation for Taiwan's GHG Emissions and the Assessment for GHG Emissions Reduction: The Application of TAIGEM Model (in Chinese). National Policy Foundation: Taiwan (http://old.npf.org.tw/e-newsletter/report/891209-L-4.doc).
International Energy Agency (IEA), 2011: Statistics and Balances: Electricity/Heat by Country/Region. (http://www.iea.org/stats/prodresult.asp?PRODUCT=Electricity/Heat)
Karplus, V., S. Paltsev, and J. Reilly, 2009: Prospects for plug-in hybrid electric vehicles in the United States and Japan: A general equilibrium analysis. Transportation Research Part A: Policy and Practice, 44(8): 620–641.
Kessides, I., 2010: Nuclear Power and Sustainable Energy Policy: Promises and Perils. The World Bank Research Observer, 25(2): 323–362.
Ko, F.-K., C.-B. Huang, P.-Y. Tseng, C.-H. Lin, B.-Y. Zheng, and H.-M. Chiu, 2010: Long-Term CO2 Emissions Reduction Target and Scenarios of Power Sector in Taiwan. Energy Policy, 38(1): 288–300.
Kuo, P.-Y., 2003: The Wind Resource of Taiwan Limits the Growth of Wind Power (in Chinese). National Policy Foundation: Taiwan (http://old.npf.org.tw/PUBLICATION/SD/092/SD-R-092-009.htm).
Liang, C.-Y. and P.-Y. Kuo, 2003: The Impact of Earlier Retirement of Nuclear Power Plants on Taiwan’s Economy (In Chinese). National Policy Foundation, Taiwan (http://old.npf.org.tw/PUBLICATION/SD/092/SD-R-092-007.htm).
Liang, C.-Y., 2008: The Integration of Energy Tax, Carbon Tax, and Carbon Trade (in Chinese). The Petroleum Market Newsletter. October, 2008 (http://www.tri.org.tw/oil/file/article22-971029.pdf).
Lin, H.-H., and H.-P. Sue, 2008: The Analysis for the Impact of Implementing the Energy Tax on the Economy (in Chinese). Global Business and Management Research, 3(2): 41–74.
Lin, S.-M., 1997: The Impacts of Energy Tax on Income Ladder and Welfare: A General Equilibrium Analysis (in Chinese). Paper Presented for the Conference of GHG Mitigation Policy Tools and Their Implications. 111–138.
28
Mathiesen, L., 1985: Computation of Economic Equilibrium by a Sequence of Linear Complementarity Problems. Mathematical Programming Study, 23: 144–162.
Mauritzen, J., 2012: Dead Battery? Wind Power, The Spot Market, and Hydro Power Interaction in the Nordic Electricity Market. Research Institute of Industrial Economics, Stockholm, Sweden. Working Paper No. 908 (http://www.ifn.se/wfiles/wp/wp908.pdf).
McFarland, J., S. Paltsev, and H. Jacoby, 2009: Analysis of the Coal Sector under Carbon Constraints. Journal of Policy Modeling, 31: 404–424.
Mcgroarty, P. and V. Fuhrmans, 2011: Germany to Forsake Its Nuclear Reactors. The Wall Street Journal, 30 May (http://online.wsj.com/article/SB10001424052702303657404576354752218810560.html).
Metcalf, G. and D. Weisbach, 2009: The Design of a Carbon Tax. Harvard Environmental Law Review, 33(2): 499–556.
Mori, S., 2000: Effects of Carbon Emission Mitigation Option Under Carbon Concentration Stabilization Scenarios. Environmental Economics and Policy Studies, 3: 125–142.
Muljadi, E., C. Wang, and M. Nehrir, 2004: Parallel Operation of Wind Turbine, Fuel Cell, and Diesel Generation Sources. NREL Conference Paper Presented at the IAEE-Power Engineering Society General Meeting. Denver, Colorado (http://www.nrel.gov/docs/fy04osti/35353.pdf).
The New Taipei City Government, 2011: Introduction to the Nuclear Power Plants at the New Taipei City (in Chinese) (http://sixvote.tpf.gov.tw/guidance/firenewsdetail.php?id=146).
The Nuclear Association of Taiwan, 2011: Introduction to Taiwan’s Nuclear Power Plants (in Chinese) (http://www.chns.org/s.php?id=48#).
Paltsev, S., J. Reilly, H. Jacoby, R. Eckaus, J. McFarland, M. Sarofim, M. Asadoorian, and M. Babiker, 2005: The MIT Emissions Prediction and Policy Analysis (EPPA) Model: Version 4. MIT JPSPGC, Report No. 125, August, 72p. (http://globalchange.mit.edu/files/document/MITJPSPGC_Rpt125.pdf).
Radio Taiwan International, 2011: Abundant Geothermal Resource in Taiwan (In Chinese) (http://news.rti.org.tw/index_newsContent.aspx?nid=314621&projectID=2).
Rausch, S., Metcalf, G., Reilly, I., and Paltsev, S., 2009: Distributional Impacts of a U.S. Greenhouse Gas Policy: A General Equilibrium Analysis of Carbon Pricing. MIT JPSPGC, Report No. 182, November, 60p. (http://globalchange.mit.edu/files/document/MITJPSPGC_Rpt182.pdf).
Rutherford, T., 1995: Extension of GAMS for Complementarity Problems Arising in Applied Economic Analysis. Journal of Economic Dynamics and Control, 19(8): 1299–1324.
Rutherford, T., 1999: Applied General Equilibrium Modeling with MPSGE as a GAMS Subsystem: An Overview of the Modeling Framework and Syntax. Computational Economics, 14: 1–46.
Rutherford, T. and M. Light, 2001: A General Equilibrium Model for Tax Policy Analysis in Colombia. University of Colorado, Boulder. 1–41 (http://www.mpsge.org/dnp2001.pdf).
Scott, J., 2011: Uranium Spot Prices Increase as Investors Enter Market, Ux Says. Bloomberg, 1 August (http://www.bloomberg.com/news/2011-08-02/uranium-spot-prices-increase-as-investors-enter-market-ux-says.html).
29
Shelby, M., A. Fawcett, E. Smith, D. Hanson, and R. Sands, 2008: Representing technology in CGE models: a comparison of SGM and AMIGA for electricity sector CO2 mitigation. International Journal of Energy Technology and Policy, 6(4): 323–342.
Taipower, 2012: Introduction to Taiwan’s Electricity Sector (in Chinese). Taipower Company: Taiwan (http://www.taipower.com.tw/index.htm#).
Taiwan Environmental Information Center, 2001: The Wind Power Potential of Taiwan (http://e-info.org.tw/node/11666).
Taiwan Panorama, 2011: Taiwanese wind power gets off the ground. June, 2011, P.22. Taipei, Taiwan.
Wang, R., W. Liu, L. Xiao, J. Liu, and W. Kao, 2011: Path towards achieving of China's 2020 carbon emission reduction target—A discussion of low-carbon energy policies at province level. Energy Policy, 39(5): 2740–2747.
Yang, C.-J., 2011: A Comparison of the Nuclear Options for Greenhouse Gas Mitigation in China and in the United States. Energy Policy, 39(6): 3025–3028.
Yang, H.-Y., 2009: The Economic Implications of Energy Tax: A CGE Analysis with Uncertainty in Parameters (in Chinese). Taiwan Economic Forecast and Policy, 40(1): 79–215.
Yang, Z., R. Eckaus, and H. Jacoby, 1996: The MIT Emissions Prediction and Policy Analysis (EPPA) Model. MIT Joint Program on the Science and Policy of Global Change, Report No. 6, Cambridge, Massachusetts.
Yun, T., and R. Baker, 2009: Analysis of a Power Plant Investment Opportunity under a Carbon Neutral World. Investment Management and Financial Innovations, 6(4): 155–163.
REPORT SERIES of the MIT Joint Program on the Science and Policy of Global Change
Contact the Joint Program Office to request a copy. The Report Series is distributed at no charge.
FOR THE COMPLETE LIST OF JOINT PROGRAM REPORTS: http://globalchange.mit.edu/pubs/all-reports.php
190. Climatology and Trends in the Forcing of the Stratospheric Zonal-Mean Flow Monier and Weare January 2011
191. Climatology and Trends in the Forcing of the Stratospheric Ozone Transport Monier and Weare January 2011
192. The Impact of Border Carbon Adjustments under Alternative Producer Responses Winchester February 2011
193. What to Expect from Sectoral Trading: A U.S.-China Example Gavard et al. February 2011
194. General Equilibrium, Electricity Generation Technologies and the Cost of Carbon Abatement Lanz and Rausch February 2011
195. A Method for Calculating Reference Evapotranspiration on Daily Time Scales Farmer et al. February 2011
196. Health Damages from Air Pollution in China Matus et al. March 2011
197. The Prospects for Coal-to-Liquid Conversion: A General Equilibrium Analysis Chen et al. May 2011
198. The Impact of Climate Policy on U.S. Aviation Winchester et al. May 2011
199. Future Yield Growth: What Evidence from Historical Data Gitiaux et al. May 2011
200. A Strategy for a Global Observing System for Verification of National Greenhouse Gas Emissions Prinn et al. June 2011
201. Russia’s Natural Gas Export Potential up to 2050 Paltsev July 2011
202. Distributional Impacts of Carbon Pricing: A General Equilibrium Approach with Micro-Data for Households Rausch et al. July 2011
203. Global Aerosol Health Impacts: Quantifying Uncertainties Selin et al. August 201
204. Implementation of a Cloud Radiative Adjustment Method to Change the Climate Sensitivity of CAM3 Sokolov and Monier September 2011
205. Quantifying the Likelihood of Regional Climate Change: A Hybridized Approach Schlosser et al. October 2011
206. Process Modeling of Global Soil Nitrous Oxide Emissions Saikawa et al. October 2011
207. The Influence of Shale Gas on U.S. Energy and Environmental Policy Jacoby et al. November 2011
208. Influence of Air Quality Model Resolution on Uncertainty Associated with Health Impacts Thompson and Selin December 2011
209. Characterization of Wind Power Resource in the United States and its Intermittency Gunturu and Schlosser December 2011
210. Potential Direct and Indirect Effects of Global Cellulosic Biofuel Production on Greenhouse Gas Fluxes from Future Land-use Change Kicklighter et al. March 2012
211. Emissions Pricing to Stabilize Global Climate Bosetti et al. March 2012
212. Effects of Nitrogen Limitation on Hydrological Processes in CLM4-CN Lee & Felzer March 2012
213. City-Size Distribution as a Function of Socio-economic Conditions: An Eclectic Approach to Down-scaling Global Population Nam & Reilly March 2012
214. CliCrop: a Crop Water-Stress and Irrigation Demand Model for an Integrated Global Assessment Modeling Approach Fant et al. April 2012
215. The Role of China in Mitigating Climate Change Paltsev et al. April 2012
216. Applying Engineering and Fleet Detail to RepresentPassenger Vehicle Transport in a Computable General Equilibrium Model Karplus et al. April 2012
217. Combining a New Vehicle Fuel Economy Standard witha Cap-and-Trade Policy: Energy and Economic Impact in the United States Karplus et al. April 2012
218. Permafrost, Lakes, and Climate-Warming Methane Feedback: What is the Worst We Can Expect? Gao et al. May 2012
219. Valuing Climate Impacts in Integrated AssessmentModels: The MIT IGSM Reilly et al. May 2012
220. Leakage from Sub-national Climate Initiatives: The Case of California Caron et al. May 2012
221. Green Growth and the Efficient Use of Natural Resources Reilly June 2012
222. Modeling Water Withdrawal and Consumption for Electricity Generation in the United States Strzepek et al. June 2012
223. An Integrated Assessment Framework for Uncertainty Studies in Global and Regional Climate Change: The MIT IGSM Monier et al. June 2012
224. Cap-and-Trade Climate Policies with Price-Regulated Industries: How Costly are Free Allowances? Lanz and Rausch July 2012.
225. Distributional and Efficiency Impacts of Clean and Renewable Energy Standards for Electricity Rausch and Mowers July 2012.
226. The Economic, Energy, and GHG Emissions Impacts of Proposed 2017–2025 Vehicle Fuel Economy Standards in the United States Karplus and Paltsev July 2012
227. Impacts of Land-Use and Biofuels Policy on Climate: Temperature and Localized Impacts Hallgren et al. August 2012
228. Carbon Tax Revenue and the Budget Deficit: A Win-Win-Win Solution? Sebastian Rausch and John Reilly August 2012
229. CLM-AG: An Agriculture Module for the Community Land Model version 3.5 Gueneau et al. September 2012
230. Quantifying Regional Economic Impacts of CO2Intensity Targets in China Zhang et al. September 2012
231. The Future Energy and GHG Emissions Impact of Alternative Personal Transportation Pathways in China Kishimoto et al. September 2012
232. Will Economic Restructuring in China Reduce Trade-Embodied CO2 Emissions? Qi et al. October 2012
233. Climate Co-benefits of Tighter SO2 and NOx Regulations in China Nam et al. October 2012
234. Shale Gas Production: Potential versus Actual GHG Emissions O’Sullivan and Paltsev November 2012
235. Non-Nuclear, Low-Carbon, or Both? The Case of Taiwan Chen December 2012

![L 37 Modern Physics [3] Nuclear physics –what’s inside the nucleus and what holds it together –what is radioactivity –carbon dating Nuclear energy –nuclear](https://img.pdfslide.net/doc/110x75/56649e615503460f94b5ccce/l-37-modern-physics-3-nuclear-physics-whats-inside-the-nucleus-and.jpg)