Embed Size (px)
Citation preview
FIW, a collaboration of WIFO (www.wifo.ac.at), wiiw (www.wiiw.ac.at) and WSR (www.wsr.ac.at)
FIW – Working Paper
Non-Price Competitiveness of Exports from Emerging Countries
Konstantins Benkovskis1, Julia Wörz2
We analyse EMEs global competitiveness whereby we explicitly take account of non-price aspects of competitiveness building on the methodology developed in Feenstra (1994) and Broda and Weinstein (2006) and the extension provided in Benkovskis and Wörz (2012). We construct an export price index which adjusts for changes in the set of competitors (variety) and changes in non-price factors (quality in a broad sense) for a set of nine large emerging economies (Argentina, Brazil, Chile, China, India, Indonesia, Mexico, Russia and Turkey). We use a highly disaggregated data set at the detailed 6-digit HS level over the period 1999-2010. In contrast to the conclusions based on the CPI-based real effective exchange rate we find that there are rather pronounced differences between individual markets. As a first and important result, China shows a huge gain in international competitiveness due to non-price factors thus suggesting that the role of Renminbi undervaluation for China’s competitive position may be overstressed. The strong improvements in Russia's non-price competitiveness are exclusively due to developments in the oil sector as are the competitive losses observed for Argentina and Indonesia. Further, Brazil, Chile, India, and Turkey show discernible improvements in their competitive position when accounting for non-price factors while Mexico's competitiveness has deteriorated regardless of the index chosen. JEL : C43, F12, F14, L15 Keywords: non-price competitiveness, quality, relative export price,
emerging countries
1 Monetary Policy Department, Latvijas Banka, [email protected] 2 Foreign Research Division, Oesterreichische Nationalbank, [email protected]
Abstract
Authors
FIW Working Paper N° 100 August 2012

1
Non-Price Competitiveness of Exports from Emerging Countries Konstantins Benkovskis1, Julia Wörz2
Abstract
We analyse EMEs global competitiveness whereby we explicitly take account of non-
price aspects of competitiveness building on the methodology developed in
Feenstra (1994) and Broda and Weinstein (2006) and the extension provided in
Benkovskis and Wörz (2012). We construct an export price index which adjusts for
changes in the set of competitors (variety) and changes in non-price factors (quality
in a broad sense) for a set of nine large emerging economies (Argentina, Brazil,
Chile, China, India, Indonesia, Mexico, Russia and Turkey). We use a highly
disaggregated data set at the detailed 6-digit HS level over the period 1999-2010. In
contrast to the conclusions based on the CPI-based real effective exchange rate we
find that there are rather pronounced differences between individual markets. As a
first and important result, China shows a huge gain in international competitiveness
due to non-price factors thus suggesting that the role of Renminbi undervaluation for
China’s competitive position may be overstressed. The strong improvements in
Russia's non-price competitiveness are exclusively due to developments in the oil
sector as are the competitive losses observed for Argentina and Indonesia. Further,
Brazil, Chile, India, and Turkey show discernible improvements in their competitive
position when accounting for non-price factors while Mexico's competitiveness has
deteriorated regardless of the index chosen.
JEL-codes: C43, F12, F14, L15
Keywords: non-price competitiveness, quality, relative export price, emerging
countries
The views expressed in this research are those of the authors and should not be reported as representing the views of the Oesterreichische Nationalbank and Latvijas Banka. The authors assume responsibility for any errors and omissions. 1 Monetary Policy Department, Latvijas Banka, [email protected] 2 Foreign Research Division, Oesterreichische Nationalbank, [email protected]
2
1. Introduction
Emerging economies attain a continuously growing share in world trade. In 1999, the
share of emerging and developing countries in total world exports amounted to 35%
while this share has risen to 49% in 2011 (CPB World Trade Monitor February 2011). The
gain in global export market share was a consequence of the substantial growth
differential between the two groups of countries. Average annual real export growth
of emerging markets amounted to 8.4% over the period 1999-2011, more than twice
the 3.2% per annum growth performance recorded for advanced countries’ exports
(CPB World Trade Monitor February 2011). This greatly increased importance at the
world market reflects a rise in competitiveness of emerging relative to advanced
economies. One of the first studies to notice this competitive strength is Durand et
al. (1998). They focus on East Asian economies in the wake of the Asian crisis and
note that the sharp depreciations in those countries have resulted in substantial gains
in nominal price competitiveness. They find that Asian countries, in particular China,
have emerged as important competitors to OECD countries, altering also the overall
pattern of competition in the three major OECD regions – USA, EU and Japan.
However, they also notice that nominal competitiveness gains through currency
devaluations were often offset by cost and price inflation in those countries, thus
yielding a smaller influence on patterns of real competitiveness. In the same vein, the
observation of real effective exchange rates of Central and Eastern European
catching-up economies would even reveal a loss in pure price competitiveness,
given the long-run real appreciation trend during their transformation process.
However, as argued by Benkovskis and Wörz (2012), even this trend does not
necessarily reflect losses in competitiveness, once price developments are
calculated net of quality improvements.
We derive our methodological framework from an analysis of costs and price
differentials. However, relative price movements may arise for different reasons such
as underlying changes in production costs, technological change, changes in
consumers’ valuation and quality. Certainly, measurement especially of the latter
factors is difficult if not impossible, thus one has to resort to indirect estimation
methods in order to control for such factors.
In this paper, we illustrate price and non-price competitiveness of a range of globally
important emerging markets over the period 1999-2010. Taken together our sample
of nine emerging economies – Argentina, Brazil, Chile, China, India, Indonesia,
3
Mexico, Russia and Turkey – represents roughly one fifth of total world exports. The
existing literature on these countries focuses largely on price competitiveness. As
emerging economies, their productivity and hence wage levels are clearly below
those of their industrialized competitors. This would give them a natural cost
advantage which should result in strong price competitiveness. However, at the
same time their catching-up experience induces rising price levels thus curbing this
cost advantage in real terms over time. Further, the catching-up process makes
them attractive locations for foreign capital inflows which further creates an
appreciation pressure.3
Our approach allows us to indirectly take account of non-price aspects of
competitiveness. We measure the evolution of competitiveness by relative export
prices, whereby we allow for entry and exit of competitors in narrowly defined goods
markets and we control for changes in non-price aspects (such as quality) of
exported goods over time. This enables us to assess to what extent the outstanding
export performance of these major emerging economies over the past decade is
explained by their ability to produce cheaply and thus exploit their cost advantage
and to what extent they have improved the quality of their exported products in a
broad sense (encompassing physical characteristics as well as labelling and meeting
consumer's tastes).
Finally, their integration into global value chains may impact
positively on productions processes or product quality. Clearly, these factors – while
weighing negatively on price competitiveness as measured through the real
(effective) exchange rate – may also have a positive influence on competitiveness
in a more comprehensive way through (human) capital upgrading and increased
productivity.
For our analysis we use the approach developed in Benkovskis and Wörz (2012). This
approach builds on the framework developed by Feenstra (1994) and Broda and
Weinstein (2006) for the calculation of variety-adjusted import prices, applies it to
export prices and extends it to incorporate changes in the quality of goods and the
set of competitors. By quality we mean both, physical properties as well as changes
in consumers’ evaluation of goods, i.e. tastes and labelling.
The paper proceeds as follows: The next section summarizes conventional wisdom
with respect to price competitiveness as described by the real effective exchange
rate. It further explains why the real effective exchange rate gives an insufficient 3 See for example Ibarra (2011) for supporting evidence of this effect in Mexico.
4
picture of a country’s competitiveness, as it conceals non-price elements of
competitiveness. Section 3 outlines our methodological approach to reveal these
non-price aspects, section 4 describes the data base and section 5 reports the
results. Conclusions are given in section 6.
2. From Price to Non-Price Competitiveness
International competitiveness of a country is often assessed by looking at its real
exchange rate, which reflects relative changes in nominal exchange rates net of
differences in inflation rates. Inflation can be measured in terms of consumer price
inflation (i.e. CPI-based), by producer prices (PPI-based) or by unit labour costs.
Apart from bilateral comparisons, competitiveness can also easily be measured
more generally through the real effective exchange rate (REER) index which is a
trade-weighted average of all bilateral real exchange rates. While these calculations
are tedious, they are nevertheless attractive as the necessary data – exchange rates
and inflation rates – are usually easily available.
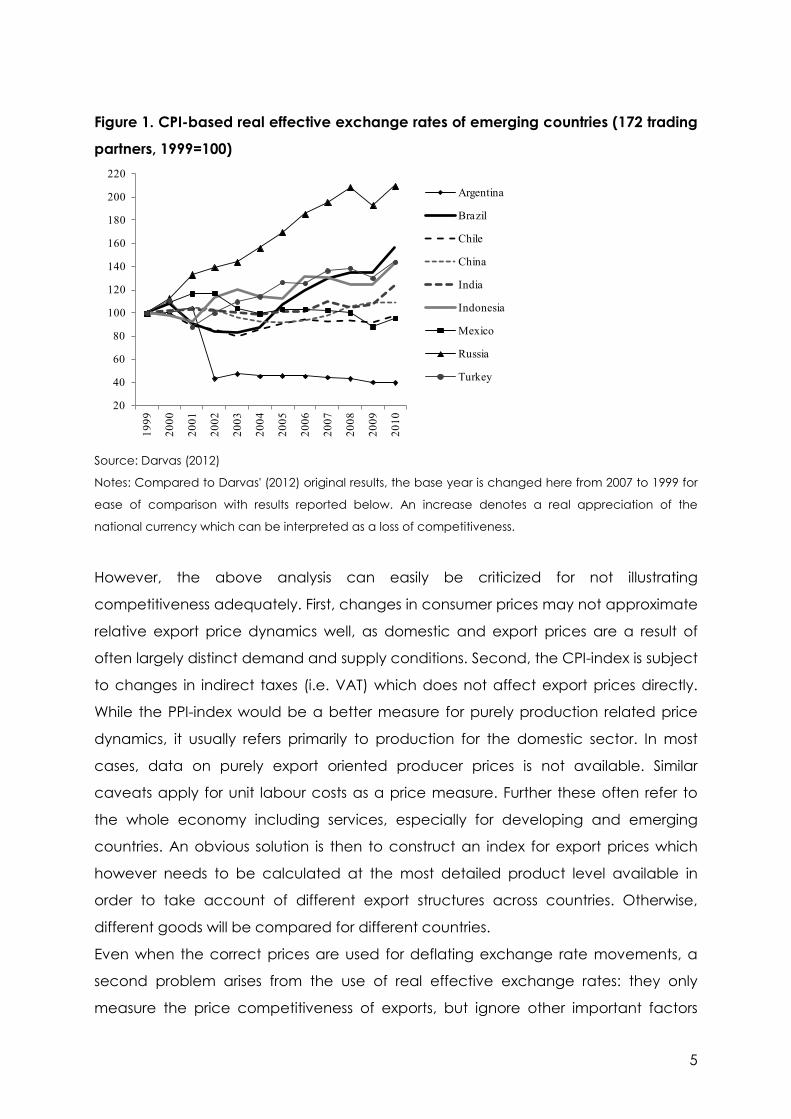
Figure 1 below shows CPI-based real effective exchange rates for our nine countries
over the entire observation period (see Darvas, 2012 for the description of
calculations). An increase reflects a real appreciation and is thus associated with a
loss in international competitiveness. We see that apart from Argentina, Mexico and
Chile, most countries experienced such a loss in price competitiveness as measured
through the CPI-based REER. The increase in relative prices was especially
pronounced for Russia, Brazil, Turkey and Indonesia. In Russia, this is clearly related to
the dominance of energy products in exports. High oil revenues lead to higher
incomes with a consequent upward pressure on inflation and hence the real
effective exchange rate. In Turkey, the disinflation process after the 2001 crisis has
supported the long-term appreciation trend with an adverse effect on external price
competitiveness. India and China show no clear development, only in the most
recent years a trend towards rising relative prices can be distinguished. All countries
show signs of improving or stable price competitiveness in 2009, the year when the
financial and economic crisis was felt globally.
5
Figure 1. CPI-based real effective exchange rates of emerging countries (172 trading
partners, 1999=100)
Source: Darvas (2012)
Notes: Compared to Darvas' (2012) original results, the base year is changed here from 2007 to 1999 for
ease of comparison with results reported below. An increase denotes a real appreciation of the
national currency which can be interpreted as a loss of competitiveness.
However, the above analysis can easily be criticized for not illustrating
competitiveness adequately. First, changes in consumer prices may not approximate
relative export price dynamics well, as domestic and export prices are a result of
often largely distinct demand and supply conditions. Second, the CPI-index is subject
to changes in indirect taxes (i.e. VAT) which does not affect export prices directly.
While the PPI-index would be a better measure for purely production related price
dynamics, it usually refers primarily to production for the domestic sector. In most
cases, data on purely export oriented producer prices is not available. Similar
caveats apply for unit labour costs as a price measure. Further these often refer to
the whole economy including services, especially for developing and emerging
countries. An obvious solution is then to construct an index for export prices which
however needs to be calculated at the most detailed product level available in
order to take account of different export structures across countries. Otherwise,
different goods will be compared for different countries.
Even when the correct prices are used for deflating exchange rate movements, a
second problem arises from the use of real effective exchange rates: they only
measure the price competitiveness of exports, but ignore other important factors
20
40
60
80
100
120
140
160
180
200
220
1999
2000
2001
2002
2003
2004
2005
2006
2007
2008
2009
2010
Argentina
Brazil
Chile
China
India
Indonesia
Mexico
Russia
Turkey
6
such as changes in the quality of exported products (Flam and Helpman, 1987).
Quality can be related to both, objective factors such as physical properties and
new technological features but also subjective factors such as changes in tastes,
branding or labelling.
A third caveat lies in the fact that consumers gain utility also simply from increased
product variety through international trade. Thus, while for example the CPI or the PPI
are adjusted for changes in product variety, they cannot take account of changes
in the number of products which are available in each year.
Therefore we chose to employ a new quality- and set of competitors-adjusted index
which improves on existing measures and allows us to disentangle changes in pure
price competitiveness from changes in non-price competitiveness. By non-price
competitiveness we refer to changes in variety and quality. Variety is defined
following the Armington assumption (Armington, 1969) as products from different
origins within the same product category. Quality is defined as tangible and
intangible attributes of a product that changes consumer’s valuation of it (Hallak
and Schott, 2008) and thus refers to physical attributes of the product as well as
tastes.
3. Disaggregated approach to measure price and non-price competitiveness
In this section we will apply the disaggregated approach proposed by Benkovskis
and Wörz (2012) to measure price and non-price competitiveness of emerging
countries' exports. This approach is based on the methodology developed by
Feenstra (1994) and Broda and Weinstein (2006), while the evaluation of unobserved
quality or taste parameter is based on work of Hummels and Klenow (2005). The main
idea is that consumers are not focused just on physical quantities, but they also value
variety (i.e. the set of exporters in line with the Armington assumption). Moreover,
consumers' utility also depends on quality or taste of a product. By solving the
consumers' maximization problem it is possible to introduce the abovementioned
non-price factors into a measure for relative export prices (see Appendix,
sections A1-A4 for technical derivations). Having derived a formula for a variety- and
quality-adjusted import price index, we use the mirror image of trade flows to apply
this formula to export prices. In other words, we interpret imports of product g
originating from country c as country c’s export of product g to the importing
market.
7
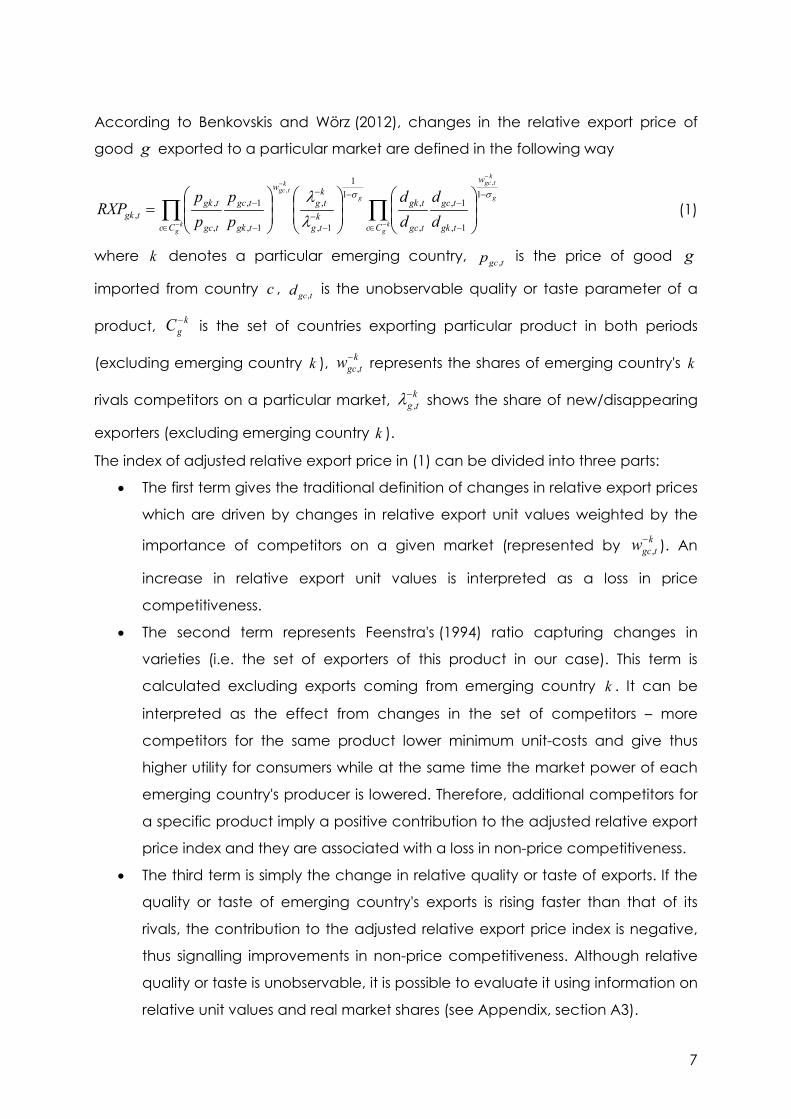
According to Benkovskis and Wörz (2012), changes in the relative export price of
good g exported to a particular market are defined in the following way
∏∏−
−
−
−
∈
−
−
−−
−−
−
∈ −
−
=
kg
g
ktgc
g
kg
ktgc
Cc
w
tgk
tgc
tgc
tgkktg
ktg
Cc
w
tgk
tgc
tgc
tgktgk d
ddd
pp
pp
RXPσσ
λλ 1
1,
1,
,
,1
1
1,
,
1,
1,
,
,,
,,
(1)
where k denotes a particular emerging country, tgcp , is the price of good g
imported from country c , tgcd , is the unobservable quality or taste parameter of a
product, kgC − is the set of countries exporting particular product in both periods
(excluding emerging country k ), ktgcw−, represents the shares of emerging country's k
rivals competitors on a particular market, ktg
−,λ shows the share of new/disappearing
exporters (excluding emerging country k ).
The index of adjusted relative export price in (1) can be divided into three parts:
• The first term gives the traditional definition of changes in relative export prices
which are driven by changes in relative export unit values weighted by the
importance of competitors on a given market (represented by ktgcw−, ). An
increase in relative export unit values is interpreted as a loss in price
competitiveness.
• The second term represents Feenstra's (1994) ratio capturing changes in
varieties (i.e. the set of exporters of this product in our case). This term is
calculated excluding exports coming from emerging country k . It can be
interpreted as the effect from changes in the set of competitors – more
competitors for the same product lower minimum unit-costs and give thus
higher utility for consumers while at the same time the market power of each
emerging country's producer is lowered. Therefore, additional competitors for
a specific product imply a positive contribution to the adjusted relative export
price index and they are associated with a loss in non-price competitiveness.
• The third term is simply the change in relative quality or taste of exports. If the
quality or taste of emerging country's exports is rising faster than that of its
rivals, the contribution to the adjusted relative export price index is negative,
thus signalling improvements in non-price competitiveness. Although relative
quality or taste is unobservable, it is possible to evaluate it using information on
relative unit values and real market shares (see Appendix, section A3).
8
Finally, we need to design an aggregate relative export price as the index in (1)
describes relative export prices only for one specific product which is exported to
one particular country. The aggregate adjusted relative export price index can be
defined as a weighted average of specific market indices, where weights are given
by shares of those markets in emerging country's exports.
4. Description of the database
For the empirical analysis in this paper we use trade data from UN Comtrade. The
main reason for using this data source is its global country coverage. Although the
data reported in UN Comtrade has a lower level of disaggregation and a longer
publication lag as compared to Eurostat’s COMEXT, the world-wide coverage of the
UN database is a significant advantage. We use the most detailed level reported by
UN Comtrade, which is the six-digit level of the HS (Harmonized System, 1996). This
gives us 5132 different products, which still ensures a reasonable good level of
disaggregation. While this is lower than the 8-digit CN (Combined Nomenclature)
level available through Eurostat’s COMEXT (yielding more than 10000 different
products), it is still well sufficient to calculate unit values.
Notwithstanding our final goal, which is to evaluate competitiveness of exports from
emerging countries, we use import data of partner countries for the analysis. The
reason for focusing on partners' imports rather than on emerging countries' exports is
driven by the theoretical framework on which our evaluation of price and non-price
competitiveness is based. The methodology used in this paper starts from the
consumers' utility maximization problem, as outlined above. In this case, import data
is clearly to be preferred as imports are reported in CIF (cost, insurance, freight)
prices and thus include transportation costs until the importers' border. Hence, import
data provide a better comparison of prices from a consumers' point of view. On the
other hand, the usage of import data implies some drawbacks. Obviously, the data
on imports from emerging countries does not fully coincide with emerging countries'
reported exports due to differences in valuation, timing, sources of information and
incentives to report. However, in general and especially with respect to emerging
economies, which are still subject to import tariffs for a considerable range of their
product, import data are well reported as the authorities have an interest in the
proper recording of imports for they collect a tariff revenue.
9
Our import dataset contains annual data on imports of 75 countries at the six-digit HS
level between 1999 and 2010.4
We use unit value indices (dollars per kg) as a proxy for prices and trade volume (in
kg) as a proxy for quantities. If data are missing for either values or volumes, or data
on volumes is not observed directly but is estimated by statistical authorities, no unit
value index can be calculated. Unfortunately, the possibility to estimate unit values is
relatively scarce for many reporting countries. Even for the US– the world’s major
importer – the available import data allows the calculation of unit values for only
about 70% of all imports in 2010 (in value terms). The situation is much better for the
EU countries, China, Japan, but for some countries (e.g. Canada, Mexico, Australia)
the coverage is only around 50% or even less. In addition, the coverage is usually
worse for the first half of the sample period. This problem makes the analysis of non-
price competitiveness more challenging and our results should be treated with a
pinch of salt. However, the sometimes low coverage of available unit values in
several countries is rather homogenous across different product groups and we can
argue that this problem should not affect our results significantly. The other
adjustment we made to the database is related to structural changes within the
categories of goods. Although we use the most detailed classification available, it is
still possible that sometimes we are comparing apples and oranges within one
particular category. One indication of such a problem is given by large price level
The list of reporters (importers) can be found in
Appendix, Table A1. By collecting data on imports of abovementioned 75 countries
we a covering more than 96% of world imports in 2010. Several importer countries
(like the United Arab Emirates, Vietnam, Egypt, and Kazakhstan) were not included in
the dataset due to lack of detailed data or missing information for 2010. To avoid
calculation burdens we restrict the list of partners (exporters) to 75 countries as well.
The list of exporters can also be found in Table A1 (note that the list of exporters is not
fully coinciding with the list of importers). These 75 most important exporter countries
are responsible for roughly 93% of world imports in 2010; therefore, our database is a
representative reflection of global trade flows.
4 For some countries data is not available for several years at the beginning or in the middle of the sample period: import data for South Africa, Philippines, Oman and Tunisia is not available in 1999, for Ukraine and Ethiopia in 1999-2000, for Malaysia, Bahrain and the Dominican Republic in 1999-2001, for Pakistan and Bosnia Herzegovina in 1999-2002, for Serbia in 1999-2004, for Sri Lanka in 2000, for Panama in 2004, and for Nigeria in 2004-2005.
10
differences within a product code. Consequently, all observations with outlying unit
value indices were excluded from the database.5
Finally, for construction of aggregated relative export price index we use export data
of our nine emerging countries. We need export data to reflect the structure of
exports adequately. Export dataset contains annual value data on exports to
abovementioned 75 importer countries at the six-digit HS level between 1999 and
2010.
5. Empirical results for emerging countries' exports
We start by calculating a rather conventional export price index, which ignores
changes in the set of competitors and in non-price factors. This index is given by the
solid line in Figure 2 below. We then augment this index to take account of exit and
entry of competitors in each narrowly defined goods market (dashed line). Finally,
we adjust the export price index for non-price competitiveness including quality and
tastes (indicated by the line marked with diamonds).
Compared to the findings based on real effective exchange rates, we do not
observe any strong gains or losses in price competitiveness for these countries when
we use the conventional export price index. Most countries have neither
experienced notable gains, nor great losses in international price competitiveness.
The line representing this index in figure 2 is almost flat for most emerging countries
and fluctuates narrowly around the initial level. Only Chile shows notable signs of
improving price competitiveness since 2006. Further Indonesia, China and India
record a small gain in price competitiveness. In fact, we would have expected to
see stronger evidence of rising price competitiveness in China, given the often cited
undervaluation of the Chinese currency.6
5 An observation is treated as an outlier if the absolute difference between the unit value and the median unit value of the product category in the particular year exceeds four median absolute deviations. The exclusion of outliers does not significantly reduce the coverage of the database. In the majority of cases only less than 2% of total import value was treated as an outlier. 6 Coudert and Couharde (2007) relate this undervaluation to the absence of the Balassa-Samuelson effect in China which can be inferred from the limited degree of currency appreciation despite the strong catching-up performance. The issue of China's currency undervaluation is not only strongly debated because of its effects on advanced countries – most prominently the large US trade deficit – but also within the context of competition among emerging markets. Pontimes and Siregar (2012) observe a great concern in East Asian countries with respect to relative appreciation mainly against the Chinese Renminbi and much less so against the US dollar which points to strong intraregional price competition. Gallagher et al. (2008) mention Chinese undervaluation as one potential detrimental effect on Mexico's export performance besides other, also domestic factors.
11
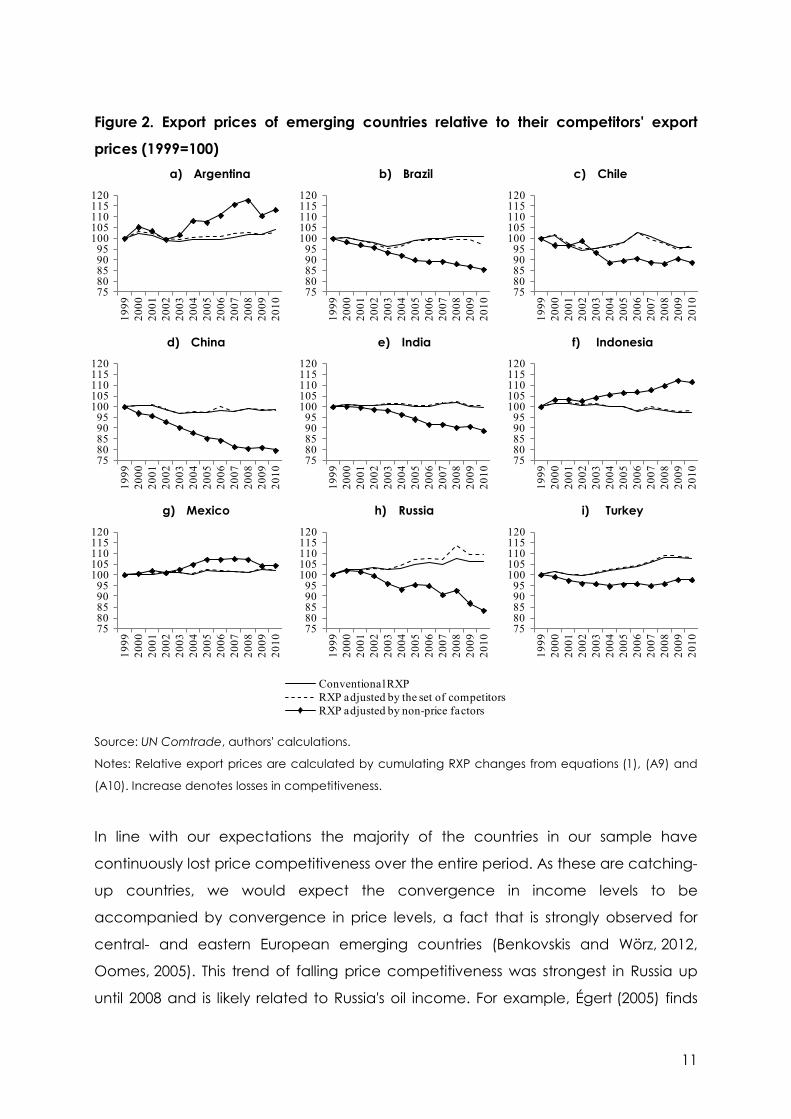
Figure 2. Export prices of emerging countries relative to their competitors' export
prices (1999=100) a) Argentina b) Brazil c) Chile
d) China e) India f) Indonesia
g) Mexico h) Russia i) Turkey
Source: UN Comtrade, authors' calculations.
Notes: Relative export prices are calculated by cumulating RXP changes from equations (1), (A9) and
(A10). Increase denotes losses in competitiveness.
In line with our expectations the majority of the countries in our sample have
continuously lost price competitiveness over the entire period. As these are catching-
up countries, we would expect the convergence in income levels to be
accompanied by convergence in price levels, a fact that is strongly observed for
central- and eastern European emerging countries (Benkovskis and Wörz, 2012,
Oomes, 2005). This trend of falling price competitiveness was strongest in Russia up
until 2008 and is likely related to Russia's oil income. For example, Égert (2005) finds
7580859095
100105110115120
1999
2000
2001
2002
2003
2004
2005
2006
2007
2008
2009
2010
7580859095
100105110115120
1999
2000
2001
2002
2003
2004
2005
2006
2007
2008
2009
2010
7580859095
100105110115120
1999
2000
2001
2002
2003
2004
2005
2006
2007
2008
2009
2010
7580859095
100105110115120
1999
2000
2001
2002
2003
2004
2005
2006
2007
2008
2009
2010
7580859095
100105110115120
1999
2000
2001
2002
2003
2004
2005
2006
2007
2008
2009
2010
7580859095
100105110115120
1999
2000
2001
2002
2003
2004
2005
2006
2007
2008
2009
2010
7580859095
100105110115120
1999
2000
2001
2002
2003
2004
2005
2006
2007
2008
2009
2010
7580859095
100105110115120
1999
2000
2001
2002
2003
2004
2005
2006
2007
2008
2009
2010
7580859095
100105110115120
1999
2000
2001
2002
2003
2004
2005
2006
2007
2008
2009
2010
Conventional RXPRXP adjusted by the set of competitorsRXP adjusted by non-price factors
12
some evidence for a Dutch Disease pattern in Russia which explains the real
appreciation trend and Égert (2003) further points towards exchange rate pass
through, oil price shocks and cyclical factors as determinants of inflation in Russia. As
an observation from our data, when oil prices were greatly reduced in the beginning
of the global economic crisis, prices for Russian exports fell considerably.7
However, as soon as we adjust for non-price factors such as quality improvements,
the results become more differentiated between countries. The majority of countries
in our sample show clear improvements in non-price competitiveness (as reflected in
a falling double-adjusted export price index). In particular China is standing out,
prices of Chinese goods on international markets fell by more than 20% when
correcting for quality improvements and other non-price factors. No other emerging
economy in our sample comes close to realizing such a large gain in
competitiveness. Only some of the small and highly open transformation countries in
Central-, Eastern- and Southeastern Europe have shown comparable improvements
in non-price adjusted competitiveness over the same period of time (see Benkovskis
and Wörz, 2012). Thus, the rise of China as a trading power - in 2009 China has
overtaken Germany and become the world’s largest exporter - is based to a great
extent on non-price factors in addition to its abundance of (relatively cheap) labour.
Our finding corroborates the earlier results by Fu et al. (2012) who observe weakening
price competition and rising importance of non-price factors such as quality and
variety for China over the period 1989-2006. They analyze unit prices of imports into
the EU, Japan and the US (thus looking at a smaller and more homogenous market
than in our analysis) and conclude that this trend – if sustained – poses a serious
threat to high income-countries. Our findings also support the view that a revaluation
of the exchange rate would only be of limited impact to China's competitiveness
(Mazier et al., 2008, Coudert and Couharde, 2007).
Similarly
Turkey shows a continuous trend of decreasing price competitiveness until 2008 and
some stabilization since. Adjusting the index for changes in the set of competitors
does not lead to any worthwhile changes - the two lines are almost identical for all
countries.
7 Given the relatively inelastic demand for oil products in normal times, this deterioration in Russian price competitiveness up until 2008 did not impact notably on Russia's global market share, a fact that is well documented in the empirical literature (Ahrend, 2006, Cooper, 2007, Porter, 2007, Robinson, 2009 and 2011) and which we discuss below.
13
These enormous improvements in China's international non-price competitiveness
have raised various discussions already. Kaplinsky and Morris (2008) note that the
dominance of China in sectors which serve traditionally as early sectors for
industrialization (such as textiles and clothing) precludes other emerging but even
more so developing countries from embarking on a successful export-led growth
strategy in these sectors. Indeed our results show that China's competitiveness in
textiles – representing one fifth of total Chinese exports – has risen particularly strongly
due to a high contribution of non-price factors.8
The notable improvement in Russia's non-price competitiveness which is observed in
our non-price adjusted index since the Russian crisis is uniquely related to exports of
oil, Russia's prime export good.
9
Brazil, Chile, and India also show worthwhile improvements in their non-price adjusted
competitiveness, a finding which is robust to excluding oil products from the analysis.
In line with our results, Brunner and Cali (2006) also observe rising unit values for South
Asia in their analysis of technology upgrading in this regions. However, they report a
closing of the technology gap by the South Asian countries only with respect to
Southeast Asia and not with respect to OECD countries. Interestingly our detailed
When oil is excluded from the analysis, a small
deterioration in non-price competitiveness is observed for Russia (see figure A1 in the
Appendix). The global financial crisis along with falling demand for oil interrupted this
trend in 2008 which however became noticeable again in the two most recent
years. This is line with the empirical literature on Russia's competitiveness.
Ahrend (2006) finds that Russia has experienced great increases in labour
productivity in its major export sectors, but at the same time he observes that these
increases in competitiveness remain limited to a small number of primary commodity
and energy-intensive sectors. Robinson (2009) also stresses Russia's dependence on
oil exports which entails some risk of a Dutch Disease problem in the future (even if
this has not materialized so far). He further emphasizes the role of current Russian
policies and a need for political reform in order to abate this risk (Robinson, 2011).
Finally, Ferdinand (2007) observes similarities between Russia and China in their
orientation towards building on and further promoting national industrial champions
which consequently foster specialization.
8 These detailed results by sector (as well as by trading partner) are not reported in the paper but are available from the authors upon request. 9 In 2010, mineral products accounted for 71% of Russia's exports.
14
results for India by trading partners10
Thus, while the majority of emerging countries in our sample (5 out of 9) experienced
a loss in price competitiveness, the ratio is exactly opposite for non-price
competitiveness.
show the same pattern for the first half of our
observation period, while the picture becomes more differentiated in more recent
years: the increase in non-price competitiveness on the U.S. market accelerated
considerably from 2005 onwards, we further observe strong rises in price
competitiveness vis-á-vis France and the U.K. The results for Turkey also suggest some
marginal improvements in non-price factors, a finding which is again robust to
excluding oil exports. These competitiveness improvements were most pronounced
in 2001, the year of the major currency and banking crisis.
11 However, we also observe some apparent losses in non-price
competitiveness in Argentina and Indonesia. In both cases the finding is not robust to
excluding oil exports.12
Interestingly, the crisis in 2009 is not visible in these indices in contrast to the findings
based on real effective exchange rates. This is to be expected, since changes in
non-price factors are driven more strongly by structural and thus longer-term factors,
while exchange rates and also consumer prices react much faster to changes in
global demand conditions.
Figure A1 in the appendix shows that when oil is excluded,
both countries show no apparent positive or negative trend. Finally, Mexico shows
some clear signs of weakening export competitiveness in all three versions of our
indicator, the results are invariant to excluding oil products. The deterioration is
particularly pronounced in the indicator which is adjusted for non-price factors, thus
raising serious concerns about Mexico's global competitiveness. With respect to price
competitiveness, this is most likely explained by peso appreciation. Ibarra (2011)
relates this appreciation trend to strong capital inflows with a resulting upward
pressure on the exchange rate. Gallagher at al. (2008) mention additional factors,
such as the decline in public and infrastructure investment in Mexico, limited access
to bank credit for export purposes and the lack of a government policy to spur
technological innovation.
10 These results are available from the authors on request. 11 Taking the sensitivity of the results with respect to oil exports into account, we do not include Russia into the group of countries that experienced a gain in non-price competitiveness. 12 Mineral products are the most important export category for Indonesia, representing 36% of all exports in 2010. With a share of 7% they are considerably less important for Argentina.
15
Conclusions
In this paper we illustrate an aspect of international competitiveness that is often
overlooked, especially in the literature on emerging economies. When assessing
competitiveness in context with emerging markets, the emphasis is often on price
competitiveness. Especially when applied to developing and emerging markets, the
effects of sharp (or sometimes forced) devaluations are frequently discussed – given
the long and also recent history of currency crisis in such economies - as is the
abundance of relatively cheap labour in those markets which should give them
considerable cost advantages. To our knowledge, there is no study that explicitly
analyses non-price competitiveness in emerging economies within the rather
narrowly defined concept of competitiveness as “a country’s ability to sell goods
internationally”.
We attempt to fill this gap and go beyond pure price competitiveness. We measure
the evolution of competitiveness by relative export prices, whereby we allow for
entry and exit of competitors in narrowly defined goods markets and we control for
changes in non-price aspects (such as quality or taste) of exported goods over time.
This builds on the approach developed by Feenstra (1994), Broda and
Weinstein (2006) and extended by Benkovskis and Wörz (2011, 2012). We use a highly
disaggregated data set of (almost) global imports and exports at the detailed 6-digit
HS level (yielding more than 5000 products) over the period 1999-2010. This period is
more or less free of any country-specific economic crises in any of the countries
covered in our sample. The sample consists of nine large emerging economies
(Argentina, Brazil, Chile, China, India, Indonesia, Mexico, Russia and Turkey). Together
they represent roughly one fifth of total world exports. The observation period starts
right after the Russian and Asian crisis, it thus excludes at large domestically
important crisis (apart from Turkey’s 2001 crisis). However, it includes the current
global financial and economic crisis, which is likely to affect the nine emerging
markets in a highly similar fashion.
While we also observe some losses in price competitiveness for the majority of
countries in our sample when we base our conclusions on the traditional export price
index, these losses are far less pronounced compared to the conclusions from the
CPI-based real effective exchange rate. Taking changes in the global set of
competitors into account does not alter the picture, which shows that the set of
competitors is not rapidly changing during one year.
16
However, as soon as we allow for non-price factors such as changes in the (physical
or felt) quality of exported products we observe more pronounced developments in
individual emerging markets. As a first and important result, non-price factors
contribute strongly to increases in China's international competitiveness. This
corroborates China’s strong position at the global market as it further adds to various
other factors such as the size and structure of the labour force. Our results suggest
that the role of the exchange rate for China’s competitive position may be
overstressed. Further, Brazil, Chile and India show discernible improvements in their
competitive position. The surprisingly strong non-price related improvement of Russia's
export position is entirely related to developments in the oil sector, which however
accounted for roughly 70% of Russia' exports in 2010. Further, also Turkey showed
some modest improvements in non-price competitiveness. The rather pronounced
losses in non-price competitiveness for Argentina and Indonesia are again fully due
to developments in the oil sector, whereby oil exports are far less important for these
countries compared to Russia (36% for Indonesia and 7% for Argentina). Finally, our
results confirm earlier findings in the literature for Mexico: We observe a loss in
Mexican price as well as non-price competitiveness.
Although our analysis is based on highly disaggregated data and separates price-
from non-price-effects, it cannot give a comprehensive idea of competitiveness
alone. Clearly competitiveness continues to be a vague concept, and therefore
multiple approaches have to be combined before drawing any firm conclusions.
However, our analysis points towards important factors that are often ignored, mostly
because data sources are missing. Our methodology offers a simple, but
theoretically sound way to look explicitly at price- versus quality-adjustments in
international competitiveness. Bearing all methodological and data-related caveats
in mind, the results have to be interpreted with care.
Another important issue is increasing global integration of production and shifts in
geographical patterns of production chains. Internationalization of production
implies a diminishing domestic component of exports, therefore data on gross trade
flows is no more an adequate representative of a country's competitiveness.
Combining trade data with information from input-output tables is a potential
solution and can lead the direction of further research to investigate the value
added components of exports.
17
Bibliography
Ahrend, R. (2006). 'Russian Industrial Restructuring: Trends in Productivity,
Competitiveness and Comparative Advantage', Post-Communist Economies 18(3),
pp. 277-295.
Armington, P.S. (1969). 'A Theory of Demand for Products Distinguished by Place of
Production', International Monetary Fund Staff Papers, 16(1), pp. 159–178.
Benkovskis, K. and Wörz, J. (2012). 'Evaluation of Non-Price Competitiveness of Exports
from Central and Eastern European Countries', Bank of Latvia Working Paper 1/2012
and Focus on European Economic Integration Q3/2012 (forthcoming).
Benkovskis, K. and Wörz, J. (2011). 'How Does Quality Impact on Import Prices?', OeNB
Working Paper No. 175.
Bloningen, B.A. and Soderbery, A. (2010). 'Measuring the Benefits of Foreign Product
Variety with an Accurate Variety Set', Journal of International Economics, 82(2),
pp. 168–180.
Broda, C. and Weinstein, D.E. (2006). 'Globalization and the Gains from Variety',
Quarterly Journal of Economics, 121(2), pp. 541–585.
Brunner, H.P. and Calì, M. (2006). 'The dynamics of manufacturing competitiveness in
South Asia: An analysis through export data', Journal of Asian Economics 17(4),
pp. 557-582.
Cooper, J. (2007). 'Can Russia Compete in the Global Economy?', Eurasian
Geography and Economics 47(4 ), pp. 407-425.
Coudert, V. and Couhard, C. (2007) 'Real equilibrium exchange rate in China is the
renminbi undervalued?', Journal of Asian Economics 18(4), pp. 568-594.
Darvas, Z. (2012). 'Real effective exchange rates for 178 countries: a new database',
Bruegel Working Paper, 2012/06.
Diewert, W.E. (1993a). 'Index Numbers', In: 'Essays in Index Number Theory, Volume I',
eds. Diewert, W.E. and Nakamura, A.O., Chapter 5, Elsevier Science Publishers B.V.,
pp. 71-108.
Diewert, W.E. (1993b). 'The Economic Theory of Index Numbers: A Survey', In: 'Essays in
Index Number Theory, Volume I', eds. Diewert, W.E. and Nakamura, A.O., Chapter 7,
Elsevier Science Publishers B.V., pp. 177-228.
Durand, M., Madaschi, Ch. and Terribile, F. (1998). ‘Trends in OECD Countries’
International Competitiveness: The Influence of Emerging Market Economies’, OECD
Economics Department Working Papers No. 195.
18
Égert, B. (2005). 'Equilibrium exchange rates in South Eastern Europe, Russia, Ukraine
and Turkey: Healthy or (Dutch) diseased?', Economic Systems 29(2), pp. 205-241.
Égert, B. (2003). 'The Balassa-Samuelson effect in Central and Eastern Europe: myth or
reality?', Journal of Comparative Economics 31(3), pp. 552-572.
Feenstra, R.C. (1994). 'New Product Varieties and the Measurement of International
Prices', American Economic Review, 84(1), pp. 157–177.
Ferdinand, P. (2007). 'Russia and China: converging responses to globalization',
International Affairs 83(4), pp. 655–680.
Flam, H. and Helpman, E. (1987). 'Vertical Product Differentiation and North-South
Trade', American Economic Review 77(5), December, pp. 810–822.
Fu, X. Kaplinsky, R. and Zhang, J. (2012). 'The Impact of China on Low and Middle
Income Countries’ Export Prices in Industrial-Country Markets', World Development
40(8), pp. 1483-1496.
Gallagher, K.P. Moreno-Brid, J.C. and Porzecanski, R. (2008). 'The Dynamism of
Mexican Exports: Lost in (Chinese) Translation?' World Development 36(8), pp. 1365-
1380.
Hallak, J.C. and Schott, P.K. (2008), 'Estimating Cross-Country Differences in Product
Quality', NBER Working Paper No. 13807, February.
Hummels, D. and Klenow, P.J. (2005). 'The Variety and Quality of a Nation's Exports',
American Economic Review, 95(3), pp. 704–723.
Ibarra, C.A. (2011). 'Capital Flows and Real Exchange Rate Appreciation in Mexico',
World Development 39(12), pp. 2080-2090.
Kaplinsky, R. and Morris, M. (2008). 'Do the Asian Drivers Undermine Export-oriented
Industrialization in SSA?', World Development 36(2), pp. 254-273.
Leamer, E.E. (1981). 'Is it a Demand Curve, or is it a Supply Curve? Partial
Identification through Inequality Constraints', Review of Economics and Statistics,
63(3), pp. 319–327.
Mazier, J., Oh, Y. and Saglio, S. (2008). 'Exchange rates, global imbalances, and
interdependence in East Asia', Journal of Asian Economics 19(1), 53-73.
Oomes, N. (2005). 'Maintaining competitiveness under equilibrium real appreciation:
The case of Slovakia', Economic Systems 29(2), pp. 187-204.
Pontines, V. and Siregar, R.Y. (2012). 'Fear of appreciation in East and Southeast Asia:
The role of the Chinese renminbi', Journal of Asian Economics 23(4), pp. 324-334.
19
Porter, M.E., Ketels, C., Delgado, M. and Bryden, M. (2007). 'Competitiveness at the
Crossroads: Choosing the Future Direction of the Russian Economy', study
commissioned by Center for Strategic Research (CSR), Moscow.
Reinsdorf, M.B. and Dorfman, A.H. (1999). 'The Sato-Vartia Index and the
Monotonicity Axiom', Journal of Econometrics, 90(1), pp. 45-61.
Robinson, N. (2011). 'Political barriers to economic development in Russia: Obstacles
to modernization under Yeltsin and Putin', International Journal of Development
Issues 10(1), pp. 5-19.
Robinson, N. (2009). 'August 1998 and the development of Russia's post-communist
political economy', Review of International Political Economy 16(3), pp. 433-455.
20
Appendix
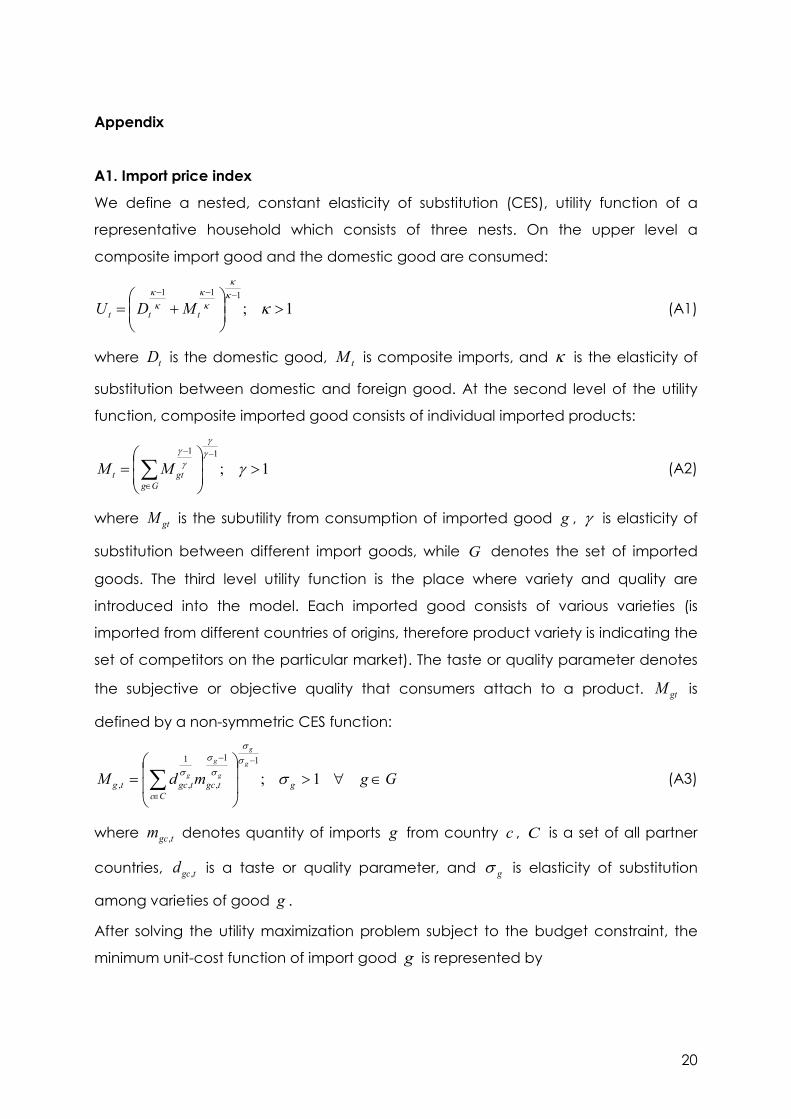
A1. Import price index
We define a nested, constant elasticity of substitution (CES), utility function of a
representative household which consists of three nests. On the upper level a
composite import good and the domestic good are consumed:
1;111
>
+=
−−−
κκκ
κκ
κκ
ttt MDU (A1)
where tD is the domestic good, tM is composite imports, and κ is the elasticity of
substitution between domestic and foreign good. At the second level of the utility
function, composite imported good consists of individual imported products:
1;11
>
=
−
∈
−
∑ γγγ
γγ
Gggtt MM (A2)
where gtM is the subutility from consumption of imported good g , γ is elasticity of
substitution between different import goods, while G denotes the set of imported
goods. The third level utility function is the place where variety and quality are
introduced into the model. Each imported good consists of various varieties (is
imported from different countries of origins, therefore product variety is indicating the
set of competitors on the particular market). The taste or quality parameter denotes
the subjective or objective quality that consumers attach to a product. gtM is
defined by a non-symmetric CES function:
GgmdM gCc
tgctgctg
g
g
g
g
g ∈∀>
=
−
∈
−
∑ 1;11
,
1
,, σσσ
σσ
σ (A3)
where tgcm , denotes quantity of imports g from country c , C is a set of all partner
countries, tgcd , is a taste or quality parameter, and gσ is elasticity of substitution
among varieties of good g .
After solving the utility maximization problem subject to the budget constraint, the
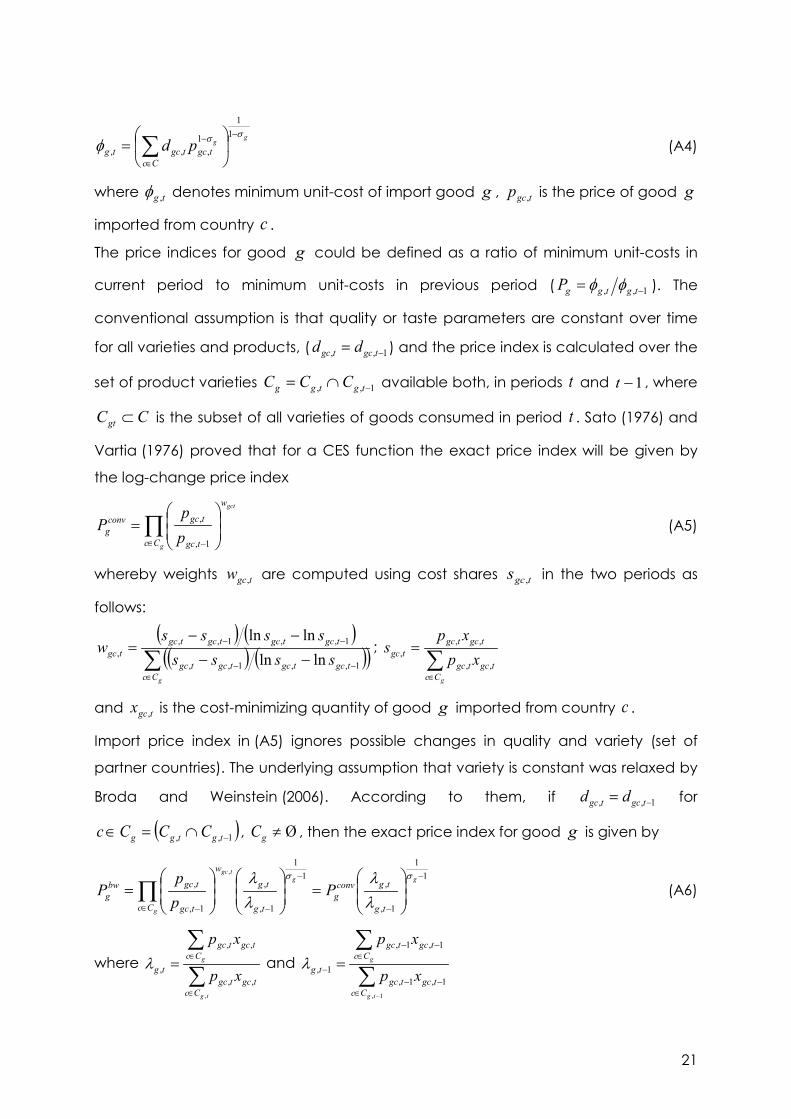
minimum unit-cost function of import good g is represented by
21
gg
Cctgctgctg pd
σσφ−
∈
−
= ∑
11
1,,, (A4)
where tg ,φ denotes minimum unit-cost of import good g , tgcp , is the price of good g
imported from country c .
The price indices for good g could be defined as a ratio of minimum unit-costs in
current period to minimum unit-costs in previous period ( 1,, −= tgtggP φφ ). The
conventional assumption is that quality or taste parameters are constant over time
for all varieties and products, ( 1,, −= tgctgc dd ) and the price index is calculated over the
set of product varieties 1,, −∩= tgtgg CCC available both, in periods t and 1−t , where
CCgt ⊂ is the subset of all varieties of goods consumed in period t . Sato (1976) and
Vartia (1976) proved that for a CES function the exact price index will be given by
the log-change price index
∏∈ −
=
g
gct
Cc
w
tgc
tgcconvg p
pP
1,
, (A5)
whereby weights tgcw , are computed using cost shares tgcs , in the two periods as
follows:
( ) ( )( ) ( )( )∑
∈−−
−−
−−
−−=
gCctgctgctgctgc
tgctgctgctgctgc ssss
ssssw
1,,1,,
1,,1,,, lnln
lnln;
∑∈
=
gCctgctgc
tgctgctgc xp
xps
,,
,,,
and tgcx , is the cost-minimizing quantity of good g imported from country c .
Import price index in (A5) ignores possible changes in quality and variety (set of
partner countries). The underlying assumption that variety is constant was relaxed by
Broda and Weinstein (2006). According to them, if 1,, −= tgctgc dd for
( )1,, −∩=∈ tgtgg CCCc , Ø≠gC , then the exact price index for good g is given by
11
1,
,1
1
1,
,
1,
,, −
−
−
−∈ −
=
= ∏
gg
g
tgc
tg
tgconvg
tg
tg
Cc
w
tgc
tgcbwg P
pp
Pσσ
λλ
λλ
(A6)
where ∑
∑
∈
∈=
tg
g
Cctgctgc
Cctgctgc
tg xp
xp
,
,,
,,
,λ and ∑
∑
−∈−−
∈−−
− =
1,
1,1,
1,1,
1,
tg
g
Cctgctgc
Cctgctgc
tg xp
xpλ
22
Therefore, the price index derived in (A5) is multiplied by an additional term which
captures the role of new and disappearing variety.
Broda and Weinstein (2006) assume that taste or quality parameters are unchanged
for all varieties of all goods ( 1,, −= tgctgc dd ), namely, vertical product differentiation is
ignored. Benkovskis and Wörz (2011) introduced an import price index that allows
also for changes in taste or quality:
∏∑
∑∈
−
−
−
−
−
∈
−−−
∈
−
=
=
−
g
g
tgc
g
g
tg
g
tg
g
Cc
w
tgc
tgc
tg
tgconvg
Cctgctgc
Cctgctgc
qg d
dP
pd
pdP
σσσ
σ
σ
λλ 1
1,
,1
1
1,
,
11
11,1,
1,,
,
1,
, (A7)
Equation (A7) could be seen as a modified version of equation (A6) whereby the
additional term captures changes in the quality and taste parameter.
A2. Relative export price index
Equation (A7) gives us a formula for a variety- and quality-adjusted import price
index. However, we can easily interpret tgcx , – which are imports of product g
originating from country c – as country's c exports of a product g to the importing
market (for the moment let's assume that for all exporting countries there exists only
one destination of exports – the importing country where the representative
household resides). Another problem arises from the need to compare the
performance of one particular country relative to its competitors, while equation (A7)
gives the aggregate import price from all suppliers. According to Benkovskis and
Wörz (2012) changes in the relative export price of good g exported by emerging
country k could be defined in the following way:
( )( )ktg
ktg
tgktgktgktgkktg
ktg
kgt
ktg
tgkgddpp
RXP −−
−
−−−−−
−− ==
1,,
11
1,,1,,
1,,
1,, φφφφ
φφ σ (A8)
where ktg ,φ denotes minimum unit-cost of good g when exported by (imported from)
emerging country k , while ktg
−,φ is minimum unit-cost of good g when exported by
(imported from) all countries except emerging country k . After combining (A7)
and (A8) we obtain
23
∏∏−
−
−
−
∈
−
−
−−
−−
−
∈ −
−
=
kg
g
ktgc
g
kg
ktgc
Cc
w
tgk
tgc
tgc
tgkktg
ktg
Cc
w
tgk
gct
tgc
tgktgk d
ddd
pp
pp
RXPσσ
λλ 1
1,
1,
,
,1
1
1,
,
1,
1
,
,,
,,
(1)
where kgC − is set of product varieties available in both periods, excluding varieties
coming from emerging country k , ktgcw−, and k
tg−
,λ are calculated similar to tgcw , and
tg ,λ , again excluding emerging country k from the set of exporters (varieties).
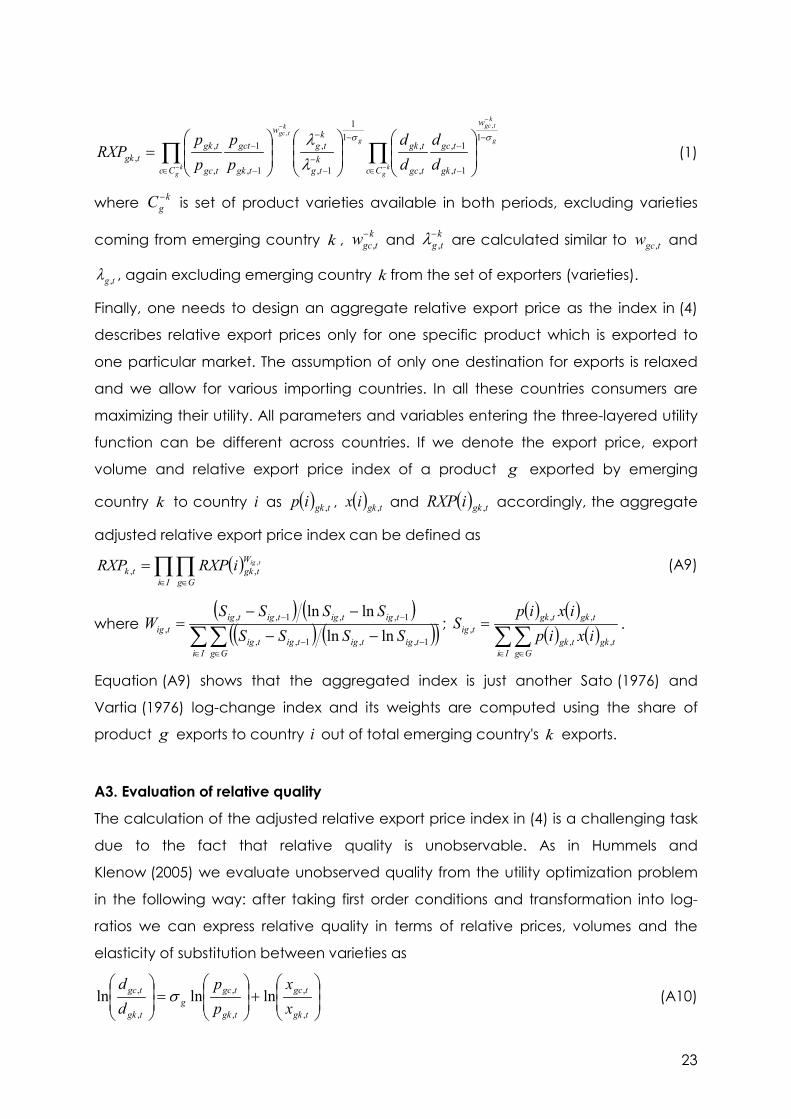
Finally, one needs to design an aggregate relative export price as the index in (4)
describes relative export prices only for one specific product which is exported to
one particular market. The assumption of only one destination for exports is relaxed
and we allow for various importing countries. In all these countries consumers are
maximizing their utility. All parameters and variables entering the three-layered utility
function can be different across countries. If we denote the export price, export
volume and relative export price index of a product g exported by emerging
country k to country i as ( ) tgkip , , ( ) tgkix , and ( ) tgkiRXP , accordingly, the aggregate
adjusted relative export price index can be defined as
( )∏∏∈ ∈
=Ii Gg
WtgktktigiRXPRXP ,
,, (A9)
where ( ) ( )
( ) ( )( )∑∑∈ ∈
−−
−−
−−
−−=
Ii Ggtigtigtigtig
tigtigtigtigtig SSSS
SSSSW
1,,1,,
1,,1,,, lnln
lnln;
( ) ( )( ) ( )∑∑
∈ ∈
=
Ii Ggtgktgk
tgktgktig ixip
ixipS
,,
,,, .
Equation (A9) shows that the aggregated index is just another Sato (1976) and
Vartia (1976) log-change index and its weights are computed using the share of
product g exports to country i out of total emerging country's k exports.
A3. Evaluation of relative quality
The calculation of the adjusted relative export price index in (4) is a challenging task
due to the fact that relative quality is unobservable. As in Hummels and
Klenow (2005) we evaluate unobserved quality from the utility optimization problem
in the following way: after taking first order conditions and transformation into log-
ratios we can express relative quality in terms of relative prices, volumes and the
elasticity of substitution between varieties as
+
=
tgk
tgc
tgk
tgcg
tgk
tgc
xx
pp
dd
,
,
,
,
,
, lnlnln σ (A10)
24
where k denotes a benchmark country.
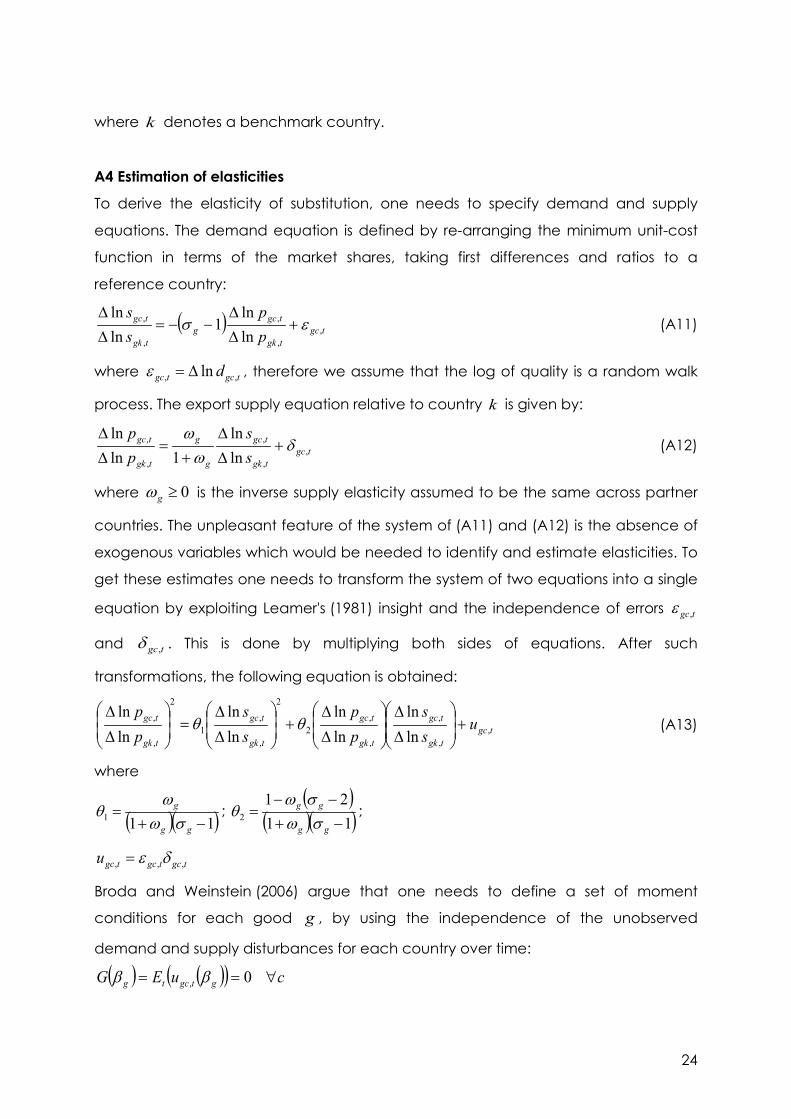
A4 Estimation of elasticities
To derive the elasticity of substitution, one needs to specify demand and supply
equations. The demand equation is defined by re-arranging the minimum unit-cost
function in terms of the market shares, taking first differences and ratios to a
reference country:
( ) tgctgk
tgcg
tgk
tgc
pp
ss
,,
,
,
,
lnln
1lnln
εσ +∆
∆−−=
∆
∆ (A11)
where tgctgc d ,, ln∆=ε , therefore we assume that the log of quality is a random walk
process. The export supply equation relative to country k is given by:
tgctgk
tgc
g
g
tgk
tgc
ss
pp
,,
,
,
,
lnln
1lnln
δω
ω+
∆
∆
+=
∆
∆ (A12)
where 0≥gω is the inverse supply elasticity assumed to be the same across partner
countries. The unpleasant feature of the system of (A11) and (A12) is the absence of
exogenous variables which would be needed to identify and estimate elasticities. To
get these estimates one needs to transform the system of two equations into a single
equation by exploiting Leamer's (1981) insight and the independence of errors tgc,ε
and tgc,δ . This is done by multiplying both sides of equations. After such
transformations, the following equation is obtained:
tgctgk
tgc
tgk
tgc
tgk
tgc
tgk
tgc uss
pp
ss
pp
,,
,
,
,2
2
,
,1
2
,
,
lnln
lnln
lnln
lnln
+
∆
∆
∆
∆+
∆
∆=
∆
∆θθ (A13)
where
( )( )111 −+=
gg
g
σωω
θ ; ( )
( )( )1121
2 −+−−
=gg
gg
σωσω
θ ;
tgctgctgcu ,,, δε=
Broda and Weinstein (2006) argue that one needs to define a set of moment
conditions for each good g , by using the independence of the unobserved
demand and supply disturbances for each country over time:
( ) ( )( ) cuEG gtgctg ∀== 0, ββ
25
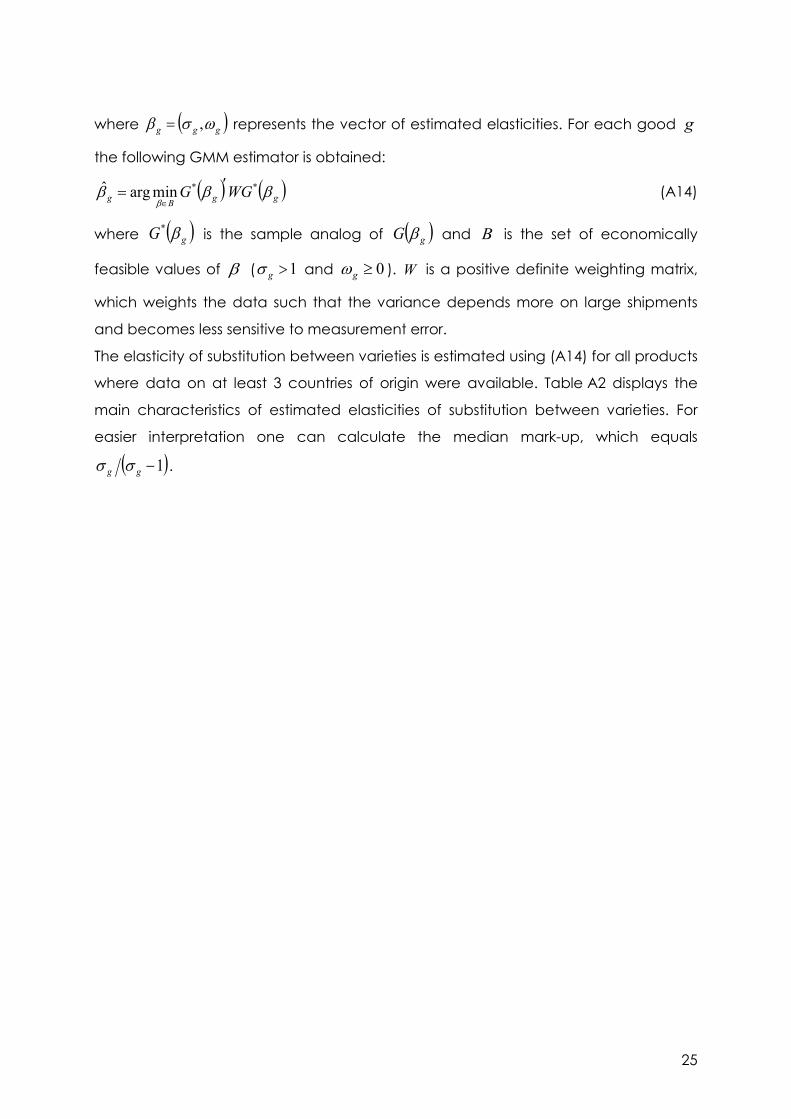
where ( )ggg ωσβ ,= represents the vector of estimated elasticities. For each good g
the following GMM estimator is obtained:
( ) ( )ggBg WGG ββββ
**minargˆ ′=∈
(A14)
where ( )gG β* is the sample analog of ( )gG β and B is the set of economically
feasible values of β ( 1>gσ and 0≥gω ). W is a positive definite weighting matrix,
which weights the data such that the variance depends more on large shipments
and becomes less sensitive to measurement error.
The elasticity of substitution between varieties is estimated using (A14) for all products
where data on at least 3 countries of origin were available. Table A2 displays the
main characteristics of estimated elasticities of substitution between varieties. For
easier interpretation one can calculate the median mark-up, which equals
( )1−gg σσ .
26
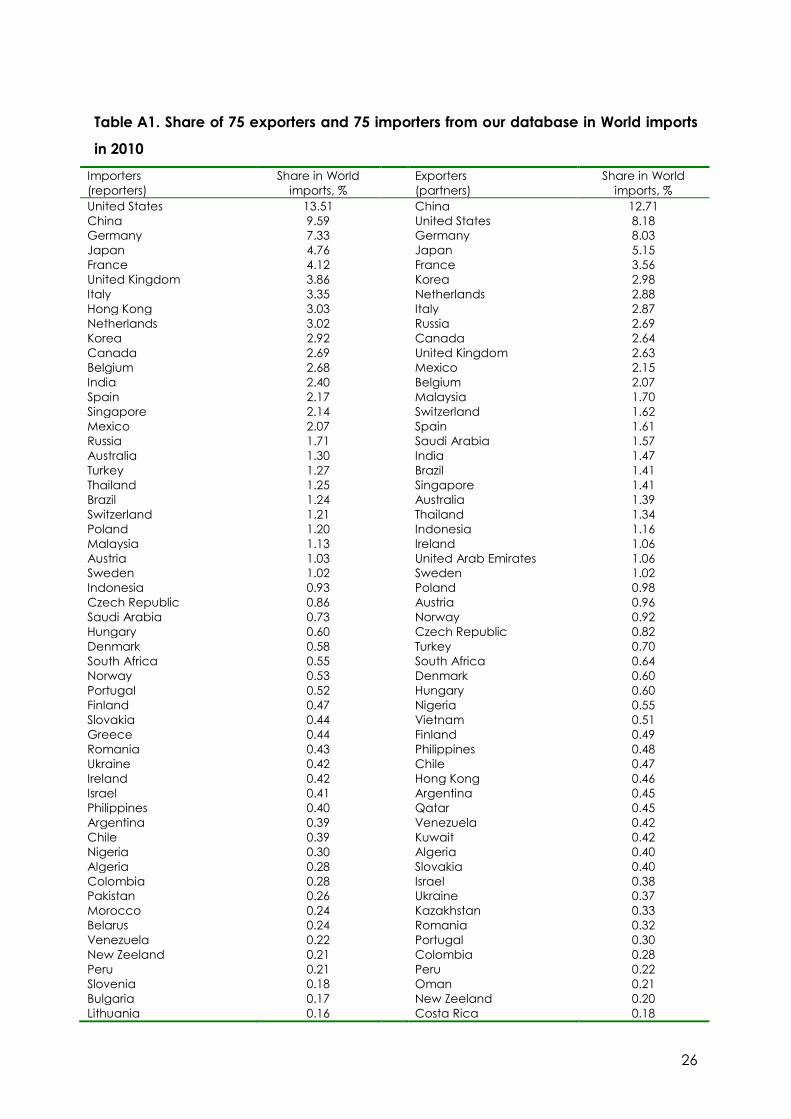
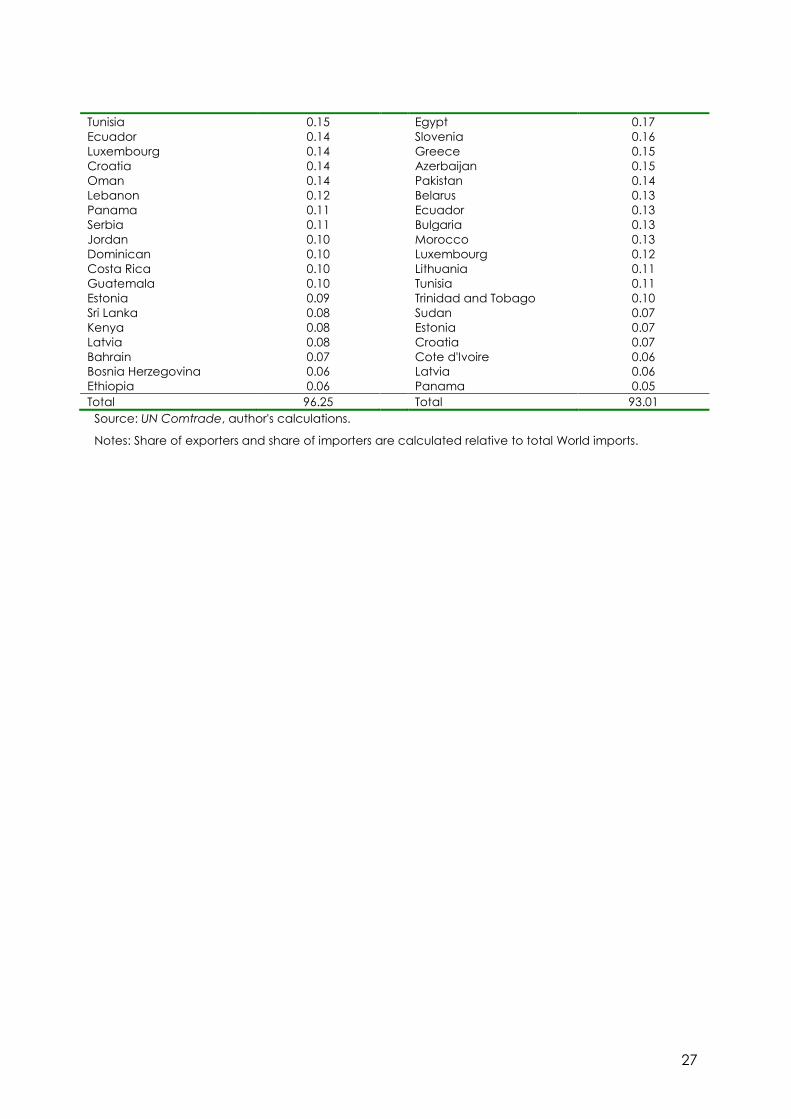
Table A1. Share of 75 exporters and 75 importers from our database in World imports
in 2010 Importers (reporters)
Share in World imports, %
Exporters (partners)
Share in World imports, %
United States 13.51 China 12.71 China 9.59 United States 8.18 Germany 7.33 Germany 8.03 Japan 4.76 Japan 5.15 France 4.12 France 3.56 United Kingdom 3.86 Korea 2.98 Italy 3.35 Netherlands 2.88 Hong Kong 3.03 Italy 2.87 Netherlands 3.02 Russia 2.69 Korea 2.92 Canada 2.64 Canada 2.69 United Kingdom 2.63 Belgium 2.68 Mexico 2.15 India 2.40 Belgium 2.07 Spain 2.17 Malaysia 1.70 Singapore 2.14 Switzerland 1.62 Mexico 2.07 Spain 1.61 Russia 1.71 Saudi Arabia 1.57 Australia 1.30 India 1.47 Turkey 1.27 Brazil 1.41 Thailand 1.25 Singapore 1.41 Brazil 1.24 Australia 1.39 Switzerland 1.21 Thailand 1.34 Poland 1.20 Indonesia 1.16 Malaysia 1.13 Ireland 1.06 Austria 1.03 United Arab Emirates 1.06 Sweden 1.02 Sweden 1.02 Indonesia 0.93 Poland 0.98 Czech Republic 0.86 Austria 0.96 Saudi Arabia 0.73 Norway 0.92 Hungary 0.60 Czech Republic 0.82 Denmark 0.58 Turkey 0.70 South Africa 0.55 South Africa 0.64 Norway 0.53 Denmark 0.60 Portugal 0.52 Hungary 0.60 Finland 0.47 Nigeria 0.55 Slovakia 0.44 Vietnam 0.51 Greece 0.44 Finland 0.49 Romania 0.43 Philippines 0.48 Ukraine 0.42 Chile 0.47 Ireland 0.42 Hong Kong 0.46 Israel 0.41 Argentina 0.45 Philippines 0.40 Qatar 0.45 Argentina 0.39 Venezuela 0.42 Chile 0.39 Kuwait 0.42 Nigeria 0.30 Algeria 0.40 Algeria 0.28 Slovakia 0.40 Colombia 0.28 Israel 0.38 Pakistan 0.26 Ukraine 0.37 Morocco 0.24 Kazakhstan 0.33 Belarus 0.24 Romania 0.32 Venezuela 0.22 Portugal 0.30 New Zeeland 0.21 Colombia 0.28 Peru 0.21 Peru 0.22 Slovenia 0.18 Oman 0.21 Bulgaria 0.17 New Zeeland 0.20 Lithuania 0.16 Costa Rica 0.18
27
Tunisia 0.15 Egypt 0.17 Ecuador 0.14 Slovenia 0.16 Luxembourg 0.14 Greece 0.15 Croatia 0.14 Azerbaijan 0.15 Oman 0.14 Pakistan 0.14 Lebanon 0.12 Belarus 0.13 Panama 0.11 Ecuador 0.13 Serbia 0.11 Bulgaria 0.13 Jordan 0.10 Morocco 0.13 Dominican 0.10 Luxembourg 0.12 Costa Rica 0.10 Lithuania 0.11 Guatemala 0.10 Tunisia 0.11 Estonia 0.09 Trinidad and Tobago 0.10 Sri Lanka 0.08 Sudan 0.07 Kenya 0.08 Estonia 0.07 Latvia 0.08 Croatia 0.07 Bahrain 0.07 Cote d'Ivoire 0.06 Bosnia Herzegovina 0.06 Latvia 0.06 Ethiopia 0.06 Panama 0.05 Total 96.25 Total 93.01
Source: UN Comtrade, author's calculations.
Notes: Share of exporters and share of importers are calculated relative to total World imports.

28
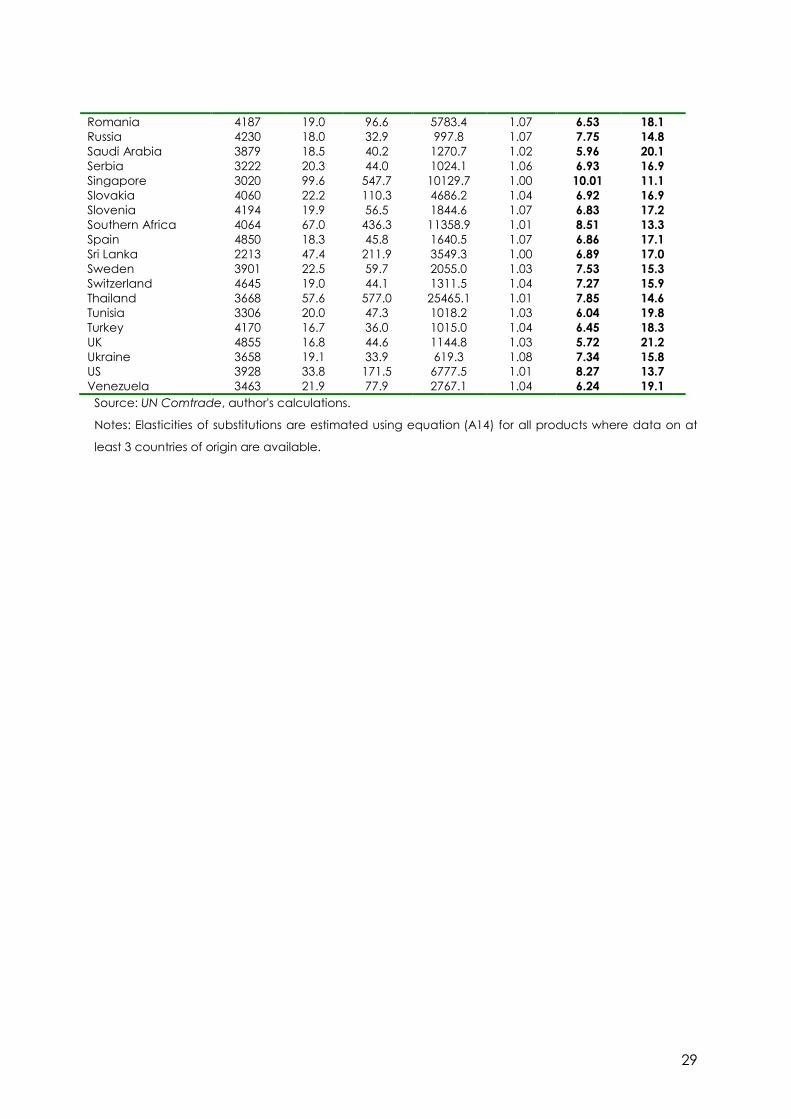
Table A2. Elasticities of substitution between varieties No. of
estimated elasticities
Mean Standard Deviation Maximum Minimum Median Median
mark-up
Algeria 3204 20.6 46.5 762.5 1.04 6.28 18.9 Argentina 2820 21.2 115.0 5374.6 1.03 6.90 16.9 Australia 2786 80.4 646.8 18180.6 1.01 12.42 8.8 Austria 4449 20.8 52.2 1518.6 1.05 7.12 16.4 Bahrain 2263 19.2 39.7 559.8 1.05 5.60 21.7 Belarus 3259 21.3 56.9 2023.7 1.09 6.57 17.9 Belgium 4818 19.1 45.4 1291.2 1.04 7.23 16.0 Bosnia Herzegovina 3206 22.4 55.9 1453.2 1.09 6.81 17.2 Brazil 3876 20.2 84.8 3745.5 1.09 7.05 16.5 Bulgaria 3826 18.9 39.5 848.2 1.07 6.09 19.6 Canada 3535 73.4 425.2 10404.7 1.00 11.99 9.1 Chile 3456 55.7 543.2 28249.1 1.01 7.56 15.2 China 4086 43.0 242.8 8726.3 1.01 9.64 11.6 Colombia 3654 17.5 39.8 1504.7 1.06 6.30 18.9 Costa Rica 3060 20.9 44.4 931.7 1.04 6.41 18.5 Croatia 3982 18.1 38.3 992.7 1.04 6.09 19.6 Czech Republic 4638 17.3 30.2 463.0 1.03 7.05 16.5 Denmark 4391 19.3 63.1 2662.3 1.07 7.62 15.1 Dominican 954 112.6 497.6 9915.4 1.01 14.28 7.5 Ecuador 3002 20.6 51.7 1368.1 1.04 6.07 19.7 Estonia 3397 18.1 34.1 493.1 1.03 6.27 19.0 Ethiopia 1711 18.2 36.6 860.7 1.02 6.17 19.3 Finland 4154 17.8 45.4 1271.3 1.03 6.48 18.2 France 4942 19.3 37.6 927.1 1.05 7.14 16.3 Germany 4710 18.1 34.5 978.0 1.02 7.53 15.3 Greece 4238 18.3 48.9 1248.6 1.06 5.71 21.2 Guatemala 2809 23.0 61.1 1374.3 1.05 6.49 18.2 Hong Kong 3491 46.5 245.2 6232.2 1.01 9.77 11.4 Hungary 4075 21.9 42.1 687.3 1.03 6.89 17.0 India 4228 19.0 44.7 849.6 1.07 6.45 18.3 Indonesia 3769 58.1 320.2 7432.2 1.01 8.61 13.1 Ireland 4103 25.3 123.2 4072.3 1.01 6.45 18.4 Israel 1339 108.2 512.3 8874.1 1.00 24.33 4.3 Italy 4900 17.1 30.3 503.1 1.11 6.81 17.2 Japan 4286 22.1 70.4 2296.6 1.01 6.67 17.6 Jordan 2065 21.3 49.2 790.5 1.05 5.75 21.1 Kenya 2339 42.3 363.4 15090.8 1.03 5.97 20.1 Korea 4452 18.6 53.7 1963.7 1.01 6.88 17.0 Latvia 3378 18.7 41.6 946.2 1.03 6.07 19.7 Lebanon 2940 21.5 58.4 1469.7 1.03 5.73 21.1 Lithuania 3616 17.8 37.9 727.7 1.06 6.60 17.9 Luxembourg 3517 26.1 113.7 5751.3 1.01 7.20 16.1 Malaysia 3879 79.8 687.1 24067.1 1.01 6.73 17.5 Mexico 3483 37.1 200.3 6927.5 1.01 7.23 16.0 Morocco 3329 20.0 50.7 1412.4 1.02 6.34 18.7 Netherlands 4140 47.1 320.1 12614.0 1.01 7.37 15.7 New Zeeland 3908 19.2 43.8 844.4 1.10 6.42 18.4 Nigeria 1490 28.4 138.5 4931.2 1.03 5.41 22.7 Norway 4290 16.4 40.0 1079.7 1.07 5.78 20.9 Oman 2239 22.2 64.0 1922.0 1.02 5.86 20.6 Pakistan 2333 66.6 431.6 9144.4 1.01 11.31 9.7 Panama 2415 18.9 39.8 661.5 1.00 6.38 18.6 Peru 3320 19.6 59.0 2359.3 1.02 6.30 18.9 Philippines 3521 22.2 71.6 2832.5 1.02 5.61 21.7 Poland 4522 17.4 32.5 777.6 1.06 7.03 16.6 Portugal 4263 21.6 56.5 1460.3 1.05 6.52 18.1
29
Romania 4187 19.0 96.6 5783.4 1.07 6.53 18.1 Russia 4230 18.0 32.9 997.8 1.07 7.75 14.8 Saudi Arabia 3879 18.5 40.2 1270.7 1.02 5.96 20.1 Serbia 3222 20.3 44.0 1024.1 1.06 6.93 16.9 Singapore 3020 99.6 547.7 10129.7 1.00 10.01 11.1 Slovakia 4060 22.2 110.3 4686.2 1.04 6.92 16.9 Slovenia 4194 19.9 56.5 1844.6 1.07 6.83 17.2 Southern Africa 4064 67.0 436.3 11358.9 1.01 8.51 13.3 Spain 4850 18.3 45.8 1640.5 1.07 6.86 17.1 Sri Lanka 2213 47.4 211.9 3549.3 1.00 6.89 17.0 Sweden 3901 22.5 59.7 2055.0 1.03 7.53 15.3 Switzerland 4645 19.0 44.1 1311.5 1.04 7.27 15.9 Thailand 3668 57.6 577.0 25465.1 1.01 7.85 14.6 Tunisia 3306 20.0 47.3 1018.2 1.03 6.04 19.8 Turkey 4170 16.7 36.0 1015.0 1.04 6.45 18.3 UK 4855 16.8 44.6 1144.8 1.03 5.72 21.2 Ukraine 3658 19.1 33.9 619.3 1.08 7.34 15.8 US 3928 33.8 171.5 6777.5 1.01 8.27 13.7 Venezuela 3463 21.9 77.9 2767.1 1.04 6.24 19.1
Source: UN Comtrade, author's calculations.
Notes: Elasticities of substitutions are estimated using equation (A14) for all products where data on at
least 3 countries of origin are available.
30
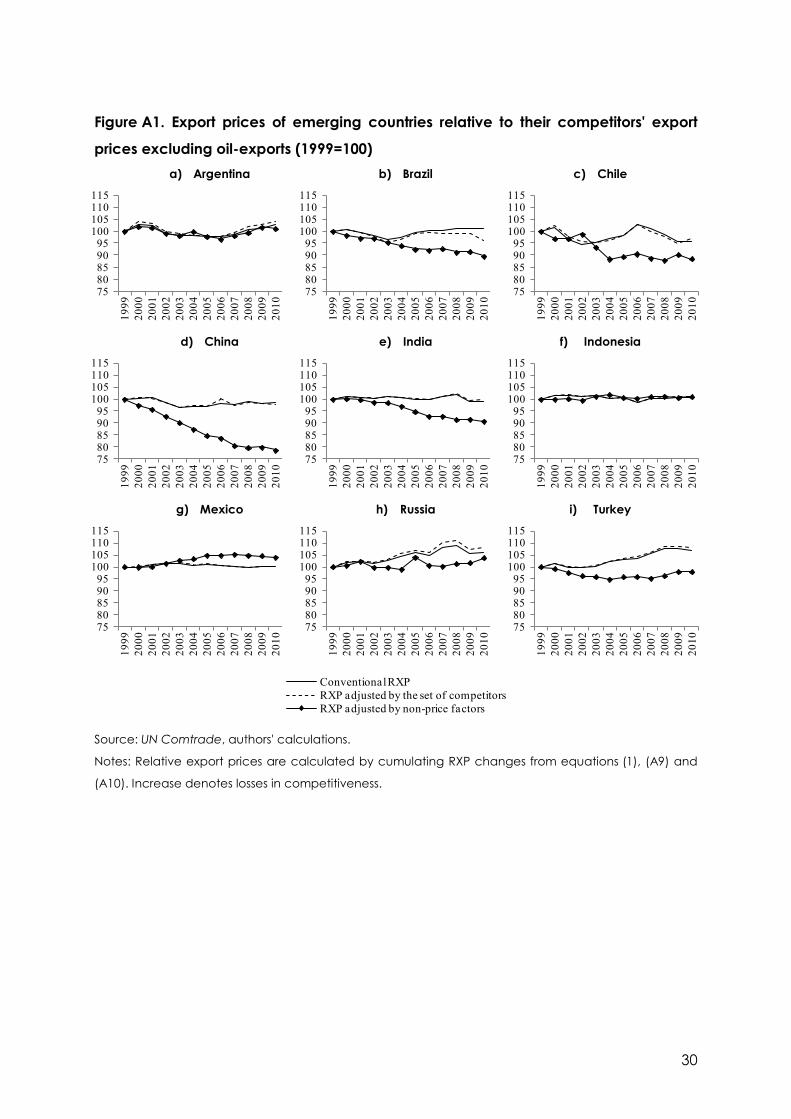
Figure A1. Export prices of emerging countries relative to their competitors' export
prices excluding oil-exports (1999=100) a) Argentina b) Brazil c) Chile
d) China e) India f) Indonesia
g) Mexico h) Russia i) Turkey
Source: UN Comtrade, authors' calculations.
Notes: Relative export prices are calculated by cumulating RXP changes from equations (1), (A9) and
(A10). Increase denotes losses in competitiveness.
7580859095
100105110115
1999
2000
2001
2002
2003
2004
2005
2006
2007
2008
2009
2010
7580859095
100105110115
1999
2000
2001
2002
2003
2004
2005
2006
2007
2008
2009
2010
7580859095
100105110115
1999
2000
2001
2002
2003
2004
2005
2006
2007
2008
2009
2010
7580859095
100105110115
1999
2000
2001
2002
2003
2004
2005
2006
2007
2008
2009
2010
7580859095
100105110115
1999
2000
2001
2002
2003
2004
2005
2006
2007
2008
2009
2010
7580859095
100105110115
1999
2000
2001
2002
2003
2004
2005
2006
2007
2008
2009
2010
7580859095
100105110115
1999
2000
2001
2002
2003
2004
2005
2006
2007
2008
2009
2010
7580859095
100105110115
1999
2000
2001
2002
2003
2004
2005
2006
2007
2008
2009
2010
7580859095
100105110115
1999
2000
2001
2002
2003
2004
2005
2006
2007
2008
2009
2010
Conventional RXPRXP adjusted by the set of competitorsRXP adjusted by non-price factors


![Competitiveness in the construction industry: A contractor’s … · 2020. 9. 30. · enterprises [21], agricultural exports [22], rice exports [23], healthcare systems [24] and](https://img.pdfslide.net/doc/110x75/613e06c659df642846164482/competitiveness-in-the-construction-industry-a-contractoras-2020-9-30-enterprises.jpg)