Embed Size (px)
Citation preview


Materials published here have a working paper character. They can be subject to further publi-cation. The views and opinions expressed here reflect the author(s) point of view and not neces-sarily those of CASE Network.
This paper has been prepared within the Workpackage 4 "Analysis of the economic and insti-
tutional consequences of WTO accession and a of future EU-CIS free trade agreements" under the ENEPO project (EU Eastern Neighbourhood: Economic Potential and Future Development), fi-nanced under the Sixth Framework Programme of the European Commission, Contract No 028736 (CIT5). The content of this publication is the sole responsibility of the authors and can in no way be taken to reflect the views of the European Union or any other institutions the authors may be affili-ated to.
Keywords: non-tariff barriers, CIS countries, trade policy JEL codes: F13 © CASE – Center for Social and Economic Research, Warsaw, 2008 Graphic Design: Agnieszka Natalia Bury
EAN 9788371784712
Publisher: CASE-Center for Social and Economic Research on behalf of CASE Network 12 Sienkiewicza, 00-010 Warsaw, Poland tel.: (48 22) 622 66 27, 828 61 33, fax: (48 22) 828 60 69 e-mail: [email protected] http://www.case-research.eu

The CASE Network is a group of economic and social research centers in Poland, Kyrgyzstan, Ukraine, Georgia, Moldova, and Belarus. Organizations in the network regularly conduct joint re-search and advisory projects. The research covers a wide spectrum of economic and social issues, including economic effects of the European integration process, economic relations between the EU and CIS, monetary policy and euro-accession, innovation and competitiveness, and labour markets and social policy. The network aims to increase the range and quality of economic re-search and information available to policy-makers and civil society, and takes an active role in on-going debates on how to meet the economic challenges facing the EU, post-transition countries and the global economy.
The CASE network consists of: • CASE – Center for Social and Economic Research, Warsaw, est. 1991,
www.case-research.eu
• CASE – Center for Social and Economic Research – Kyrgyzstan, est. 1998, www.case.elcat.kg
• Center for Social and Economic Research - CASE Ukraine, est. 1999, www.case-ukraine.kiev.ua
• CASE –Transcaucasus Center for Social and Economic Research, est. 2000, www.case-transcaucasus.org.ge
• Foundation for Social and Economic Research CASE Moldova, est. 2003,
www.case.com.md • CASE Belarus - Center for Social and Economic Research Belarus, est. 2007.

Sviltana Taran
CASE Network Studies & Analyses No. 371 4
Contents
General definition of NTBs................................................................................................................ 7 NTBs in the CIS countries................................................................................................................. 9 Analysis of NTBs in the selected CIS countries.............................................................................. 14 Conclusions .................................................................................................................................... 16 References...................................................................................................................................... 17 Appendices ..................................................................................................................................... 19

NON-TARIFF BARRIERS IN THE SELECTED CIS COUNTRIES
CASE Network Studies & Analyses No. 371 5
The Author
Ms. Sviltana Taran, holder of a Masters Degree in Economics, is a Ukrainian economist who has been working as a consultant to the Ukrainian public administration since 2002 in various Trade and Socio-Economic projects specialised in WTO accession, EU Integration with focus on barriers to trade, Free Trade Agreements, competition policy, government procurement, and adap-tation of Ukrainian Legislation in accordance to the acquis communautaire. She has good knowl-edge of the Ukrainian trade sector and experience in policy analysis and advice on trade and eco-nomic integration related issues.

Sviltana Taran
CASE Network Studies & Analyses No. 371 6
Abstract The purpose of this paper is to measure and analyse how intensively CIS countries apply non-
tariff barriers (NTBs) to restrict foreign trade in regard to certain products and total trade. Five CIS countries were selected for this analysis, in particular Ukraine, Russian Federation, Moldova, Bela-rus, and the Kyrgyz Republic. We first consider measurement methods usually applied to NTBs, review other studies measuring NTBs in CIS countries, and then describe our own findings on the matter. This analysis was made in the framework of the EU Eastern Neighbourhood: Economic Po-tential and Future Development (ENEPO) project seeking to examine different aspects of the European Union’s relations with its neighbours to the East.

NON-TARIFF BARRIERS IN THE SELECTED CIS COUNTRIES
CASE Network Studies & Analyses No. 371 7
General definition of NTBs Along with tariffs, non-tariff barriers (NTBs) define country’s market access conditions affecting
particular products. The limitation on the use of tariffs within the multilateral trade system and their considerable reduction in the framework of the GATT/WTO negotiations have led to the continual increase of the role of non-tariff barriers as protection and regulatory trade instruments. Presently, NTBs tend to be the major market access concern in many countries, especially in manufacturing sectors where NTBs have almost replaced tariffs (UNCTAD, 2005). As such, NTBs have been in-cluded into the agenda of the ongoing WTO Doha Round, which is expected to result in new coun-tries’ commitments on the reduction or elimination of NTBs to ensure further international trade lib-eralization.
There are a number of approaches towards defining, classifying and measuring the effects of NTBs developed, in particular, by Baldwin (1970), Deardorff and Stern (1997), Maskus, Otsuki and Wilson (2000), Beghin and Bureau (2001), Bora, Kuwahara and Laird (2002) and others. Each approach is characterised by its pluses and minuses, depending on the nature of a non-tariff bar-rier, availability of data, and the goal of measurement (Popper at el., 2004). Generally, one can dis-tinguish between trade-oriented, addressing trade impacts only, and welfare-oriented approaches, as well as those considering overall economic well-being (Beghin and Bureau, 2001).
Deardorf and Stern (1997) focus on trade restraining effect of NTBs and broadly define NTBs as all barriers to trade that are not tariffs. At the same time, they note that NTBs may include trade-expanding regulations as well (e.g. subsidies). Hillman (1991) points out also to the discriminative nature of NTBs and defines them as “any governmental device or practice other than a tariff which directly impedes the entry of imports into a country and which discriminates against imports, but does not apply with equal force on domestic production or distribution”.
Other authors acknowledge that there are regulatory measures (such as TBT – technical bar-riers to trade and SPS – sanitary and phytosanitary measures, etc.) that may affect/restrict trade but whose primary objective is to correct market failures (e.g. provision of public goods such as human health and environmental protection). Baldwin (1970) and Mahe’s (1997) restrict the con-cept of NTBs by taking into account their welfare effects. Particularly, Baldwin (1970) defines a ‘non-tariff barrier’ (or ‘distortion’) as “any measure (public or private) that causes internationally-traded goods and services, or resources devoted to the production of these goods and services, to be allocated in such a way as to reduce potential real work income” (Baldwin, 1970). According to this definition, a government regulation affecting trade should be treated as a protectionist non-tariff barrier in case its introduction reduces world welfare. Though theoretically profound, this ap-proach requires, in practice, conducting a comprehensive analysis and calculations to determine the distortions of a particular regulation properly (Bora, Kuwahara and Laird, 2002).
Maskus and Wilson (2001) confirm the legitimate policy objective for some NTBs, including technical barriers, in order to facilitate production and exchange, reduce transaction costs, guaran-tee quality and provision of public goods. At the same time, these measures may be used to act as protective and discriminating instruments against imports, through, first of all, higher compliance costs with technical requirements for foreign producers. In this regard, Maskus, Otsuki and Wilson (2001) support the idea that ‘a regulatory measure should be compared to the measure that would have been implemented if it had been designed for domestic purposes only’.
NTBs embody a wide variety of policy measures. UNCTAD distinguishes three general groups of NTBs based on their links with trade: i) directly trade-related NTBs (e.g. import quotas, anti-dumping measures, etc.); ii) NTBs that have a link with trade since their implementation is moni-tored at the border (e.g. SPS measures, packaging, etc.); iii) NTBs originating from general public policy (government procurement, investment restrictions, etc.) (UNCTAD, 2005). At the same time, the UNCTAD Coding System of Trade Control Measures (TCMCS) provides a very detailed classi-fication of over 100 trade measures (classified by type of market restrictions) divided into 8 broad chapters, six of which consist of NTBs (TCMCS does not include NTBs applied to exports or to production). Particularly, they encompass (UNCTAD, 2005):
− Price control measures: intended to increase import prices in order to sustain the domestic prices of the traded goods or to neutralise unfair trade practices (minimum import pricing, variable charges, anti-dumping and countervailing measures, etc);

Sviltana Taran
CASE Network Studies & Analyses No. 371 8
− Finance measures: intended to regulate the cost and access to foreign exchange required for imports (advance payment requirements, restriction on forex allocation, multiple exchange rates, regulation of terms of payment for imports, etc.). These barriers may increase the costs of imports and restrain imports;
− Automatic licensing measures: freely granted approvals for imports usually applied for monitoring and surveillance purposes; may be used as a presiding measure before import restric-tions (automatic licence, import monitoring, etc.);
− Quantity control measures: intended to limit the level of imports of a particular product (non-automatic licensing, quotas, prohibitions, etc.);
− Monopolistic measures: establishment of a monopolistic position of certain economic op-erators through providing them with certain exclusive rights or privileges (state trading enterprises, compulsory national services, etc.) intended to serve various social and economic objectives, but may restrain imports;
− Technical measures: compulsory requirements regarding the product characteristics, namely safety, quality, packaging, etc. intended to fulfil domestic objectives such as protection of human, animal and plant health, etc., but may be used for discrimination against importers. These measures usually increase the price of imports and prohibit non-complying imports (UNCTAD, 2005).
At the same time, other researches group NTBs by their objective or immediate impact, namely: 1) measures to control the volume of imports; 2) measures to control the price of imported goods; 3) monitoring measures; 4) production and export measures (such as export and domestic subsidies); 5) technical barriers (Laird and Vossenaar, 1991 as cited in Bora, Kuwahara and Laird, 2002). At the same time, Deardorff and Stern (1997) consider a wide spectrum of NTBs ranging from ‘narrowly conceived ones affecting particular products, industries, and countries to more gen-eral ones that are rooted in national institutions and policies’: 1) quantitative restrictions; 2) non-tariff charges affecting imports; 3) government participation in trade and restrictive practices; 4) customs procedures and administrative practices; 5) technical barriers to trade. It should be noted that all these classifications are rather arbitrary and not exhaustive.
In the whole variety of NTBs, researches usually distinguish so called ‘core’ NTBs. "Core" NTBs are those NTBs that are intended to modify or restrict international trade (Deardorff and Stern (1997)). They commonly include: quantitative restrictions, price control measures as well as some other relatively restrictive NTBs1.
Unlike tariffs, NTBs are not easy to distinguish and quantify due to their vast diversity and overlapping impacts. Frequency-type measures are one of the most applicable methods of meas-urement of a general level of NTBs. They allow measuring the frequency of application of NTBs (simple frequency rations) or the extent of trade covered by NTBs (import coverage ratios) in par-ticular sectors or countries. They are calculated using two possible data sources: i) commodity and country specific databases on trade control measures identifying commodity items that were sub-ject to a list of NTBs in a specific year (such as UNCTAD Trade Control Measures database2), or ii) special surveys on trading companies’ perceptions about NTBs.
The frequency ratio is defined as the number of product categories subject to NTBs as a per-centage of the total number of product categories in each commodity group. To measure import coverage ratios the value of imports of each product subject to NTBs is expressed as a percentage of total imports in the corresponding commodity group.
Although frequency measures do not distinguish between particular NTBs (NTBs may differ significantly by the level of restrictiveness/severity, e.g. quotas vs. automatic licensing) and the use of endogenous weights in their calculation in import coverage ratios is problematic, they do give an indication of the importance of the problem for particular sectors and countries. These ratios can
1 In particular, UNCTAD TRAINS Trade Control Measures database specifies the following 3 categories of core NTBs: i) quantitative control measures excluding tariff quotas and enterprise-specific restrictions; ii) fi-nance measures, excluding regulations concerning terms of payment and transfer delays; iii) price control measures. 2 The Trade Control Measures database is a part of the UNCTAD Trade Analysis and Information System (TRAINS) that is included in the World Integrated Trade Solution. As of today, it is the most comprehensive publicly available international database on NTBs, still NTB data for CIS countries are rather outdated (of 1996-99 for most of CIS countries).

NON-TARIFF BARRIERS IN THE SELECTED CIS COUNTRIES
CASE Network Studies & Analyses No. 371 9
be used as inputs in econometric models further investigating impacts of NTBs on prices, produc-tion, income and welfare.
Price-comparison measures are another method of measuring NTBs. This method accounts for price effect of NTBs by calculating the difference between domestic and foreign prices (price wedge) due to introduction of a particular NTB. These price wedges in a percentage form are re-ferred to as tariff equivalents of NTBs, which are comparable to tariffs. The major problem of the price-comparison method is that it enables to quantify the effect of a set of NTBs present at the market but cannot identify what those NTBs are precisely (Beghin and Bureau, 2001). Collection of the appropriate price data appears to be also problematic.
The third option is quantity-impact measures based on the evaluation of quantitative effects of NTBs using the sector-specific gravity model techniques. Here, NTB equivalents are estimated ei-ther by including various dummy variables into gravity equations (e.g. in the case of regional inte-gration) or by using residuals from a gravity model. The estimates of NTB tariff equivalents are fre-quently used to calculate overall trade restrictiveness indices, effective rates of protection or as explanatory variables in CGE models.
In our further analysis we will calculate frequency-type measures to determine the level of im-portance of core NTBs in trade regimes of the selected CIS countries. NTBs in the CIS countries
All the CIS countries included in our analysis - Ukraine, Russian Federation, Moldova, Belarus,
and the Kyrgyz Republic - have been undertaking programs of external economic liberalization dur-ing years of transition following their acquisition of independence. The EBRD trade and foreign ex-change system progress in transition indicator reveals substantial reforming efforts and accom-plishments of CIS countries in this area (see Table 1). Still, as of today there are substantial differ-ences among trade regimes of these countries, in terms of both tariff and non-tariff trade barriers. According to various trade restrictiveness indicators, Moldova and the Kyrgyz Republic in general have the most liberal trade regimes among all CIS countries. For instance, the IMF overall trade restrictiveness index accounting for both the level of tariffs and NTBs incidence equals “1” for these countries - the most liberal (see Table 2). They are followed by Ukraine and Kazakhstan in a mid-dle position, with rank “4”. While trade regimes of Russia and Belarus are evaluated as the most restrictive among these countries, their ranks are “5” and “8” respectively (IMF, 2005).
Table 1: EBRD Indicators of Trade and Forex system progress in transition, selected years
Country name 1992 1997 2001 2006 Kyrgyz Republic 2.00 4.00 4.33 4.33 Moldova 2.00 4.00 4.33 4.33 Ukraine 1.00 3.00 3.00 3.67 Kazakhstan 1.00 4.00 3.33 3.67 Russian Federation 3.00 4.00 2.67 3.33 Belarus 1.00 1.00 2.00 2.33 Georgia 1.00 4.00 4.33 4.33 Estonia 3.00 4.00 4.33 4.33 Poland 3.00 4.33 4.33 4.33 Hungary 4.00 4.33 4.33 4.33 Slovenia 3.00 4.33 4.33 4.33
Note. A "1" ranking signals extreme controls while “4.33” is typical of standards and performance of ad-vanced industrial countries. Source: EBRD (2006), Transition Report Update 2006. Available at: www.ebrd.com/pubs/econo/series/tr.htm.
The IMF also calculates index of NTB restrictiveness which evaluates NTB incidence in the
country ranging from “1” (for open regime with minor NTBs) to “2” (significant NTBs incidence) and to “3” (restrictive). The following NTBs are included by the IMF in the calculations of NTBs indices across countries: quantitative restrictions, restrictive licensing requirements, bans, state trading, exchange restrictions (IMF, 2005). Among CIS countries, trade policies of the Kyrgyz Republic, Moldova, Georgia, and Armenia were assessed as the least restrictive over the period 1997-2003, while Belarus, Turkmenistan and Uzbekistan were maintaining the most restrictive trade regimes.

Sviltana Taran
CASE Network Studies & Analyses No. 371 10
Table 2: IMF Trade Restrictiveness Index for selected CIS countries IMF-TRI* Simple average MFN tariff, % Kyrgyz Republic 1 5.2 Moldova 1 6.2 Ukraine 4 7.0 Kazakhstan 4 7.4 Russian Federation 5 11.1 Belarus 8 12.2 EU 4 6.5 Turkey 5 12.7 Canada 4 6.8 The US 4 5.1
* IMF Trade Restrictiveness Index is built by combining Tariff Restrictiveness and NTB Restrictiveness rat-ings and varies from 1 (most liberal) to 10 (most restrictive). Source: IMF (2005).
Table 3: NTB trade restrictiveness index in CIS and CEE countries, selected years (IMF) 1997 2000 2003 Kyrgyz Republic 1 1 1 Moldova 1 1 1 Ukraine 2 2 2 Kazakhstan 2 2 2 Russian Federation 1 2 2 Belarus 3 3 3 Georgia 2 1 1 Armenia 1 1 1 Turkmenistan 3 3 3 Uzbekistan 3 3 3 Latvia 1 1 1 Lithuania 1 1 1 Poland 1 1 1 Romania 2 1 1
Note. NTB Restrictiveness Index (IMF) is a three-point scale evaluation of NTBs incidence in the country: (1) – minor (less than 1% of trade or production affected), (2) – significant (between 1% and 25%) or (3) – re-strictive (more than 25%). NTBs include: quotas, restrictive licensing requirements, bans, state trading, ex-change restrictions. Source: World Bank 2005b, IMF, 2005.
Another important source of information on NTBs prevalence in CIS countries is provided in
Kee, Nicita and Olarreaga (2005). As seen in Table 4, the intensity of NTBs (namely price and quantity control measures, technical regulations, and monopolistic measures) captured by simple frequency and import-weighted ratios was the lowest in the Kyrgyz Republic and Moldova (2% and 5% respectively of tariff lines were subject to NTBs in the studied period). NTBs’ role increased significantly for other CIS countries: up to 17% of tariff lines covered in Ukraine, 24% in Belarus, 26% in Kazakhstan, and up to 39% in Russia. The severity of NTBs was even greater when one considers the value of imports affected by NTBs (import-coverage ratios). For example, 51% of im-ports in Ukraine and 63% of imports in Russia were affected by NTBs (see Table 4). It should be noted, however, that frequency ratios estimated by Kee, Nicita and Olarreaga (2005) were based on the UNCTAD TRAINS database providing rather outdated information on NTBs for CIS coun-tries (mainly as of 1997 or 1999). From that time, trade regimes of CIS countries undergoing transi-tion to market economies and negotiating WTO accession have changed considerably. However, to the best of our knowledge there are no other datasets covering NTBs applied in more recent pe-riod, which may be comparable across CIS countries.
Although each CIS country has been developing its own system of formal NTBs (see Table 5 for a brief description of primary NTBs in the selected CIS countries), we can observe some com-mon features in their evolution. The importance of NTBs as protective trade instruments has been gradually increasing as CIS countries have been liberalizing their tariff structures (all the selected CIS countries have comparatively liberal tariff regimes – see Table 2). According to the World Bank

NON-TARIFF BARRIERS IN THE SELECTED CIS COUNTRIES
CASE Network Studies & Analyses No. 371 11
(2004a), in Ukraine, for example, the intensity of the selected NTBs3 (measured by simple fre-quency ratios) doubled over 1993-2004 period from 7.2% to 17.5%. Since all countries have been engaged in the WTO accession process, though in different stages4, the application of the most restrictive and discriminatory core NTBs such as quotas, prohibitions, import and export prices control, non-automatic licensing has been gradually decreasing in these countries and is expected to decrease further. On the contrary, the role of technical measures (such as SPS measures, com-pulsory certification, ecological control, etc.) in the NTBs structures of many CIS countries has been strengthening. For instance, in Ukraine the number of tariff lines subject to compulsory test-ing increased by over four times over 1995-2004 period (World Bank, 2004a). Very often, these measures have been used by CIS countries to control and restrict imports rather than to serve their primary objectives such as health and safety protection (e.g. in Russia and Ukraine).
Table 4: Frequency rations of certain NTBs1 and overall trade restrictiveness index (OTRI) in the CIS and selected countries (%)
Country name Data period for NTBs2
Simple Fre-quency ratio
Import cov-erage ratio OTRI3 OTRI Agri-
culture OTRI Manu-
facturing Kyrgyz Republic 1998 2.0 1.0 7.4 10.0 7.0 Moldova 1995 5.0 9.0 7.4 16.8 5.7 Ukraine 1997 17.0 51.0 21.6 46.4 18.4 Kazakhstan 1999 26.0 36.0 14.0 32.9 11.7 Russian Federation 1997 39.0 63.0 22.6 33.4 20.4 Belarus 1996 24.0 28.0 15.9 31.2 13.7 Poland 1999 14.0 22.0 15.2 51.5 11.4 Hungary 1999 20.0 16.0 11.3 37.2 9.5 Romania 1999 20.0 17.0 15.8 36.0 13.5 Latvia 1996 18.0 31.0 9.8 36.6 5.8 Lithuania 1999 17.0 21.0 5.0 20.3 3.3 Turkey 1997 18.0 28.0 11.8 39.7 8.7
Notes. 1 Included core NTBs: price and quantity control measures, technical regulations, and monopolistic measures. 2 The most recent data period available. 3 OTRI is estimated based on tariff data (as of 2005-2006) and ad-valorem equivalents of NTBs. It measures the restrictiveness of a country’s trade policies in regard to its imports. Source: Kee, Nicita and Olarreaga, 2005.
Overall, CIS countries do not tend to use formal NTBs excessively when compared with other
countries of similar level of development or even with developed countries (see for example Table 4). Notwithstanding almost the same number of lines subject to formal NTBs, as well as the same value of imports affected by NTBs, trade-distortion effects of those NTBs may differ substantially among countries depending on the way of their application and enforcement, institutional capaci-ties and trade supporting infrastructure development. Though many CIS counties (first of all, those that are already WTO members) have achieved substantial progress in harmonising their national legislation with the WTO rules and reducing formal discriminatory trade barriers, their trade re-gimes are still characterized by a wide presence of informal barriers, including corruption, poor law enforcement and illegal practices, as well as institutional weaknesses, underdeveloped infrastruc-ture – all being very damaging barriers to trade and development in these countries (World Bank, 2005b). Further policy and regulatory approximation in such areas as standards and technical regulations, SPS measures, customs control, etc. - in terms of their transparency, predictability, economic justification, non-discrimination - with international and European standards and WTO requirements is key for CIS countries to increase their benefits from economic integration and
3 Frequency ratios included 17 NTBs such as licensing, customs controls, SPS measures, technical regula-tions, etc. 4 As of today, The Kyrgyz Republic and Moldova have already become members of the WTO (in 1998 and 2001 respectively). Ukraine’s accession package was approved by the General Council in February 2008 thus Ukraine is expected to become a WTO member in the first half of 2008. Russia has also approached to the final stage of the WTO accession process. While Kazakhstan’s and Belarus’s WTO accession still require a lot of efforts.

Sviltana Taran
CASE Network Studies & Analyses No. 371 12
trade. Trade facilitation development (including trade supporting institutions and infrastructure) and improvement of quality of overall business and investment environment is of no less importance.
As to the trade across CIS countries, a myriad of bilateral and multilateral regional trade agreements among CIS countries appear to be not very effective in eliminating non-tariff barriers among their signatories. Though all bilateral agreements stipulate free trade in all goods, they still allow for unspecified exemptions from the free trade regime. Protocols with exemptions, especially those concluded by Russia, Ukraine and Kazakhstan, usually concern such “sensitive” sectors as sugar and confectionary, alcoholic beverages and tobacco products, etc.5. Besides, countries may unilaterally apply export duties thus representing additional exemptions from the free trade regime. All FTA agreements also provide for the possibility of contingent temporary protection in the form of anti-dumping and safeguard measures, quantitative restraints6. Russia, Ukraine, and Kazakhstan are actively applying these measures to imports from the CIS countries (mostly to such commodi-ties as cement, metal pipes, steel, automobiles, agricultural products, foods, textiles). Due to the lack of strict procedures for the application of temporary protection measures under FTAs and im-proper application of national legislation, these measures are frequently applied in an arbitrary and non-transparent manner thus imposing significant barriers in CIS trade and adding uncertainty about future market access (Freinkman, Polyakov and Revenco, 2004). Anti-dumping investiga-tions are also frequently carried out by the countries (Ukraine, Russia, Kazakhstan) in regard to imports from non-CIS countries, with EU members, Turkey, China as the main country targets.
Good descriptions of trade regimes of CIS countries including non-tariff protection measures can be found in the county studies by the World Bank (e.g. World Bank 2004a, 2004b, 2005a, 2005b), annual country Foreign Trade Barriers overviews by the USTR (United States Trade Rep-resentative), annual Economic Freedom Overviews by the Heritage Foundation, etc. Still, the avail-ability of databases and empirical studies providing quantitative estimations of NTBs and their im-pact on trade and economic development in the CIS countries is very limited. Kee, Nicita and Olar-reaga (2005) recently studied the restrictiveness of trade regimes worldwide including CIS coun-tries. The authors estimated trade restrictiveness indices of tariff and non-tariff barriers capturing three different economic effects – on domestic welfare (domestic inefficiencies due to trade protec-tion), on imports (the effect of restrictions on importers) and on exports (the effect of trade barriers of other countries imposed on a country’s exports). The general conclusion of the study showed that NTBs had a significant contribution to the world protection (on average 70% of trade restric-tiveness worldwide is explained by NTBs), with trade restrictiveness generally higher in agriculture in import markets, and agricultural exporters usually facing higher trade barriers on export markets. The estimates of the effect of trade barriers on imports (captured by Overall Trade Restrictiveness Index) in CIS countries (Belarus, Kazakhstan, the Kyrgyz Republic, Moldova, Russian Federation, and Ukraine) proved that the Kyrgyz Republic and Moldova maintained the most liberal trade re-gimes (see Table 4). Whilst Russia’s and Ukraine’s trade regimes were estimated to be the most restrictive among CIS countries, followed by Belarus and Kazakhstan. In addition, Ukraine’s pro-tection of agricultural markets had the highest detrimental impact on imports among the considered CIS countries, while Russia imposed the most severe barriers on imports of industrial goods.
Recent study ‘Non-tariff barriers in Ukrainian export to the EU’ (Jakubiak et al, 2006) investi-gates to what extent the NTBs impede Ukrainian export to the EU. More than 500 Ukrainian ex-porters to the EU were surveyed in 2006 and asked to evaluate various barriers incurred by them in bilateral trade with the EU (such as certification of origin, customs procedures and technical standards, etc). The survey results revealed inter alia that average costs to meet EU’s technical requirements equalled 13.9% of total production cost, with metallurgy and chemistry industries spending the least on upgrading the commodities up to the EU technical requirements and textile and apparel industry spending the most. Average cost of passing the testing and certification pro-cedures was estimated by exporters to equal 4.2% of total production costs and constituted a greater burden for small firms than for large. Most companies reported high degree of duplication of their efforts due to necessity to test production for both Ukrainian and the EU technical require-
5 Exempted products are subject to most favored nation (MFN) tariff rates. 6 Temporary quantitative restrictions for imports or exports can be introduced unilaterally (normally for up to two years) in case of an acute shortage of the goods in question on internal markets, large deficits in the balance of payments, realized or potential injury for domestic producers, and re-export control measures (Freinkman, Polyakov and Revenco, 2004).

NON-TARIFF BARRIERS IN THE SELECTED CIS COUNTRIES
CASE Network Studies & Analyses No. 371 13
ments. The study concludes with recommendations on policies aiming at legal system harmoniza-tion in trade related areas with the EU laws.
Another study on Ukraine (CEPS, 2006) applied the gravity model technique to obtain NTB es-timates and to investigate impact of their possible reductions under deep FTA Agreement between Ukraine and the EU. In particular, the implicit NTBs were estimated at the sectoral level by intro-ducing dummy variables for different country groupings. The estimated coefficients of these dum-mies were then transferred into ad-valorem tariff equivalents of trade barriers between countries. The resulting estimates of NTBs for non-EU countries including Ukraine appeared to be rather large, ranging from 20% for textiles to 40% for food products. The authors found that deeper forms of market integration between countries through regulatory and legislation convergence and reduc-tion of NTBs are likely to have a substantial impact on Ukraine’s economy in terms of its trade in-crease and welfare gains, while simple free trade agreement with customs tariffs removal only would have a minor impact on economic performance of Ukraine.
Frequency type measures of NTBs prevalent in Ukraine between 1994 and 2001 were calcu-lated and analysed in Movchan (2003). The augmented weighted index of NTBs has been com-puted allowing for differing intensity of various types of the NTBs and including several NTBs in one measure (it is a compound additive index that incorporates a spectrum of non-tariff barriers applied in the country weighted by the value of imports). It was found that aggregate intensity of non-tariff protection increased by almost 97% over the studied period, with a peak in 1999-2000 and gradual reduction afterwards. The analysis of the evolution of different types of NTBs revealed that core NTBs, with most harmful influence on trade, had been gradually reduced starting in 1998 for most commodities in Ukraine, while the importance of technical barriers (such as safety stan-dards and ecological control, compulsory standards certification, permits for medicine imports) had been growing. Ukraine had been applying the NTBs in most intensive way in trade of food prod-ucts.
The importance of liberalization of barriers to trade in services, in particular restrictions to FDI in service sectors (i.e., barriers to commercial presence), for trade and economic performance in Russia, Kazakhstan and Ukraine was studied in the Jensen, Rutherford and Tarr (2004), Ruther-ford, Tarr and Shepotylo (2004), Rutherford, Tarr and Shepotylo (2005), Copenhagen Economics, IER, and OEI (2005), and Jensen and Tarr (2007). All these studies prove that major welfare gains for CIS countries as a result of WTO accession would come from the reform of investment barriers faced by multinationals in services sectors. For example, it was shown that about 70 percent of the total gains from Russian WTO accession would be ensured by FDI liberalization in services: 5.2% welfare gains vs. 1.3% due to tariff reform only (Jensen, Rutherford and Tarr (2004). In Ukraine, the FDI barriers reduction as a result of the WTO accession was estimated to improve welfare by 2.3% vs. 1.9% due to tariffs reform and vs. 0.5% due to improved market access (Copenhagen Economics, IER, and OEI (2005).
Table 5: Major NTBs prevalent in the selected CIS countries
Kyrgyz Republic Primary NTBs: SPS and TBT measures, import licensing (armaments, narcotics, etc.), state-trading
enterprises (distillates, petroleum goods, raw materials, components for production of commodity petroleum products), quantitative restrictions on imports of alcoholic beverages, customs control. Source: Mogilevsky R. 2004.Participation in WTO and Regional Trade Agreements: Kyrgyzstan’s Experi-ence. CASE-Kyrgyzstan.
Moldova Primary NTBs: licensing, foreign-exchange regulations, SPS and TBT measures, customs control.
Source: World Bank, 2004b. Ukraine
Primary NTBs: mandatory certification applied to a wide range of goods, licensing of export and import activities (alcohol and tobacco products, laser-readable discs, cryptosystems, narcotics, etc.), various SPS and TBT measures, government procurement regarding to imports (legal discriminations against agricul-tural imports were abolished in 2007), state registration and permits (imports of medicine products and pes-ticides), customs control, non-automatic and automatic licensing, high certification and licensing fees, con-tingency measures.
Export regime: export duties (oil seeds, ferrous and non-ferrous scrap metal, animal skin), export li-censing (precious metals; optical polycarbonates, ozone-depleting substances, etc.), mandatory exportation of certain products processed under “give-and-take” schemes. No export subsidies.

Sviltana Taran
CASE Network Studies & Analyses No. 371 14
State-trading enterprises: export of ethyl alcohol and electricity, import of natural gas, certain types of narcotics, arms and military equipment. Source: USTR. Ukraine: Foreign Trade Barriers, 2005, 2006; World Bank, 2004a.
Kazakhstan Primary NTBs: “custom audit procedure” (introduced in 2002), conditional prices for certain imports,
transfer pricing regulation to monitor export and import transactions, “transaction passport” for custom clearance, mandatory certification applied to a wide range of goods, various SPS and TBT measures, gov-ernment procurement (unrestricted preferences to domestic suppliers in all sectors), subsidies based on the use of local material, other product specific restrictions on exports and imports, contingency measures.
Export quotas and most licensing requirements have been abolished. Monopoly rights of state trading organizations were abolished in 1994. Source: USTR. Kazakhstan: Foreign Trade Barriers, 2005, 2006.
Russian Federation Primary NTBs: quantitative restrictions (quotas and tariff-rate quotas on meat products), licensing (im-
ports of explosive substances, drugs, nuclear substances, medicines, some food products, white spirits, products with encryption technology), activity licenses (alcoholic beverages, pharmaceuticals, products with encryption technology), mandatory certification, discriminatory and prohibitive charges and fees, SPS and TBT measures, state registration (pharmaceutical products), contingency measures.
Export regime: export tariffs and duties (ferrous metal scrap, copper cathode, other), no export subsi-dies.
Maintains monopoly powers through state-owned enterprises (energy sector). Source: USTR. Russia: Foreign Trade Barriers, 2005, 2006.
Belarus Primary NTBs: licensing (alcohol, potentially hazardous products) and quotas, foreign exchange re-
strictions, contingency measures, ad hoc administrative restrictions on trade (confiscations of imports and transit goods, on the basis of small technical errors, different modes of import clearance applied to con-sumer and industrial goods, special permits to import products of comparative advantage for the country (television sets, refrigerators), local content requirements, discriminatory taxation based on the origin of goods), government procurement (preferences to local firms), implementation of custom control, SPS measures, price control, foreign trade contract registration.
Export regime: export duties (oil products), export licensing (imports of ferrous and non-ferrous metal scrap, precious metals, industrial waste, antique), turnover tax on exports. Source: World Bank. 2005a.
Analysis of NTBs in the selected CIS countries
To determine the level of non-tariff protection in 5 CIS countries (Ukraine, Russian Federation,
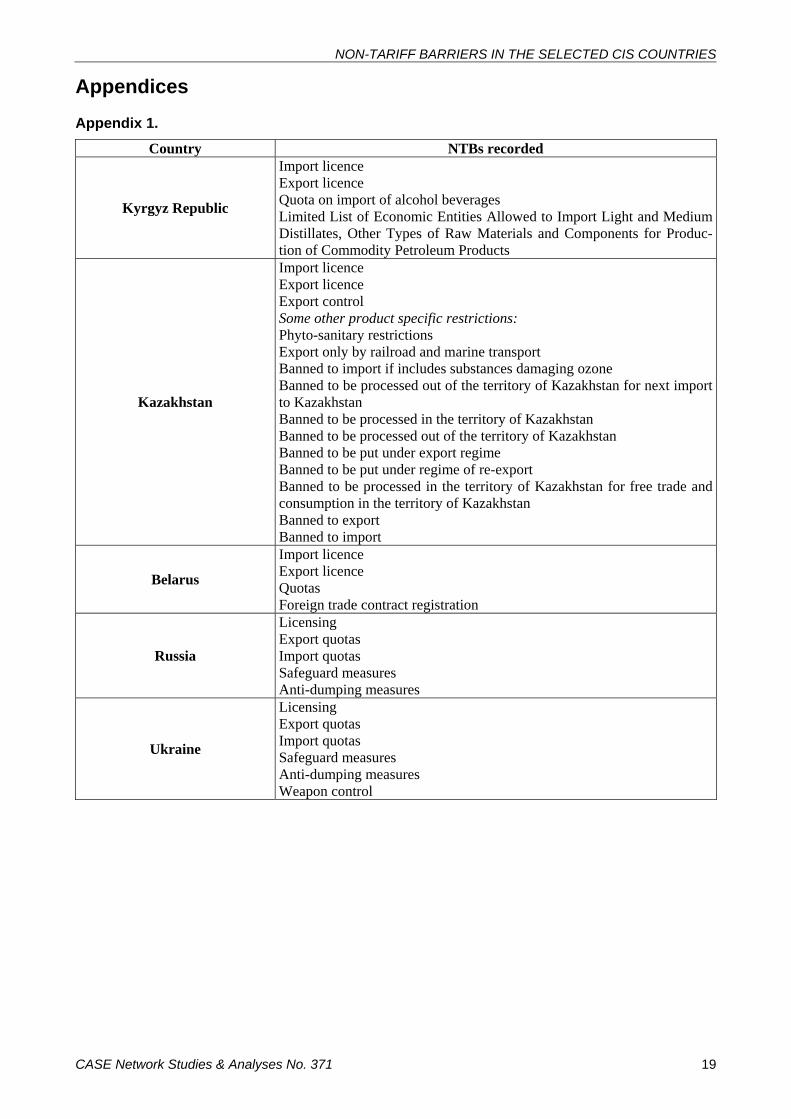
Kazakhstan, Belarus, and the Kyrgyz Republic) we calculated simple frequency and import cover-age ratios of core NTBs for the GTAP sectors in six CIS countries in 2004 and presented in Ap-pendix 2 and 3. The list of the covered core NTBs by countries is presented in Appendix 1. The data on the application of NTBs in CIS countries were collected by the ENEPO project participants - CASE offices in CIS countries. NTBs data and frequency ratios for Ukraine were calculated and provided by Veronika Movchan from the Institute of Economic Research and Policy Consulting, Kyiv.
Our results suggest that the intensity of core NTBs is highest in Russia: on average 40.4% of all tariff lines were subject to NTBs in 2004 (see Appendix 2). The average level of non-tariff pro-tection was also high in Kazakhstan and Belarus (35.4% and 22.8% of all tariff lines respectively), while importance of the analysed core NTBs in the Kyrgyz Republic and Ukraine appeared to be much lower (4.1% and 4.4% respectively). In terms of percentage of imports covered by core NTBs, again Russia and Kazakhstan led the selected CIS countries: 40.4% and 38.4% respec-tively of their total imports in 2004 were subject to core NTBs. Then Belarus (24.0%), Ukraine (7.6%) and the Kyrgyz Republic (7.0%) followed. The values of simple frequency ratios (non-weighted) and import-weighted ratios were nearly the same for Russia, Kazakhstan and Belarus. The import coverage ratio was about 1.7 times higher than non-weighted frequency ratio for the Kyrgyz Republic and Ukraine. It indicates that the considered core NTBs in these countries were applied and concentrated on those commodity groups with higher weights in their import struc-tures.
A low presence of core NTBs in the Kyrgyz Republic and Ukraine (simple frequency ratio in Russia is about 10 times higher than those in these countries, while import coverage ratios are

NON-TARIFF BARRIERS IN THE SELECTED CIS COUNTRIES
CASE Network Studies & Analyses No. 371 15
5.8/5.3 times higher) may reflect these countries’ achievements in liberalizing their trade regimes in the course of the WTO accession negotiations. At the same time, these countries, instead, may apply other NTBs more intensively including technical measures, monopolistic measures, etc. (e.g. as in Ukraine).
Comparing the level of both tariff and core non-tariff protection across CIS countries it can be seen that the Kyrgyz Republic and Ukraine revealed more openness of their trade - in terms of the level of MFN tariffs and severity of the core NTBs applied - than other selected CIS countries (see Figure 1). Kazakhstan’s trade regime was characterised by comparatively low tariff protection, with rather significant non-tariff protection; Belarus had less restrictive application of core NTBs but higher tariffs; while Russia’s trade regimes was comparatively restrictive in terms of both applied core NTBs and MFN tariffs.
Figure 1: Tariff and non-tariff protection across CIS countries, 2004
Russia
Kazakhstan
Belarus
UkraineKyrgyz Republic
0.0
5.0
10.0
15.0
20.0
25.0
30.0
35.0
40.0
45.0
0 2 4 6 8 10 12 14Simple average MFN tariff
Sim
ple
frequ
ency
ratio
Source: IMF, 2005 – tariffs; authors’ calculations – frequency ratios. Overall, all selected CIS countries applied core NTBs more intensively to protect agricultural
and food sectors (shaded area in Appendix 2) rather than non-agricultural sectors, as of 2004. For instance, Russia’s simple frequency ratio is about 3.9 times higher for agricultural products than for non-agricultural products (import coverage ratio is 3 times higher for agricultural imports) (see Ap-pendix 2, 3). Kazakhstan applies core NTBs 2.8 times more intensively for agricultural products than for non-agricultural commodities, and Belarus – 2.7 times, Ukraine – 2.2 times, the Kyrgyz Republic – 1.3 times.
In 2004 high level of concentration of core NTBs in Russia could be observed in almost all ag-ricultural and food sectors: e.g., 100% of tariff lines of wheat and other cereals, sugar, raw milk and dairy products were subject to core NTBs; 95.2% of tariff lines of vegetables, fruits and nuts (98.8% of imports); 83.9% of tariff lines of beverages and tobacco products (92.6% of imports), 76.3% of tariff lines of food products nec (71.2% of imports); 72% of tariff lines of meat products nec (56.1%)7. Among industrial products, wearing apparel was the most affected by the consid-ered core NTBs (90.4% of tariff lines of 93% of imports). It is followed by chemical rubber, and plastic products (48.3% of tariff lines and 63.2% of imports), and leather products (28.4% and 59.1% respectively). The low presence of NTBs for mineral products (petroleum and natural gas production, coal) may be explained by greater use of other NTBs to protect them (e.g. monopolistic measures, etc.). Besides, the core NTBs were comparatively less present in metallurgical products (2.3% of tariff lines covered and 11.4% of metal products imports affected) and did not seem im-portant for machinery and equipment including electronic equipment (7.2% of tariff lines and 23.1% of imports), machinery and equipment nec (4.6% of tariff lines and 5.8% of imports), and motor ve-hicles and parts (0%).
7 It is worth noting zero or low ratios for such agricultural and food products as live animals, bovine meet products, and wool (see Appendix 2 and 3). That is likely explained by more importance and the application of other NTBs (SPS measures, compulsory certification, etc.) in regard to these products.

Sviltana Taran
CASE Network Studies & Analyses No. 371 16
Kazakhstan intensively imposed the core NTBs on agricultural products and food products: tariff lines of wheat and other cereals, raw sugar, and plant-based fibers, were fully covered by core NTBs (see Appendix 2). The core NTBs were also of great importance for oil seeds (87.5% of tariff lines and 99.3% of imports affected), forestry (95.8% of tariff lines and 100% of imports), vegetables, fruit and nuts (94.4% and 97.5% respectively), beverages and tobacco products (58.1% and 38.5%), sugar (28.6% and 88.7%), and crops (65.6% and 98.4%). Ferrous metals (54.6% of tariff lines and 39.7%) and other metals (56.8% and 57.7%), wood products (39.5% and 29.3%), electronic equipment (36.1% and 75.1%), and textiles (33.8% and 12.6%) were the most affected non-agricultural products. Products affected by core NTBs in Kazakhstan included: raw milk and dairy products, meat products, mineral products (petroleum and natural gas production, coal).
In Belarus, the highest frequency and import coverage ratios were observed for the following agricultural and food products: cereals (100%), sugar (100%), beverages and tobacco products (frequency ratio - 74.2% and import-weighted ratio - 93.2%), forestry (37.5% and 96.5%). Non-agricultural products, which were severely subject to NTBs, included: petroleum production (100%), wearing apparel (frequency ratio - 91.3% and import-weighted ration - 77.8%), and wood products (frequency ratio - 24.4% and import-weighted ratio - 35.5%). Belarus did not apply the considered core NTBs to machinery and equipment, leather products, paper products and publish-ing, mineral products, and metal products; and moderately applied to ferrous and other metals.
In Ukraine, the considered core NTBs were the most prevalent in trade of beverages and to-bacco products (frequency ratio - 71% and import-weighted ratio - 79.8%) and sugar (frequency ratio - 57.1% and import-weighted ratio - 99.6%). Electronic equipment (frequency ratio – 27.3% and import-weighted ratio – 52.3%) and chemical, rubber plastic products (frequency ratio – 13.2% and import-weighted ratio – 46.9%) were the leaders among non-agricultural products. On the con-trary, moderate application of the core NTBs was observed in trade of mineral products, textiles, paper and wood products. Again, the absence of core NTBs for agricultural and food products may suggest that these products were subject to other NTBs, first of all, SPS measures and other tech-nical barriers in Ukraine.
The Kyrgyz Republic revealed a low reliance on application of core NTBs measures in its trade policy. Core NTBs in the Kyrgyz Republic are applied mostly to special products, in which trade is usually protected and controlled by countries (such as excise products, precious metals and nar-cotics). Beverages and tobacco products and crops (namely HS 1211 group8) were the most ef-fected agricultural and food products, with 67.7% and 13.1% of tariff lines covered (84.6% and 45.9% of imports affected). Non-agricultural products subject to core NTBs included: metals nec (namely silver ore and precious metals), with frequency ratio - 42.2% and import coverage ratio - 39.8%; petroleum and coal products, with frequency ratio - 12.5% and import coverage ratio - 99.0%; chemical, rubber plastic products, with frequency ratio - 6.2% and import coverage ratio – 32.4%; and certain manufactures (namely cultured pearls, precious stones worked, etc.), minerals nec (namely precious stones, diamonds), with frequency ratio – 6.5% and import coverage ratio – 0.4%, etc.
Conclusions
NTBs constitute a significant part of trade regimes of CIS countries. There is a substantial va-
riety across countries in their intensity of the use of core NTBs - most trade-restrictive non-tariff barriers including quantitative restrictions, price control measures, etc. Among the selected CIS countries, the Kyrgyz Republic maintains the most liberal trade regime in terms of core non-tariff protection. Ukraine also does not rely much on the application of core NTBs to restrict imports, but the application of other NTBs is significant. The most intensive use of core NTBs among the se-lected countries is observed in Russia, followed by Kazakhstan and Belarus. The majority of NTBs are applied to agricultural and food products.
The presented frequency measures are important indicators of the presence of trade distor-tions created by core NTBs in the CIS countries. However further analysis is required to detect the severity of those distortions and their economic impacts. It is also important to analyse other NTBs 8 Plants and parts of plants (including seeds and fruits), of a kind used primarily in perfumery, in pharmacy or for insecticidal, fungicidal or similar purposes, fresh or dried, whether or not cut, crushed or powdered.

NON-TARIFF BARRIERS IN THE SELECTED CIS COUNTRIES
CASE Network Studies & Analyses No. 371 17
including SPS measures, TBT, customs control, price regulations, etc, to make a proper assess-ment of the restrictiveness of trade regimes in CIS countries. In addition, trade barriers arising from underdeveloped trade infrastructure and institutions, illegal practices and weak law enforcement that are widely spread in CIS countries also should be taken into account and investigated.
References
Baldwin, R. (1970). Nontariff Distortions of International Trade. The Brookings Institution,
Washington DC. Beghin, J.C. and J.-C. Bureau (2001), Quantitative Policy Analysis of Sanitary, Phytosanitary
and Technical Barriers to Trade, Economie Internationale, CEPII research center, issue 3Q, pages 107-130.
Bora, B. (2005). The quantification and Impact of Non-Tariff Measures. In Dee, P., Ferrantino M. (Eds.), Quantitative Methods for assessing the Effects of Non-Tariff Measures and Trade Facili-tation. Singapore. 664 p.
Bora, B., Kuwahara, A. and S. Laird (2002). Quantification Of Non-Tariff Measures. Document UNCTD/ITCD/TAB/19.
Brenton P. and J. Whalley (1999). Evaluating a Ukraine-EU Free Trade Agreement using a Numerical General Equilibrium Trade Model, Report prepared for the European Commission as a part of the EES Project UK26, “Study on the Economic feasibility, General Economic Impact and Implications of a Free Trade Agreement between the European Union and Ukraine”, submitted by CEPS, Brussels.
CEPS (2006). The Prospect of Deep Free Trade between the European Union and Ukraine, Michael Emerson (Ed.), Centre for European Policy Studies (CEPS), Brussels.
Copenhagen Economics, Institute for Economic Research and Policy Consulting, Institute for East European Studies Munich (2005), Project study “Analysis of the Economic Impacts of Ukraine’s Accession to the WTO”. Presented at World Bank on December, 2005.
Deardorff, A. V. and R. M. Stern (1997). Measurement of Non-Tariff Barriers. OECD Econom-ics Department Working Paper No.179.
DeKort J. and R.Dragneva (2007). Russia’s Role in Fostering the CIS Trade Regime. Paper presented at the European Association for Comparative Studies (EACES) 9th Bi-Annual Confer-ence: Development Strategies – A Comparative View.
Diomin S., Jakubiak M., Kostrzewa K., and M. Puntea (2005). EU-Moldova Trade: Existing Barriers and Prospects for Future Integration. Report from the project: Implementation of trade bar-riers faced by Moldovan exporters and support in trade expansion, CASE, Chisinau.
EBRD (2006). Transition Report Update 2006. Available at http://www.ebrd.com/pubs/econo/series/tr.htm
Freinkman L, E. Polyakov and C. Revenco, (2004). Trade Performance and Regional Integra-tion of the CIS Countries, World Bank Working Paper, No 38, June 2004.
Hillman, J.S. 1991. Technical Barriers to Agricultural Trade. Westview Press, Boulder, Colo-rado, USA.
Jakubiak, M., Maliszewska, M., Orlova, I., Rokicka M., and V. Vavryschuk (2006). Non-Tariff Barriers in Ukrainian Exports to the EU, CASE Reports No. 68/2006.
Jensen J. and D. Tarr (2007). The Impact of Kazakhstan Accession to the World Trade Or-ganization: A Quantitative Assessment, World Bank Policy Research Working Paper 4142, March 2007.
Jensen J., Rutherford T. and D.Tarr. (2004), The Impact of Liberalizing Barriers to Foreign Di-rect Investment in Services: The Case of Russian Accession to the World Trade Organization. Available at: www.worldbank.org/trade/russia-wto.
Institute for Economic Research and Policy Consulting (2007), Economic Consequences of Ukraine's WTO Accession: Analysis with the CGE model. Presented at the EERC International Conference "Ukraine and the WTO: Implications of international economic integration" on January 26, 2007. Available at: http://www.eerc.kiev.ua/events/conferences/wto/wto.shtml.
International Monetary Fund (2005). Review of the IMF’s Restrictiveness Index. Prepared by the Policy Development and Review Department, February 14, 2005.
Kee, H. L., Nicita, A., and M. Olarreaga (2005). Estimating Trade Restrictiveness Indices. Pol-icy Research Working Paper Series 3860, The World Bank.

Sviltana Taran
CASE Network Studies & Analyses No. 371 18
Laird, S. and R. Vossenaar (1991). Porque nos preocupan las bareras no arancelarias?, In-formacion Comercial Espanola, Special Issue on Non-tariff Barriers, November, pp. 31-54.
Mahe L.P. (1997). Environment and Quantity Standards in the WTO: New Protectionism in Ag-ricultural Trade, A European Perspective. European Review of Agricultural Economics, 24: 480-503.
Maskus, K. E. Otsuki, T., and J. S Wilson. (2001). An Empirical Framework for Analyzing Technical Regulations and Trade, Chapter 2 of the book, Quantifying the Impact of Technical Bar-riers to Trade: Can It Be Done? The University of Michigan Press, 2001.
Mogilevsky R. (2004). Participation in WTO and Regional Trade Agreements: Kyrgyzstan’s Experience. CASE-Kyrgyzstan.
Movchan, V. and I. Eremenko (2003). Measurement of Non-Tariff Barriers: The Case of Ukraine. Prepared for the Fifth Annual Conference of the European Trade Study Group (ETSG) September 11-13, 2003, Madrid, Spain.
Pindyuk, O. (2006). Adjustment Costs of Trade Liberalization for Ukraine’s Labor Market. INDEUNIS Papers, September 2006.
Popper S., Greenfield V., Crane K. and R. Malik (2004). Measuring Economic Effects of Tech-nical Barriers to Trade on U.S. Exporters. Planning Report 04-3 of RAND Science and Technology, DRR-3083-5-NIST, August 2004.
Rutherford T, Tarr D. and O. Shepotylo. (2004), Poverty Effects of Russia’s WTO Accession: modeling ‘real’ households and endogenous productivity effects. Available at: www.worldbank.org/trade/russia-wto.
Rutherford T, Tarr D. and O. Shepotylo. (2005), The Impact on Russia of WTO Accession and the Doha Agenda: The Importance of Liberalization of Barriers Against Foreign Direct Investment in Services for Growth and Poverty Reduction. World Bank Policy Research Working Paper 3725.
Wilson J. S. and T. Otsuki (2004). Standards and Technical Regulations and Firms in Devel-oping Countries: New Evidence from A World Bank Technical Barriers to Trade Survey. June 2004. http://siteresources.worldbank.org/INTRANETTRADE/Resources/Topics/Services/TBT_Data_Description.pdf
World Bank (2004a). Ukraine Trade Policy Study (In Two Volumes) (2004). World Bank Report No. 29684-UA.
World Bank (2004b). The Republic of Moldova: Trade Diagnostic Study. Report No. 30998-MD.
World Bank (2005a). Belarus: Window of Opportunity to Enhance Competitiveness and Sus-tain Economic Growth. A Country Economic Memorandum for the Republic of Belarus. Report No. 32346-BY.
World Bank (2005b). From Disintegration to Reintegration: Eastern Europe and Former Soviet Union in International Trade / edited by Harry G. Broadman. Library of Congress Cataloging-in-Publication Data, ISBN-13: 978-0-8213-6197-9, ISBN-10: 0-8213-6197-X.
United Nations Conference on Trade and Development (UNCTAD) (2005). Methodologies, Classifications, Quantification and Development Impacts of Non-Tariff Barriers: Note by the UNC-TAD Secretariat. Document TD/B/COM.1/EM.27/2.
USTR. Kazakhstan: Foreign Trade Barriers, 2005, 2006. USTR. Ukraine: Foreign Trade Barriers, 2005, 2006. USTR. Russia: Foreign Trade Barriers, 2005, 2006
NON-TARIFF BARRIERS IN THE SELECTED CIS COUNTRIES
CASE Network Studies & Analyses No. 371 19
Appendices
Appendix 1.
Country NTBs recorded
Kyrgyz Republic
Import licence Export licence Quota on import of alcohol beverages Limited List of Economic Entities Allowed to Import Light and Medium Distillates, Other Types of Raw Materials and Components for Produc-tion of Commodity Petroleum Products
Kazakhstan
Import licence Export licence Export control Some other product specific restrictions: Phyto-sanitary restrictions Export only by railroad and marine transport Banned to import if includes substances damaging ozone Banned to be processed out of the territory of Kazakhstan for next import to Kazakhstan Banned to be processed in the territory of Kazakhstan Banned to be processed out of the territory of Kazakhstan Banned to be put under export regime Banned to be put under regime of re-export Banned to be processed in the territory of Kazakhstan for free trade and consumption in the territory of Kazakhstan Banned to export Banned to import
Belarus
Import licence Export licence Quotas Foreign trade contract registration
Russia
Licensing Export quotas Import quotas Safeguard measures Anti-dumping measures
Ukraine
Licensing Export quotas Import quotas Safeguard measures Anti-dumping measures Weapon control

Sviltana Taran
CASE Network Studies & Analyses No. 371 20
Appendix 2. NTB simple frequency ratio by GTAP sectors, 2004 (%)
GTAP GTAP Description Kazakh-stan
Kyr-gyzstan Russia Ukraine Belarus
1 Paddy rice 100.0 0.0 100.0 0.0 100.0 2 Wheat 100.0 0.0 100.0 0.0 100.0 3 Cereal grains nec 100.0 0.0 100.0 0.0 100.0 4 Vegetables, fruit, nuts 94.4 0.0 95.2 0.0 1.1 5 Oil seeds 87.5 0.0 87.5 0.0 12.5 6 Sugar cane, sugar beet 100.0 0.0 100.0 0.0 0.0 7 Plant-based fibers 100.0 0.0 0.0 0.0 0.0 8 Crops nec 65.6 13.1 57.4 0.0 4.9 9 Bovine cattle, sheep and
goats, horses 13.1 0.0 0.0 0.0 0.0
10 Animal products nec 23.9 0.4 29.9 0.0 19.6 11 Raw Milk 0.0 0.0 100.0 0.0 0.0 12 Wool, silk-worm cocoons 100.0 0.0 0.0 0.0 0.0 13 Forestry 95.8 12.5 0.0 0.0 37.5 14 Fishing 4.5 4.5 38.6 0.0 0.0 15 Coal 0.0 0.0 0.0 0.0 0.0 16 Petroleum Production 0.0 0.0 0.0 0.0 100.0 17 Natural Gas Production 0.0 0.0 0.0 0.0 0.0 18 Minerals nec 8.7 6.5 66.3 2.2 4.3 19 Bovine meat products 3.6 0.0 19.3 0.0 7.1 20 Meat products nec 0.0 0.0 72.0 0.0 12.0 21 Vegetable oils and fats 28.6 0.0 26.3 0.0 20.4 22 Dairy products 0.0 0.0 100.0 0.0 8.7 23 Processed rice 100.0 0.0 100.0 0.0 100.0 24 Sugar 28.6 0.0 100.0 57.1 100.0 25 Food products nec 19.4 0.8 76.3 0.4 13.5 26 Beverages and tobacco
products 58.1 67.7 83.9 71.0 74.2
27 Textiles 33.8 0.0 25.1 1.6 15.2 28 Wearing apparel 12.2 0.0 90.4 0.4 91.3 29 Leather products 1.4 0.0 28.4 0.0 17.6 30 Wood products 39.5 0.0 36.0 1.2 24.4 31 Paper products, publishing 4.7 0.0 13.4 2.0 0.7 32 Petroleum, coal products 4.1 12.5 0.0 0.0 12.5 33 Chemical, rubber, plastic
products 15.0 6.2 48.3 13.2 3.5
34 Mineral products nec 5.8 0.0 32.5 1.7 9.8 35 Ferrous metals 54.6 0.0 9.4 0.3 3.3 36 Metals nec 56.8 42.2 16.8 0.0 3.7 37 Metal products 6.8 0.5 2.3 0.5 0.0 38 Motor vehicles and parts 3.1 0.0 0.0 1.2 0.0 39 Transport equipment nec 27.4 0.0 0.0 0.4 0.0 40 Electronic equipment 36.1 1.4 7.2 27.3 0.0 41 Machinery and equipment
nec 22.8 2.7 4.6 9.5 0.1
42 Manufactures nec 4.2 8.9 9.3 3.2 3.7 43 Electricity 0.0 0.0 0.0 0.0 0.0 44 Gas manufacture, distribu-
tion 0.0 0.0 0.0 0.0 0.0
Average: Total 35.4 4.1 40.4 4.4 22.8 Agricultural (shaded) 53.5 4.7 66.0 6.1 33.9 Non-agricultural 19.0 3.5 17.0 2.8 12.6
Source: Calculations are based on the data collected by CASE offices in CIS countries. NTB frequency ra-tios for Ukraine were calculated by Veronika Movchan.

NON-TARIFF BARRIERS IN THE SELECTED CIS COUNTRIES
CASE Network Studies & Analyses No. 371 21
Appendix 3. NTB import-weighted frequency ratio by GTAP sectors, 2004 (%)
GTAP GTAP Description Kazakh-stan
Kyr-gyzstan Russia Ukraine Belarus
1 Paddy rice 100.0 0.0 100.0 0.0 100.0 2 Wheat 100.0 0.0 100.0 0.0 100.0 3 Cereal grains nec 100.0 0.0 100.0 0.0 100.0 4 Vegetables, fruit, nuts 97.5 0.0 98.8 0.0 1.2 5 Oil seeds 99.3 0.0 53.7 0.0 0.0 6 Sugar cane, sugar beet 100.0 100.0 0.0 0.0 7 Plant-based fibers 100.0 0.0 0.0 0.0 0.0 8 Crops nec 98.4 45.9 31.5 0.0 36.5
9 Bovine cattle, sheep and goats, horses 0.1 0.0 0.0 0.0 0.0
10 Animal products nec 60.0 0.0 19.4 0.0 19.4 11 Raw Milk 0.0 0.0 100.0 0.0 0.0 12 Wool, silk-worm cocoons 100.0 0.0 0.0 0.0 0.0 13 Forestry 100.0 0.0 0.0 0.0 96.5 14 Fishing 21.1 0.0 23.2 0.0 0.0 15 Coal 0.0 0.0 0.0 0.0 0.0 16 Petroleum Production 0.0 0.0 0.0 0.0 100.0 17 Natural Gas Production 0.0 0.0 0.0 0.0 0.0 18 Minerals nec 0.1 0.4 90.2 0.0 0.0 19 Bovine meat products 0.0 0.0 16.9 0.0 4.7 20 Meat products nec 0.0 0.0 56.1 0.0 1.0 21 Vegetable oils and fats 5.7 0.0 50.1 0.0 9.5 22 Dairy products 0.0 0.0 100.0 0.0 1.1 23 Processed rice 100.0 0.0 100.0 0.0 100.0 24 Sugar 88.7 0.0 100.0 99.6 100.0 25 Food products nec 6.1 0.0 71.2 1.4 13.1
26 Beverages and tobacco products 38.5 84.6 92.6 79.8 93.2
27 Textiles 12.6 0.0 38.5 1.8 11.5 28 Wearing apparel 28.8 0.0 93.0 1.6 77.8 29 Leather products 5.7 0.0 59.1 0.0 0.0 30 Wood products 29.3 0.0 21.0 2.2 35.5 31 Paper products, publishing 2.2 0.0 23.0 8.9 0.0 32 Petroleum, coal products 26.6 99.0 0.0 0.0 0.0
33 Chemical, rubber, plastic products 24.0 32.4 63.2 46.9 6.2
34 Mineral products nec 2.9 0.0 30.9 20.0 14.5 35 Ferrous metals 39.7 0.0 1.4 1.2 10.2 36 Metals nec 57.7 39.8 3.5 0.0 17.6 37 Metal products 7.3 0.0 11.4 0.0 0.0 38 Motor vehicles and parts 3.0 0.0 0.0 4.2 0.0 39 Transport equipment nec 29.8 0.0 0.0 0.2 0.0 40 Electronic equipment 75.1 5.3 23.1 52.3 0.0
41 Machinery and equipment nec 29.8 0.0 5.8 9.8 0.0
42 Manufactures nec 0.4 0.8 1.2 6.1 5.5 43 Electricity 0.0 0.0 0.0 0.0 0.0
44 Gas manufacture, distribu-tion 0.0 0.0 0.0 0.0 0.0
Average: Total 38.4 7.0 40.4 7.6 24.0 Agricultural (shaded) 57.9 6.2 62.5 8.6 37.0 Non-agricultural 20.7 7.7 20.2 6.7 12.1
Source: TRAINS; Source: Authors’ calculations based on the NTB data collected by CASE offices in CIS countries. NTB frequency ratios for Ukraine are based on the data provided by Veronika Movchan.