Embed Size (px)
Citation preview
Report No. 45708-AFR NON-TARIFF MEASURES ON GOODS TRADE IN THE EAST AFRICAN COMMUNITY SYNTHESIS REPORT October 10, 2008 PREM 2 AFCRI Africa Region
Document of the World Bank Prepared for East African Community (EAC) and Member Governments of Burundi, Rwanda, Kenya, Tanzania, and Uganda
CURRENCY EQUIVALENTS (September 24, 2008)
US$1.00 US$1.00 US$1.00 US$1.00
= = = =
1139.10 Burundi Francs 549.75 Rwanda Francs 1172.60 Tanzania Shillings 1650.50 Uganda Shillings
FISCAL YEAR
Burundi, Rwanda Kenya, Tanzania, Uganda
: :
January 1 - December 31 July 1 - June 30
WEIGHTS AND MEASURES
Metric System
ABBREVIATIONS & ACRONYMS
ACP Africa, Caribbean, Pacific AfDB African Development Bank AFTA Asian Free Trade Area AGOA African Growth and Opportunity Act ASEAN Association of Southeast Asian Nations ASYCUDA Automated Systems for Customs Data BIC business investment climate BNPP Bank-Netherlands Partnership Program CEPGL Economic Community for Great Lakes Countries CEPT Common Effective Preferential Tariff CET common external tariff CFS Container Freight Station COMESA Common Market for Eastern and Southern Africa DRC Democratic Republic of Congo DTIS diagnostic trade integration studies EABC East Africa Business Council EAC East African Community EATTFP East Africa Transport and Trade
Facilitation Project ECCAS Economic Community of Central African States ECJ European Court of Justice EEC European Economic Community EPA Economic Partnership Agreement EPZ Export Processing Zones EU European Union FDI foreign direct investment FTA free trade area GATT General Agreement on Tariffs and Trade GDP gross domestic product GNFS goods and nonfactor services GNI gross national income GSP Generalized System of Preferences HIPC Highly Indebted Poor Countries IDPs internally displaced persons IDF Institutional Development Fund
IF Integrated Framework ISSO International Standards Setting Organizations ITWG Interim Technical Working Group LDCs less developed countries MDG Millennium Development Goals MFN most favored nation MoU memorandum of understanding MRA Mutual Recognition Arrangements MS member state NBS National Bureau of Standards NMC National Monitoring Committee NPV net present value NTMs non-tariff measures OTRI Overall Trade Restrictiveness Index PRSP Poverty Reduction Strategy Paper REC regional economic community SAD Single Administrative Document SADC Southern African Development Community SEA Single European Act SEM Single European Market SIMBA Similarity Based Complex Analysis System SITC Standard International Trade Classification SPS sanitary and phyto-sanitary measures SSA Sub-Saharan Africa TBT technical barriers to trade TEU Twenty Foot Equivalent Units TIFA Trade and Investment Framework Agreement TRAINS Trade Analysis Information System (of UNCTAD) TPRs Trade Policy Reviews TTRI Trade Tariff Restrictiveness Index UNCTAD United Nations Conference on Trade and Development WCO World Customs Organization WDI World Development Indicators WTO World Trade Organization
Vice President : Obiageli Ezekwesili Country Director : Mark Tomlinson
Sector Director : Sudhir Shetty Sector Manager : Kathie Krumm
Task Team Leader : Sumana Dhar
NTMS ON GOODS TRADE IN THE EAC: SYNTHESIS REPORT
TABLE OF CONTENTS
FOREWORD.................................................................................................................................... i
EXECUTIVE SUMMARY............................................................................................................ iii
Chapter 1. Introduction.................................................................................................................. 1 I. Continuing Efforts toward Greater Integration in Goods Trade .................................. 1 II. EAC’s Working Definition of NTMs .......................................................................... 5 III. Work Already Initiated by EABC/EAC and Others .................................................... 6
Chapter 2. PROFILE OF THE EAC ............................................................................................. 9 I. The EAC’s Economic Features.................................................................................... 9 II. Formal Goods Trade .................................................................................................. 10
Chapter 3. METHODOLOGY TO ORGANIZE FINDINGS ..................................................... 15 I. A Path of Open Regionalism ..................................................................................... 15 II. A Ranking by the Ease of Action for Reduction/Removal ........................................ 15 III. A Practical Way Forward........................................................................................... 16
Chapter 4. NON-TARIFF MEASURES IN THE EAC .............................................................. 20 I. Perspective from the EAC’s Formal Goods Trade .................................................... 20 II. Economic Cost of NTMs ........................................................................................... 22 III. NTMs Prevalent in the EAC...................................................................................... 23 IV. Other Constraints on Goods Trade in EAC ............................................................... 36 V. Factors Likely to Influence Speed of EAC Action on NTMs.................................... 46
Chapter 5. LEARNING FROM OTHER REGIONAL ECNOMIC COMMUNITIES............... 49 I. The EU Approach to Non-tariff Measures................................................................. 49 II. The ASEAN Approach to Non-tariff Measures......................................................... 54
Chapter 6. LOOKING FORWARD: RECOMMENDATIONS FOR FOLLOW-THROUGH .. 59 I. NTM Decisions.......................................................................................................... 59 II. Working within the Current EAC System ................................................................. 62 III. Needed EAC Actions Outside the Direct Arena of NTMs ........................................ 67
APPENDIX GROUP A................................................................................................................. 69 Appendix A1. Details of Trade Flows of EAC Members.................................................... 70 Appendix A2. Trade Routes in East Africa ......................................................................... 73 Appendix A3. UNCTAD Coding System of Trade Control Measures ............................... 78 Appendix A4. WTO Inventory of Non-tariff Measures ...................................................... 82 Appendix A5. Transport Costs and Prices in East Africa.................................................... 83 Appendix A6.1 Range of Constraining Infrastructure in EAC............................................ 86 Appendix A6.2 Infrastructure Improvements That Would Make a Difference................... 88 Appendix A7. Sensitive Products under the EAC Customs Union ..................................... 89 Appendix A8.1. Sanitary and Phyto-sanitary Priority Needs for a EAC member: Uganda 90 Appendix A8.2 EAC’s Outstanding Priorities for SPS ...................................................... 92
BIBLIOGRAPHY ......................................................................................................................... 93
WEB SITES .................................................................................................................................. 98
APPENDIX GROUP B (available electronically on request to [email protected]) Recent Economic and Trade Profiles B1. Burundi B2. Rwanda B3. Kenya B4. Tanzania B5. Uganda List of Boxes
Box 4.1. Burundi: Steps in Customs Formalities for Goods at Bujumbura .................................. 24 Box 4.2. Burundi: Institutions for Administrative and Customs Formalities............................... 25 Box 4.3. Uganda: Public Agencies to Ensure Food Safety, Agricultural Health, and/or Quality Standards ....................................................................................................................................... 25 Box 4.4. The Dairy War: Kenya versus Uganda and Tanzania.................................................... 32 Box 4.5. Product Definition: The Case of Incompatible Sugar..................................................... 33 Box 4.6. Kenya-Uganda Standoff in Livestock Trade: ................................................................. 36 Box 4.7. Grains Trade in the EAC: Informal Trade and NTMs.................................................... 38 Box 5.1. Establishing the Principle of Mutual Recognition: The Cassis de Dijon Case ............... 51 Box 5.2. The Copenhagen Criteria for Accession to the EU......................................................... 53 List of Figures
Figure 3.1. Categories of NTMs................................................................................................... 16 List of Tables
Table 2.1. An Economic Profile of the EAC, 2000–6 average........................................................ 9 Table 2.2. Value of Exports of All Commodities to EAC............................................................. 11 Table 2.3. Exports to EAC by Member Countries by SITC 1 Categories (percent of total) ........ 12 Table 2.4 Top Commodities in Export Value Shares, 2000–6 average......................................... 13 Table 3.1. Summary Measures of Core NTMs (percentage points) ............................................. 18 Table 4.1Estimated Unit Transport Costs for Container ............................................................... 21 Table 4.2. Severity of NTMs on Goods Trade in EAC: ................................................................ 39 Table 4.3. Severity of NTMs on Goods Trade in EAC: ................................................................ 40 Table 5.1. Most Prevalent NTMs in ASEAN................................................................................ 55 Table 6.1. Starting Reduction/Removal of Non-tariff Measures in EAC...................................... 65

i
NTMS ON GOODS TRADE IN THE EAC: SYNTHESIS REPORT
FOREWORD
This is a synthesis of a five-country study being prepared by the World Bank at the request of the East African Community (EAC). In establishing its free trade area, the EAC has been promoting free movement of goods among its members since 2005, primarily by dismantling tariffs and customs duties. In the elimination of non-tariff measures (NTMs) to trade in goods, the EAC intent and legal framework is already in place. In the EAC Protocol, Article 13(1) stipulates that member countries must agree to eliminate remaining NTMs and not to impose new ones. Moreover, Article 13(2) provides that member states shall formulate a mechanism to identify and eliminate such NTMs.
EAC Secretariat requested overall synthesis of findings based on in-depth member country analyses for its member states. The work is expected to feed into the EAC member deliberations and to devise practical actions to make Art 13 of the EAC Protocol fully operational. It will also provide the anchor for the initial work program of the National Monitoring Committees for NTMs established in June 2007 in most of the member countries. The concept for the phased work was reviewed and endorsed in the Bank during January 24-Februrary 4, and at the EAC in Arusha on February 11, 2008. The assessment is based primarily on interviews conducted at the EAC from February to June 2008 of private stakeholders, covering a wide array of producers, traders, and transporters, as well as a variety of trade facilitation agencies and government departments. The draft synthesis report was reviewed by the Bank on September 22, 2008. A subsequent draft was reviewed by the EAC Secretariat in October 2008. Their approval (on October 08, 2008) concludes the stocktaking. A second stage of work focused on practical steps toward reducing and eliminating NTMs is now being initiated, through country-specific discussions in each EAC member state. The World Bank task team leader (TTL) and primary author is Sumana Dhar (AFTP2). With the TTL, the task team across the EAC countries was composed of Josphat Kweka, Tracey Lane, and Rachel Sebudde (AFTP2); Eric Mabushi (AFTP3); Peter Isabirye (consultant, AFMRW), Viju Ipe (consultant, AFTP2)and Valentina Rollo (JPA). Local consultant support was provided by Tharcisse Kadede (Burundi), Simon Ihiga (Kenya), Jean Basco Iyadema (Rwanda), and Milton Ayoki (Uganda). Logistics and mission support was provided by the following Bank staff: Aurore Simaneye (Burundi), Mary-Anne Mwakangle (EAC and Tanzania), Carol Kidiavayai (Kenya), Josiane Niyonkuru (Rwanda), Rosemary Mugusha (Uganda), and Marjorie Kingston (Washington, DC) as well as Jackilina Trindade (GEP-CERDI summer intern). The team thanks the Bank staff who contributed to the concept and decision draft reviews for the resultant improvements. It is particularly grateful to the insights and detailed comments provided by reviewers, Mona Haddad (PRMTR), Michael Jensen (PRMTR), and Fahrettin Yagci (senior consultant PRM) as well as the EAC Director of Trade, Flora Musonda. The team thanks Mark Tomlinson (Director-RI), Kathie Krumm (Sector Manager, AFTP2), as well as Colin Bruce (former CD-Kenya, Rwanda); Victoria Kwakwa (CM-Rwanda); John McIntire (CD-Burundi, Tanzania, Uganda); Alassane Sow (former CM-Burundi); and Harriet Nannyonjo (acting CM-Uganda) for their guidance during the preparation. The document benefited from discussion with the Bank teams working on agriculture and rural development, and on transport in AFR. The team recognizes the financial assistance from the Bank AFR Regional Integration and the Government of the Netherlands (through the BNPP trust funds).
ii
The team is very appreciative of the openness of the Governments of Burundi, Rwanda, Kenya, Tanzania, and Uganda in providing access to information, discussing preliminary concepts and draft report, both through their EAC delegations at Arusha, Tanzania and during the preparatory mission, interviews, and analysis in the country capitals. The support from Peter Kiguta, Director General–Trade and Customs, EAC and his staff at the EAC Secretariat is gratefully acknowledged. In addition to informing the policy deliberations by the member delegations and Council of Ministers at the EAC, it is hoped that the report will be used to determine the national policy actions of the EAC member countries in the diverse arena of NTMs on goods trade, both directly and as part of the EAC. During preparation, the findings informed the World Bank’s assistance strategy for the next three years and country team deliberations for Burundi, Rwanda, Kenya, Tanzania, and Uganda. October 2008
iii
NTMS ON GOODS TRADE IN THE EAC: SYNTHESIS REPORT
SUMMARY
The purpose of this note is to highlight the key findings of an assessment of non-tariff measures (NTMs) on goods trade in the EAC, and identify priorities for a second stage of work focused on practical steps toward reducing and eliminating these NTMs. I. Non–tariff Measures as the Next Main Area of Action for Strengthening EAC’s Trade Integration • Common market deliberations in EAC. The EAC wants to consider the elimination of the
NTMs within the context of its evolving common trade policy. This synthesis report is prepared in response to EAC’s request for a phased technical assistance from the World Bank. Its objectives are to choose NTMs with high impact on inter-member trade out of the range of NTMs identified in the region; improve the understanding of their persistence over time; and, devise practicable implementation plans for their removal.1 In concrete steps towards establishing a FTA, the EAC has already made remarkable progress on reducing/eliminating tariffs on traded goods since 2005. The remaining internal tariff walls are to be eliminated by 2010. There is increasing need for the kind of analysis requested by EAC where the REC-wide internal trade liberalization has allowed considerable reduction/ elimination of tariffs, but would be offset by NTMs. This, in turn would significantly delay the establishment of the EAC common market.
• Elimination of NTMs in the EAC Protocol. The Protocol for the Establishment of the EAC
Customs Union provides the legal structure for NTB elimination in Article 13, which stipulates that to establish a full FTA,
“1. Except as may be provided for or permitted by this Protocol, each of the Partner States agrees to remove, with immediate effect, all the existing non-tariff barriers to the importation into their respective territories of goods originating in the other Partner States and, thereafter, not to impose any new non-tariff barriers. 2. The Partner States shall formulate a mechanism for identifying and monitoring the removal of non-tariff barriers.”2
The National Monitoring Committees for NTMs in the EAC members were instituted in 2007 – except in Burundi. To develop and embark of their work programs, the NMCs will need prioritization of the NTMs and guidance at the EAC level and strengthening of political commitments at the national level. Strong, targeted financial and technical support for improvement of institutional capacity to monitor implementation of the program at the regional and national levels will also be critical.
• Building on earlier analysis of NTMs in EAC. EAC’s working definition of NTMs is
‘quantitative restrictions and specific limitations that act as obstacles to trade,’ other than tariffs, that may be embedded in government laws, regulations, practices and requirements at the national and local level, often for various legitimate reasons like safeguarding health, environment, etc. Identifying and classifying NTMs is not easy anywhere. This assessment
1 The phased work program concept has been endorsed by both EAC and Bank reviews. Phase 1 was financed by the Bank and the BNPP. Phase 2 is being financed by the Bank and a MDTF for trade in Africa. 2 EAC Protocol, 2004, pp. 16. The Protocol was signed in March 2004 and came into effect in January 2005 for the founders: Kenya, Tanzania and Uganda. Burundi and Rwanda accepted it from July 2007.
iv
has drawn on prior analysis of NTMs by the private sector entities in the three founding members, within the context of surveys towards improving overall private sector business environment, as well as country specific trade diagnostic studies. The earlier analysis focused less on the understanding the political economy for persistence of NTMs over time or measuring specific and/or quantitative impact of NTMs for comparative purposes in assessing priorities. The analysis presented in this report complements the earlier work, based on a combination of desk reviews and consultations with member governments and private sector firms in all the five member countries.
II. Main Characteristics of intra-EAC Trade The following aspects of intra-EAC trade are particularly relevant for assessing priorities for NTM removal.
• Current intra-EAC goods trade in official statistics. Food and live animals as a group continue to dominate the formal intra-EAC trade of almost all EAC members, except the exports of Kenya, suggesting the importance of assessing NTM impact for those sub-sectors. The two other important groups - especially for the new EAC members - are beverages and tobacco, and inedible crude materials. The intra-EAC exports by Kenya shows increasing diversification into more specialized manufactured goods and articles, and gradually so by Tanzania and Uganda also. Chemicals, fuels and lubricants, as well as machinery and transport equipment are the other significant groups in Kenya’s exports to the rest of EAC. Most members sell their top five commodities (by the value share in regional trade) in the Kenyan market. Burundi and Rwanda export the same top commodities to the rest of EAC as they do to the rest of the world. This latter observation - combined with relatively small internal market size relative to other RECs - suggests that the EAC may be able to draw heavily on WTO-consistency as a means for NTM elimination.
• Informality. A significant part of the trade within the region in food and live animals tends to be seasonal, largely localized, and often informal. The transit routes are often along traditional cross-border paths, away from the major transport corridors. Hence, such trade remains inadequately captured in the official national statistics. It will be important to understand the implications of NTMs (and their elimination) on these trade flows, especially to the extent that NTMs have been encouraging informality and hence hampering market development.
• Transport corridors for formal goods trade. The backbone of formal intra-EAC trade are two overland road and rail routes, the Northern and Central corridors - starting from the ports of Mombasa and Dar es Salam respectively and reaching the border of DRC on the region’s western edge - along with a north-south road link through Namanga on the Kenya-Tanzania border. These corridors are also critical for transit of EAC’s imports from outside, and its goods exports beyond the region. This suggests a focus on NTMs related to the functioning of these corridors in particular.
An acute constraint for the producers, traders and transporters of goods in EAC is the poor physical condition of the state-run transport and communications infrastructure. The potential for rail transport is recognized, even though the current state of disrepair of railroads along both corridors and inadequacy of rail equipment for use will need to be alleviated before it is a viable alternative again. In addition, constraints include the poor state and maintenance of roads and weighbridges; the small capacity and disrepair of the ports on the Indian Ocean and the lakes; and, the underdeveloped water transportation across Lake Victoria and Tanganyika. While this report does not focus on the state of the physical transport infrastructure in EAC, it clearly is a complementary priority.
v
III. NTMs in EAC Today: Synthesis of Findings based on member country interviews
• Cost of NTMs. The impact of NTMs in EAC measured by the largest direct and indirect cost
to the private sector is the lost man-days during goods transit and clearance at the internal borders and along the transport corridors before reaching the destined market. For example, two days are needed for a 950 km journey between Mombasa and Malaba due to convoys and road blocs; an average of two weeks is needed to clear goods in Mombasa; and, all goods entering through any border post in Burundi needs to be cleared at the Bujumbura port. Next in rank are various nonofficial cost enhancements, arising from scope for fraudulent behavior created through the flexible implementation of national policies. For example, the current flexible application of axle-load restrictions on trucks in Kenya and Uganda; the continued operation of five compulsory weighbridges along the Central corridor between Rusumo and Dar es Salam, as well as seven in Kenya and four in Uganda along the Northern corridor to reach Kigali from Mombasa (at latest count). The other important costs added by NTMs are the range of official payments necessary for goods trade, and the lost business opportunities, the latter most difficult to quantify.
• Type of existing NTMs. EAC members harbor a range of generic NTMs that apply to most
goods traded across the region’s internal borders. These often apply to goods trade beyond the EAC also. A shorter list of NTMs has begun affecting product specific trade in the region in the recent years. They are based on technical quality and SPS standards specified for the goods, and mostly anchored in health and safety concerns stated by the member governments.
The current NTMs that apply to intra-EAC trade - as per the broad categories of the WTO inventory - are ranked below in a decreasing order of importance based on numbers of private sector complaints.
A. Generic NTMs
• Customs and administrative entry and passage procedures. Prolonged formalities,
multiplicity of institutions, duplication of clearance processes, limited capacity at the border posts and travel restrictions through convoy and time of day, continue to add monetary costs and transit time for goods traded in the EAC. In addition, some rules of origin cases have escalated to the need for verification mission to determine adherence; or emerged related to specific origin.3 In pre-shipment inspection, the efficiency of certain private/ parastatal agencies in charge is questioned by the traders. There is very limited, if any, flexibility in the use of customs agents and bonds. The private firms’ complaints identify this group of NTMs as the most important in the region.
The revenue incentives remain important for each member, with a range of specific charges adding to the private cost of trade in EAC. Actual instances of unequal treatment according to the country of origin of the goods and/or truck and its driver remain frequent, as are the vociferous allegations by private firms of such “unfair” treatment arising due to perceived national protectionism and corruption. The opportunities for fraudulent behavior are reported to arise due to the gaps between the respective national revenue authority decisions and their actual application at the border, as well as due to the early stages of acceptable coding and
3 Repeated allegations of counterfeit goods from the Far East entering the EAC through Dar es Salam, with the Tanzanian stamp of manufacture questioned by the other EAC members.
vi
synchronization within the EAC (a responsibility of the EAC Directorate of Customs and Trade).
The EAC Council of Ministers expects that its region-wide decisions will simplify and synchronize customs documentation, formalities and procedures at the border posts. To date there is considerable lag between the time the relevant rules are harmonized by the EAC Council of Ministers, and the time national customs officers at the border posts develop capacity to apply the EAC regulations and stop applying the national or COMESA taxes/duties and procedures. Many member states are undertaking donor-funded customs systems reform and modernization and border post upgrading. But, the focus and content of such national efforts have been largely bilateral, slow, and uncoordinated across the EAC. Where attempted, the concept of ‘one-stop-center’ for clearance has not really started working.
• Government participation in trade and restrictive practices tolerated by it. The
operation of ports (sea ports of Mombasa and Dar es Salam; lake ports of Bujumbura and Kigoma), inland container freight stations (like MAGERWA and Isaka) and the plethora of manned weighbridges by the national governments, parastatals or monopolies authorized by the governments, are identified by the private sector stakeholder responses as the NTMs second is importance in EAC serving as a bottleneck for economic activity in the region. Their response is mindful of the possibility of such NTMs being alleviated as constraint imposed by the physical infrastructure itself is tackled gradually. Transparency and efficiency in clearance and release of goods at the sea ports is hampered by administrative complexity of formalities, especially in Mombasa; limited skills and ineffectiveness of staff and agents prevail, especially in Dar es Salam. Short, inadequate grace periods are provided for the imports prior to the application of demurrage charges. All add lengthy delays, congestion, and high cost of offloading and clearing cargo (already limited by the useable physical infrastructure at these locations) and create considerable scope for discriminatory/fraudulent behavior. Shipment clearance delays also enhance risk of deteriorating product quality, especially for perishable products.
National infrastructure remedies being instituted are addressing brick and mortar issues, but often not the associated operational practices that have the direct impact on intra-EAC trade.4 In recent years, the governments have opted for private or joint management some of the facilities, or allowed in the first private alternatives, or are looking into such options. However, following such decisions, scarcity of investment funds of the private management company and the lack of co-ordination with other government decisions are often emerging, as are sub-optimal operational business decisions taken by the private monopoly after the replacement of a state monopoly.
• Distribution constraints. NTMs originating in national regulations and their application on
the transit of goods in the member states constitute the third broad category in importance. The way in which the transit licenses for goods, the truck entrance fees and grace period, the permits for refueling, and the prohibition on transportation of locally produced goods and backloads are applied vary considerably within EAC and can be discriminatory. Multiple police road blocks and mobile control along the transit routes remain a much-discussed but persistent NTM, with ample scope to ‘toa kitu kidogo.’5 In particular cases, for example in Tanzania, the difference in transit time along the same route and in ease of procedures - hence
4 Improvements are reported along the Northern corridor. 5 The customary request in Kiswahili, ‘Give something small.’
vii
cost - are so significant that producers and traders make very specific choices on the use of trucks registered in certain member countries and drivers who have the particular national citizenship.
At present, a major issue with traders and transporters is that of axle load specifications and Gross Vehicle Mass. The EAC has passed a specific 3 axle–7 tonne per axle load requirement for trucks. All member governments agree that the new restriction is good for protecting the road surface in the region. In addition, the private sector agrees that it will eventually be beneficial for truck maintenance and reduced workshop time. Tanzania has been strictly applying such axle load limits, as a member of SADC, for a while. However, the other four EAC members have traditionally allowed 4-axle trucks with much larger loads. These larger capacity trucks have become an important lifeline for the EAC, as the railways became less and less an alternative for bulk commodity transportation. In the interim - while the rule is being disputed by the Kenyan transporters in the Kenyan courts – the rule is starting to be sporadically applied by Kenya, Uganda, and Rwanda, with decisions at the border not agreeing on application of axle load limits. In extreme cases, entry is temporarily denied, limiting market access.
• Specific limitations. Certain restrictions not directly in the arena goods trade and transit are
being applied as NTMs within EAC and affecting the intra-region trade. Widespread use is made of the procedures and fees for entry of EAC citizens for business purposes into other member states, and the registration of their businesses there. The restrictions also include the official charges for translation of documents to/from French, since Burundi maintains it as the national language while the official language of communication in EAC is English.
B. Product specific NTMs • Technical quality standards and norms and sanitary and phyto-sanitary measures. The
EAC members are starting to apply ‘testing, certification and other conformity assessment’ for technical quality standards and norms in intra-EAC goods trade. The clearances can be periodic, but are mostly by consignment. Most time lost is due to the fact that in national product standard definition and certification, the bureaus of standards operate at very different levels of capacity and ability (with virtually none yet in Burundi) at its laboratories; and in testing and conformity assessment at the border. The EAC harmonized standards are developing very slowly, product by product, and are not necessarily recognized by member agents at the internal borders even when they are in place. The prolonged follow-up often needed - with the shipment stranded at the border - has been ‘allegedly’ used to discourage scope of developing cross-border trade in certain perishable products from time to time. Moreover, the EAC-wide guidelines on import requirements as well as procedures for introducing import restrictions and bans remain to be finalized. Specific cases that have been in the forefront in the recent years cover trade in milk, poultry, beef, maize, etc. Though the recorded cases are few for now, this area of NTMs must be of particular concern since food and animal products are by far the largest group of goods trade within EAC. Where health and safety issues are involved under SPS measures - “including chemical residue limits, disease freedom, specified product treatment” - the certification authority, with variations in the center for testing and other conformity assessment, moves to the respective ministries for agriculture and livestock development as well as veterinary services increasing the number of steps and complication. For both TBT and SPS measures, there is largely no mutual recognition of inspection reports and certificates among members.
viii
Another technical standard impedes intra-EAC trade for the new EAC members for now. The issue of driving on the left side of the road in the rest of EAC is mentioned by Burundian and Rwandan drivers as a NTM, as changing sides as per the national driving rules and retrofitting the imported second-hand trucks makes transit susceptible to accidents. The Ministries of Transport in Rwanda and Burundi are also seeking to apply strict right–hand side vehicle importation rules incompatible with the rest of EAC.
IV. What the Other RECs are Doing
• Learning from other RECs. Generally RECs have been more successful in eliminating
NTMs by using a mix of outlawing certain measures and following the mutual recognition principle for others. The EAC’s preparation of a realistic plan can derive critical lessons from the actual experience of other RECs, in the identification, classification and measurement of NTMs as well as their choice for reduction and removal. The EU and the ASEAN show that this process is very long drawn and resource intensive, requires steadfast commitment throughout to deal with complex political decisions, and tends to be integrally related to overall plans to establish a single internal market in the REC. There are hardly any successful examples of RECs in SSA attempting NTM reduction.
• From the EU. Albeit at a very different level of development, with far stronger REC
administration and much larger availability of resources to execute REC-wide decisions, the EAC could learn from the EU experience in development and application of the principle of mutual recognition in standards that facilitates free intra-EU trade in goods. For example, the intra-EAC trade in beer could learn from the EU recognition that alcoholic beverages can be introduced into any other EU member state when they have been lawfully produced and marketed in one of the member states. This streamlined approach to intra-REC trade relies only on “essential requirements” of alcoholic beverages and provides greater freedom to manufacturers to fulfil those requirements. At present, due to the difficulty in trade, beer and beverage producers in EAC mostly opt for separate production facilities in the larger members.
Second, EAC could learn from impacts of the EU enlargement and the foreign competition from outside that REC on the pace and process of elimination of NTMs and the solutions found. New EU members brought challenges to the integration process and functioning of the internal market, due to their lower level of economic development and new constraining measures on internal trade that stretched the EU monitoring capacities. EU recognized that a failure to establish the internal market quickly and effectively would only exacerbate difficulties encountered by European firms from external competition (by Japanese firms entering European markets in cars, etc).
• From ASEAN. The ongoing process in the ASEAN illustrates to the EAC the possibilities
for developing countries, with limited financial flexibility and weaker administrative capacity. First, like the ASEAN, the EAC has large trading interests outside the REC. Hence, EAC should study how ASEAN’s implementation of the principles of open regionalism – encouraging REC members to adopt and adhere to WTO rules - helps in eliminating NTMs. ASEAN’s sector based approach to NTMs is an excellent example of the possibilities, when the implementation of REC-wide decisions is limited largely to national governments actions and the political complexity posed by sovereign members is large. Second, ASEAN benefited from a product-specific approach for a select number of goods deemed to have strong regional market potential (e.g., tourism, wood-based products). In the case of EAC,
ix
generic NTMs are currently more important than in the ASEAN case, but as noted, there are select products (like milk, day old chicken, beef, etc among food and live animals) where the ASEAN implementation could be relevant.
V. The Way Forward: Some Suggestions
• Prevention of new NTMs. With respect to the monitoring for new NTMs that may be
imposed by member states, the EAC could learn from the EU’s adoption of preventive measures which oblige member states to notify all draft regulations and standards related to technical specifications to be introduced on national territories. In this way, the Commission is able to monitor and prevent the emergence of new national barriers to intra-EU trade. The Commission also maintains a score card on adherence to REC-wide rules including those on NTMs on trade, which can be used to name and shame members into compliance.
• A two-pronged approach for existing NTMs. The prevailing NTMs in EAC are clearly
divided into two groups and are likely to need two distinct approaches in developing implementation plans for monitoring, reduction and removal.
• For generic NTMs. All EAC members are WTO signatories also who are taking significant
unilateral steps towards enhanced participation in that institution. The team recommends that the Council of Ministers consider and agree on the principle that NTMs that are not WTO-consistent in EAC—whether or not they restrict intra-EAC trade in certain products, and irrespective of the political economy—are to be eliminated with immediate effect. WTO consistency requires NTMs to be “transparent,” “non-discriminatory” among the domestic goods flow and intra-EAC/international trade, “scientifically based,” and “with no better alternative.” The preliminary list of NTMs should be investigated for these characteristics. We have seen above that several of the prevailing NTMs can be nontransparent and are mostly discriminatory against other EAC members. This could include interalia the operation of the weighbridges for intra-EAC goods transit, the use of only national clearing agents, the exclusive use of trucks registered and drivers who are citizens in the member state, the imposition of entrance fees on traders from other member states entering with their products, the French translation fee for customs documents, etc.
The generic NTMs in line with the WTO rules still need to be removed, but could be considered on a preferential basis. For ease of follow-through, the EAC members could prioritize those NTM areas for implementation where the Council of Ministers has already taken the EAC-wide policy decision. For those where such a decision from the Council is yet to be reached, the team recommends that the priority for EAC action be determined on the basis of criteria like the overall regulatory objective and/or the intra-EAC trade impact. This would include interalia the application of the axle-load law, the use of EAC-wide bonds and carrier licenses instead of national ones, etc.
• For product specific NTMs. In a few goods, like milk, beef, poultry (including day-old chicks), the EAC may want to develop specific region-wide technical and/or SPS standards after detailed investigations. In choosing the specific product it would be important to consider the regulatory objective and /or intra-EAC trade impact of the NTM. Here the guidance from the ongoing process of deliberations and decisions in the ASEAN countries will be useful. This could be based on harmonization with performance requirements, involving a single set of fully harmonized and detailed provisions. This approach is used for products that could put consumers’ safety at risk and for which performance-oriented
x
legislation is felt needed. Any capacity building initiatives in the overall area of the technical and/or SPS standards for goods should be assessed vis-à-vis clear articulated demand from end-users in the public/private sector, rather than from the national bureaus of standards. Given the fiscal and human capacity constraints that exist in the EAC for now and dependence on implementation of region-wide decisions only by national institutions, it is by no means being suggested that the EAC choose the above course of action for all major goods traded among the five members. For most goods, the “new approach” of the EU could apply to products with similar characteristics and where there is widespread divergence of technical regulations in EAC countries. This streamlined approach would rely only on the “essential requirements” and allow greater freedom for manufacturers on the way to satisfy those requirements. This would significantly reduce the red-tape originating from various standards agencies that mires goods trade in the region in particular and in developing countries in general. Gradually, this approach could provide private firms with a number of choices for attestation methods: self-certification against the essential requirements; generic standards; or using notified bodies for type approval and testing of conformity of type. On the TBT and SPS measures, the WTO guidelines tend to be most relevant for the OECD countries and the EAC is advised to be cautious as not to constrain the potential for growth in the region.
• Capacity to monitor and prioritize. Monitoring is a difficult and resource-intensive exercise, based on regular notification, regular reporting, proper classification, appropriate mutual prioritization for removal of non-transparent, discriminatory NTMs, and prior/ subsequent monitoring. For the new NTMs that may arise as well as the existing generic and product specific NTMs, are the areas where the Secretariat as well as the member states would need to develop sufficient institutional capacity in the EAC. In the member states, such capacity needs to be developed not only in the NMCs, but also in the individual line ministries like the ministry of transport, ministry of agriculture and livestock, etc. The EU’s internal market scoreboard may prove to be a useful instrument for the EAC Secretariat to emulate. For the EAC, such a scoreboard could report the status of the NTMs action plans and the number of infringement proceedings due to new NTMs initiated against member states. These proceedings could be initiated as a consequence of continuing or new application of a NTM by a member state. In this case, the member state is encouraged to quickly remedy the situation, and if it fails to do so it is referred to the EAC court, which can impose a sanction.
• Other factors. It is recognized that in certain cases of locations (like Burundi with Tanzania; Uganda with Kenya) effective bilateral decisions among two members could largely ease the total impact of NTMs for particular members. These could be tried while a five-member consensus being worked on. Second, as the trade links of the EAC members with their external markets are very strong and a significant source of growth for the region, the EAC common market could aim to adopt an open regionalism model like the ASEAN, based on the principle of adherence to WTO rules. Through feasible processes, the EAC could urge its members to adopt the WTO agreements on TBT, SPS, and import licensing procedures as well as develop the related implementation guidelines. Third, large physical investments would go a long way in upgrading the state of EAC’s trade facilitation infrastructure and hence alleviate NTMs associated with these facilities.
• Concrete progress in select areas to build confidence. Among the factors that may slow
down the process of actions on NTMs is the capacity of national institutions – the regulatory institutions, the customs administration, the bureaus of standards. In addition, the flow of information from the EAC and the national governments to private sector firms and the civil
xi
society in EAC needs to be faster, automatic and smooth. Efforts need to be made to address the widespread perception in the private sector that implementing agents in each member state continue to think and act on behalf of the individual countries and not in terms of the EAC. A focus on some key NTMs (both generic and product specific) will be critical to prioritize EAC and national governments efforts in light of scarce institutional capacity and to build confidence in the seriousness of the NTM elimination program notably with the private sector.
1
NTMS ON GOODS TRADE IN THE EAC: SYNTHESIS REPORT
CHAPTER 1. INTRODUCTION
1.1 The treaty for the establishment of the East African Community (EAC) of 1999 set out a vision for the eventual unification of Kenya, Tanzania, and Uganda. The sequence of events laid out comprised the establishment of a customs union, followed by a common market, a monetary union, and eventually a political federation.6
1.2 The first step in this sequence is underway, with the “Protocol for the Establishment of the East African Community (EAC) Customs Union” signed in March 2004 and coming into effect in January 2005 for the three founding members, envisaged to be complete by mid-2009.7 The newest members, Burundi and Rwanda, adopted it in July 2007. In a relatively short time, EAC has moved quickly to eliminate a large proportion of tariffs on intra-EAC trade8 as an integral component to establish a free trade area (FTA) among the founding members.9 The schedule of accession allows commensurate action on tariffs by Burundi and Rwanda to be undertaken until 2010.
I. CONTINUING EFFORTS TOWARD GREATER INTEGRATION IN GOODS TRADE
1.3 Notwithstanding EAC-wide tariff removal, in all member countries several non-tariff measures (NTMs) are still reported to impede the free trade in goods. The private sector in the region also perceives that such NTMs may be becoming more prevalent in the larger members as tariff protection is reduced.
1.4 Within the EAC Protocol, the legal structure for elimination of NTMs in the regional economic community (REC) is provided by Article 13, which stipulates that to establish a full FTA,
• “Except as may be provided for or permitted by this Protocol, each of the Partner States agrees to remove, with immediate effect, all the existing non-tariff barriers to the importation into their respective territories of goods originating in the other Partner States and, thereafter, not to impose any new non-tariff barriers.
6 The five EAC members are currently negotiating the second step, a further Common Market Protocol, for free movement of persons, labor, and services and to ensure the right to establishment and residence of EAC citizens within the Community. This protocol is being negotiated jointly alongside those regarding the establishment of an East African Common Market. Under existing plans, the Protocol is expected to be ratified by June 2009 and implementation will begin in January 2010. The third step—monetary unification—will not be completed for some time, as the introduction of a single currency is not expected until 2011–5, while the establishment of a political federation is envisaged by 2015. 7 Source: East African Community Secretariat, 2004. 8 With the exception of selected lists of sensitive products exported from Kenya to Uganda (443 items), and to Tanzania (880 items). For these a gradual reduction over five years from a 10 percent to 0 percent tariff would allow for the maturity of the firms producing these products in Uganda and Tanzania, respectively. 9 The simple average MFN tariff on overall imports - the unweighted mean of all tariff lines, including import surcharges and other ‘para-tariffs’ i.e. duties and charges - in 1997 and 2007 were, respectively, 41.0 and 12.6 for Burundi; 19.0 and 16.7 for Kenya; 35.0 and 22.7 for Rwanda; 21.8 and 14.1 for Tanzania and 13.2 and 12.9 for Uganda. Source: IMF
2
• The Partner States shall formulate a mechanism for identifying and monitoring the removal of non-tariff barriers.”
1.5 Recently, some preliminary analyses have been undertaken to explore general monitoring options for Kenya, Tanzania and Uganda, the founding members only, with help from private sector lobbies like the East Africa Business Council (EABC), in the context of the overall business environment for private firms in the REC.
1.6 In mid-2007, National Monitoring Committees (NMCs) were inaugurated in all member countries—except Burundi —to adopt a monitoring mechanism when adopted. The NMCs have quarterly reporting responsibilities to the ministries of EAC or trade of the respective nations, and to the EAC’s Sectoral Committee on Trade, Industry, and Investment. To date, however, the determination of a work program for the NMCs has been slow to develop. Significant among the reasons are: scarcity of specific information generated by EAC-wide stocktaking; the EAC requirement for consensus on monitoring mechanisms to be adopted (on a case-by-case/mutual recognition basis); the EAC requirement for consensus on member actions on reduction/removal of NTMs; and dearth of budget resources in member governments to locate and support NMC activities.
1.7 In September 2007, the EAC stated that removal of NTMs is now a priority in its policy program toward deeper trade integration and establishment of the common market in goods. The EAC made a request to the World Bank for analytical and technical assistance on this issue. Subsequent discussions with the Secretariat by the end of 2007 determined that an overall investigation of NTMs in the REC would be most useful for the EAC’s work program, if it led to:
• An improved understanding of the political economy for continued persistence of NTMs over time among the member nations
• An informed selection of the most important NTMs, which if removed could significantly increase intra-region trade, from the list of all NTMs identified
• A practicable implementation plan for the removal of these NTMs by the members.
1.8 There is increasing need for this kind of analysis where REC-wide internal trade liberalization may be allowing considerable reduction/ elimination of tariffs, but such progress is being counterbalanced by use of NTMs in promoting national interests. The EAC’s courage must be appreciated for taking up an extremely difficult issue to tackle on its way forward in the policy reform program for its common market.
1.9 In general, NTMs within each nation and across members of a REC span remarkably different, technically difficult fields. The areas covered, especially in less developed countries (LDCs)— a criterion fulfilled by all but one EAC member—usually have little formal documentation and/or only very unreliable data. Compared to tariff reduction, the analysis and REC-wide policy implications of NTM removal are neither clear nor precise, even for developed countries. This analysis of the NTMs, through which the World Bank is starting to assist the EAC, should be viewed as a useful beginning of a prolonged and arduous process. Much will need to be done if the actionable plans that emerge at the end of this process are to be implemented and have real impact on goods trade among EAC members (see chapter 2 and appendix A1 for a summary of trade flows of EAC members; appendix A2 describes its trade routes).
3
Concept of the current NTM work and guidance received
1.10 Review of the concept note for the overall NTM in EAC study, both in the Bank and in the EAC,10 over January–February 2008 endorsed a plan to divide the proposed work into two phases:
• Phase 1.11 Identification and choice leading to important NTMs that have high impact on intra-region trade among all NTMs identified in the member country stocktaking.
• Phase 2. Choice and implementation, to follow, to finalize choice of the important NTMs and prepare a practicable implementation plan for the removal of these NTMs by the members.
1.11 It was clearly recognized that identification, understanding and region-wide discussion of the political economy for the continued persistence of various NTMs in EAC will not be easy, and will closely influence the decisions taken in each phase. The political/economic environment will be clearly identified in the phase 1 stocktaking and continue to be critical through the implementation plan preparations in phase 2. EAC expects the work in both phases to be critical for member country NTM deliberations, and for practical actions to make Art. 13 of the EAC Protocol fully operational. This would also anchor the initial work program of the established NMCs.
1.12 Phase 1 aims to clarify what NTM classification methods are available and which inventory of NTM instruments would be more appropriate for EAC; assess existing/ongoing work in EAC and identify its limitations; learn from the experience of other RECs, such as the EU and ASEAN; provide/update the list of NTMs for all five members using both local know-how and international sources; and initiate, to the extent possible, the selection of important NTMs that constrain intra-EAC trade and analyze the reasons for their existence.
1.13 Focus and coverage. The task team was cautioned that NTMs tend to be very broad and hence the key challenge would be to focus the issues and the coverage in consultation with the EAC Secretariat. The Secretariat agreed that barriers in a member’s domestic market can be extensive and most often covered by reform programs on the domestic business environment, capacity building, and overall trade facilitation. It is best to get a sense of the national and EAC-wide background of the environment for private investment from such programs, and then focus on NTM identification and analysis for trade in goods across the internal borders in EAC.12 Trade in services and factor (including labor) mobility is to be considered separately, at a later date.
1.14 Free movement of goods and its potential growth within EAC is considered critical to develop a fully functioning FTA. The investigation was guided to provide an in-depth view of the actual operation, key players, and impact of specific NTMs identified. Insight on political-
10 By the EAC Secretariat and member country delegations in Arusha Tanzania. Participants included the Director General-Customs and Trade, Director-Trade, and other staff of EAC Secretariat, as well as member delegations from Burundi, Kenya, and Tanzania under the invited chairmanship—as per EAC protocol—of Dep. Permanent Secretary, Ministry of Industries, Trade and Marketing, Government of Tanzania. Feedback and endorsement from the delegations of Uganda and Rwanda were obtained later, in the respective country capitals: Uganda in February 18–19 and Rwanda in March 2–5, 2008. 11 Phase 1 preparations from October 2007 –to June 2008 were undertaken with assistance from the World Bank and Government of the Netherlands (under the Bank-Netherlands Partnership Program, BNPP). 12 The general business environment for the private sector in member countries and domestic goods in each will be considered only to the extent that they provide more information on NTMs on traded goods.
4
economic reasons for persistence of specific NTMs is more useful for the EAC, rather than a presentation of broad aggregates. Hence, the choice of methodology is to emphasize practicality and usefulness toward EAC deliberations and future actions, in preference to theoretical rigor. The strict categorization of the NTMs into predefined groups, according to definitions by the United Nations Conference on Trade and Development (UNCTAD) or the World Trade Organization (WTO), is of limited use. It may also be necessary for the analysis, in phase 2, to take stock of each member country’s goods trade bilaterally, since specific factors such as the historical market links, the location of industry, and the use of specific ports are important. The analysis is particularly important for Burundi and Rwanda, whose steps to integrate into the EAC common market are less analyzed and defined.
1.15 Hence, to give a realistic overall picture of the binding constraints on exports and imports in the EAC, the phase 1 stocktaking has been kept somewhat broader than the suggested focus of “only the export market” and “only specific products within EAC.”13 Initial investigations across export markets revealed that, on the whole, current NTMs in EAC are more generic in their coverage across exports, imports, and goods transited through specific member countries. Moreover, the NTMs apply across most product groups, minus a few products.
1.16 The reviews recommended that the priority areas start to be identified in member government discussions of this stocktaking study, and be subsequently endorsed by the EAC. The choice and use of methodology is expected to evolve as the actual cases are documented, rather than a priori. Where possible, the impact measurement should include estimates of additional cost of product/time delays due to the constraint. In phase 1, however, it is most important for the analysis to be very pragmatic. Most firms in EAC are small in size with limited capacity to explore the full EAC market, let alone markets beyond the REC. In addition, the actual period of operation of intra-EAC zero/low tariffs has been short. For firms engaged in expanding their markets beyond national borders, most of the impact of NTM could be detrimental. Hence, the absence of formal trade in the face of potential scope of EAC-wide internal market may be an important indicator of impact.
1.17 Structured member country work program. The current stocktaking report prepared in phase 1on the operation of NTMs on goods trade in the EAC is expected to be presented to the EAC Secretariat in September 2008. The report brings together learning from all five partner countries and emphasizes local know-how, involving the member governments, private sector, local consultants, and Bank country economists/trade specialists. The EAC member governments provided in-country support and guidance to anchor the findings within the national policy reform agenda. To the extent applicable for EAC, the report also brings in the experience of other RECs on monitoring, reducing, and removing NTMs.
1.18 In the light of the above guidance, discussions on the stocktaking study will facilitate consensus building in EAC Secretariat and among member countries on the concepts, the objective, and the priorities in EAC’s NTM reduction and removal. The EAC Secretariat has cleared the report and its discussion with the member states. It expects to present the study to the member delegations for consideration in Arusha (at a EAC meeting in 2009), as was done at concept development. Most member governments have requested in-country discussions of the preliminary findings and these are proceeding (as of January 2009). Feedback and guidance, through the Secretariat and direct member-country deliberations, will determine the choice and
13 The task team is not reporting (yet, as of September 2008) on the NTM discussion in the EAC Trade Committee Report (February 2008), which it expects to receive from the EAC Secretariat.
5
way forward in targeting specific NTMs in phase 2 for preparation of implementation plans for monitoring, reducing, and eliminating those NTMs.
1.19 Phase 2 is expected to proceed in three steps. First, a deeper analysis will be undertaken of a few complex NTMs and their supporting political economy. The following methodology could be taken on board (after EAC priorities are identified). Exporter firm surveys in each member country could be used to add to limited available data on NTMs and assess the main constraints. If EAC so choose, these surveys could be product area-based, focusing on the narrow products groups where EAC wants to concentrate first. In addition, member governments could be asked to report to the Secretariat the national regulations that might have an impact on trade (a WTO requirement, more implementable within a REC), with the specific justifications for existing NTMs (such as those related to public health and safety). Based on these two datasets, the NTMs could be categorized—by the Secretariat’s decision—on whether they are transparent, scientifically justified, and have “no better alternatives,” and subsequently identified for reduction/removal. The Bank-donor task team would provide analysis and capacity building assistance as needed. Second, an action plan will be developed to eliminate the critical NTMs in all five member nations as part of EAC’s common trade policy. Third, an institutional mechanism will be developed for dissemination at the member nation and regional levels, to build consensus on action among the key stakeholders. 14
II. EAC’S WORKING DEFINITION OF NTMS
1.20 The EAC has adopted its own definition of NTMs, aimed at identifying them and monitoring their elimination. The definition uses the UNCTAD and WTO guidelines related to identification of obstacles that have a negative impact on trade (see appendixes A3 and A4, respectively), since there is no single internationally accepted definition encompassing the diverse measures covered.
1.21 The EAC recognizes NTMs as “quantitative restrictions and specific limitations that act as obstacles to trade,” that may be embedded in laws, regulations, practices, and requirements other than tariffs. These include non-tariff charges, government participation in trade, restrictive trade practices, and policies; customs and administrative procedures, and practices; technical barriers to trade (TBT); sanitary and phyto-sanitary measures (SPS); distribution constraints, and other specific measures. The definition recognizes that government regulations and measures for various legitimate reasons can end up adding unnecessary costs or inhibiting intra-EAC trade. These may include regulations applied at the national and local level to:
• Protect domestic industries and consumers • Safeguard against fiscal revenue loss • Safeguard health, safety, and security of human beings, animals, and plants • Safeguard the environment and • Safeguard national security.
14 Phase 2 is expected to start in early 2009, with deliberations in the EAC members on the stocktaking report. Use of Bank staff and international subject authorities is expected, along with the continued involvement of local consultants.
6
III. WORK ALREADY INITIATED BY EABC/EAC AND OTHERS
1.22 A discussion by the EAC Council of Ministers on the EAC-wide NTMs and course of action to be pursued in analyzing and reducing /removing them is summarized in the EAC Trade Committee Report (February 2008).15 [Add summary here, when available; September 2008]
1.23 At the national level and/or for intra-region comparison, stocktaking of the prevailing NTMs within EAC has been far from comprehensive. In addition, other measures—identified as NTMs in the member nation—can significantly raise costs; these include national shortfalls in physical infrastructure and/or behind-the-border supply constraints that affect the overall business environment for private enterprises and are not specific to regional or international trade. These may be critical for overall private sector led growth, but need to be (and often are) addressed in an EAC forum beyond that for the flow of goods trade.
1.24 Two surveys commissioned by the East Africa Business Council (EABC) since 2004 prepare some ground for elimination of the NTMs through preparation of a list of NTMs in the three founding members of EAC. The surveys were conducted largely on firms active in cross border business transactions in Kenya, Tanzania, and Uganda. These business investment climate (BIC) survey results indicate that barriers are largely located in customs administration and procedures, immigration, business registration, and the inspection of imports and goods distribution (including police road blocks, operation of weighbridges, and quality standards certification). In 2005 the EABC, together with the EAC Secretariat, proposed an institutional mechanism to monitor the elimination of the identified NTMs.
1.25 The main weaknesses of the existing work are listed below, along with a discussion of how to address these.
• A very broad definition is used to identify the NTMs, resulting in an extremely long list of NTMs in three founding members only. This would result in a very complex program to eliminate those NTMs. Priorities must be set. A large number of the identified NTMs are administrative barriers to private business and investment, but not core NTMs. Moreover, the analysis is confined to the three founding members. The current stocktaking report includes the two new members in the exercise as integral part of the EAC. It defines the critical areas of NTMs in the context of the EAC based on international experience. At variance with the expectations at the concept review, prioritization to date has not been based on the impact of the particular NTM on specific goods traded within the EAC, but rather on what is considered to be the most binding constraints to trade, as per the private sector interviews, and the ease of dismantling it. Overall, EAC-wide NTMs do not seem to have a product- specific focus within formal trade.
• The BIC survey -based inventory of the NTMs in EAC uses only interviews with private
companies, and does not appear to have engagement/approval of the member governments or the EAC. Since the barrier perceived by an exporting firm in one member is in most cases the regulation imposed by the government of another member or non-member, such a method for collection of information on NTMs—by reverse notification16 by firms—may not be the most effective in building up ownership of subsequent actions. Similar information can also be
15 The EAC member delegations instructed that the Secretariat (Directorate of Trade), at the February 2008 concept review, to make the internal Trade Committee Report available to the task team following due clearances, for the phase 1 stocktaking. This is awaited. 16 With a built-in bias to overstate restrictiveness.
7
provided by governments on potentially trade-hindering laws and regulations imposed by them—that is, through notification.17 In the absence of a strong supranational body in the EAC, the main implementers of policy and policy reform will remain the member governments. Commitment of the member governments to eliminate the NTMs cannot be built up and secured unless there is recognition, clear prioritization, and consistency of reasons. The current report involves and explains the reasons to the key stakeholders, in particular: the governments, the private sector, and the EAC Secretariat.18
• Generally RECs can and have been more ambitious and more successful in eliminating
NTMs, using a mix of outlawing certain measures and following the mutual recognition principle for others. It must be noted that those successful have done so over an extended time span and have been at significantly higher levels of economic prosperity than the EAC. As a customs union, the EAC has rightly targeted elimination of the NTMs in the context of its evolving common trade policy. This means the main decisions initiating elimination of NTMs need to be made by consensus at the EAC Council of Ministers, requiring prior consensus building among sovereign member nations on the list of NTMs to be eliminated, the timetable, and other key considerations. International experience shows that a way forward through imposition of detailed obligations regarding elimination of NTMs is difficult, due to the diverse objectives of sovereign states. Less intrusive ways to reduce the cost impact of NTMs have been found through movement toward WTO principles of transparency and nondiscrimination in application of national regulatory measures. The existing work in EAC did not take account of this important dimension of elimination of the NTMs. The current report makes the distinction.
• The monitoring mechanism suggested by the existing work is a complex recording and
reporting system rather than an implementation plan. The current program will prepare a time-bound implementation plan in phase 2.
1.26 In recent years, EAC members have analyzed their trade policy and prospects, and prepared a framework for trade facilitation and mainstreaming in their development agenda, through the diagnostic trade integration studies (DTIS) under the multi-donor Integrated Framework (IF) for Trade. Since most of the policy reform in the EAC members to date has focused on explicit trade taxes, and significant traditional export markets remain beyond the EAC common external borders, the DTIS have focused on these two topics.
1.27 Nonetheless, a few members have considered the prevailing NTMs in varying degree of depth and rigor. The DTIS for Tanzania (2005) and Uganda (2006) have taken a deeper look at prevailing customs systems and procedures.19 In the agriculture/fishery sector, they have also examined the operation of taxes (especially local), the role of crop boards (in Tanzania), and the application of quality and safety standards. They have traced EAC-wide developments on these. The two DTIS also ascertain whether in recent years these measures have enhanced competitiveness, or added associated costs to trade. The Kenya DTIS (2007) (and follow-up
17 With a built-in bias to understate potentially contentious laws and regulations. 18 In customs administration and procedures, there is already wide recognition within EAC and its members of the need for improvement and related capacity development. The EAC received assistance for its founding members in 2003 for three years and similar support is expected in 2009 for Rwanda and Burundi through the Bank Institutional Development Funds (IDF). Also projects on trade facilitation from the Bank and African Development Bank (AfDB) are already implementing plans adopted for customs improvement in various member nations. 19 Some general behind-the-border issues constraining trade prospects are the transport infrastructure and the availability and mix of labor skills.
8
Bank report in 2007) (World Bank 2007c) has a somewhat similar overall structure, but is less informative on NTMs due to its focus on potential export diversification. The two reports, however, do point to the potential importance of textiles, clothing, and footwear in Kenya’s regional exports, demarcating another area for investigation on NTMs. The DTIS for Burundi (2003) considers the legal status of NTMs but does not focus on the actual operation on the ground, if any. The current study brings on board the DTIS learning for the members to the extent that they shed light on existence and operation of NTMs. The DTIS for Rwanda (2005) does not consider prevailing NTMs, although it analyzes the overall business environment and the steps toward application of quality standards.
1.28 For NTMs recognized at the national level by EAC members, notifications and reverse notifications to the international trade institutions are another source of information. The UNCTAD’s Trade Analysis Information System (TRAINS) database reports operation of the NTMs.20 As part of their membership, the WTO Secretariat and the respective governments of EAC members have undertaken Trade Policy Reviews (TPRs) to assess the country’s process of liberalizing trade (within the overall strategic framework of enhancing private sector-led economic growth and structural transformation) based on a conducive environment for trade and investment provided by the government. These TPRs provide information on NTMs recognized at the national level in broader categories (see classification in appendix A4). These two sources provide a foundation for embarking on the stocktaking. However, they are not current or comprehensive in coverage of all EAC members. In general, the international databases suffer from a lag in reporting prevalent national measures. More importantly, arbitrary and/or ad hoc national measures and local practices that may constitute NTMs are underreported, if at all. Most do not give indications of the restrictiveness of a particular NTM.
1.29 Few, if any, of the above sources report on the reasons and/or the environment in EAC member nations that sustains the operation of specific NTMs. Here local knowledge is critical in informing the current stocktaking report.
20 These are available, up to June 2001, only for Kenya and Tanzania (see www.unctad.org/trains).
9
CHAPTER 2. PROFILE OF THE EAC
I. THE EAC’S ECONOMIC FEATURES
A. Small economic entity
2.1 The EAC is a small, relatively impoverished economic entity compared to other regional economic communities (RECs) that have attempted the identification and elimination of NTMs, such as the European Union (EU) and Association of Southeast Asian Nations (ASEAN). It has a total land size of 1,702,000 sq. km In 2006 it had a combined GDP of USD38,960 million at current prices and market size represented by a population of 123 million. All EAC members, except Kenya, are categorized as LDCs according to the low income, human resource weakness, and economic vulnerability criteria of the Economic and Social Council of the United Nations. For further details, see the profiles of each member nation in appendix group B.
B. Variation across members
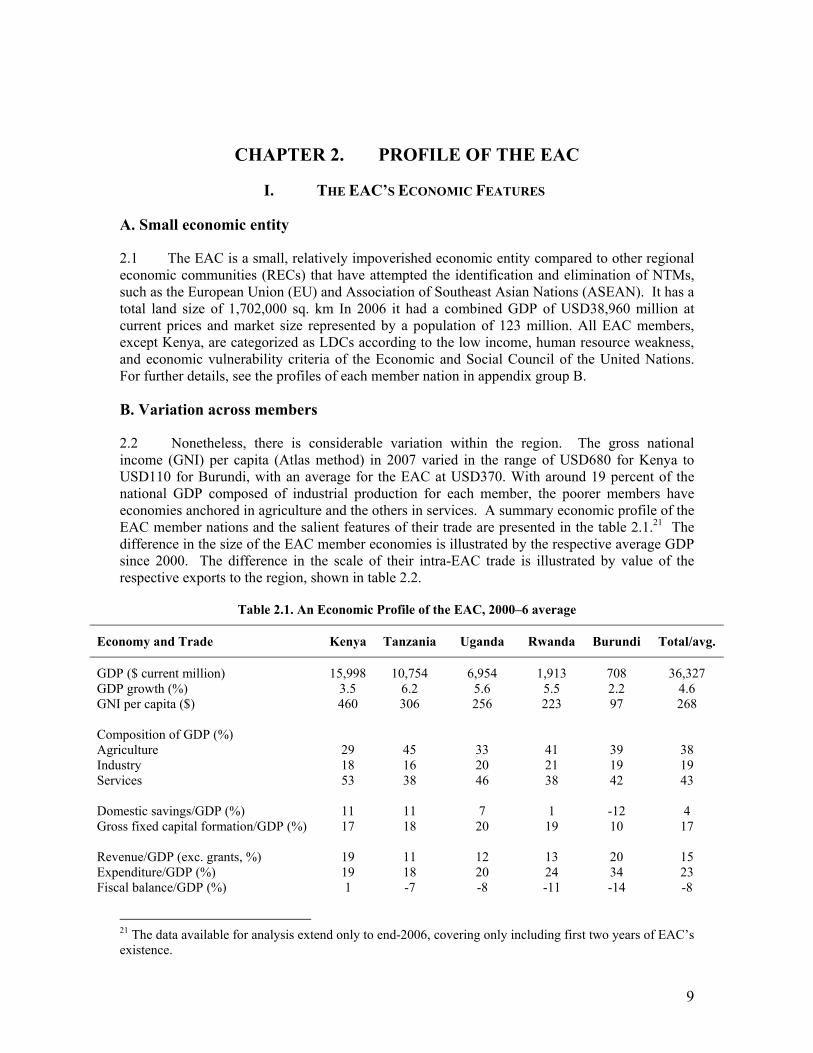
2.2 Nonetheless, there is considerable variation within the region. The gross national income (GNI) per capita (Atlas method) in 2007 varied in the range of USD680 for Kenya to USD110 for Burundi, with an average for the EAC at USD370. With around 19 percent of the national GDP composed of industrial production for each member, the poorer members have economies anchored in agriculture and the others in services. A summary economic profile of the EAC member nations and the salient features of their trade are presented in the table 2.1.21 The difference in the size of the EAC member economies is illustrated by the respective average GDP since 2000. The difference in the scale of their intra-EAC trade is illustrated by value of the respective exports to the region, shown in table 2.2.
Table 2.1. An Economic Profile of the EAC, 2000–6 average
Economy and Trade Kenya Tanzania Uganda Rwanda Burundi Total/avg.
GDP ($ current million) 15,998 10,754 6,954 1,913 708 36,327 GDP growth (%) 3.5 6.2 5.6 5.5 2.2 4.6 GNI per capita ($) 460 306 256 223 97 268 Composition of GDP (%) Agriculture 29 45 33 41 39 38 Industry 18 16 20 21 19 19 Services 53 38 46 38 42 43 Domestic savings/GDP (%) 11 11 7 1 -12 4 Gross fixed capital formation/GDP (%) 17 18 20 19 10 17 Revenue/GDP (exc. grants, %) 19 11 12 13 20 15 Expenditure/GDP (%) 19 18 20 24 34 23 Fiscal balance/GDP (%) 1 -7 -8 -11 -14 -8
21 The data available for analysis extend only to end-2006, covering only including first two years of EAC’s existence.
10
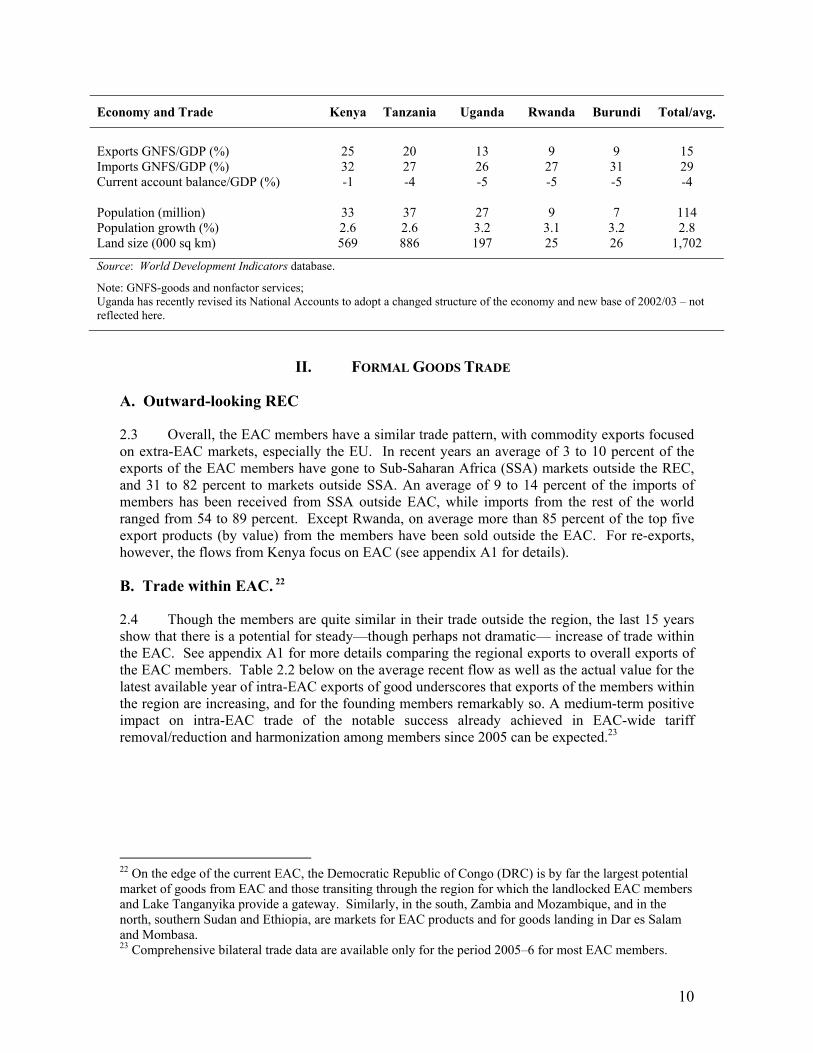
Economy and Trade Kenya Tanzania Uganda Rwanda Burundi Total/avg.
Exports GNFS/GDP (%) 25 20 13 9 9 15 Imports GNFS/GDP (%) 32 27 26 27 31 29 Current account balance/GDP (%) -1 -4 -5 -5 -5 -4 Population (million) 33 37 27 9 7 114 Population growth (%) 2.6 2.6 3.2 3.1 3.2 2.8 Land size (000 sq km) 569 886 197 25 26 1,702
Source: World Development Indicators database.
Note: GNFS-goods and nonfactor services; Uganda has recently revised its National Accounts to adopt a changed structure of the economy and new base of 2002/03 – not reflected here.
II. FORMAL GOODS TRADE
A. Outward-looking REC
2.3 Overall, the EAC members have a similar trade pattern, with commodity exports focused on extra-EAC markets, especially the EU. In recent years an average of 3 to 10 percent of the exports of the EAC members have gone to Sub-Saharan Africa (SSA) markets outside the REC, and 31 to 82 percent to markets outside SSA. An average of 9 to 14 percent of the imports of members has been received from SSA outside EAC, while imports from the rest of the world ranged from 54 to 89 percent. Except Rwanda, on average more than 85 percent of the top five export products (by value) from the members have been sold outside the EAC. For re-exports, however, the flows from Kenya focus on EAC (see appendix A1 for details).
B. Trade within EAC. 22
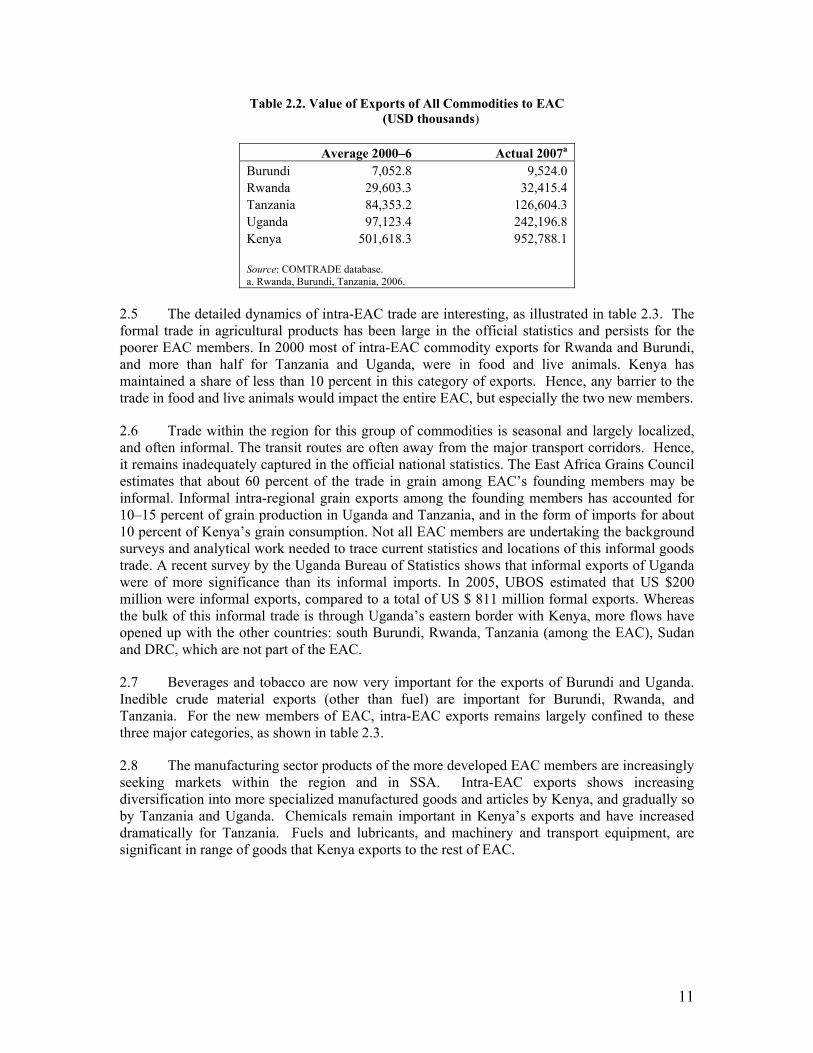
2.4 Though the members are quite similar in their trade outside the region, the last 15 years show that there is a potential for steady—though perhaps not dramatic— increase of trade within the EAC. See appendix A1 for more details comparing the regional exports to overall exports of the EAC members. Table 2.2 below on the average recent flow as well as the actual value for the latest available year of intra-EAC exports of good underscores that exports of the members within the region are increasing, and for the founding members remarkably so. A medium-term positive impact on intra-EAC trade of the notable success already achieved in EAC-wide tariff removal/reduction and harmonization among members since 2005 can be expected.23
22 On the edge of the current EAC, the Democratic Republic of Congo (DRC) is by far the largest potential market of goods from EAC and those transiting through the region for which the landlocked EAC members and Lake Tanganyika provide a gateway. Similarly, in the south, Zambia and Mozambique, and in the north, southern Sudan and Ethiopia, are markets for EAC products and for goods landing in Dar es Salam and Mombasa. 23 Comprehensive bilateral trade data are available only for the period 2005–6 for most EAC members.
11
Table 2.2. Value of Exports of All Commodities to EAC (USD thousands)
Average 2000–6 Actual 2007a Burundi 7,052.8 9,524.0 Rwanda 29,603.3 32,415.4 Tanzania 84,353.2 126,604.3 Uganda 97,123.4 242,196.8 Kenya 501,618.3 952,788.1 Source: COMTRADE database. a. Rwanda, Burundi, Tanzania, 2006.
2.5 The detailed dynamics of intra-EAC trade are interesting, as illustrated in table 2.3. The formal trade in agricultural products has been large in the official statistics and persists for the poorer EAC members. In 2000 most of intra-EAC commodity exports for Rwanda and Burundi, and more than half for Tanzania and Uganda, were in food and live animals. Kenya has maintained a share of less than 10 percent in this category of exports. Hence, any barrier to the trade in food and live animals would impact the entire EAC, but especially the two new members.
2.6 Trade within the region for this group of commodities is seasonal and largely localized, and often informal. The transit routes are often away from the major transport corridors. Hence, it remains inadequately captured in the official national statistics. The East Africa Grains Council estimates that about 60 percent of the trade in grain among EAC’s founding members may be informal. Informal intra-regional grain exports among the founding members has accounted for 10–15 percent of grain production in Uganda and Tanzania, and in the form of imports for about 10 percent of Kenya’s grain consumption. Not all EAC members are undertaking the background surveys and analytical work needed to trace current statistics and locations of this informal goods trade. A recent survey by the Uganda Bureau of Statistics shows that informal exports of Uganda were of more significance than its informal imports. In 2005, UBOS estimated that US $200 million were informal exports, compared to a total of US $ 811 million formal exports. Whereas the bulk of this informal trade is through Uganda’s eastern border with Kenya, more flows have opened up with the other countries: south Burundi, Rwanda, Tanzania (among the EAC), Sudan and DRC, which are not part of the EAC.
2.7 Beverages and tobacco are now very important for the exports of Burundi and Uganda. Inedible crude material exports (other than fuel) are important for Burundi, Rwanda, and Tanzania. For the new members of EAC, intra-EAC exports remains largely confined to these three major categories, as shown in table 2.3.
2.8 The manufacturing sector products of the more developed EAC members are increasingly seeking markets within the region and in SSA. Intra-EAC exports shows increasing diversification into more specialized manufactured goods and articles by Kenya, and gradually so by Tanzania and Uganda. Chemicals remain important in Kenya’s exports and have increased dramatically for Tanzania. Fuels and lubricants, and machinery and transport equipment, are significant in range of goods that Kenya exports to the rest of EAC.
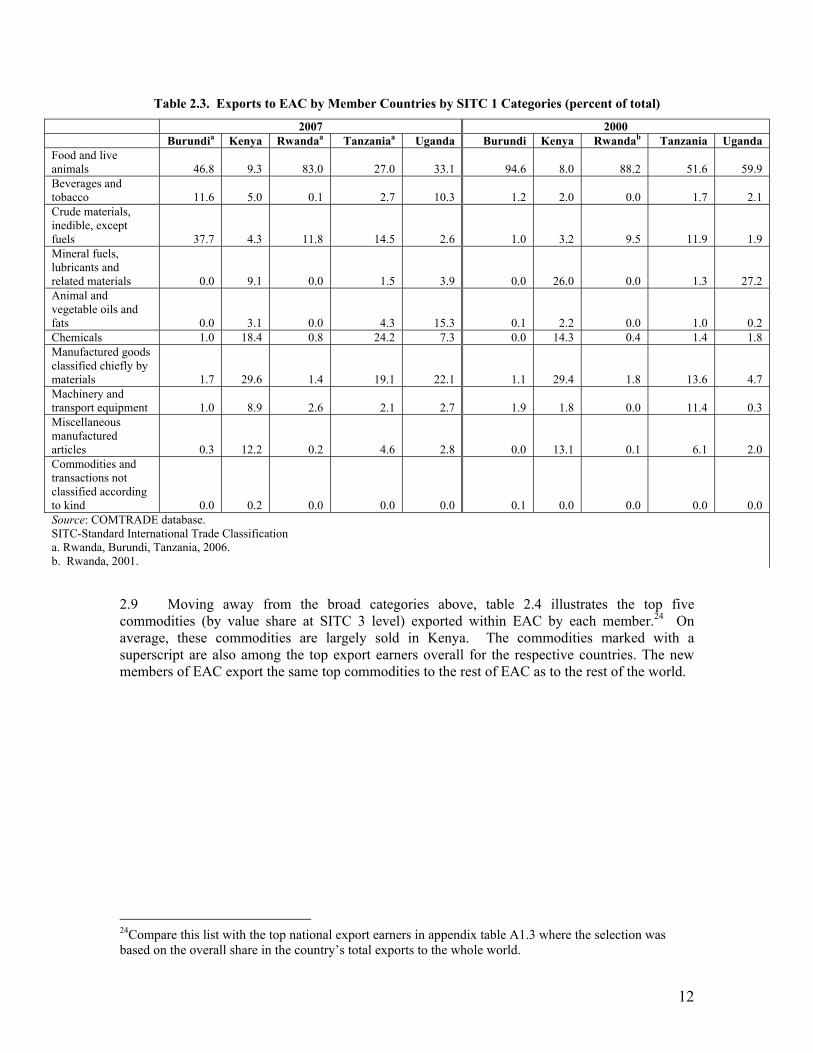
12
Table 2.3. Exports to EAC by Member Countries by SITC 1 Categories (percent of total)
2007 2000 Burundia Kenya Rwandaa Tanzaniaa Uganda Burundi Kenya Rwandab Tanzania Uganda
Food and live animals 46.8 9.3 83.0 27.0 33.1 94.6 8.0 88.2 51.6 59.9 Beverages and tobacco 11.6 5.0 0.1 2.7 10.3 1.2 2.0 0.0 1.7 2.1 Crude materials, inedible, except fuels 37.7 4.3 11.8 14.5 2.6 1.0 3.2 9.5 11.9 1.9 Mineral fuels, lubricants and related materials 0.0 9.1 0.0 1.5 3.9 0.0 26.0 0.0 1.3 27.2 Animal and vegetable oils and fats 0.0 3.1 0.0 4.3 15.3 0.1 2.2 0.0 1.0 0.2 Chemicals 1.0 18.4 0.8 24.2 7.3 0.0 14.3 0.4 1.4 1.8 Manufactured goods classified chiefly by materials 1.7 29.6 1.4 19.1 22.1 1.1 29.4 1.8 13.6 4.7 Machinery and transport equipment 1.0 8.9 2.6 2.1 2.7 1.9 1.8 0.0 11.4 0.3 Miscellaneous manufactured articles 0.3 12.2 0.2 4.6 2.8 0.0 13.1 0.1 6.1 2.0 Commodities and transactions not classified according to kind 0.0 0.2 0.0 0.0 0.0 0.1 0.0 0.0 0.0 0.0 Source: COMTRADE database. SITC-Standard International Trade Classification a. Rwanda, Burundi, Tanzania, 2006. b. Rwanda, 2001.
2.9 Moving away from the broad categories above, table 2.4 illustrates the top five commodities (by value share at SITC 3 level) exported within EAC by each member.24 On average, these commodities are largely sold in Kenya. The commodities marked with a superscript are also among the top export earners overall for the respective countries. The new members of EAC export the same top commodities to the rest of EAC as to the rest of the world.
24Compare this list with the top national export earners in appendix table A1.3 where the selection was based on the overall share in the country’s total exports to the whole world.
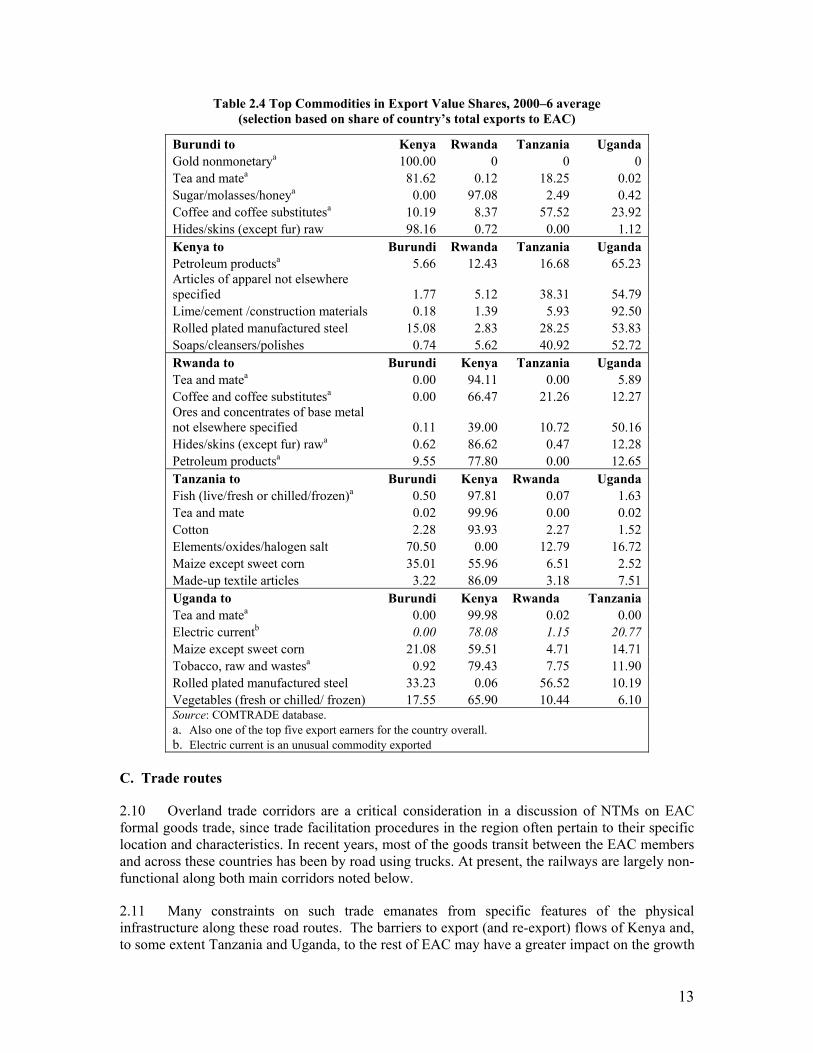
13
Table 2.4 Top Commodities in Export Value Shares, 2000–6 average (selection based on share of country’s total exports to EAC)
Burundi to Kenya Rwanda Tanzania Uganda Gold nonmonetarya 100.00 0 0 0 Tea and matea 81.62 0.12 18.25 0.02 Sugar/molasses/honeya 0.00 97.08 2.49 0.42 Coffee and coffee substitutesa 10.19 8.37 57.52 23.92 Hides/skins (except fur) raw 98.16 0.72 0.00 1.12 Kenya to Burundi Rwanda Tanzania Uganda Petroleum productsa 5.66 12.43 16.68 65.23 Articles of apparel not elsewhere specified 1.77 5.12 38.31 54.79 Lime/cement /construction materials 0.18 1.39 5.93 92.50 Rolled plated manufactured steel 15.08 2.83 28.25 53.83 Soaps/cleansers/polishes 0.74 5.62 40.92 52.72 Rwanda to Burundi Kenya Tanzania Uganda Tea and matea 0.00 94.11 0.00 5.89 Coffee and coffee substitutesa 0.00 66.47 21.26 12.27 Ores and concentrates of base metal not elsewhere specified 0.11 39.00 10.72 50.16 Hides/skins (except fur) rawa 0.62 86.62 0.47 12.28 Petroleum productsa 9.55 77.80 0.00 12.65 Tanzania to Burundi Kenya Rwanda Uganda Fish (live/fresh or chilled/frozen)a 0.50 97.81 0.07 1.63 Tea and mate 0.02 99.96 0.00 0.02 Cotton 2.28 93.93 2.27 1.52 Elements/oxides/halogen salt 70.50 0.00 12.79 16.72 Maize except sweet corn 35.01 55.96 6.51 2.52 Made-up textile articles 3.22 86.09 3.18 7.51 Uganda to Burundi Kenya Rwanda Tanzania Tea and matea 0.00 99.98 0.02 0.00 Electric currentb 0.00 78.08 1.15 20.77 Maize except sweet corn 21.08 59.51 4.71 14.71 Tobacco, raw and wastesa 0.92 79.43 7.75 11.90 Rolled plated manufactured steel 33.23 0.06 56.52 10.19 Vegetables (fresh or chilled/ frozen) 17.55 65.90 10.44 6.10 Source: COMTRADE database. a. Also one of the top five export earners for the country overall. b. Electric current is an unusual commodity exported
C. Trade routes
2.10 Overland trade corridors are a critical consideration in a discussion of NTMs on EAC formal goods trade, since trade facilitation procedures in the region often pertain to their specific location and characteristics. In recent years, most of the goods transit between the EAC members and across these countries has been by road using trucks. At present, the railways are largely non-functional along both main corridors noted below.
2.11 Many constraints on such trade emanates from specific features of the physical infrastructure along these road routes. The barriers to export (and re-export) flows of Kenya and, to some extent Tanzania and Uganda, to the rest of EAC may have a greater impact on the growth
14
potential of intra-EAC trade because of their in-country location of great lengths of the transportation corridors, as well as evolving composition of their formal trade. The same considerations apply to goods transiting across EAC members to various destinations in EAC and beyond. For this trade, the location and the characteristics of the port operations at Mombasa and Dar es Salam is also critical.
There are three main routes:
2.12 The Northern Corridor for trade, starting from the port of Mombasa to the landlocked EAC members Uganda, Rwanda, and Burundi, and northeastern Tanzania. This includes the link between Mbarara/ Kabale in Uganda, onward through Kigali and Butare in Rwanda, to Bujumbura in Burundi that runs north-south. This corridor traverses several countries, even though the longest distances are within Kenya, and consists of roads and rail networks, a petroleum pipeline, and lake transport through Lake Victoria to the extent it is currently operating.
2.13 The Central Corridor for trade, starting from the port of Dar es Salam to the landlocked EAC members Burundi, Rwanda, and southern Uganda. This corridor through Tanzania consists of roads and rail network, and lake transport through Lake Tanganyika to the extent that it is currently operating.
2.14 A north-south link between the Northern and Central Corridor for trade through the Nairobi-Namanga-Arusha road route, especially important for central Tanzania and the countries bordering the EAC to the north and the south.
2.15 The routes are illustrated in map A and the physical details are described in appendix A2. While this report does not focus on the state of the physical transport infrastructure in EAC, it clearly is a complementary priority.
15
CHAPTER 3. METHODOLOGY TO ORGANIZE FINDINGS
I. A PATH OF OPEN REGIONALISM
3.1 All EAC members have significant shares of their overall goods trade destined for/originating from countries beyond the region. As members of the World Trade Organization (WTO), they are bound to make progress toward their multilateral obligations in international trade, including intra-EAC trade. Hence, the most appropriate methodology for organizing findings on the prevailing NTMs that impede the current goods trade is the WTO consistency of these measures. To date, very few NTMs in EAC have been formally notified and verified by the members. In addition, a notification or knowledge of existence usually does not include the NTM administration itself, making the transparency incomplete. If any NTM persists in the EAC member countries, WTO consistency requires that these NTMs be “transparent,” “non-discriminatory” among the domestic goods flow and intra-regional/international trade, “scientifically based,” and “with no better alternative.”25
II. A RANKING BY THE EASE OF ACTION FOR REDUCTION/REMOVAL
3.2 Figure 3.1 illustrates one way to organize the NTMs that exist in the EAC. NTMs identified in quadrant A and B of the figure may well be relatively noncontroversial for EAC-wide consensus building for removal. Given capacity constraints in the regional economic community (REC) and its member governments, EAC may want to target action on these first quadrants. In contrast, far greater trade enhancement may be expected out of targeting one or two NTMs identified in quadrant C, even though significant time and effort would be needed to devise, build consensus around, and implement a plan for their removal.
3.3 The EAC may also leverage the EAC-wide decisions already taken in this area. The NTMs for which the EAC has already taken the political decisions for removal or harmonization are likely to be located in quadrants A or B in terms of pending implementation. The intra-EAC trade would benefit more from EAC’s prioritizing those NTMs located in quadrant B during the preparation of action plans for implementation of reduction/removal.
25Article XXIV of GATT on non-discriminatory trade practices; Article III of GATT on transparency of trade practices. WTO: http://www.wto.org.
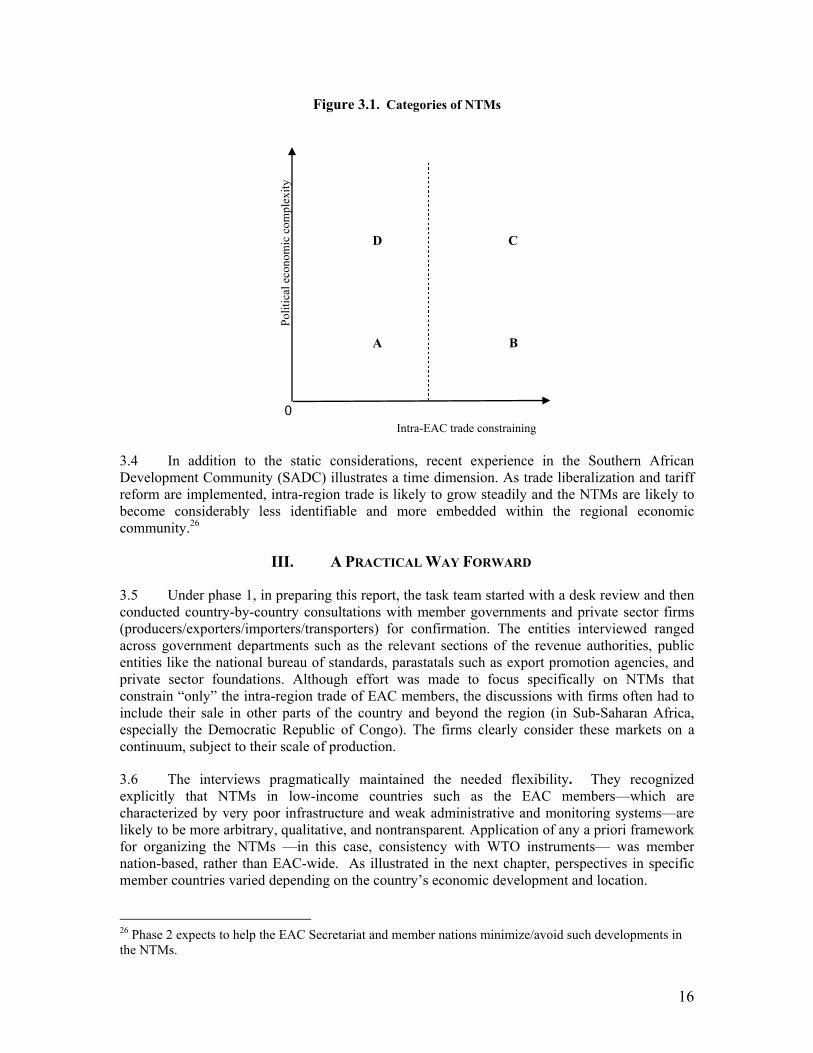
16
Figure 3.1. Categories of NTMs
D C
A B
Polit
ical
eco
nom
ic c
ompl
exity
0 Intra-EAC trade constraining
3.4 In addition to the static considerations, recent experience in the Southern African Development Community (SADC) illustrates a time dimension. As trade liberalization and tariff reform are implemented, intra-region trade is likely to grow steadily and the NTMs are likely to become considerably less identifiable and more embedded within the regional economic community.26
III. A PRACTICAL WAY FORWARD
3.5 Under phase 1, in preparing this report, the task team started with a desk review and then conducted country-by-country consultations with member governments and private sector firms (producers/exporters/importers/transporters) for confirmation. The entities interviewed ranged across government departments such as the relevant sections of the revenue authorities, public entities like the national bureau of standards, parastatals such as export promotion agencies, and private sector foundations. Although effort was made to focus specifically on NTMs that constrain “only” the intra-region trade of EAC members, the discussions with firms often had to include their sale in other parts of the country and beyond the region (in Sub-Saharan Africa, especially the Democratic Republic of Congo). The firms clearly consider these markets on a continuum, subject to their scale of production.
3.6 The interviews pragmatically maintained the needed flexibility. They recognized explicitly that NTMs in low-income countries such as the EAC members—which are characterized by very poor infrastructure and weak administrative and monitoring systems—are likely to be more arbitrary, qualitative, and nontransparent. Application of any a priori framework for organizing the NTMs —in this case, consistency with WTO instruments— was member nation-based, rather than EAC-wide. As illustrated in the next chapter, perspectives in specific member countries varied depending on the country’s economic development and location.
26 Phase 2 expects to help the EAC Secretariat and member nations minimize/avoid such developments in the NTMs.
17
3.7 Because of the wide range of mechanisms through which NTMs affect economic outcomes and the data-intensive computations required, it is very difficult to quantify the economic impact of NTMs on such measures as tariff equivalent impact. Unlike the current overall needs of EAC, the standard approaches for such empirical measurements of NTMs were refined in the 1980s and early 1990s in the context of entry of processed agro-products, textiles, and other light manufactures into markets in developed countries. The approaches range from frequency type measures based on counts of observed NTMs in particular countries, sectors, and types of trade, to the price-comparison measures (tariff equivalents), to the quantity–impact measures based on estimation of trade flows. Each standard approach to assess the economic impact of NTMs has its own drawback.
3.8 The difference between domestic and world prices is one indication of the prevalence of NTMs. However, the application of available sophisticated empirical methodology to calculate the ad valorem tariff equivalent for the specific NTMs, and the resultant trade restrictiveness to ascertain the economic impact in EAC, is not possible because of the extensive, detailed empirical data requirements for each identified NTM category and inadequacy of background information. More importantly, it is unlikely to be useful in fulfilling EAC’s objectives for the current investigation. In 2006, Kee, Nicita and Olarreaga provided the empirical methodology and estimated the impact of core NTB on imports at the tariff line level for 72 countries, including all EAC members, except Burundi. They provide an empirical methodology for estimating the impact of NTB on imports at the tariff line level (Harmonized System six-digit) based on Leamer (1990), and use it to measure the impact of NTMs.27 They present the ad valorem equivalents of NTMs for 72 developing and developed countries, including all in the EAC except Burundi. They use only four categories of NTMs in their measure, i.e. quantity control measures, price control restrictions, monopolistic measures, and technical regulations.28 In table 3.2, the first two columns are the average ad valorem equivalent of core NTMs over the whole tariff universe in their sample.29 The third and the fourth columns provide the average effect of core NTMs, but only over the sample of tariff lines for which each country has core NTMs.
27 They estimate the impact of NTMs for a particular country at the two-digit level of the harmonized system. They transform the quantity impact into price equivalents using import demand elasticity. The exact formula for the ad valorem equivalent depends on whether the NTB is a continuous (domestic support to agriculture, for example) or a binary (core NTMs and technical regulation, for example) variable. These are calculated at the product level in each country and an overall ad valorem equivalent for the three types of NTMs considered is obtained by adding NTB components. The trade restrictiveness index methodology follows Anderson and Neary (2003). 28 UNCTAD Trains: Quantity control measures (code 6100, 6200 and 6300); Price control restrictions (code 3100, 3200 and 3300); Monopolistic measures (code 7000); Technical regulations (code 8100). 29 All NTMs considered for the EAC members covered are accounted as 0/1, depending on their presence or absence.
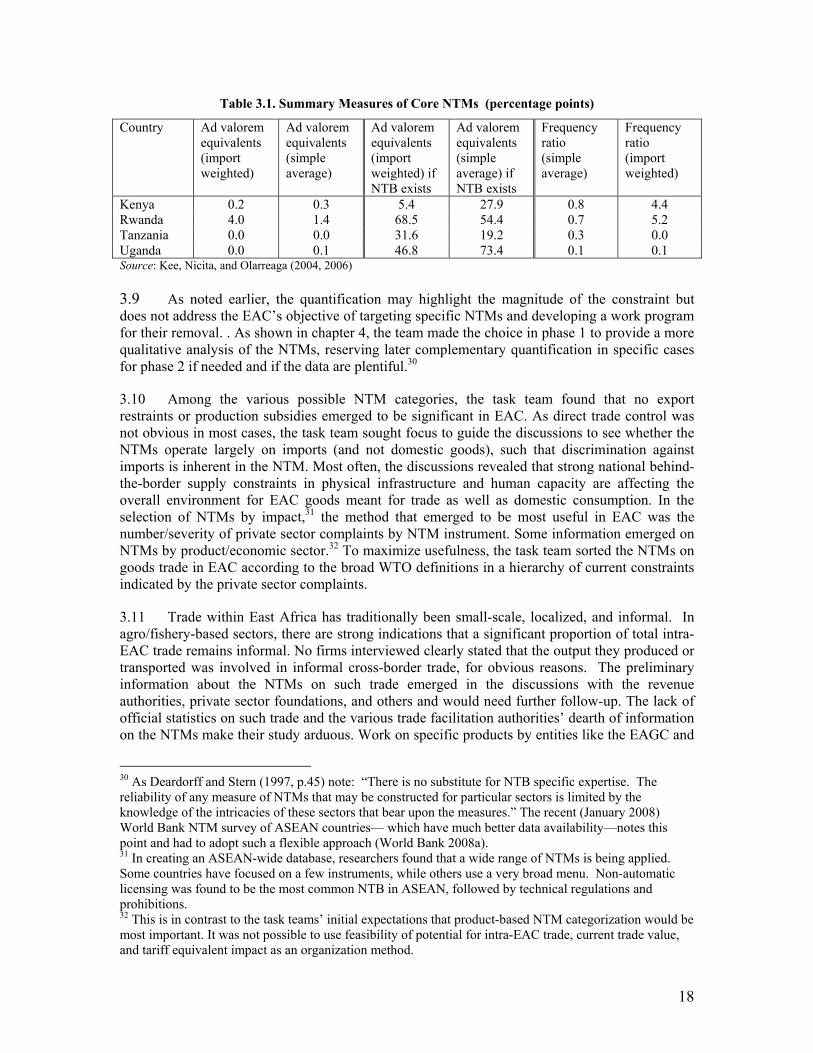
18
Table 3.1. Summary Measures of Core NTMs (percentage points)
Country Ad valorem equivalents (import weighted)
Ad valorem equivalents (simple average)
Ad valorem equivalents (import weighted) if NTB exists
Ad valorem equivalents (simple average) if NTB exists
Frequency ratio (simple average)
Frequency ratio (import weighted)
Kenya 0.2 0.3 5.4 27.9 0.8 4.4 Rwanda 4.0 1.4 68.5 54.4 0.7 5.2 Tanzania 0.0 0.0 31.6 19.2 0.3 0.0 Uganda 0.0 0.1 46.8 73.4 0.1 0.1 Source: Kee, Nicita, and Olarreaga (2004, 2006) 3.9 As noted earlier, the quantification may highlight the magnitude of the constraint but does not address the EAC’s objective of targeting specific NTMs and developing a work program for their removal. . As shown in chapter 4, the team made the choice in phase 1 to provide a more qualitative analysis of the NTMs, reserving later complementary quantification in specific cases for phase 2 if needed and if the data are plentiful.30
3.10 Among the various possible NTM categories, the task team found that no export restraints or production subsidies emerged to be significant in EAC. As direct trade control was not obvious in most cases, the task team sought focus to guide the discussions to see whether the NTMs operate largely on imports (and not domestic goods), such that discrimination against imports is inherent in the NTM. Most often, the discussions revealed that strong national behind-the-border supply constraints in physical infrastructure and human capacity are affecting the overall environment for EAC goods meant for trade as well as domestic consumption. In the selection of NTMs by impact,31 the method that emerged to be most useful in EAC was the number/severity of private sector complaints by NTM instrument. Some information emerged on NTMs by product/economic sector.32 To maximize usefulness, the task team sorted the NTMs on goods trade in EAC according to the broad WTO definitions in a hierarchy of current constraints indicated by the private sector complaints.
3.11 Trade within East Africa has traditionally been small-scale, localized, and informal. In agro/fishery-based sectors, there are strong indications that a significant proportion of total intra-EAC trade remains informal. No firms interviewed clearly stated that the output they produced or transported was involved in informal cross-border trade, for obvious reasons. The preliminary information about the NTMs on such trade emerged in the discussions with the revenue authorities, private sector foundations, and others and would need further follow-up. The lack of official statistics on such trade and the various trade facilitation authorities’ dearth of information on the NTMs make their study arduous. Work on specific products by entities like the EAGC and
30 As Deardorff and Stern (1997, p.45) note: “There is no substitute for NTB specific expertise. The reliability of any measure of NTMs that may be constructed for particular sectors is limited by the knowledge of the intricacies of these sectors that bear upon the measures.” The recent (January 2008) World Bank NTM survey of ASEAN countries— which have much better data availability—notes this point and had to adopt such a flexible approach (World Bank 2008a). 31 In creating an ASEAN-wide database, researchers found that a wide range of NTMs is being applied. Some countries have focused on a few instruments, while others use a very broad menu. Non-automatic licensing was found to be the most common NTB in ASEAN, followed by technical regulations and prohibitions. 32 This is in contrast to the task teams’ initial expectations that product-based NTM categorization would be most important. It was not possible to use feasibility of potential for intra-EAC trade, current trade value, and tariff equivalent impact as an organization method.
19
recent surveys by the UBOS are being undertaken slowly. However, it was not possible during this stocktaking to assess the quantitative control measures, sub-national fees, and other measures prevalent in informal trade. Hence, the subsequent selection process of NTMs for action in the EAC needs to be devised very carefully. It may not be representative to focus only on the official trade statistics.
3.12 The private sector entrepreneurs interviewed made it clear that they develop a fairly clear idea of the additional costs imposed by NTMs along the different transport routes, and make a business choice over time of the particular corridor to use for particular trade and transit purposes. Thus, in chapter 4, the location of NTMs is often associated with a particular transport corridor in EAC. Whenever possible, the cost incurred is indicated in terms of time or monetary loss, or decisions to undertake/not to undertake the trade. The stocktaking findings, reported in chapter 4, are organized according to the EAC-wide impact and coverage of the particular NTM group, based on WTO definitions of the broad categories. However, there is some variation in the impact assessment depending on the country location of the interviewee, although no distinct pattern emerges by country. Perception of the severity of the problem also varies somewhat depending on the location, economic development, and quality of national amenities and trade facilitation mechanisms available. The summary tables on the Burundi and the Kenya perspectives (tables 4.2 and 4.3) illustrate this.
20
CHAPTER 4. NON-TARIFF MEASURES IN THE EAC
I. PERSPECTIVE FROM THE EAC’S FORMAL GOODS TRADE
4.1 Characteristics of the EAC members and their formal goods trade provide the context in which the current NTMs operate in the region, as the sections that follow in this chapter emphasize. Two EAC members—Kenya and Tanzania—have the natural advantage of the Indian Ocean coastline for access to the sea routes via the ports of Mombasa and Dar es Salam, respectively. This may not seem directly critical for intra-EAC exports or imports, but has significant importance indirectly for three main reasons. First, EAC agro-processing and manufacturing are very dependent on imported intermediate and capital goods entering EAC through these ports. Agro-processing and manufacturing products are most traded within the region, according to formal trade statistics. Second, the intra-region trade routes are also used for the imports/exports from outside the region: namely, the Northern and the Central Corridors, starting from Mombasa and Dar es Salam and covering long distances within the geographic boundaries of Kenya and Tanzania, respectively. Third, the two countries play a pivotal role in the intra-regional goods trade.33
4.2 For the landlocked members, Burundi, Rwanda, and Uganda, the locational distance, number of border crossings, and, in some cases, the specific goods traded may favor a certain route of transit. For north and central Uganda, the distance and the single border crossing with Kenya means predominant usage of the Northern Corridor. For most of Burundi, the same reasons dictate the usage of the Central Corridor through Tanzania. Such countries might choose to opt for (unilateral action and) simple bilateral agreements, while waiting for a five-member EAC consensus to be reached in goods trade facilitation, including lowering the impact of NTMs. Except for Tanzania, all EAC members are dependant on the Mombasa–Nairobi–Eldoret petroleum pipeline.
4.3 Traditionally, the cheapest transport for bulk goods with high volume are by railways all across the world. This would be important for bulk commodities including food grains, animal products, other agricultural outputs and inedible crude materials that are integral to the intra-EAC goods trade. Unfortunately, in the recent years the official/formal goods traffic in EAC via railways along both corridors has declined substantially, as the reliability and quality of its service has deteriorated. Much as we stress on about 1400 km of railway network in the region, only about 20 percent is currently active. The lack of complementary development of roads and railways in the region has been costly for EAC members, particularly inland countries like Uganda, Rwanda and Burundi. Road transport has picked up the slack, even though it remains high-price (see appendix A5 on road transport cost and price in East Africa). Notwithstanding the recent privatization of the railway operations, this trend persists. The two relevant private concessionings, in Tanzania and in Kenya-Uganda effective from 2007, have yet to embark on improvements laid down the concession agreements. Furthermore, since the Kenya and Uganda rail network has a different concessionaire from the Tanzania railways, adopting a regional approach towards use of the rail network of intra-EAC goods trade over the medium term may be
33 Kenya’s role is pivotal as the highest income market for goods, as the historic base of manufacturing in the region, as a key member of COMESA, and for access to the markets in Ethiopia, Somalia, and southern Sudan and. Tanzania’s role is pivotal as a fast transforming economy, as the sole member of SADC in the region, and for access to markets in the south: notably, Mozambique and Zambia.
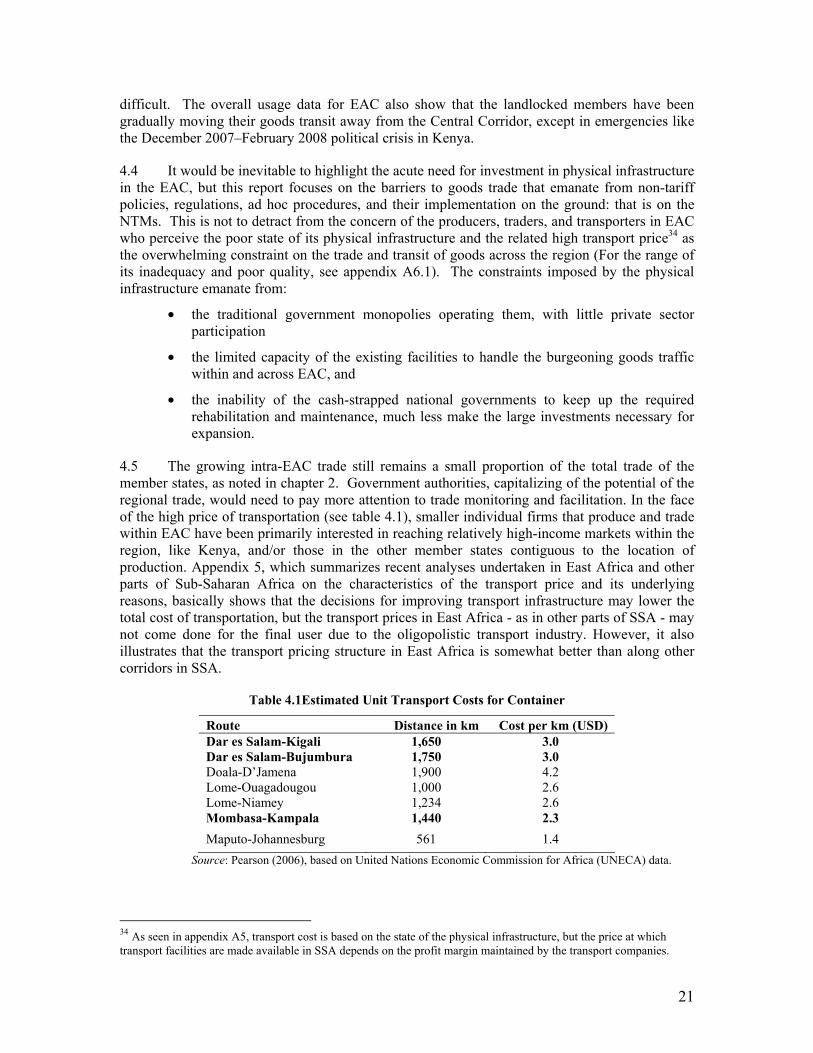
21
difficult. The overall usage data for EAC also show that the landlocked members have been gradually moving their goods transit away from the Central Corridor, except in emergencies like the December 2007–February 2008 political crisis in Kenya.
4.4 It would be inevitable to highlight the acute need for investment in physical infrastructure in the EAC, but this report focuses on the barriers to goods trade that emanate from non-tariff policies, regulations, ad hoc procedures, and their implementation on the ground: that is on the NTMs. This is not to detract from the concern of the producers, traders, and transporters in EAC who perceive the poor state of its physical infrastructure and the related high transport price34 as the overwhelming constraint on the trade and transit of goods across the region (For the range of its inadequacy and poor quality, see appendix A6.1). The constraints imposed by the physical infrastructure emanate from:
• the traditional government monopolies operating them, with little private sector participation
• the limited capacity of the existing facilities to handle the burgeoning goods traffic within and across EAC, and
• the inability of the cash-strapped national governments to keep up the required rehabilitation and maintenance, much less make the large investments necessary for expansion.
4.5 The growing intra-EAC trade still remains a small proportion of the total trade of the member states, as noted in chapter 2. Government authorities, capitalizing of the potential of the regional trade, would need to pay more attention to trade monitoring and facilitation. In the face of the high price of transportation (see table 4.1), smaller individual firms that produce and trade within EAC have been primarily interested in reaching relatively high-income markets within the region, like Kenya, and/or those in the other member states contiguous to the location of production. Appendix 5, which summarizes recent analyses undertaken in East Africa and other parts of Sub-Saharan Africa on the characteristics of the transport price and its underlying reasons, basically shows that the decisions for improving transport infrastructure may lower the total cost of transportation, but the transport prices in East Africa - as in other parts of SSA - may not come done for the final user due to the oligopolistic transport industry. However, it also illustrates that the transport pricing structure in East Africa is somewhat better than along other corridors in SSA.
Table 4.1Estimated Unit Transport Costs for Container
Route Distance in km Cost per km (USD) Dar es Salam-Kigali 1,650 3.0 Dar es Salam-Bujumbura 1,750 3.0 Doala-D’Jamena 1,900 4.2 Lome-Ouagadougou 1,000 2.6 Lome-Niamey 1,234 2.6 Mombasa-Kampala 1,440 2.3 Maputo-Johannesburg 561 1.4
Source: Pearson (2006), based on United Nations Economic Commission for Africa (UNECA) data.
34 As seen in appendix A5, transport cost is based on the state of the physical infrastructure, but the price at which transport facilities are made available in SSA depends on the profit margin maintained by the transport companies.
22
4.6 Last but not least, noticeable improvement toward facilitation of cargo transit has been made (in the opinion of the corridor users) in recent years within the framework of the North Corridor Authority and related investments in physical infrastructure along this route. Hence, recent stakeholder interviews convey that the predominant barriers to goods trade along the Central Corridor remain associated with infrastructure, and those along the Northern Corridor are now primarily administrative and customs procedures and operation.35
II. ECONOMIC COST OF NTMS
4.7 The actual cost of the NTMs on goods trade is difficult to assess in a preliminary stocktaking such as this report. In light of the information gathered on NTMs prevailing along each Corridor, their political-economic context, and their severity, this study groups the principal NTMs according to their negative weight on intra-EAC trade and the complexity of reasons for their persistence.36 These estimates/proxies of costs are based on the extensive private sector interviews in EAC member countries. In the EAC, it is seldom possible for stakeholders in goods trade to separate such costs from the additions due the deteriorated physical infrastructure, its inadequacy vis-à-vis needs, and the resultant congestion.
4.8 The impact of the NTMs37 on intra- EAC export/import and transit trade can be measured by the amount of business expenditure incurred in:
• Official payments, in the process of complying with official export and import requirements
• General expenses (staff costs, storage costs, and the like)accrued while awaiting verification or clearance of cargo at border crossings due to delayed clearance of goods
• Nonofficial expenses at border entry and exit points, police roadblocks, and weighbridges intended to unofficially speed up clearance of goods. Such bribes may be paid to officials from the customs, port, quality inspection agencies, police at road blocks/ border crossings, immigration office, business licensing/ registration office, and at weighbridge stations.
• Lost business opportunities, in value or quantity of a business opportunity due to introduction/application of discriminatory tax rates and other import procedures, such as import licenses, quotas, bans, and wasted products (especially perishable ones) during the process of a full inspection, or of weighing axle load or Gross Vehicle Mass specifications.
• Lost time, in the process of complying with nontransparent or difficult procedures.
35 In 1985 Kenya, Uganda, Rwanda, Burundi and the Democratic Republic of Congo signed the Northern Corridor Transit Agreement (NCTA) to simplify and harmonize procedures to expedite movement of goods in transit across each country. The agreement provided for establishment of Transit Transportation Coordination Authority (TTCA), for implementation of matters related to transit traffic. 36 This will help assess the time requirements and resources needs for the future action plan to eliminate NTMs. 37 The NTB impact measures are elaborated in the Proposed Mechanism for the Elimination of NTBs in EAC, EAC-EABC (2006).
23
4.9 The largest direct and indirect cost of NTMs in the EAC, as determined by the task team, stem from lost man-days during transit and clearance before reaching the market, and nonofficial expenses related largely to the scope for corruption in the implementation of policies, followed by official payments and lost business opportunities.
III. NTMS PREVALENT IN THE EAC
4.10 The discussion that follows presents the NTMs that apply to intra-EAC trade, with the broad categories organized as per the WTO inventory categorization (see appendix A4). The broad categories are ranked in a decreasing order of importance based on numbers of private sector complaints. The presentation synthesizes findings from interviews in the five EAC economies. The presentation moves away from the state of physical infrastructure in the region, though the task team remains mindful of the EAC stakeholder responses conveying that NTMs related to the “government monopolies and its tolerance of monopoly practices” (that is WTO I, in the inventory provided in appendix A4) have a possibility of being alleviated as constraints imposed by the physical infrastructure are gradually tackled. 4.11 As an illustration of specific national perceptions of indicative costs and the political-economic operation of NTMs, tables 4.2 and 4.3 present the perspectives of producers, traders, and transporters of Burundi and Kenya, respectively. As seen in chapter 2, of the five EAC member countries, these two counties differ the most in their economic and trade profiles.
A. Customs and administrative entry and passage procedures (WTO II)
4.12 The EAC Council of Ministers decisions are expected simplify and synchronize customs documentation, formalities and procedures at the border posts. Many member states are undertaking donor-funded customs modernization programs, but the focus and content of such national efforts remain largely uncoordinated across the EAC. Planned improvements in administering border posts have been slow, mostly bilateral, and with somewhat varying results to date.38 Duplication of processes continues to add to monetary costs and loss of time. Unequal treatment according to the country of origin of the goods and/or truck and opportunities for fraudulent behavior is frequent, as are the allegations of such “unfair” treatment and corruption.
Documentation and procedures 4.13 The task team witnessed varying systems of import declaration, payment of applicable duty rates, and (technical and sanitary and phyto-sanitary requirement) standards applied, as well as limited/varying working hours at the customs posts. Lengthy procedures and inadequate information to enable customs officials make pertinent decisions at the border posts seem to plague the EAC-wide system.39 Frequent use of COMESA certificates of origin by businesses of four EAC members illustrate that the standardization of EAC certificates of origin is not functional. To implement customs procedures for entry processing, cargo control, transit, warehouse control, and accounting, four member countries have opted to use (various versions of) ASYCUDA,40 while Kenya has chosen to use SIMBA.41 To date, the linkage between these
38 Kenya and Uganda have a bilateral legal framework for joint control at their common border posts, creating a one-stop post at each border crossing, starting with Malaba. They also have an agreement to introduce 24-hour services at their common border posts. 39 It takes about one week for process at Kenya Revenue Authority to be completed. 40 Automated Systems for Customs Data is a computerized customs management system developed by UNCTAD to help reform the customs clearance process. It aims at speeding up customs.
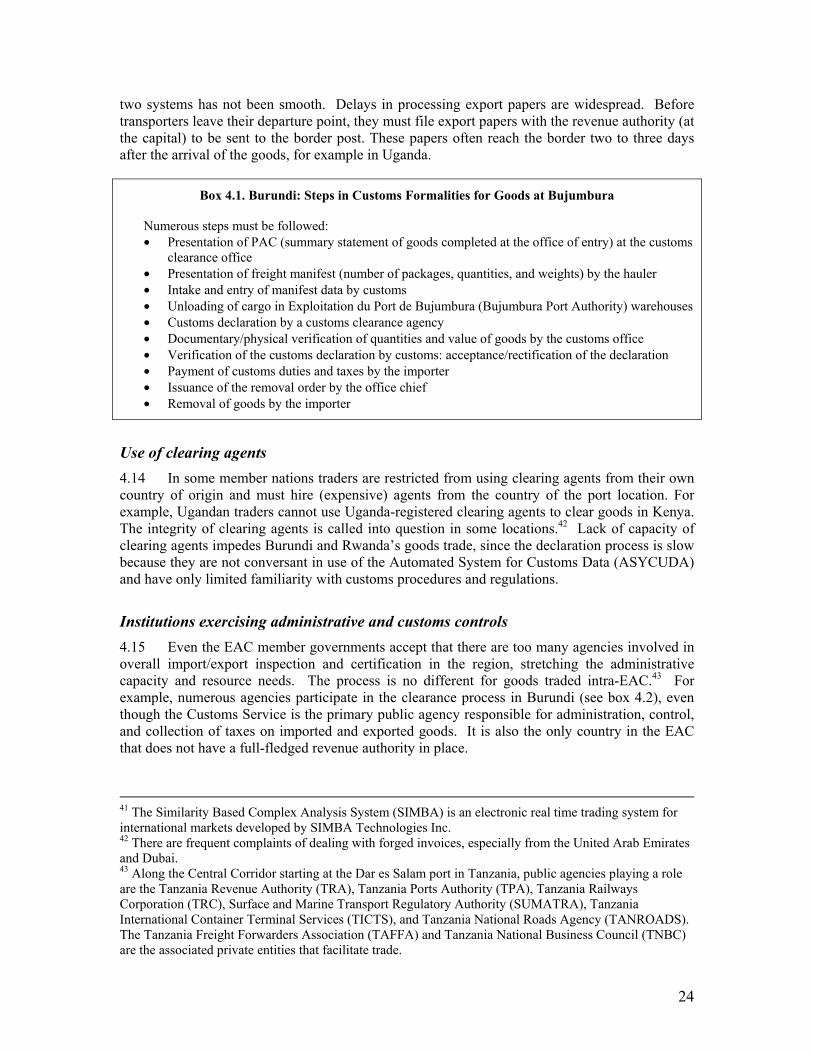
24
two systems has not been smooth. Delays in processing export papers are widespread. Before transporters leave their departure point, they must file export papers with the revenue authority (at the capital) to be sent to the border post. These papers often reach the border two to three days after the arrival of the goods, for example in Uganda.
Box 4.1. Burundi: Steps in Customs Formalities for Goods at Bujumbura Numerous steps must be followed: • Presentation of PAC (summary statement of goods completed at the office of entry) at the customs
clearance office • Presentation of freight manifest (number of packages, quantities, and weights) by the hauler • Intake and entry of manifest data by customs • Unloading of cargo in Exploitation du Port de Bujumbura (Bujumbura Port Authority) warehouses • Customs declaration by a customs clearance agency • Documentary/physical verification of quantities and value of goods by the customs office • Verification of the customs declaration by customs: acceptance/rectification of the declaration • Payment of customs duties and taxes by the importer • Issuance of the removal order by the office chief • Removal of goods by the importer
Use of clearing agents 4.14 In some member nations traders are restricted from using clearing agents from their own country of origin and must hire (expensive) agents from the country of the port location. For example, Ugandan traders cannot use Uganda-registered clearing agents to clear goods in Kenya. The integrity of clearing agents is called into question in some locations.42 Lack of capacity of clearing agents impedes Burundi and Rwanda’s goods trade, since the declaration process is slow because they are not conversant in use of the Automated System for Customs Data (ASYCUDA) and have only limited familiarity with customs procedures and regulations.
Institutions exercising administrative and customs controls 4.15 Even the EAC member governments accept that there are too many agencies involved in overall import/export inspection and certification in the region, stretching the administrative capacity and resource needs. The process is no different for goods traded intra-EAC.43 For example, numerous agencies participate in the clearance process in Burundi (see box 4.2), even though the Customs Service is the primary public agency responsible for administration, control, and collection of taxes on imported and exported goods. It is also the only country in the EAC that does not have a full-fledged revenue authority in place.
41 The Similarity Based Complex Analysis System (SIMBA) is an electronic real time trading system for international markets developed by SIMBA Technologies Inc. 42 There are frequent complaints of dealing with forged invoices, especially from the United Arab Emirates and Dubai. 43 Along the Central Corridor starting at the Dar es Salam port in Tanzania, public agencies playing a role are the Tanzania Revenue Authority (TRA), Tanzania Ports Authority (TPA), Tanzania Railways Corporation (TRC), Surface and Marine Transport Regulatory Authority (SUMATRA), Tanzania International Container Terminal Services (TICTS), and Tanzania National Roads Agency (TANROADS). The Tanzania Freight Forwarders Association (TAFFA) and Tanzania National Business Council (TNBC) are the associated private entities that facilitate trade.
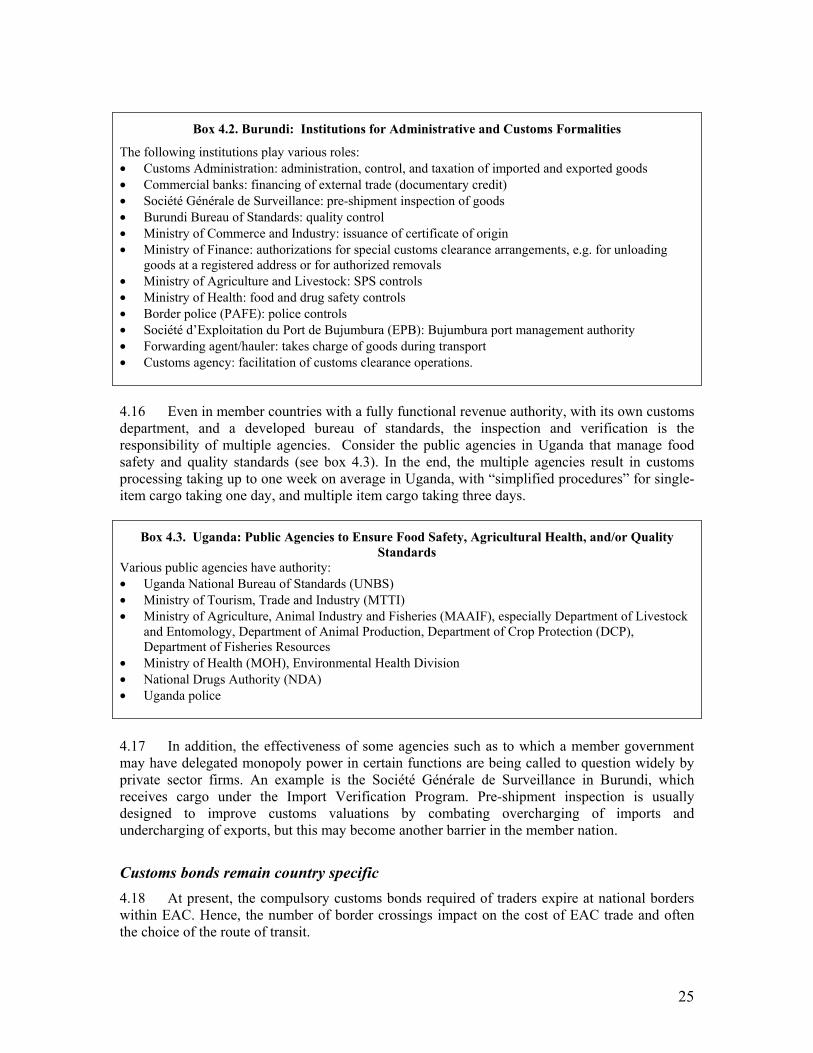
25
Box 4.2. Burundi: Institutions for Administrative and Customs Formalities
The following institutions play various roles: • Customs Administration: administration, control, and taxation of imported and exported goods • Commercial banks: financing of external trade (documentary credit) • Société Générale de Surveillance: pre-shipment inspection of goods • Burundi Bureau of Standards: quality control • Ministry of Commerce and Industry: issuance of certificate of origin • Ministry of Finance: authorizations for special customs clearance arrangements, e.g. for unloading
goods at a registered address or for authorized removals • Ministry of Agriculture and Livestock: SPS controls • Ministry of Health: food and drug safety controls • Border police (PAFE): police controls • Société d’Exploitation du Port de Bujumbura (EPB): Bujumbura port management authority • Forwarding agent/hauler: takes charge of goods during transport • Customs agency: facilitation of customs clearance operations. 4.16 Even in member countries with a fully functional revenue authority, with its own customs department, and a developed bureau of standards, the inspection and verification is the responsibility of multiple agencies. Consider the public agencies in Uganda that manage food safety and quality standards (see box 4.3). In the end, the multiple agencies result in customs processing taking up to one week on average in Uganda, with “simplified procedures” for single-item cargo taking one day, and multiple item cargo taking three days.
Box 4.3. Uganda: Public Agencies to Ensure Food Safety, Agricultural Health, and/or Quality Standards
Various public agencies have authority: • Uganda National Bureau of Standards (UNBS) • Ministry of Tourism, Trade and Industry (MTTI) • Ministry of Agriculture, Animal Industry and Fisheries (MAAIF), especially Department of Livestock
and Entomology, Department of Animal Production, Department of Crop Protection (DCP), Department of Fisheries Resources
• Ministry of Health (MOH), Environmental Health Division • National Drugs Authority (NDA) • Uganda police 4.17 In addition, the effectiveness of some agencies such as to which a member government may have delegated monopoly power in certain functions are being called to question widely by private sector firms. An example is the Société Générale de Surveillance in Burundi, which receives cargo under the Import Verification Program. Pre-shipment inspection is usually designed to improve customs valuations by combating overcharging of imports and undercharging of exports, but this may become another barrier in the member nation.
Customs bonds remain country specific 4.18 At present, the compulsory customs bonds required of traders expire at national borders within EAC. Hence, the number of border crossings impact on the cost of EAC trade and often the choice of the route of transit.
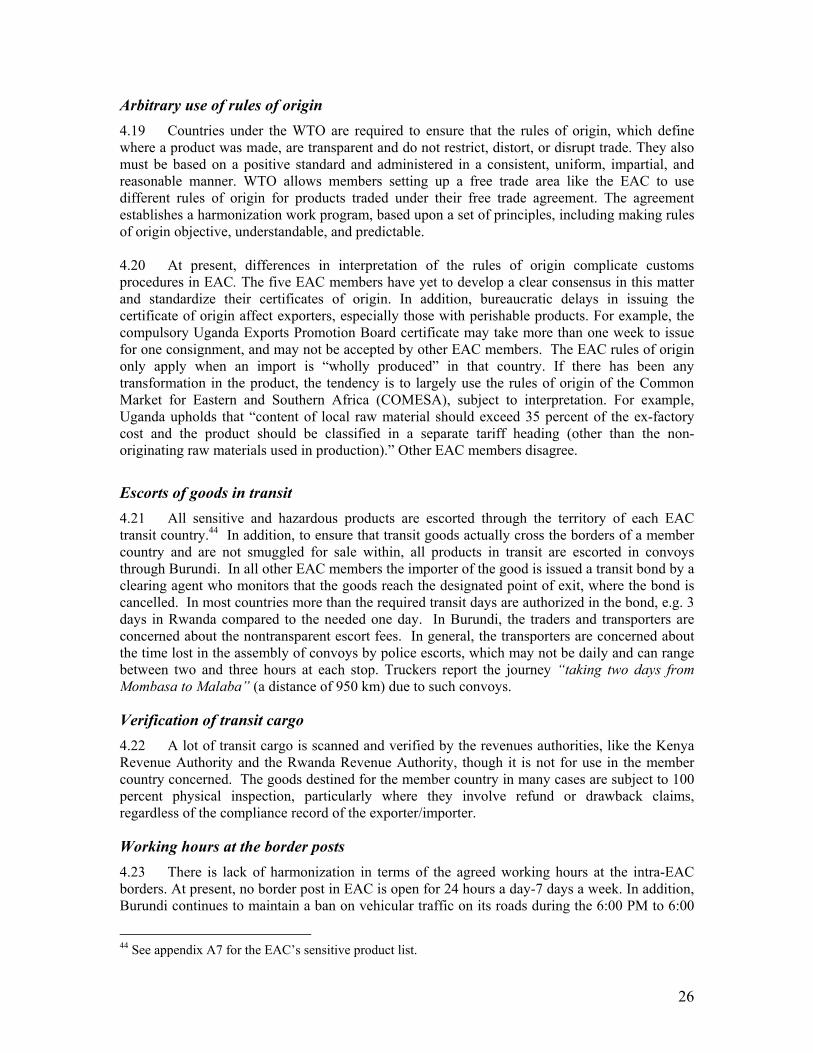
26
Arbitrary use of rules of origin 4.19 Countries under the WTO are required to ensure that the rules of origin, which define where a product was made, are transparent and do not restrict, distort, or disrupt trade. They also must be based on a positive standard and administered in a consistent, uniform, impartial, and reasonable manner. WTO allows members setting up a free trade area like the EAC to use different rules of origin for products traded under their free trade agreement. The agreement establishes a harmonization work program, based upon a set of principles, including making rules of origin objective, understandable, and predictable. 4.20 At present, differences in interpretation of the rules of origin complicate customs procedures in EAC. The five EAC members have yet to develop a clear consensus in this matter and standardize their certificates of origin. In addition, bureaucratic delays in issuing the certificate of origin affect exporters, especially those with perishable products. For example, the compulsory Uganda Exports Promotion Board certificate may take more than one week to issue for one consignment, and may not be accepted by other EAC members. The EAC rules of origin only apply when an import is “wholly produced” in that country. If there has been any transformation in the product, the tendency is to largely use the rules of origin of the Common Market for Eastern and Southern Africa (COMESA), subject to interpretation. For example, Uganda upholds that “content of local raw material should exceed 35 percent of the ex-factory cost and the product should be classified in a separate tariff heading (other than the non-originating raw materials used in production).” Other EAC members disagree.
Escorts of goods in transit 4.21 All sensitive and hazardous products are escorted through the territory of each EAC transit country.44 In addition, to ensure that transit goods actually cross the borders of a member country and are not smuggled for sale within, all products in transit are escorted in convoys through Burundi. In all other EAC members the importer of the good is issued a transit bond by a clearing agent who monitors that the goods reach the designated point of exit, where the bond is cancelled. In most countries more than the required transit days are authorized in the bond, e.g. 3 days in Rwanda compared to the needed one day. In Burundi, the traders and transporters are concerned about the nontransparent escort fees. In general, the transporters are concerned about the time lost in the assembly of convoys by police escorts, which may not be daily and can range between two and three hours at each stop. Truckers report the journey “taking two days from Mombasa to Malaba” (a distance of 950 km) due to such convoys.
Verification of transit cargo 4.22 A lot of transit cargo is scanned and verified by the revenues authorities, like the Kenya Revenue Authority and the Rwanda Revenue Authority, though it is not for use in the member country concerned. The goods destined for the member country in many cases are subject to 100 percent physical inspection, particularly where they involve refund or drawback claims, regardless of the compliance record of the exporter/importer.
Working hours at the border posts 4.23 There is lack of harmonization in terms of the agreed working hours at the intra-EAC borders. At present, no border post in EAC is open for 24 hours a day-7 days a week. In addition, Burundi continues to maintain a ban on vehicular traffic on its roads during the 6:00 PM to 6:00
44 See appendix A7 for the EAC’s sensitive product list.
27
AM period for safety reasons. Gates are opened/closed at different times on each side of the border, causing unnecessary queues and commotion. For example, at Malaba gates at the Ugandan border post are open 8:00 AM to 10:00 PM, while gates at the Kenyan border post are open 8:00 AM to 6:00 PM. At Gatuna, gates at the Rwandan border post are open 7:00 AM to 9:00 PM, while gates at the Ugandan border post are open 8:00 AM to 10:00 PM. The Rwanda Revenue Authority has announced that the border customs offices will start 24-hour operations from September 1, 2008 to ease the flow of goods and services in the EAC and neighboring Democratic Republic of Congo. Uganda, a crucial partner in the 24-hour operation, is not yet ready to follow suit due to manpower and budget constraints. B. Government participation in trade and restrictive practices tolerated by it (WTO I)
Port and internal CFS operations 4.24 The operations of the ports and inland CFS operations in the EAC serve as a bottleneck for economic activity in the region. While operations of the sea ports of Mombasa and Dar es Salam are especially important for EAC’s goods trade with the rest of the world,45 the lake ports of Bujumbura, Kigoma, and internal freight stations like MAGERWA and Isaka are particularly important for the intra-EAC trade. This is more so in member countries that have minimal capacity, if any, available at their border posts and all goods clearance activities are concentrated at these locations. Examples include Bujumbura in Burundi and MAGERWA in Rwanda, until recently. The transparency and efficiency in clearance and release of goods at the two sea ports is hampered by the administrative complexity of formalities, especially in Kenya—including varied documentary requirements; numerous/excessive service fees; and offloading, inspection, and warehousing processes, with short grace periods provided for imports prior to the application of demurrage charges. Limited skills and ineffectiveness of the various staff and agents prevail, especially in Dar es Salam. Local regulations that do not allow the creation of a container freight station (CFS) and other activities beyond a short radius of the port impede expansion. All these add to the lengthy delays, congestion, and high costs in offloading and clearing cargo (already limited by the useable physical infrastructure at these locations) and create considerable scope for discriminatory and fraudulent behavior. Shipment clearance delays also add to the risk of deteriorating product quality, especially for perishable products. 4.25 Mombasa port operations are unanimously agreed by the private firms and public agencies in Uganda and Rwanda to be at the top of constraining measures for total goods trade along the Northern Corridor. The private stakeholders in Kenya convey a similar assessment. The Kenya Port Authority procedures are recorded to take over 60 hours—that is, two weeks—for clearance of a container. On average, cargo spends 17.9 days at the Mombasa port. For a subset of containers destined for Uganda and beyond, the time spent was 37.5 days; while that for containers destined within Kenya was 12.4 days.46 Regulations that do not allow a CFS to be located outside a 10 km radius from the port are hampering efforts to establish such a facility for Rwandan goods. Each 10-day delay in releasing the goods implies a cost equivalent to about 0.5 percent of the value of goods.47 Costs also result from goods not being available for use, at around 0.8 percent of the value of goods per day.48 In early May 2008, approximately 8,000 containers were reported to be waiting at the Mombasa port. 45 Including inputs for goods produced and traded within EAC. 46 Time at port refers to the time taken from unloading containers to exiting ports; or from entering port to loading on ships. World Bank (2006; p. 212) considers 7 days to be the reasonable standard time at port. 47 Assuming an interest rate of 20 percent 48 Based on Hammels (2001), which studies willingness to pay for reducing transit time of goods.
28
4.26 The Dar es Salam port takes two to four weeks to clear containers. Increasingly stakeholders in the land- locked EAC countries who have a choice in terms of using the two ports on the Indian Ocean are moving away from using this port (because of both the implementation of regulations and the quality and capacity of infrastructure at the port and along the central corridor). In September 2005, about 11,000 containers had not been cleared after four weeks, while they start incurring demurrage after two weeks. For Burundi, the finalization of the agreement with government of Tanzania to allocate land for the construction of a warehouse for its goods in the port area is awaited. 4.27 The Bujumbura port clears all goods entering Burundi through all its border crossings—since the border posts are largely nonfunctional—while the clearance paperwork undergoes a process of control and verification simultaneously with the actual goods. Forwarding agents and transporters estimate that clearance to often take three to seven days to complete. During this span, fees for services are charged on the trucks, including truck fees of USD250 per day and parking fees of BFr 9,000 per truck per day. In specific cases, goods can be unloaded for a registered address or are authorized for removal by a high-ranking authority in the government and are processed faster. Authorizations to unload goods at a registered address are granted by the Minister of Finance for fragile products (such as tiles or cement) and perishables (such as drugs) to avoid repeated handling, which could damage the product during verification operations. Authorizations for removal are issued by the same authority in the case of imports by NGOs, projects, and diplomatic missions that are exempt from customs duty and taxes. 4.28 In Rwanda the border ports are functional, but customs offices in Magasins Généraux du Rwanda (MaGeRwa) finalize the clearing processes of goods and hand over to the final importer or the actual owners. A privately operated container terminal has just started operation in Kigali in 2008 to supplement the work done in MAGERWA. The minimum time is three days for the issuing of an arrival note and customs procedures to be completed, but usually clearance of goods can range from one to two weeks. However in the process of clearing and releasing these goods to their owners, a number of different bottlenecks occur. Consider the multiple service charges at MAGERWA, illustrative of many similar locations in the EAC: Every truck is charged a weighbridge fee of FRw 5,000. There is FRw 7.5 per kilogram of the goods carried for storage /demurrage. For goods kept in the warehouses, a grace period of 15 days in provided. Thereafter, a fee of FRw 1 per kilogram per day is charged. In addition, MAGERWA charges a parking fee on goods of FRw 5,000 and a VAT of FRw 900 for any extra working day (beyond one day) that the vehicle remains parked. Charges by RRA may vary depending on the product’s categorization. Delays at weighbridges 4.29 The mandatory weighbridges for goods all along the transit route, and not only at the border, impede trade through addition to transit time and cost of transporter upkeep. These are particularly significant on the Kenyan and Tanzanian sides of the transport corridors. Tanzania requires every vehicle carrying goods, small or large, to be weighed, including passenger buses. Along the Central Corridor, between Rusumo and Dar es Salam, there are five compulsory weighbridges: at Nyahahura, Mwenda Kulima, Mkundi, Mikese, and Kibaha. Along the Northern corridor, there are 7 weighbridges on the Kenyan route at Mombasa, Malaba, Kilindini, Maliyakani, Athi River, Webuye and Amagoro. Trucks heading to Kigali have to be weighed another four times in Uganda, at Busitema, Masaka, Mbarara, and Ntungamo. Neither the acceptable weights per axle nor the number of axels are not yet harmonized in the region, causing further conflicts (more on this later). The system that Kenya is moving toward (awaiting fully
29
compliance to the directive of the Minister of Roads and Public Works) is that transit trucks will be weighed only once and need to carry the issued certificate, as preferred by transporters. C. Distribution restrictions (WTO VII).
Multiple police road blocks and mobile control 4.30 Unrelated with weighing or clearing the cargo, police road blocks are constantly cited by traders and transporters as location for rent seeking and transit delays. The roadway along the Northern Corridor is particularly noted for such practices, especially on the Kenyan part. “Police check points have become ‘police cash-points’ as they no longer serve their intended purpose of security but are being used as medium of soliciting money from transit trailer trucks, especially those with foreign registration numbers,” said one irritated transporter. For example, there are about 10 police/local government roadblocks from Mombasa to the Uganda border (down from about 27 about four to ten years ago). In addition, there are mobile checkpoints, more frequent in Kenya, run by the revenue authorities of the respective countries, such as the Revenue Protection Department in Rwanda. It is estimated that 12 percent of checks of commercial vehicles take one to two hours. In some cases, these roadblocks cause delays even for returning vehicles not carrying any goods. Along the Central Corridor, 26 checkpoints were reported between Rusumo and Dar es Salam (distance 1,480kms), and 5 in Rwanda between Rusumo and Kigali (168 kms distance). What bothers transporters is that there is a general lack of coordination among the police in carrying out their duties, such that a truck is subject to similar checks at all traffic stops. This creates room for the police to openly press for petty bribes—for example, in Tanzania, commonly referred to as “kahawa,” meaning a cup of coffee. Prohibition on transportation of locally produced goods 4.31 This is applied in most countries. For example, transit goods license issued for a truck by the KRA/RRA allows the truck only to route goods through Kenya/Rwanda, but not to undertake any local goods transportation within the country. It prohibits transportation of locally produced goods from Kenya/Rwanda as exports and transportation of goods from another EAC member into Kenya/Rwanda as imports. Such restrictions, on what could be normal occurrence for returning trucks, escalate transport costs, as empty trucks have to be sent back.49 Refueling 4.32 Ugandan transporters stated that the trucks registered in Uganda are not allowed to refuel in Rwanda. Since fuel prices are lower in Rwanda than they are in Uganda, refueling Uganda’s trucks in Rwanda is equated to smuggling. Ugandan transporters have to make sure that they have enough fuel before crossing the Rwanda border to avoid getting stranded. This does not seem to be true, when cross-checking was done with the Rwandan authorities Discriminatory treatment toward foreign trucks in Tanzania 4.33 Allegations of discriminatory treatment on foreign-registered trucks have been made concerning all member countries, though the problem seems to be most acute in Tanzania. Few trucks bearing Rwandan, Burundian, Ugandan, or Kenyan number plates ply along the Central Corridor. Most producers, traders, and transporters in these countries prefer to use trucks registered in Tanzania driven by Tanzanians because of discriminatory treatment of foreign-registered trucks. Transporting companies register part of their fleet in Tanzania to avoid 49 Traders asked, “If the COMESA Yellow Card is acceptable in the region, why isn’t the EAC Transit Goods License similar?”
30
problems. Among other things, foreign registered vehicles in Tanzania pay a road fee of USD50 per week, compared to local vehicles that pay nothing. In Kenya, Ugandan truck drivers allege “injustice and unfair treatment— everything is judged in favor of the Kenyans” at the road blocks. Harassment of Rwandese truckers has also been reported at weighbridges in Kenya and by police in Uganda. Such practice is often considered a sign of growing corruption in these countries. EAC transit licenses for goods 4.34 These are being issued as part of the new EAC transit regulations, with multiple fees: USD 1,500 for a company transit license; USD600 for a transit goods license, and KSh 10 million for a security bond on goods transited across Kenya. Information shared with transporters is limited. Moreover, different countries seem to continue to charge their own rates at present. For example, it costs USh 500,000 (approx. KSh 20,000) for a transit license in Uganda and KSh 42,000 for one in Kenya. Truck entrance fees and grace period 4.35 Contrary to the EAC Protocol, Kenya, Tanzania, and Rwanda charge fees on each truck entering their territory (often referred to as “road toll”). Kenya charges USD60 for a truck going up to Nairobi from Mombasa and USD90 beyond Nairobi; Rwanda charges USD76 per truck; while Tanzania charges USD50 per truck per week. In addition, local levies may apply. For example, the municipality of Mombasa has introduced a new levy on Uganda-bound trucks. The EAC transit regulations allow a grace period of seven days without payment of fees for vehicles entering the territory of a member state, but compliance varies across member states and across time periods. Variation in application of axle load limits 4.36 The EAC has passed a specific 3 axle–7 tonne per axle load requirement for trucks. All member governments agree that the new restriction is good for protecting the road surface in the region and, in addition, the private sector agrees that it will eventually be good for truck maintenance and reduced workshop time. Tanzania has been strictly applying such axle load limits, as a member of SADC, for a while. However, the other four members have traditionally allowed 4-axle trucks with much larger loads. These larger capacity trucks had become an important lifeline for the EAC, as the railways became less and less an alternative for bulk commodity transportation. 4.37 In the interim, while the rule is being sporadically applied by Kenya, Uganda, and Rwanda, decisions at the border do not agree on the same axle loading. In extreme cases, entry is temporarily denied, limiting market access. In Burundi, the regulations to restrict axle load have not yet been introduced. Along the Northern Corridor, transporters and traders find the enforcement of the axle load controls more flexible than along the Central Corridor. Those who submit to the EAC restrictions along this route feel that it amounts to unfair competition, in as much as they are penalized by having to pay higher unit cost for cargo transport than those who may have bribed agents responsible for checking axle load. For example, Uganda registered trucks are sometimes denied transit permits to the DRC by Rwandan authorities for unclear reasons related to the concern that “Ugandan trucks spoil roads in Rwanda.” For the time being, trucks must remove the fourth axle only when entering Tanzania, an activity costly both in terms of time and money. During the end-2007 political crisis in Kenya, Tanzanian authorities invited Uganda to use its ports. But continued transit became impossible on the Tanzania route even for two weeks because of the huge fines charged on loads in excess of the standard axle load. While
31
the railways remain a poor alternative for bulk commodity transit across the region, EAC-wide implementation of the axle–load decision will hike unit transportation cost of cargo in the region and reduce the transport capacity of the existing fleet. For reasons of fairness and reciprocity between countries, all partner countries should harmonize implementation of the axle load regulation. D. Specific limitations (WTO V)
Cost of translation 4.38 The official language of EAC business is English. However, the government and business processes of Burundi remain francophone, with very limited programs to improve English- and Kiswahili-speaking capacities of the traders and transporters. Hence, the language of communication is yet another NTM recognized by Burundian traders and trucks that travel in Uganda, Tanzania, and Kenya. Traders face specific charges. For instance, those who export goods to francophone Burundi from Kenya pay a USD300 fee to translate the required regulations to English at Jomo Kenyatta International Airport in Nairobi. Traders suggest that regulations should be translated in all official national languages spoken in EAC by the issuing country. Use of immigration and visa procedures 4.39 These are cumbersome, duplicative, and in many instances used contrary to the EAC Protocol. EAC-wide, visa fees was removed in June 2007 and replaced by temporary work permits for visitors seeking temporary work assignments. These do not apply to traders, transporters, and visitors who are not seeking temporary employment. At the border, officials at Nymanga, Tanzania not only charge each truck USDD50, but also impose a charge of USD100 as work permit for accompanying businessmen who would like to exhibit their products in Tanzania. Business registration 4.40 Treatment of businesses originating in the EAC as “foreign” and different national procedures make cross-border registration of business branches difficult. Payment for registration of business names and the multiplicity of licenses for production, distribution/sale of goods among the five EAC countries is cumbersome. Moreover, exemptions on certain WTO obligations apply to four EAC members that are categorized as less developed countries. When it comes to cross border trade in manufactured products, it is not clear how this should impact their trade with Kenya in specific areas, such as pharmaceutical and medicinal products. E. Technical barriers to trade (WTO III)
4.41 Technical standards and SPS concerns about goods are slowly emerging as NTMs in the EAC. These two difficult areas of action are likely to be in the forefront as the members develop their economies and industrial base. If EAC members continue to view intra-region trade in manufactures as being in conflict with the national political agenda of promoting industrialization, traded goods compliance to product technical standards and mutual recognition of such standards may prove very difficult to implement in EAC. Notwithstanding the immense capacity constraints presented below, the political will in the EAC countries is key in the adoption of technical standards for traded goods. Trade in the region has been affected when the credibility of the NBSs have been in doubt. But the problem can be alleviated by mutual understanding and an establishment of a good track record over time.50
50 For example, that done by the Uganda Bureau of Standards.

32
4.42 In close relation with the technical barriers, there are allegations of NTMs impeding sale of manufactured goods in Kenya. Producers and traders from other EAC members seeking to access this high-income market find it difficult to advertise and place their products on shop shelves in Kenya, even if they meet the technical standards specified by Kenya Bureau of Standards. Billboards of advertisements are reported to be taken down overnight. The retail outlets in Kenya face difficulty renewing the Kenyan business licenses in the subsequent years. Goods inspection and technical standards enforcement 4.43 The EAC member states are expected to adopt the EAC harmonized standards of goods traded within the region. Enacted into law is a mechanism to ensure mutual recognition of quality marks on products by the national bureaus of standards (NBS). Currently the bureaus are also responsible for enforcement of the standards at the border. Goods are to be exempt from rigorous verification upon importation once they bear such national and/or EAC quality marks. 4.44 These steps largely remain unimplemented, due to human capacity and/or political will. At present, all EAC member states do not recognize one another’s quality marks. Members continue to set their individual standards and require other states to comply on all goods for sale and for transit. The concerns of traders and transporters hinge on training /information available to agents applying the technical standards at the border; the product verification methods and continuance of inspections despite national/EAC quality marks/certificate issued by specific NBS; and the inspection fees on goods in transit. For example, Tanzanian food exporter pays TSh 200,000 per shipment for a Tanzania Bureau of Standards certificate, but the certificate is not recognized by other EAC members. Another example is the case of Ugandan tea. Shipments transited through Kenya to countries outside the region must pay an inspection fee of USD400 at the border despite the Uganda Bureau of Standards certificate. The inspection systems for goods at the borders are not harmonious across EAC, and may not use the needed international standards of inspection, accepted procedures, and accepted sample sizes such that tests are unbiased. There are instances where goods are returned or destroyed due to the lack of standardization
Box 4.4. The Dairy War: Kenya versus Uganda and Tanzania
Milk processed by Musoma Dairy Limited, Tanzania was denied entry into Kenya in mid-2008 by the Kenya Revenue Authority on the grounds that the milk did not qualify under the EAC’s rules of origin requirement. As a result, the imports into Kenya attracted a duty of 60 percent, the prevailing common external tariff (CET) of the customs union. In addition the company has had to obtain an export permit for each consignment from the Kenya Dairy Board, at the charge of USD77 per consignment. The company had a contract to export 100,000 liters of UHT milk to Kenya, but in the end was allowed to export only 10,000 liters at the 60 percent duty. The dairy war has resulted from a complex regulation regime that prevents imports of dairy products from Tanzania and Uganda into Kenya, in effect defeating the spirit of the EAC Customs Union. Tanzania and Uganda argue that the restrictions and multiplicity of controls are contrary to what EAC member states had agreed on milk exports. First, the Kenyan regulations require that milk exporters from Tanzania and Uganda must have certificates proving that these products have been processed under constant supervision by the veterinary authorities in the region. Second, it is argued that the veterinary standards imposed by the Kenyan authorities are neither made public nor is the information shared with the veterinary authorities in the region. Third, too many institutions—the Kenya Dairy Board, Kenya Bureau of Standards, the Veterinary Department, and Kenya Revenue Authority—deal with authorizing Kenya’s dairy imports. The main NTMs restricting milk trade are the national legislations and the outdated/cumbersome import authorization systems that in effect are not really intended for checking applying the EAC-wide norms on rules of origin or enforcing technical standards of the import or it sanitary and food safety standards.
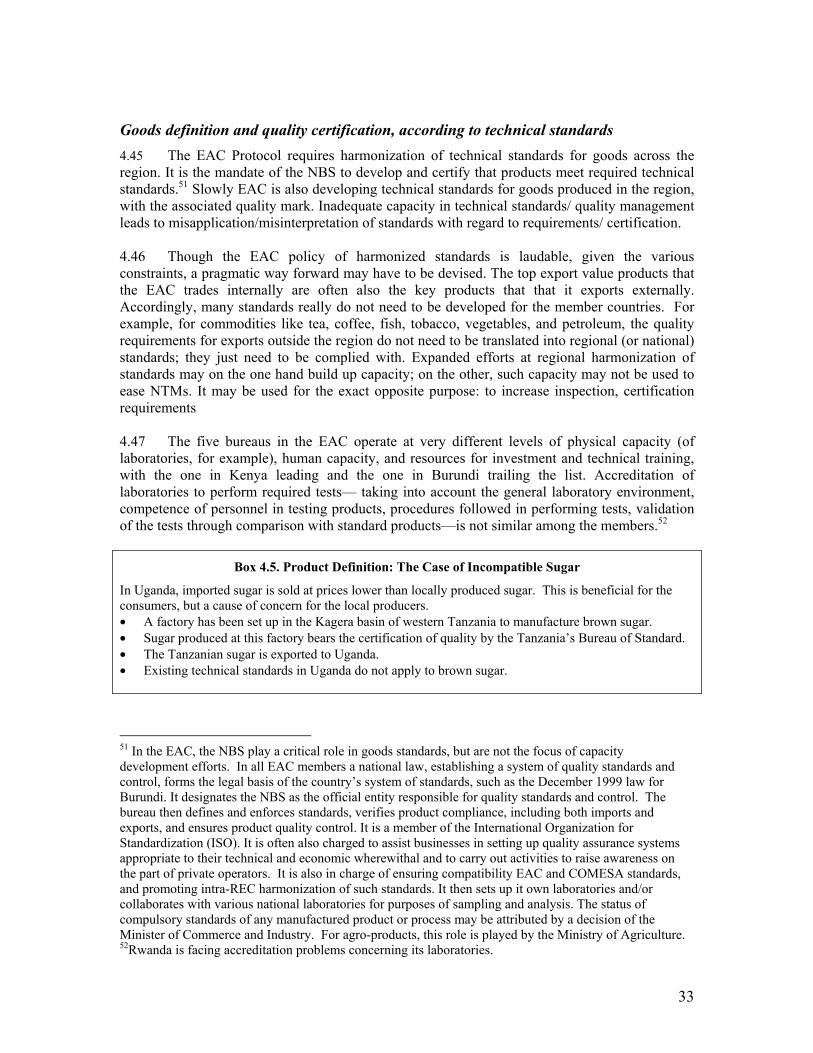
33
Goods definition and quality certification, according to technical standards 4.45 The EAC Protocol requires harmonization of technical standards for goods across the region. It is the mandate of the NBS to develop and certify that products meet required technical standards.51 Slowly EAC is also developing technical standards for goods produced in the region, with the associated quality mark. Inadequate capacity in technical standards/ quality management leads to misapplication/misinterpretation of standards with regard to requirements/ certification. 4.46 Though the EAC policy of harmonized standards is laudable, given the various constraints, a pragmatic way forward may have to be devised. The top export value products that the EAC trades internally are often also the key products that that it exports externally. Accordingly, many standards really do not need to be developed for the member countries. For example, for commodities like tea, coffee, fish, tobacco, vegetables, and petroleum, the quality requirements for exports outside the region do not need to be translated into regional (or national) standards; they just need to be complied with. Expanded efforts at regional harmonization of standards may on the one hand build up capacity; on the other, such capacity may not be used to ease NTMs. It may be used for the exact opposite purpose: to increase inspection, certification requirements 4.47 The five bureaus in the EAC operate at very different levels of physical capacity (of laboratories, for example), human capacity, and resources for investment and technical training, with the one in Kenya leading and the one in Burundi trailing the list. Accreditation of laboratories to perform required tests— taking into account the general laboratory environment, competence of personnel in testing products, procedures followed in performing tests, validation of the tests through comparison with standard products—is not similar among the members.52
Box 4.5. Product Definition: The Case of Incompatible Sugar
In Uganda, imported sugar is sold at prices lower than locally produced sugar. This is beneficial for the consumers, but a cause of concern for the local producers. • A factory has been set up in the Kagera basin of western Tanzania to manufacture brown sugar. • Sugar produced at this factory bears the certification of quality by the Tanzania’s Bureau of Standard. • The Tanzanian sugar is exported to Uganda. • Existing technical standards in Uganda do not apply to brown sugar.
51 In the EAC, the NBS play a critical role in goods standards, but are not the focus of capacity development efforts. In all EAC members a national law, establishing a system of quality standards and control, forms the legal basis of the country’s system of standards, such as the December 1999 law for Burundi. It designates the NBS as the official entity responsible for quality standards and control. The bureau then defines and enforces standards, verifies product compliance, including both imports and exports, and ensures product quality control. It is a member of the International Organization for Standardization (ISO). It is often also charged to assist businesses in setting up quality assurance systems appropriate to their technical and economic wherewithal and to carry out activities to raise awareness on the part of private operators. It is also in charge of ensuring compatibility EAC and COMESA standards, and promoting intra-REC harmonization of such standards. It then sets up it own laboratories and/or collaborates with various national laboratories for purposes of sampling and analysis. The status of compulsory standards of any manufactured product or process may be attributed by a decision of the Minister of Commerce and Industry. For agro-products, this role is played by the Ministry of Agriculture. 52Rwanda is facing accreditation problems concerning its laboratories.
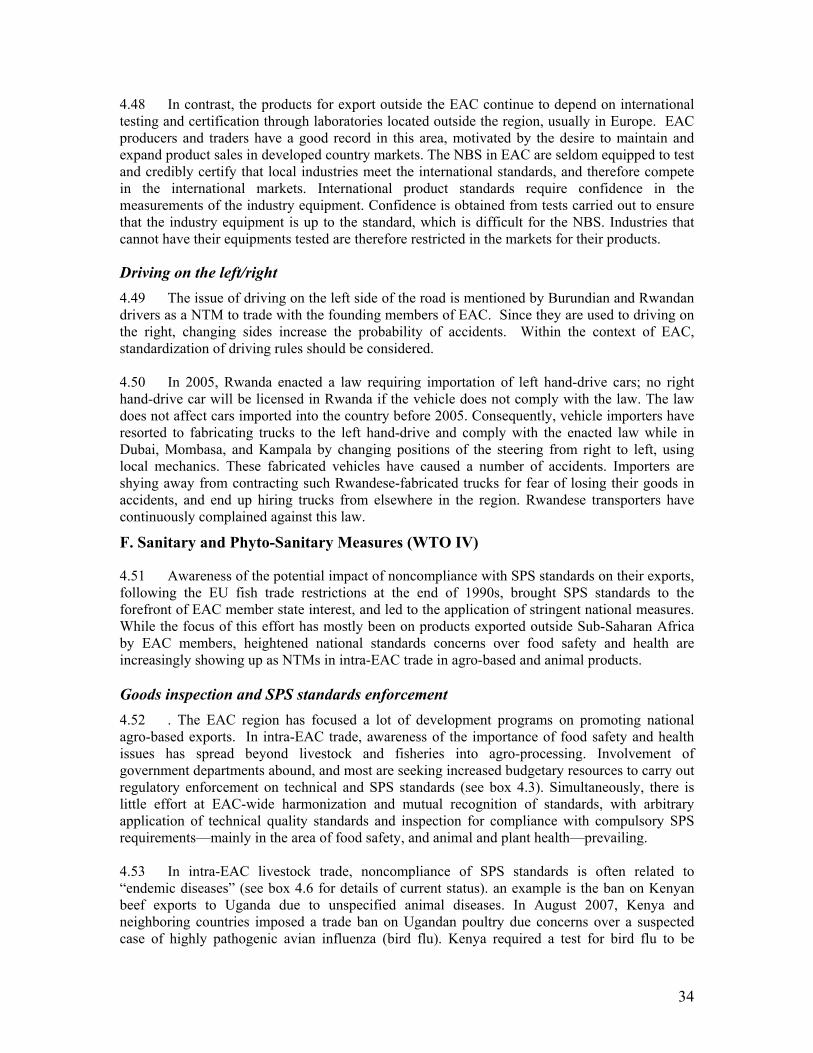
34
4.48 In contrast, the products for export outside the EAC continue to depend on international testing and certification through laboratories located outside the region, usually in Europe. EAC producers and traders have a good record in this area, motivated by the desire to maintain and expand product sales in developed country markets. The NBS in EAC are seldom equipped to test and credibly certify that local industries meet the international standards, and therefore compete in the international markets. International product standards require confidence in the measurements of the industry equipment. Confidence is obtained from tests carried out to ensure that the industry equipment is up to the standard, which is difficult for the NBS. Industries that cannot have their equipments tested are therefore restricted in the markets for their products.
Driving on the left/right 4.49 The issue of driving on the left side of the road is mentioned by Burundian and Rwandan drivers as a NTM to trade with the founding members of EAC. Since they are used to driving on the right, changing sides increase the probability of accidents. Within the context of EAC, standardization of driving rules should be considered. 4.50 In 2005, Rwanda enacted a law requiring importation of left hand-drive cars; no right hand-drive car will be licensed in Rwanda if the vehicle does not comply with the law. The law does not affect cars imported into the country before 2005. Consequently, vehicle importers have resorted to fabricating trucks to the left hand-drive and comply with the enacted law while in Dubai, Mombasa, and Kampala by changing positions of the steering from right to left, using local mechanics. These fabricated vehicles have caused a number of accidents. Importers are shying away from contracting such Rwandese-fabricated trucks for fear of losing their goods in accidents, and end up hiring trucks from elsewhere in the region. Rwandese transporters have continuously complained against this law.
F. Sanitary and Phyto-Sanitary Measures (WTO IV)
4.51 Awareness of the potential impact of noncompliance with SPS standards on their exports, following the EU fish trade restrictions at the end of 1990s, brought SPS standards to the forefront of EAC member state interest, and led to the application of stringent national measures. While the focus of this effort has mostly been on products exported outside Sub-Saharan Africa by EAC members, heightened national standards concerns over food safety and health are increasingly showing up as NTMs in intra-EAC trade in agro-based and animal products. Goods inspection and SPS standards enforcement 4.52 . The EAC region has focused a lot of development programs on promoting national agro-based exports. In intra-EAC trade, awareness of the importance of food safety and health issues has spread beyond livestock and fisheries into agro-processing. Involvement of government departments abound, and most are seeking increased budgetary resources to carry out regulatory enforcement on technical and SPS standards (see box 4.3). Simultaneously, there is little effort at EAC-wide harmonization and mutual recognition of standards, with arbitrary application of technical quality standards and inspection for compliance with compulsory SPS requirements—mainly in the area of food safety, and animal and plant health—prevailing. 4.53 In intra-EAC livestock trade, noncompliance of SPS standards is often related to “endemic diseases” (see box 4.6 for details of current status). an example is the ban on Kenyan beef exports to Uganda due to unspecified animal diseases. In August 2007, Kenya and neighboring countries imposed a trade ban on Ugandan poultry due concerns over a suspected case of highly pathogenic avian influenza (bird flu). Kenya required a test for bird flu to be
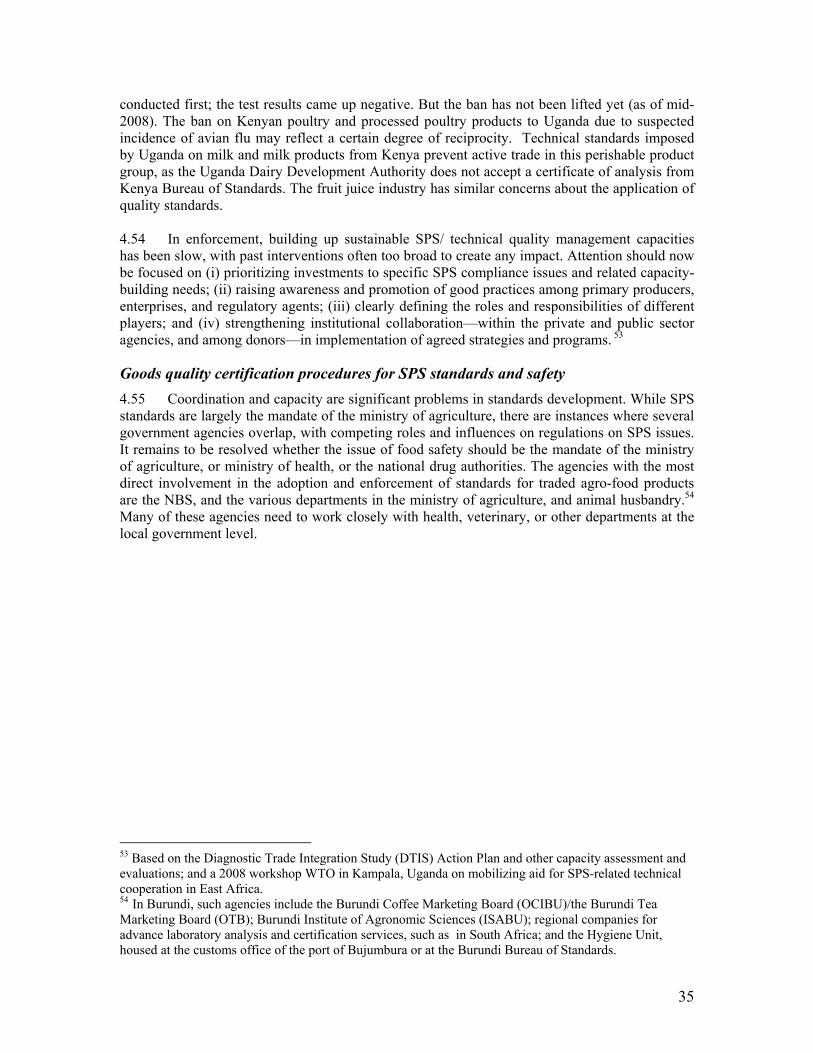
35
conducted first; the test results came up negative. But the ban has not been lifted yet (as of mid-2008). The ban on Kenyan poultry and processed poultry products to Uganda due to suspected incidence of avian flu may reflect a certain degree of reciprocity. Technical standards imposed by Uganda on milk and milk products from Kenya prevent active trade in this perishable product group, as the Uganda Dairy Development Authority does not accept a certificate of analysis from Kenya Bureau of Standards. The fruit juice industry has similar concerns about the application of quality standards.
4.54 In enforcement, building up sustainable SPS/ technical quality management capacities has been slow, with past interventions often too broad to create any impact. Attention should now be focused on (i) prioritizing investments to specific SPS compliance issues and related capacity-building needs; (ii) raising awareness and promotion of good practices among primary producers, enterprises, and regulatory agents; (iii) clearly defining the roles and responsibilities of different players; and (iv) strengthening institutional collaboration—within the private and public sector agencies, and among donors—in implementation of agreed strategies and programs. 53
Goods quality certification procedures for SPS standards and safety 4.55 Coordination and capacity are significant problems in standards development. While SPS standards are largely the mandate of the ministry of agriculture, there are instances where several government agencies overlap, with competing roles and influences on regulations on SPS issues. It remains to be resolved whether the issue of food safety should be the mandate of the ministry of agriculture, or ministry of health, or the national drug authorities. The agencies with the most direct involvement in the adoption and enforcement of standards for traded agro-food products are the NBS, and the various departments in the ministry of agriculture, and animal husbandry.54 Many of these agencies need to work closely with health, veterinary, or other departments at the local government level.
53 Based on the Diagnostic Trade Integration Study (DTIS) Action Plan and other capacity assessment and evaluations; and a 2008 workshop WTO in Kampala, Uganda on mobilizing aid for SPS-related technical cooperation in East Africa. 54 In Burundi, such agencies include the Burundi Coffee Marketing Board (OCIBU)/the Burundi Tea Marketing Board (OTB); Burundi Institute of Agronomic Sciences (ISABU); regional companies for advance laboratory analysis and certification services, such as in South Africa; and the Hygiene Unit, housed at the customs office of the port of Bujumbura or at the Burundi Bureau of Standards.
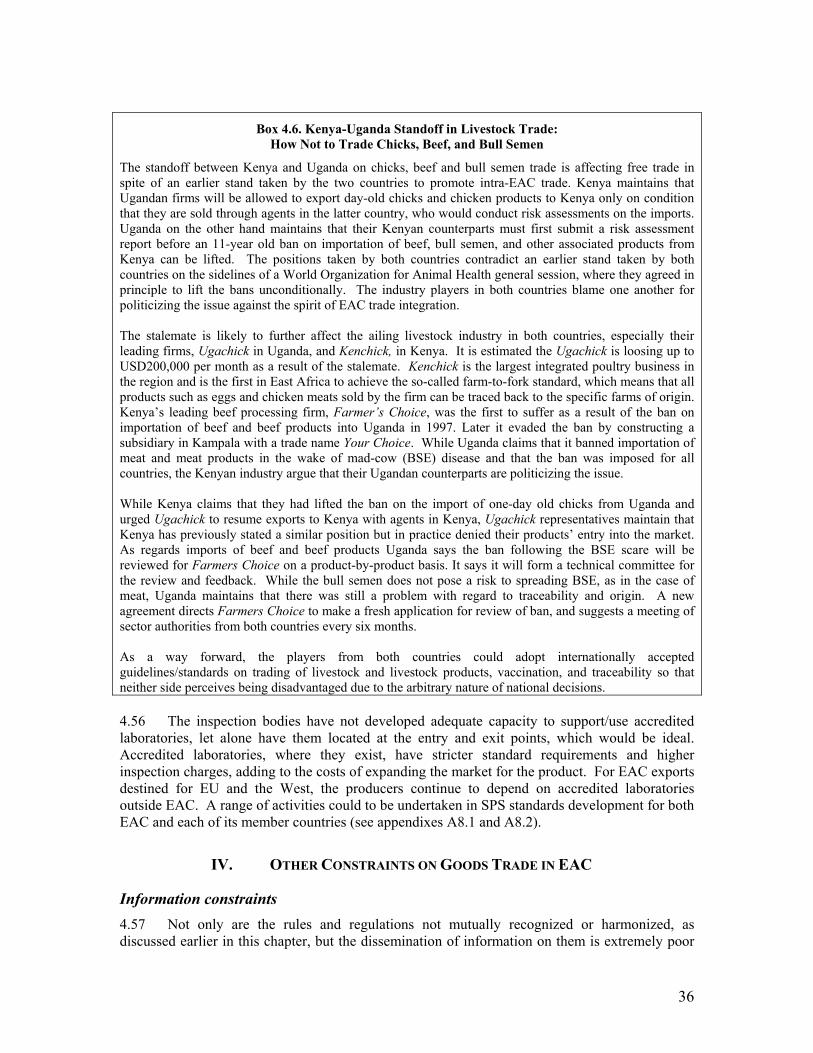
36
Box 4.6. Kenya-Uganda Standoff in Livestock Trade: How Not to Trade Chicks, Beef, and Bull Semen
The standoff between Kenya and Uganda on chicks, beef and bull semen trade is affecting free trade in spite of an earlier stand taken by the two countries to promote intra-EAC trade. Kenya maintains that Ugandan firms will be allowed to export day-old chicks and chicken products to Kenya only on condition that they are sold through agents in the latter country, who would conduct risk assessments on the imports. Uganda on the other hand maintains that their Kenyan counterparts must first submit a risk assessment report before an 11-year old ban on importation of beef, bull semen, and other associated products from Kenya can be lifted. The positions taken by both countries contradict an earlier stand taken by both countries on the sidelines of a World Organization for Animal Health general session, where they agreed in principle to lift the bans unconditionally. The industry players in both countries blame one another for politicizing the issue against the spirit of EAC trade integration. The stalemate is likely to further affect the ailing livestock industry in both countries, especially their leading firms, Ugachick in Uganda, and Kenchick, in Kenya. It is estimated the Ugachick is loosing up to USD200,000 per month as a result of the stalemate. Kenchick is the largest integrated poultry business in the region and is the first in East Africa to achieve the so-called farm-to-fork standard, which means that all products such as eggs and chicken meats sold by the firm can be traced back to the specific farms of origin. Kenya’s leading beef processing firm, Farmer’s Choice, was the first to suffer as a result of the ban on importation of beef and beef products into Uganda in 1997. Later it evaded the ban by constructing a subsidiary in Kampala with a trade name Your Choice. While Uganda claims that it banned importation of meat and meat products in the wake of mad-cow (BSE) disease and that the ban was imposed for all countries, the Kenyan industry argue that their Ugandan counterparts are politicizing the issue. While Kenya claims that they had lifted the ban on the import of one-day old chicks from Uganda and urged Ugachick to resume exports to Kenya with agents in Kenya, Ugachick representatives maintain that Kenya has previously stated a similar position but in practice denied their products’ entry into the market. As regards imports of beef and beef products Uganda says the ban following the BSE scare will be reviewed for Farmers Choice on a product-by-product basis. It says it will form a technical committee for the review and feedback. While the bull semen does not pose a risk to spreading BSE, as in the case of meat, Uganda maintains that there was still a problem with regard to traceability and origin. A new agreement directs Farmers Choice to make a fresh application for review of ban, and suggests a meeting of sector authorities from both countries every six months. As a way forward, the players from both countries could adopt internationally accepted guidelines/standards on trading of livestock and livestock products, vaccination, and traceability so that neither side perceives being disadvantaged due to the arbitrary nature of national decisions. 4.56 The inspection bodies have not developed adequate capacity to support/use accredited laboratories, let alone have them located at the entry and exit points, which would be ideal. Accredited laboratories, where they exist, have stricter standard requirements and higher inspection charges, adding to the costs of expanding the market for the product. For EAC exports destined for EU and the West, the producers continue to depend on accredited laboratories outside EAC. A range of activities could to be undertaken in SPS standards development for both EAC and each of its member countries (see appendixes A8.1 and A8.2).
IV. OTHER CONSTRAINTS ON GOODS TRADE IN EAC
Information constraints 4.57 Not only are the rules and regulations not mutually recognized or harmonized, as discussed earlier in this chapter, but the dissemination of information on them is extremely poor
37
across member states and within them. Traders are not aware of some of the decisions made at the EAC Council, such as the new transit regulations. At the borders, the customs agents often do not have the latest directives and/or forms from their revenue authorities, and truck drivers may not know the regulations specific to their cargo. Application of national legislations often appears to be arbitrary and protectionist, based on outdated/cumbersome import authorization systems. Insecurity/ highway crimes/loss of goods at the container freight stations 4.58 Heightened security concerns along the trade routes and highway thefts add to concerns for traders and transporters. Along the Ugandan segment of the Northern Corridor, transporters who make night runs complain about acts of banditry. In 2007, 32 containers were lost to thieves and a number of people lost their lives on the way to Kampala. The events that unfolded after the December 2007 election in Kenya led to one of the worst spurts of highway crimes witnessed in Kenya. Users of the Kigoma port in Tanzania note frequent thefts of goods during transshipment operations. In Burundian territory, night travel is banned because of the prevailing lack of security. Operation of the CFSs at various locations is affected by pilferage of cargo. Importers end up losing their goods and are often unable to lodge claims because they do not know whose responsibility it is to pay for the claims. Influx of counterfeit products 4.59 Trade in counterfeit and adulterated products is spreading for goods entering through the two sea ports and across the EAC’s common external border. The regulatory authorities have inadequate financial and human resources to curb the problem of counterfeits practices. The sale of these products unfairly competes with the legitimate industry within the EAC, and more importantly adds unnecessary risk for the users. Only recently have member state parliaments approved laws to deal with the problem of counterfeits. 4.60 For example, in 2004 in Uganda about 50 metric tonnes of counterfeit goods were impounded by the Uganda National Bureau of Standards (UNBS) because they failed to meet the minimum quality standards. These included foodstuffs, soft drinks, salt, cosmetics, clothes, building materials such as cement, and other manufactured goods. According to officials at UNBS, counterfeit goods worth over USh 600 million were either denied market in Uganda (returned) or destroyed by inspection units at various border points. Other affected products are pens (the case between Mulwana and Picfare), tiger head battery, textiles, and foam products (the case between Euro foam and Vita Foam), tooth brush (the case between Mulwana ship toothbrush and another firm that produced the same model at a German factory).
Informal trade 4.61 The borders of the EAC’s member states are inherited from a colonial era that split communities that shared historical trading, cultural, and family links. Hence, historically cross-border trade in the region has been informal, has not passed through the major border crossings, and has been in small-scale/small value transactions that do not attract much attention of border authorities or are captured in official statistics. A large part of this trade comprises day-to-day transactions between traders living in locations near the national borders. Most commodities crossing borders are absorbed by the local markets along the border. It is usually carried in small quantities on bicycles, or in “caveras” (polythene bags). Identifying cross-border illicit trade of this nature is not straightforward because the items are easily claimed as goods for personal use or gifts from relatives. The case of grains trade in the EAC is considered in box 4.7. 4.62 In addition to the traditional informal trade, smuggling or illegal sale of high value commodities occurs across the national borders of EAC member states. For example, even with
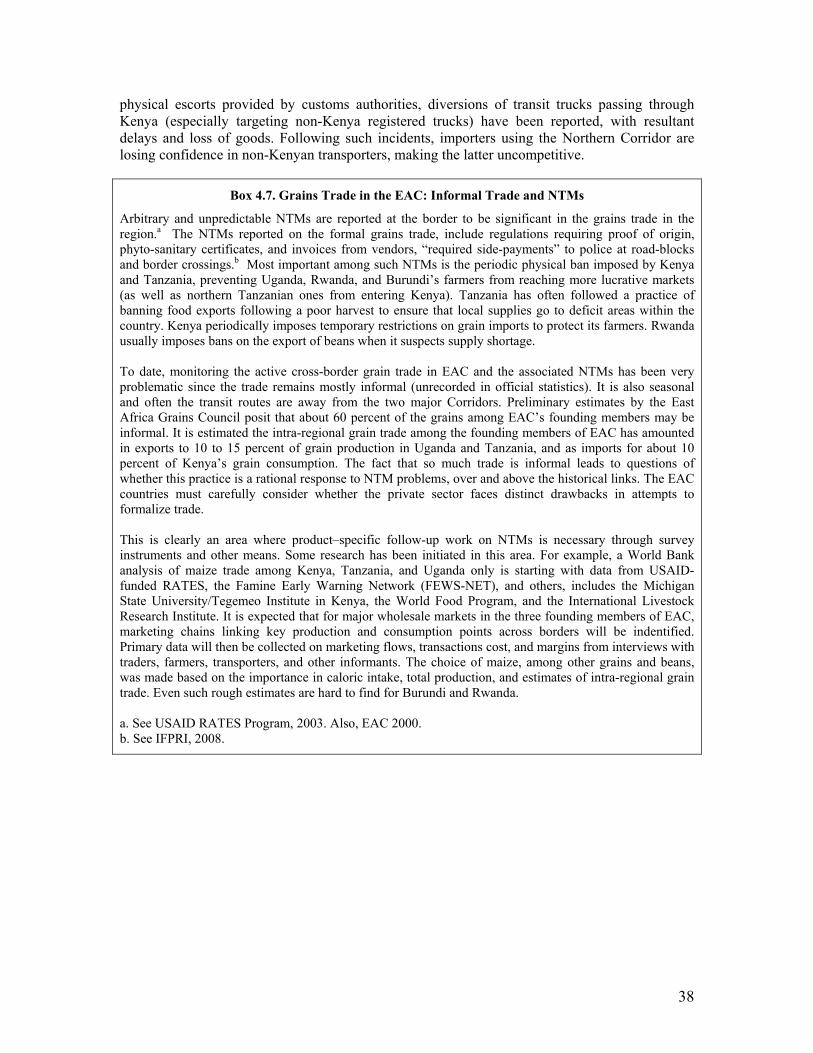
38
physical escorts provided by customs authorities, diversions of transit trucks passing through Kenya (especially targeting non-Kenya registered trucks) have been reported, with resultant delays and loss of goods. Following such incidents, importers using the Northern Corridor are losing confidence in non-Kenyan transporters, making the latter uncompetitive.
Box 4.7. Grains Trade in the EAC: Informal Trade and NTMs
Arbitrary and unpredictable NTMs are reported at the border to be significant in the grains trade in the region.a The NTMs reported on the formal grains trade, include regulations requiring proof of origin, phyto-sanitary certificates, and invoices from vendors, “required side-payments” to police at road-blocks and border crossings.b Most important among such NTMs is the periodic physical ban imposed by Kenya and Tanzania, preventing Uganda, Rwanda, and Burundi’s farmers from reaching more lucrative markets (as well as northern Tanzanian ones from entering Kenya). Tanzania has often followed a practice of banning food exports following a poor harvest to ensure that local supplies go to deficit areas within the country. Kenya periodically imposes temporary restrictions on grain imports to protect its farmers. Rwanda usually imposes bans on the export of beans when it suspects supply shortage. To date, monitoring the active cross-border grain trade in EAC and the associated NTMs has been very problematic since the trade remains mostly informal (unrecorded in official statistics). It is also seasonal and often the transit routes are away from the two major Corridors. Preliminary estimates by the East Africa Grains Council posit that about 60 percent of the grains among EAC’s founding members may be informal. It is estimated the intra-regional grain trade among the founding members of EAC has amounted in exports to 10 to 15 percent of grain production in Uganda and Tanzania, and as imports for about 10 percent of Kenya’s grain consumption. The fact that so much trade is informal leads to questions of whether this practice is a rational response to NTM problems, over and above the historical links. The EAC countries must carefully consider whether the private sector faces distinct drawbacks in attempts to formalize trade. This is clearly an area where product–specific follow-up work on NTMs is necessary through survey instruments and other means. Some research has been initiated in this area. For example, a World Bank analysis of maize trade among Kenya, Tanzania, and Uganda only is starting with data from USAID-funded RATES, the Famine Early Warning Network (FEWS-NET), and others, includes the Michigan State University/Tegemeo Institute in Kenya, the World Food Program, and the International Livestock Research Institute. It is expected that for major wholesale markets in the three founding members of EAC, marketing chains linking key production and consumption points across borders will be indentified. Primary data will then be collected on marketing flows, transactions cost, and margins from interviews with traders, farmers, transporters, and other informants. The choice of maize, among other grains and beans, was made based on the importance in caloric intake, total production, and estimates of intra-regional grain trade. Even such rough estimates are hard to find for Burundi and Rwanda. a. See USAID RATES Program, 2003. Also, EAC 2000. b. See IFPRI, 2008.
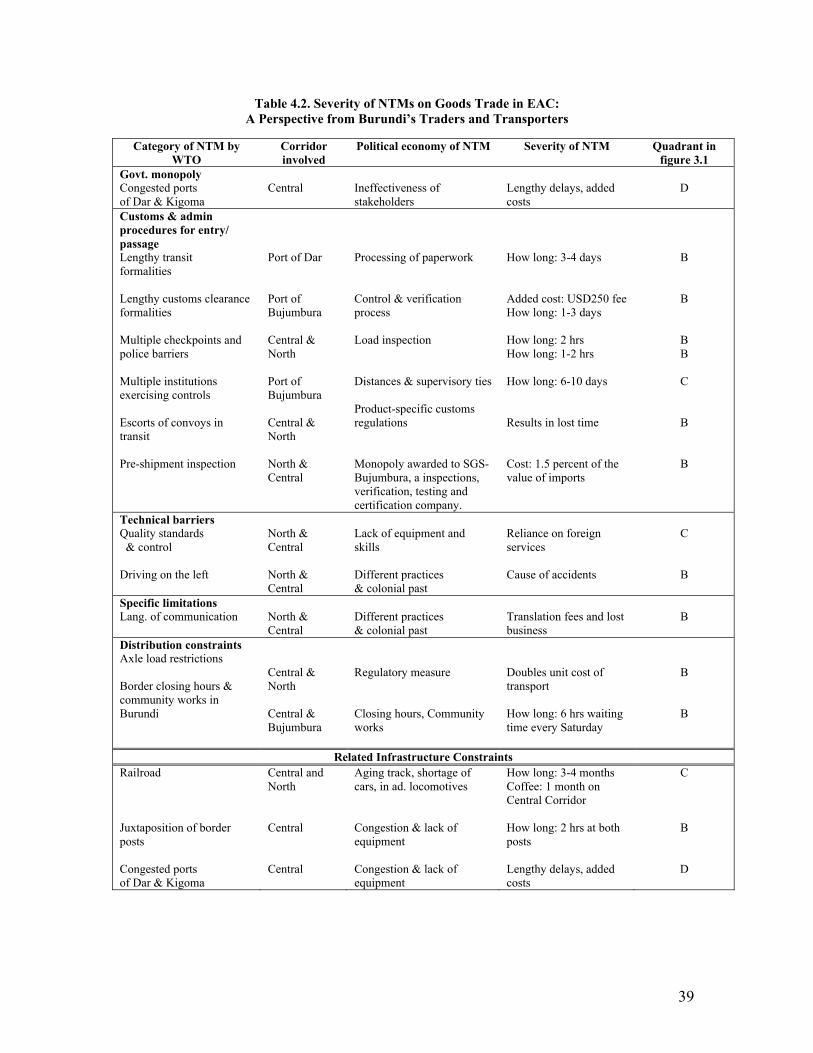
39
Table 4.2. Severity of NTMs on Goods Trade in EAC: A Perspective from Burundi’s Traders and Transporters
Category of NTM by
WTO Corridor involved
Political economy of NTM Severity of NTM Quadrant in figure 3.1
Govt. monopoly Congested ports of Dar & Kigoma
Central
Ineffectiveness of stakeholders
Lengthy delays, added costs
D
Customs & admin procedures for entry/ passage Lengthy transit formalities Lengthy customs clearance formalities Multiple checkpoints and police barriers Multiple institutions exercising controls Escorts of convoys in transit Pre-shipment inspection
Port of Dar Port of Bujumbura Central & North Port of Bujumbura Central & North North & Central
Processing of paperwork Control & verification process Load inspection Distances & supervisory ties Product-specific customs regulations Monopoly awarded to SGS-Bujumbura, a inspections, verification, testing and certification company.
How long: 3-4 days Added cost: USD250 fee How long: 1-3 days How long: 2 hrs How long: 1-2 hrs How long: 6-10 days Results in lost time Cost: 1.5 percent of the value of imports
B
B
B B
C
B
B
Technical barriers Quality standards & control Driving on the left
North & Central North & Central
Lack of equipment and skills Different practices & colonial past
Reliance on foreign services Cause of accidents
C
B
Specific limitations Lang. of communication
North & Central
Different practices & colonial past
Translation fees and lost business
B
Distribution constraints Axle load restrictions Border closing hours & community works in Burundi
Central & North Central & Bujumbura
Regulatory measure Closing hours, Community works
Doubles unit cost of transport How long: 6 hrs waiting time every Saturday
B
B
Related Infrastructure Constraints Railroad Juxtaposition of border posts Congested ports of Dar & Kigoma
Central and North Central Central
Aging track, shortage of cars, in ad. locomotives Congestion & lack of equipment Congestion & lack of equipment
How long: 3-4 months Coffee: 1 month on Central Corridor How long: 2 hrs at both posts Lengthy delays, added costs
C
B
D
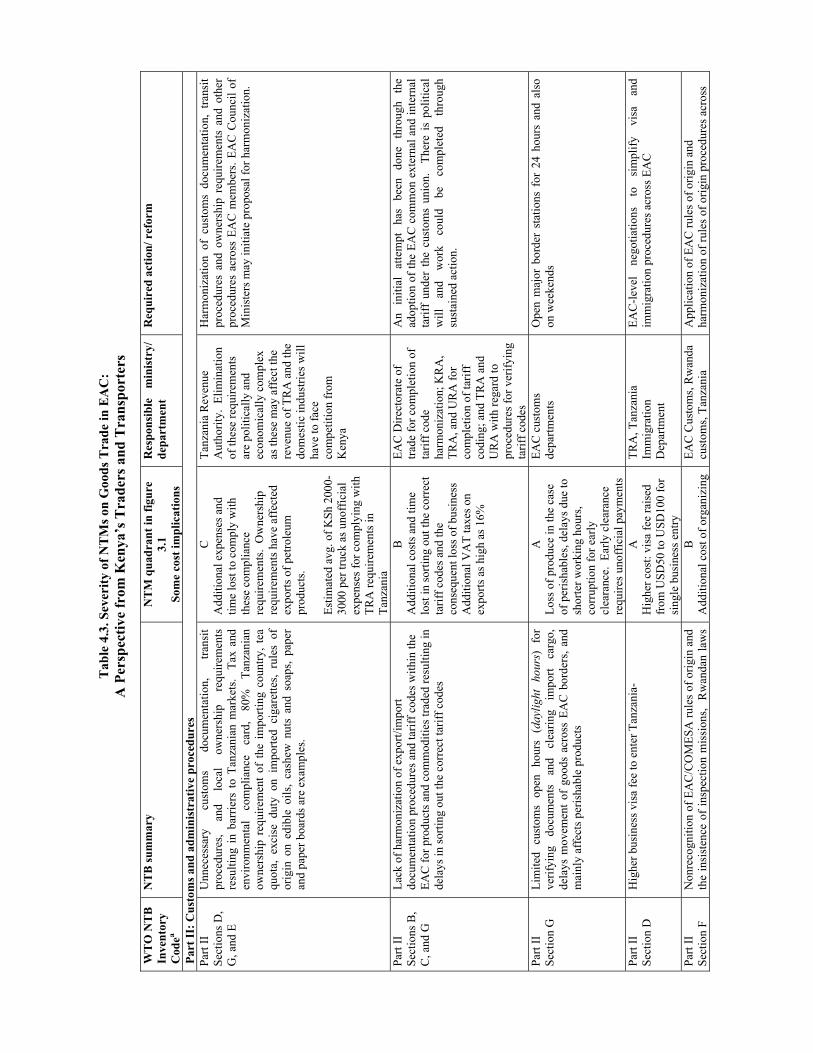
Tab
le 4
.3. S
ever
ity o
f NT
Ms o
n G
oods
Tra
de in
EA
C:
A P
ersp
ectiv
e fr
om K
enya
’s T
rade
rs a
nd T
rans
port
ers
W
TO
NT
B
Inve
ntor
y C
odea
NT
B su
mm
ary
NT
M q
uadr
ant i
n fig
ure
3.1
Som
e co
st im
plic
atio
ns
Res
pons
ible
m
inis
try/
de
part
men
t R
equi
red
actio
n/ r
efor
m
Part
II: C
usto
ms a
nd a
dmin
istr
ativ
e pr
oced
ures
Pa
rt II
Se
ctio
ns D
, G
, and
E
Unn
eces
sary
cu
stom
s do
cum
enta
tion,
tra
nsit
proc
edur
es,
and
loca
l ow
ners
hip
requ
irem
ents
re
sulti
ng i
n ba
rrie
rs t
o Ta
nzan
ian
mar
kets
. Ta
x an
d en
viro
nmen
tal
com
plia
nce
card
, 80
%
Tanz
ania
n ow
ners
hip
requ
irem
ent
of t
he i
mpo
rting
cou
ntry
, tea
qu
ota,
exc
ise
duty
on
impo
rted
ciga
rette
s, ru
les
of
orig
in o
n ed
ible
oils
, ca
shew
nut
s an
d so
aps,
pape
r an
d pa
per b
oard
s are
exa
mpl
es.
C
Add
ition
al e
xpen
ses a
nd
time
lost
to c
ompl
y w
ith
thes
e co
mpl
ianc
e re
quire
men
ts.
Ow
ners
hip
requ
irem
ents
hav
e af
fect
ed
expo
rts o
f pet
role
um
prod
ucts
. Es
timat
ed a
vg. o
f KSh
200
0-30
00 p
er tr
uck
as u
noff
icia
l ex
pens
es fo
r com
plyi
ng w
ith
TRA
requ
irem
ents
in
Tanz
ania
Tanz
ania
Rev
enue
A
utho
rity.
Elim
inat
ion
of th
ese
requ
irem
ents
ar
e po
litic
ally
and
ec
onom
ical
ly c
ompl
ex
as th
ese
may
aff
ect t
he
reve
nue
of T
RA
and
the
dom
estic
indu
strie
s will
ha
ve to
face
co
mpe
titio
n fr
om
Ken
ya
Har
mon
izat
ion
of c
usto
ms
docu
men
tatio
n, t
rans
it pr
oced
ures
and
ow
ners
hip
requ
irem
ents
and
oth
er
proc
edur
es a
cros
s EA
C m
embe
rs. E
AC
Cou
ncil
of
Min
iste
rs m
ay in
itiat
e pr
opos
al fo
r har
mon
izat
ion.
Part
II
Sect
ions
B,
C, a
nd G
Lack
of h
arm
oniz
atio
n of
exp
ort/i
mpo
rt do
cum
enta
tion
proc
edur
es a
nd ta
riff c
odes
with
in th
e EA
C fo
r pro
duct
s and
com
mod
ities
trad
ed re
sulti
ng in
de
lays
in so
rting
out
the
corr
ect t
ariff
cod
es
B
Add
ition
al c
osts
and
tim
e lo
st in
sorti
ng o
ut th
e co
rrec
t ta
riff c
odes
and
the
cons
eque
nt lo
ss o
f bus
ines
s A
dditi
onal
VA
T ta
xes o
n ex
ports
as h
igh
as 1
6%
EAC
Dire
ctor
ate
of
trade
for c
ompl
etio
n of
ta
riff c
ode
harm
oniz
atio
n; K
RA
, TR
A, a
nd U
RA
for
com
plet
ion
of ta
riff
codi
ng; a
nd T
RA
and
U
RA
with
rega
rd to
pr
oced
ures
for v
erify
ing
tarif
f cod
es
An
initi
al
atte
mpt
ha
s be
en
done
th
roug
h th
e ad
optio
n of
the
EAC
com
mon
ext
erna
l and
inte
rnal
ta
riff
unde
r th
e cu
stom
s un
ion.
Th
ere
is p
oliti
cal
will
an
d w
ork
coul
d be
co
mpl
eted
th
roug
h su
stai
ned
actio
n.
Part
II
Sect
ion
G
Lim
ited
cust
oms
open
hou
rs (
dayl
ight
hou
rs)
for
verif
ying
do
cum
ents
an
d cl
earin
g im
port
carg
o,
dela
ys m
ovem
ent o
f go
ods
acro
ss E
AC
bor
ders
, and
m
ainl
y af
fect
s per
isha
ble
prod
ucts
A
Loss
of p
rodu
ce in
the
case
of
per
isha
bles
, del
ays d
ue to
sh
orte
r wor
king
hou
rs,
corr
uptio
n fo
r ear
ly
clea
ranc
e. E
arly
cle
aran
ce
requ
ires u
noff
icia
l pay
men
ts
EAC
cus
tom
s de
partm
ents
O
pen
maj
or b
orde
r st
atio
ns f
or 2
4 ho
urs
and
also
on
wee
kend
s
Part
II
Sect
ion
D
Hig
her b
usin
ess v
isa
fee
to e
nter
Tan
zani
a-
A
Hig
her c
ost:
visa
fee
rais
ed
from
USD
50 to
USD
100
for
sing
le b
usin
ess e
ntry
TRA
, Tan
zani
a Im
mig
ratio
n D
epar
tmen
t
EAC
-leve
l ne
gotia
tions
to
si
mpl
ify
visa
an
d im
mig
ratio
n pr
oced
ures
acr
oss E
AC
Part
II
Sect
ion
F N
onre
cogn
ition
of E
AC
/CO
MES
A ru
les o
f orig
in a
nd
the
insi
sten
ce o
f ins
pect
ion
mis
sion
s, R
wan
dan
law
s B
A
dditi
onal
cos
t of o
rgan
izin
g EA
C C
usto
ms,
Rw
anda
cu
stom
s, Ta
nzan
ia
App
licat
ion
of E
AC
rule
s of o
rigin
and
ha
rmon
izat
ion
of ru
les o
f orig
in p
roce
dure
s acr
oss
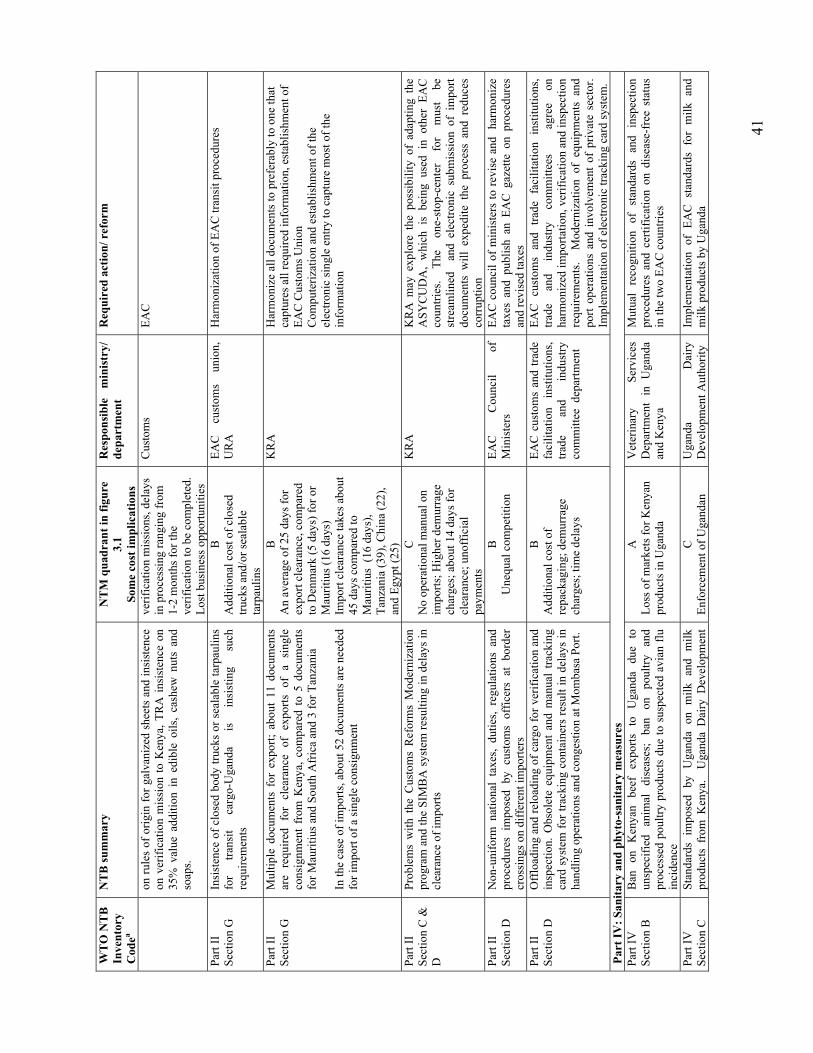
41
WT
O N
TB
In
vent
ory
Cod
ea
NT
B su
mm
ary
NT
M q
uadr
ant i
n fig
ure
3.1
Som
e co
st im
plic
atio
ns
Res
pons
ible
m
inis
try/
de
part
men
t R
equi
red
actio
n/ r
efor
m
on ru
les
of o
rigin
for g
alva
nize
d sh
eets
and
insi
sten
ce
on v
erifi
catio
n m
issi
on to
Ken
ya, T
RA
insi
sten
ce o
n 35
% v
alue
add
ition
in
edib
le o
ils,
cash
ew n
uts
and
soap
s.
verif
icat
ion
mis
sion
s, de
lays
in
pro
cess
ing
rang
ing
from
1-
2 m
onth
s for
the
verif
icat
ion
to b
e co
mpl
eted
. Lo
st b
usin
ess o
ppor
tuni
ties
Cus
tom
s EA
C
Part
II
Sect
ion
G
Insi
sten
ce o
f clo
sed
body
truc
ks o
r sea
labl
e ta
rpau
lins
for
trans
it ca
rgo-
Uga
nda
is
insi
stin
g su
ch
requ
irem
ents
B
Add
ition
al c
ost o
f clo
sed
truck
s and
/or s
eala
ble
tarp
aulin
s
EAC
cu
stom
s un
ion,
U
RA
H
arm
oniz
atio
n of
EA
C tr
ansi
t pro
cedu
res
Part
II
Sect
ion
G
Mul
tiple
doc
umen
ts f
or e
xpor
t; ab
out
11 d
ocum
ents
ar
e re
quire
d fo
r cl
eara
nce
of e
xpor
ts o
f a
sing
le
cons
ignm
ent
from
Ken
ya, c
ompa
red
to 5
doc
umen
ts
for M
aurit
ius a
nd S
outh
Afr
ica
and
3 fo
r Tan
zani
a In
the
case
of i
mpo
rts, a
bout
52
docu
men
ts a
re n
eede
d fo
r im
port
of a
sing
le c
onsi
gnm
ent
B
An
aver
age
of 2
5 da
ys fo
r ex
port
clea
ranc
e, c
ompa
red
to D
enm
ark
(5 d
ays)
for o
r M
aurit
ius (
16 d
ays)
Im
port
clea
ranc
e ta
kes a
bout
45
day
s com
pare
d to
M
aurit
ius
(16
days
), Ta
nzan
ia (3
9), C
hina
(22)
, an
d Eg
ypt (
25)
KR
A
Har
mon
ize
all d
ocum
ents
to p
refe
rabl
y to
one
that
ca
ptur
es a
ll re
quire
d in
form
atio
n, e
stab
lishm
ent o
f EA
C C
usto
ms U
nion
C
ompu
teriz
atio
n an
d es
tabl
ishm
ent o
f the
el
ectro
nic
sing
le e
ntry
to c
aptu
re m
ost o
f the
in
form
atio
n
Part
II
Sect
ion
C &
D
Prob
lem
s w
ith t
he C
usto
ms
Ref
orm
s M
oder
niza
tion
prog
ram
and
the
SIM
BA
sys
tem
resu
lting
in d
elay
s in
cl
eara
nce
of im
ports
C
No
oper
atio
nal m
anua
l on
impo
rts; H
ighe
r dem
urra
ge
char
ges;
abo
ut 1
4 da
ys fo
r cl
eara
nce;
uno
ffic
ial
paym
ents
KR
A
KR
A m
ay e
xplo
re t
he p
ossi
bilit
y of
ada
ptin
g th
e A
SYC
UD
A,
whi
ch i
s be
ing
used
in
othe
r EA
C
coun
tries
. Th
e on
e-st
op-c
ente
r fo
r m
ust
be
stre
amlin
ed
and
elec
troni
c su
bmis
sion
of
impo
rt do
cum
ents
will
exp
edite
the
pro
cess
and
red
uces
co
rrup
tion
Part
II
Sect
ion
D
Non
-uni
form
nat
iona
l ta
xes,
dutie
s, re
gula
tions
and
pr
oced
ures
im
pose
d by
cus
tom
s of
ficer
s at
bor
der
cros
sing
s on
diff
eren
t im
porte
rs
B
Une
qual
com
petit
ion
EAC
C
ounc
il of
M
inis
ters
EA
C c
ounc
il of
min
iste
rs to
revi
se a
nd h
arm
oniz
e ta
xes
and
publ
ish
an E
AC
gaz
ette
on
proc
edur
es
and
revi
sed
taxe
s Pa
rt II
Se
ctio
n D
O
fflo
adin
g an
d re
load
ing
of c
argo
for v
erifi
catio
n an
d in
spec
tion.
Obs
olet
e eq
uipm
ent
and
man
ual
track
ing
card
sys
tem
for t
rack
ing
cont
aine
rs re
sult
in d
elay
s in
ha
ndlin
g op
erat
ions
and
con
gest
ion
at M
omba
sa P
ort.
B
Add
ition
al c
ost o
f re
pack
agin
g; d
emur
rage
ch
arge
s; ti
me
dela
ys
EAC
cus
tom
s an
d tra
de
faci
litat
ion
inst
itutio
ns,
trade
an
d in
dust
ry
com
mitt
ee d
epar
tmen
t
EAC
cus
tom
s an
d tra
de f
acili
tatio
n in
stitu
tions
, tra
de
and
indu
stry
co
mm
ittee
s
agre
e on
ha
rmon
ized
impo
rtatio
n, v
erifi
catio
n an
d in
spec
tion
requ
irem
ents
. M
oder
niza
tion
of e
quip
men
ts a
nd
port
oper
atio
ns a
nd i
nvol
vem
ent
of p
rivat
e se
ctor
.
Impl
emen
tatio
n of
ele
ctro
nic
track
ing
card
syst
em.
Pa
rt IV
: San
itary
and
phy
to-s
anita
ry m
easu
res
Part
IV
Sect
ion
B
Ban
on
K
enya
n be
ef
expo
rts
to
Uga
nda
due
to
unsp
ecifi
ed
anim
al
dise
ases
; ba
n on
po
ultry
an
d pr
oces
sed
poul
try p
rodu
cts
due
to s
uspe
cted
avi
an fl
u in
cide
nce
A
Loss
of m
arke
ts fo
r Ken
yan
prod
ucts
in U
gand
a
Vet
erin
ary
Serv
ices
D
epar
tmen
t in
Uga
nda
and
Ken
ya
Mut
ual
reco
gniti
on o
f st
anda
rds
and
insp
ectio
n pr
oced
ures
and
cer
tific
atio
n on
dis
ease
-fre
e st
atus
in
the
two
EAC
cou
ntrie
s
Part
IV
Sect
ion
C
Stan
dard
s im
pose
d by
Uga
nda
on m
ilk a
nd m
ilk
prod
ucts
fro
m K
enya
. U
gand
a D
airy
Dev
elop
men
t C
En
forc
emen
t of U
gand
an
Uga
nda
Dai
ry
Dev
elop
men
t Aut
horit
y Im
plem
enta
tion
of E
AC
sta
ndar
ds f
or m
ilk a
nd
milk
pro
duct
s by
Uga
nda
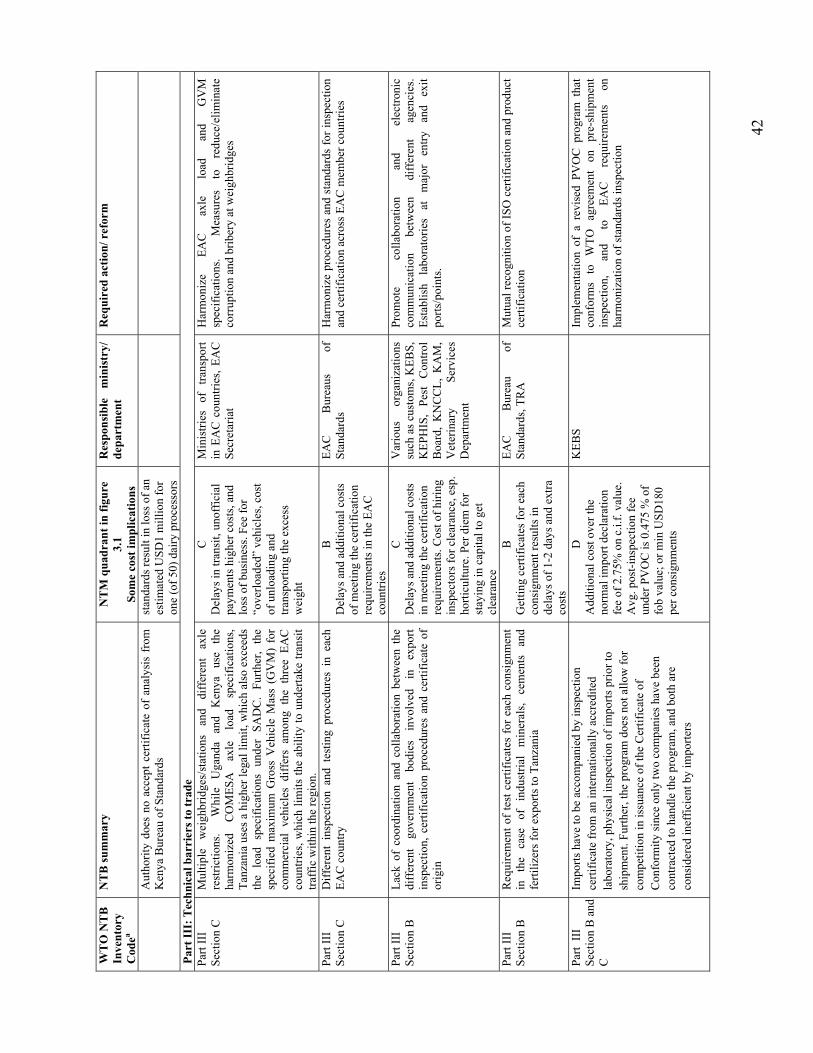
42
WT
O N
TB
In
vent
ory
Cod
ea
NT
B su
mm
ary
NT
M q
uadr
ant i
n fig
ure
3.1
Som
e co
st im
plic
atio
ns
Res
pons
ible
m
inis
try/
de
part
men
t R
equi
red
actio
n/ r
efor
m
Aut
horit
y do
es n
o ac
cept
cer
tific
ate
of a
naly
sis
from
K
enya
Bur
eau
of S
tand
ards
st
anda
rds r
esul
t in
loss
of a
n es
timat
ed U
SD1
mill
ion
for
one
(of 5
0) d
airy
pro
cess
ors
Part
III:
Tec
hnic
al b
arri
ers t
o tr
ade
Part
III
Sect
ion
C
Mul
tiple
w
eigh
brid
ges/
stat
ions
an
d di
ffer
ent
axle
re
stric
tions
.
Whi
le
Uga
nda
and
Ken
ya
use
the
harm
oniz
ed
CO
MES
A
axle
lo
ad
spec
ifica
tions
, Ta
nzan
ia u
ses a
hig
her l
egal
lim
it, w
hich
als
o ex
ceed
s th
e lo
ad s
peci
ficat
ions
und
er S
AD
C.
Furth
er,
the
spec
ified
max
imum
Gro
ss V
ehic
le M
ass
(GV
M)
for
com
mer
cial
veh
icle
s di
ffer
s am
ong
the
thre
e EA
C
coun
tries
, whi
ch li
mits
the
abili
ty to
und
erta
ke tr
ansi
t tra
ffic
with
in th
e re
gion
.
C
Del
ays i
n tra
nsit,
uno
ffic
ial
paym
ents
hig
her c
osts
, and
lo
ss o
f bus
ines
s. Fe
e fo
r “o
verlo
aded
” ve
hicl
es, c
ost
of u
nloa
ding
and
tra
nspo
rting
the
exce
ss
wei
ght
Min
istri
es
of
trans
port
in E
AC
cou
ntrie
s, EA
C
Secr
etar
iat
Har
mon
ize
EAC
ax
le
load
an
d G
VM
sp
ecifi
catio
ns.
M
easu
res
to
redu
ce/e
limin
ate
corr
uptio
n an
d br
iber
y at
wei
ghbr
idge
s
Part
III
Sect
ion
C
Diff
eren
t in
spec
tion
and
test
ing
proc
edur
es i
n ea
ch
EAC
cou
ntry
B
D
elay
s and
add
ition
al c
osts
of
mee
ting
the
certi
ficat
ion
requ
irem
ents
in th
e EA
C
coun
tries
EAC
B
urea
us
of
Stan
dard
s H
arm
oniz
e pr
oced
ures
and
sta
ndar
ds fo
r ins
pect
ion
and
certi
ficat
ion
acro
ss E
AC
mem
ber c
ount
ries
Part
III
Sect
ion
B
Lack
of
coor
dina
tion
and
colla
bora
tion
betw
een
the
diff
eren
t go
vern
men
t bo
dies
in
volv
ed
in
expo
rt in
spec
tion,
cer
tific
atio
n pr
oced
ures
and
cer
tific
ate
of
orig
in
C
Del
ays a
nd a
dditi
onal
cos
ts
in m
eetin
g th
e ce
rtific
atio
n re
quire
men
ts. C
ost o
f hiri
ng
insp
ecto
rs fo
r cle
aran
ce, e
sp.
horti
cultu
re. P
er d
iem
for
stay
ing
in c
apita
l to
get
clea
ranc
e
Var
ious
or
gani
zatio
ns
such
as c
usto
ms,
KEB
S,
KEP
HIS
, Pe
st
Con
trol
Boa
rd,
KN
CC
L, K
AM
, V
eter
inar
y Se
rvic
es
Dep
artm
ent
Prom
ote
colla
bora
tion
and
elec
troni
c co
mm
unic
atio
n be
twee
n di
ffer
ent
agen
cies
. Es
tabl
ish
labo
rato
ries
at
maj
or
entry
an
d ex
it po
rts/p
oint
s.
Part
III
Sect
ion
B
Req
uire
men
t of t
est c
ertif
icat
es fo
r eac
h co
nsig
nmen
t in
th
e ca
se
of
indu
stria
l m
iner
als,
cem
ents
an
d fe
rtiliz
ers f
or e
xpor
ts to
Tan
zani
a
B
Get
ting
certi
ficat
es fo
r eac
h co
nsig
nmen
t res
ults
in
dela
ys o
f 1-2
day
s and
ext
ra
cost
s
EAC
B
urea
u of
St
anda
rds,
TRA
M
utua
l rec
ogni
tion
of IS
O c
ertif
icat
ion
and
prod
uct
certi
ficat
ion
Part
III
Sect
ion
B a
nd
C
Impo
rts h
ave
to b
e ac
com
pani
ed b
y in
spec
tion
certi
ficat
e fr
om a
n in
tern
atio
nally
acc
redi
ted
labo
rato
ry, p
hysic
al in
spec
tion
of im
ports
prio
r to
ship
men
t. Fu
rther
, the
pro
gram
doe
s not
allo
w fo
r co
mpe
titio
n in
issu
ance
of t
he C
ertif
icat
e of
C
onfo
rmity
sinc
e on
ly tw
o co
mpa
nies
hav
e be
en
cont
ract
ed to
han
dle
the
prog
ram
, and
bot
h ar
e co
nsid
ered
inef
ficie
nt b
y im
porte
rs
D
Add
ition
al c
ost o
ver t
he
norm
al im
port
decl
arat
ion
fee
of 2
.75%
on
c.i.f
. val
ue.
Avg
. pos
t-ins
pect
ion
fee
unde
r PV
OC
is 0
.475
% o
f fo
b va
lue;
or m
in U
SD18
0 pe
r con
sign
men
ts
KEB
S Im
plem
enta
tion
of a
rev
ised
PV
OC
pro
gram
tha
t co
nfor
ms
to
WTO
ag
reem
ent
on
pre-
ship
men
t in
spec
tion,
an
d to
EA
C
requ
irem
ents
on
ha
rmon
izat
ion
of st
anda
rds i
nspe
ctio
n
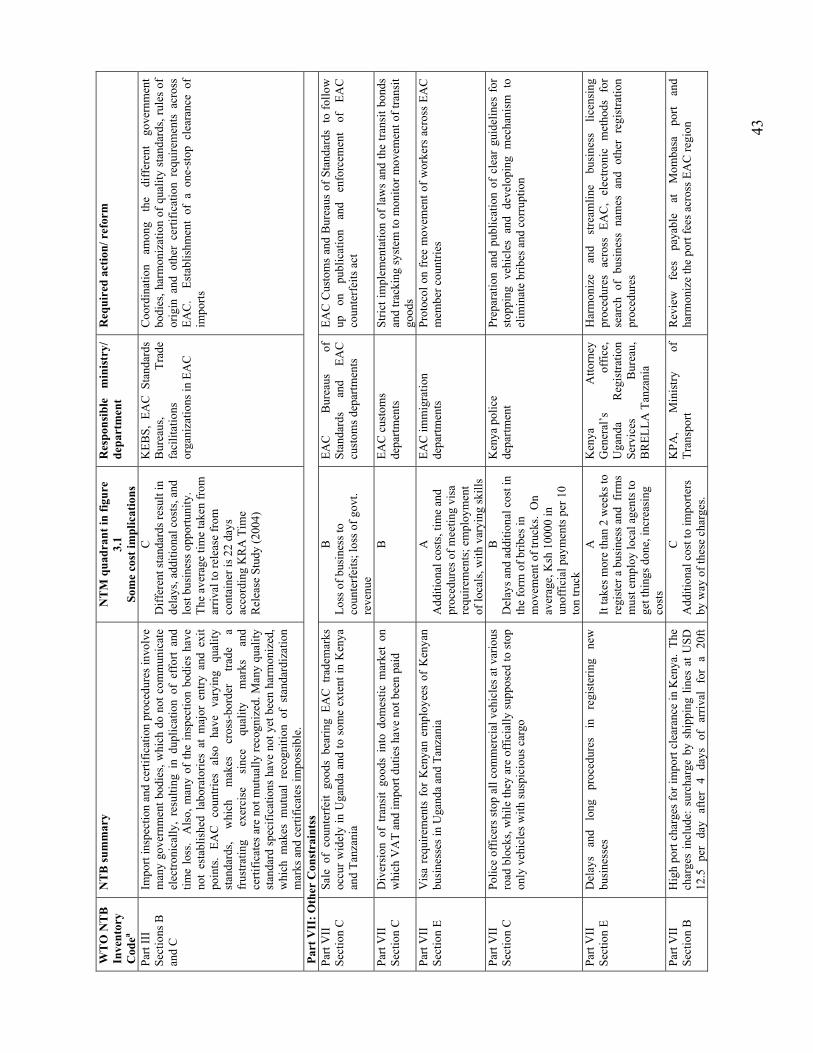
43
WT
O N
TB
In
vent
ory
Cod
ea
NT
B su
mm
ary
NT
M q
uadr
ant i
n fig
ure
3.1
Som
e co
st im
plic
atio
ns
Res
pons
ible
m
inis
try/
de
part
men
t R
equi
red
actio
n/ r
efor
m
Part
III
Sect
ions
B
and
C
Impo
rt in
spec
tion
and
certi
ficat
ion
proc
edur
es in
volv
e m
any
gove
rnm
ent b
odie
s, w
hich
do
not c
omm
unic
ate
elec
troni
cally
, re
sulti
ng i
n du
plic
atio
n of
eff
ort
and
time
loss
. A
lso,
man
y of
the
insp
ectio
n bo
dies
hav
e no
t es
tabl
ishe
d la
bora
torie
s at
maj
or e
ntry
and
exi
t po
ints
. EA
C
coun
tries
al
so
have
va
ryin
g qu
ality
st
anda
rds,
whi
ch
mak
es
cros
s-bo
rder
tra
de
a fr
ustra
ting
exer
cise
si
nce
qual
ity
mar
ks
and
certi
ficat
es a
re n
ot m
utua
lly re
cogn
ized
. Man
y qu
ality
st
anda
rd s
peci
ficat
ions
hav
e no
t yet
bee
n ha
rmon
ized
, w
hich
mak
es m
utua
l re
cogn
ition
of
stan
dard
izat
ion
mar
ks a
nd c
ertif
icat
es im
poss
ible
.
C
Diff
eren
t sta
ndar
ds re
sult
in
dela
ys, a
dditi
onal
cos
ts, a
nd
lost
bus
ines
s opp
ortu
nity
. Th
e av
erag
e tim
e ta
ken
from
ar
rival
to re
leas
e fr
om
cont
aine
r is 2
2 da
ys
acco
rdin
g K
RA
Tim
e R
elea
se S
tudy
(200
4)
KEB
S, E
AC
Sta
ndar
ds
Bur
eaus
,
Trad
e fa
cilit
atio
ns
orga
niza
tions
in E
AC
Coo
rdin
atio
n am
ong
the
diff
eren
t go
vern
men
t bo
dies
, har
mon
izat
ion
of q
ualit
y st
anda
rds,
rule
s of
or
igin
and
oth
er c
ertif
icat
ion
requ
irem
ents
acr
oss
EAC
. E
stab
lishm
ent
of a
one
-sto
p cl
eara
nce
of
impo
rts
Part
VII
: Oth
er C
onst
rain
tss
Part
VII
Se
ctio
n C
Sa
le o
f co
unte
rfei
t go
ods
bear
ing
EAC
tra
dem
arks
oc
cur w
idel
y in
Uga
nda
and
to s
ome
exte
nt in
Ken
ya
and
Tanz
ania
B
Loss
of b
usin
ess t
o co
unte
rfei
ts; l
oss o
f gov
t. re
venu
e
EAC
B
urea
us
of
Stan
dard
s an
d EA
C
cust
oms d
epar
tmen
ts
EAC
Cus
tom
s an
d B
urea
us o
f Sta
ndar
ds t
o fo
llow
up
on
pu
blic
atio
n an
d en
forc
emen
t of
EA
C
coun
terf
eits
act
Part
VII
Se
ctio
n C
D
iver
sion
of
trans
it go
ods
into
dom
estic
mar
ket
on
whi
ch V
AT
and
impo
rt du
ties h
ave
not b
een
paid
B
EAC
cus
tom
s de
partm
ents
St
rict i
mpl
emen
tatio
n of
law
s an
d th
e tra
nsit
bond
s an
d tra
ckin
g sy
stem
to m
onito
r mov
emen
t of t
rans
it go
ods
Part
VII
Se
ctio
n E
Vis
a re
quire
men
ts f
or K
enya
n em
ploy
ees
of K
enya
n bu
sine
sses
in U
gand
a an
d Ta
nzan
ia
A
Add
ition
al c
osts
, tim
e an
d pr
oced
ures
of m
eetin
g vi
sa
requ
irem
ents
; em
ploy
men
t of
loca
ls, w
ith v
aryi
ng sk
ills
EAC
imm
igra
tion
depa
rtmen
ts
Prot
ocol
on
free
mov
emen
t of w
orke
rs a
cros
s EA
C
mem
ber c
ount
ries
Part
VII
Se
ctio
n C
Po
lice
offic
ers
stop
all
com
mer
cial
veh
icle
s at
var
ious
ro
ad b
lock
s, w
hile
they
are
off
icia
lly su
ppos
ed to
stop
on
ly v
ehic
les w
ith su
spic
ious
car
go
B
Del
ays a
nd a
dditi
onal
cos
t in
the
form
of b
ribes
in
mov
emen
t of t
ruck
s. O
n av
erag
e, K
sh 1
0000
in
unof
ficia
l pay
men
ts p
er 1
0 to
n tru
ck
Ken
ya p
olic
e de
partm
ent
Prep
arat
ion
and
publ
icat
ion
of c
lear
gui
delin
es f
or
stop
ping
veh
icle
s an
d de
velo
ping
mec
hani
sm t
o el
imin
ate
brib
es a
nd c
orru
ptio
n
Part
VII
Se
ctio
n E
Del
ays
and
long
pr
oced
ures
in
re
gist
erin
g ne
w
busi
ness
es
A
It ta
kes m
ore
than
2 w
eeks
to
regi
ster
a b
usin
ess a
nd f
irms
mus
t em
ploy
loca
l age
nts t
o ge
t thi
ngs d
one,
incr
easi
ng
cost
s
Ken
ya
Atto
rney
G
ener
al’s
of
fice,
U
gand
a R
egis
tratio
n Se
rvic
es
Bur
eau,
B
REL
LA T
anza
nia
Har
mon
ize
and
stre
amlin
e bu
sine
ss
licen
sing
pr
oced
ures
acr
oss
EAC
, el
ectro
nic
met
hods
for
se
arch
of
busi
ness
nam
es a
nd o
ther
reg
istra
tion
proc
edur
es
Part
VII
Se
ctio
n B
H
igh
port
char
ges f
or im
port
clea
ranc
e in
Ken
ya.
The
char
ges
incl
ude:
sur
char
ge b
y sh
ippi
ng li
nes
at U
SD
12.5
per
day
afte
r 4
days
of
arriv
al f
or a
20f
t
C
Add
ition
al c
ost t
o im
porte
rs
by w
ay o
f the
se c
harg
es.
KPA
, M
inis
try
of
Tran
spor
t R
evie
w
fees
pa
yabl
e at
M
omba
sa
port
and
harm
oniz
e th
e po
rt fe
es a
cros
s EA
C re
gion
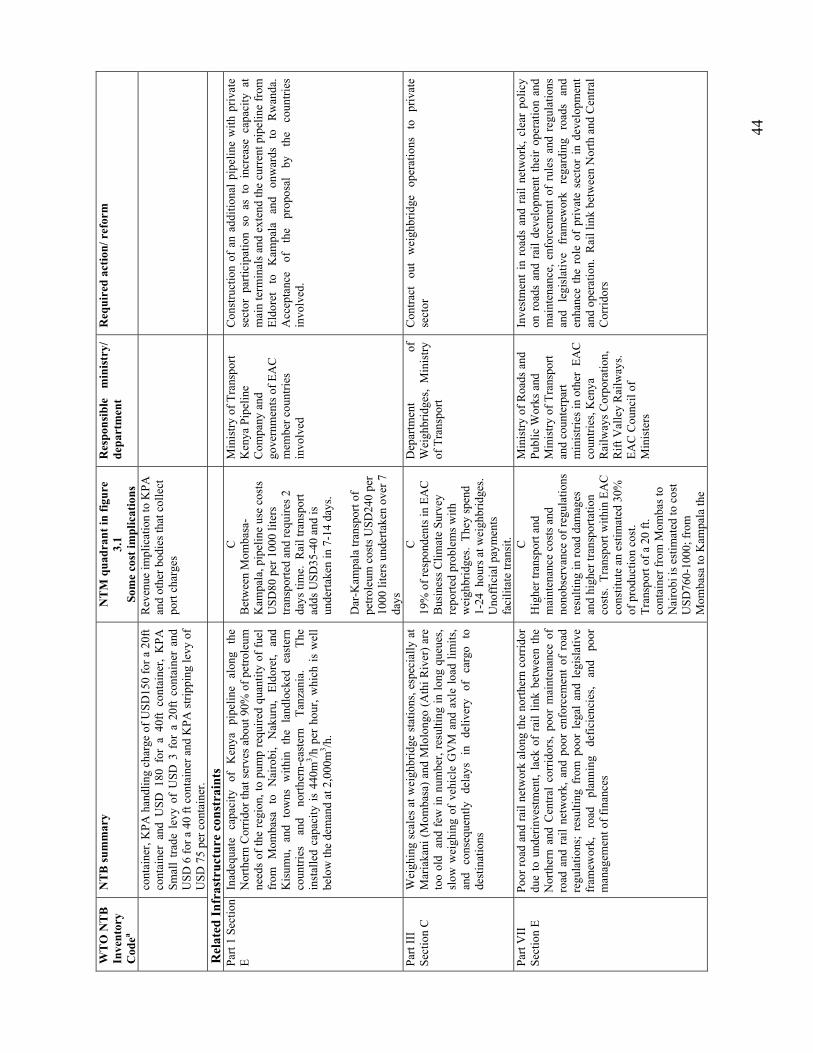
44
WT
O N
TB
In
vent
ory
Cod
ea
NT
B su
mm
ary
NT
M q
uadr
ant i
n fig
ure
3.1
Som
e co
st im
plic
atio
ns
Res
pons
ible
m
inis
try/
de
part
men
t R
equi
red
actio
n/ r
efor
m
cont
aine
r, K
PA h
andl
ing
char
ge o
f USD
150
for a
20f
t co
ntai
ner
and
USD
180
for
a 4
0ft
cont
aine
r, K
PA
Smal
l tra
de l
evy
of U
SD 3
for
a 2
0ft
cont
aine
r an
d U
SD 6
for a
40
ft co
ntai
ner a
nd K
PA st
rippi
ng le
vy o
f U
SD 7
5 pe
r con
tain
er.
Rev
enue
impl
icat
ion
to K
PA
and
othe
r bod
ies t
hat c
olle
ct
port
char
ges
Rel
ated
Infr
astr
uctu
re c
onst
rain
ts
Pa
rt 1
Sect
ion
E
Inad
equa
te
capa
city
of
K
enya
pi
pelin
e al
ong
the
Nor
ther
n C
orrid
or th
at se
rves
abo
ut 9
0% o
f pet
role
um
need
s of
the
regi
on, t
o pu
mp
requ
ired
quan
tity
of fu
el
from
M
omba
sa
to
Nai
robi
, N
akur
u, E
ldor
et,
and
Kis
umu,
and
tow
ns w
ithin
the
lan
dloc
ked
east
ern
coun
tries
an
d no
rther
n-ea
ster
n Ta
nzan
ia.
Th
e in
stal
led
capa
city
is 4
40m
3 /h p
er h
our,
whi
ch is
wel
l be
low
the
dem
and
at 2
,000
m3 /h
.
C
Bet
wee
n M
omba
sa-
Kam
pala
, pip
elin
e us
e co
sts
USD
80 p
er 1
000
liter
s tra
nspo
rted
and
requ
ires 2
da
ys ti
me.
Rai
l tra
nspo
rt ad
ds U
SD35
-40
and
is
unde
rtake
n in
7-1
4 da
ys.
Dar
-Kam
pala
tran
spor
t of
petro
leum
cos
ts U
SD24
0 pe
r 10
00 li
ters
und
erta
ken
over
7
days
Min
istry
of T
rans
port
Ken
ya P
ipel
ine
Com
pany
and
go
vern
men
ts o
f EA
C
mem
ber c
ount
ries
invo
lved
Con
stru
ctio
n of
an
addi
tiona
l pip
elin
e w
ith p
rivat
e se
ctor
par
ticip
atio
n so
as
to i
ncre
ase
capa
city
at
mai
n te
rmin
als a
nd e
xten
d th
e cu
rren
t pip
elin
e fr
om
Eldo
ret
to
Kam
pala
an
d on
war
ds
to
Rw
anda
. A
ccep
tanc
e of
th
e pr
opos
al
by
the
coun
tries
in
volv
ed.
Part
III
Sect
ion
C
Wei
ghin
g sc
ales
at w
eigh
brid
ge s
tatio
ns, e
spec
ially
at
Mar
iaka
ni (M
omba
sa) a
nd M
lolo
ngo
(Ath
i Riv
er) a
re
too
old
and
few
in n
umbe
r, re
sulti
ng in
long
que
ues,
slow
wei
ghin
g of
veh
icle
GV
M a
nd a
xle
load
lim
its,
and
cons
eque
ntly
de
lays
in
de
liver
y of
ca
rgo
to
dest
inat
ions
C
19%
of r
espo
nden
ts in
EA
C
Bus
ines
s Clim
ate
Surv
ey
repo
rted
prob
lem
s with
w
eigh
brid
ges.
The
y sp
end
1-24
hou
rs a
t wei
ghbr
idge
s. U
noff
icia
l pay
men
ts
faci
litat
e tra
nsit.
Dep
artm
ent
of
Wei
ghbr
idge
s, M
inis
try
of T
rans
port
Con
tract
ou
t w
eigh
brid
ge
oper
atio
ns
to
priv
ate
sect
or
Part
VII
Se
ctio
n E
Poor
road
and
rail
netw
ork
alon
g th
e no
rther
n co
rrid
or
due
to u
nder
inve
stm
ent,
lack
of
rail
link
betw
een
the
Nor
ther
n an
d C
entra
l co
rrid
ors,
poor
mai
nten
ance
of
road
and
rai
l ne
twor
k, a
nd p
oor
enfo
rcem
ent
of r
oad
regu
latio
ns;
resu
lting
fro
m p
oor
lega
l an
d le
gisl
ativ
e fr
amew
ork,
ro
ad
plan
ning
de
ficie
ncie
s, an
d po
or
man
agem
ent o
f fin
ance
s
C
Hig
her t
rans
port
and
mai
nten
ance
cos
ts a
nd
nono
bser
vanc
e of
regu
latio
ns
resu
lting
in ro
ad d
amag
es
and
high
er tr
ansp
orta
tion
cost
s. T
rans
port
with
in E
AC
co
nstit
ute
an e
stim
ated
30%
of
pro
duct
ion
cost
. Tr
ansp
ort o
f a 2
0 ft.
co
ntai
ner f
rom
Mom
bas t
o N
airo
bi is
est
imat
ed to
cos
t U
SD76
0-10
00; f
rom
M
omba
sa to
Kam
pala
the
Min
istry
of R
oads
and
Pu
blic
Wor
ks a
nd
Min
istry
of T
rans
port
and
coun
terp
art
min
istri
es in
oth
er E
AC
co
untri
es, K
enya
R
ailw
ays C
orpo
ratio
n,
Rift
Val
ley
Rai
lway
s.
EAC
Cou
ncil
of
Min
iste
rs
Inve
stm
ent
in r
oads
and
rai
l ne
twor
k, c
lear
pol
icy
on r
oads
and
rai
l de
velo
pmen
t the
ir op
erat
ion
and
mai
nten
ance
, enf
orce
men
t of
rule
s an
d re
gula
tions
an
d le
gisl
ativ
e fr
amew
ork
rega
rdin
g ro
ads
and
enha
nce
the
role
of
priv
ate
sect
or i
n de
velo
pmen
t an
d op
erat
ion.
Rai
l lin
k be
twee
n N
orth
and
Cen
tral
Cor
ridor
s
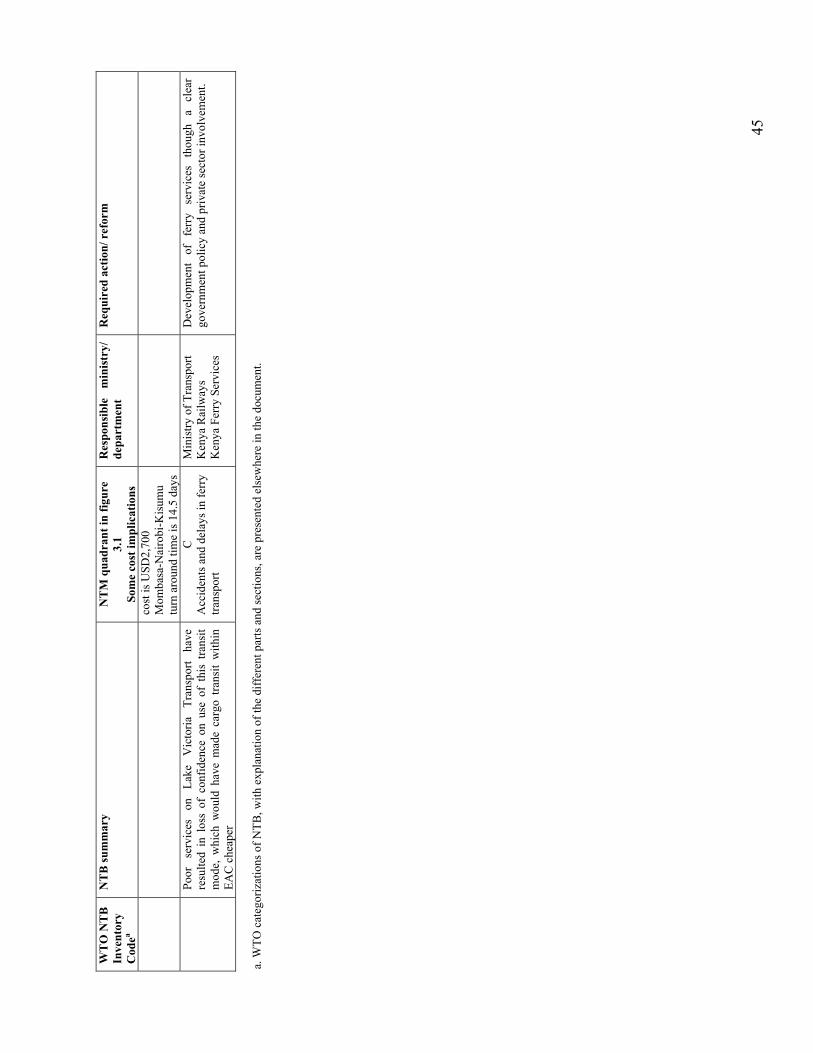
45
WT
O N
TB
In
vent
ory
Cod
ea
NT
B su
mm
ary
NT
M q
uadr
ant i
n fig
ure
3.1
Som
e co
st im
plic
atio
ns
Res
pons
ible
m
inis
try/
de
part
men
t R
equi
red
actio
n/ r
efor
m
cost
is U
SD2,
700
Mom
basa
-Nai
robi
-Kis
umu
turn
aro
und
time
is 1
4.5
days
Poor
se
rvic
es
on
Lake
V
icto
ria
Tran
spor
t ha
ve
resu
lted
in l
oss
of c
onfid
ence
on
use
of t
his
trans
it m
ode,
whi
ch w
ould
hav
e m
ade
carg
o tra
nsit
with
in
EAC
che
aper
C
Acc
iden
ts a
nd d
elay
s in
ferr
y tra
nspo
rt
Min
istry
of T
rans
port
Ken
ya R
ailw
ays
Ken
ya F
erry
Ser
vice
s
Dev
elop
men
t of
fe
rry
serv
ices
th
ough
a
clea
r go
vern
men
t pol
icy
and
priv
ate
sect
or in
volv
emen
t.
a.
WTO
cat
egor
izat
ions
of N
TB, w
ith e
xpla
natio
n of
the
diff
eren
t par
ts a
nd se
ctio
ns, a
re p
rese
nted
els
ewhe
re in
the
docu
men
t.
46
V. FACTORS LIKELY TO INFLUENCE SPEED OF EAC ACTION ON NTMS
4.63 Compared to its pursuit of tariff reductions to date, the elimination of NTMs in EAC is widely expected to be more difficult because of the complex nature of the NTMs, the need to shore up political will to tackle them, the need to build technical capacity across member states, the financial dependence at the national level, and other considerations. Initial interviews with stakeholders—especially private firms—indicated to the task team that the following factors are likely to influence the speed of decisions and action to reduce/remove NTMs on goods trade in the EAC. A. Council of Ministers’ meetings
4.64 The decisions of the EAC Council of Ministers require unanimity across all members states. Currently, delays occur as the Council finds it difficult to meet on a regular schedule. Consensus building is a prolonged exercise, requiring both extensive time and effort across the member country ministers at the level of policy choice and the national civil service in charge of the implementation of EAC-wide decisions. Unilateral decisions taken by members have few channels to impact actions of other EAC members. B. Synchronization by EAC members
4.65 EAC member states are required to give similar treatment to all agreed EAC policies. Within the short period of the regional economic community’s existence, the members are finding the agreed harmonization of the national laws/policies and standards governing intra-EAC slow, cumbersome, and resource- and capacity-intensive given their LDC status. Currently, the harmonization process for policies and standards on traded goods is being driven by the public sector, with little or no involvement of the private sector—the sector most affected by the process. 4.66 Where action has been taken significant variance is developing with regard to decisions and regulatory systems on the optimum standards of goods.55 Enhanced capacity for EAC-wide harmonization of standards may or may not be used to ease NTMs. It may end up being a double-edged sword for the exact opposite purpose, i.e. to increase inspection, certification, and other requirements. 4.67 EAC-wide harmonization is made more difficult by multiple memberships in regional trade arrangements. Uganda, Kenya, Rwanda, and Burundi are members of the COMESA, while Kenya belongs to the free trade area in COMESA, but Uganda does not. Tanzania is not part of COMESA, but belongs to SADC. The COMESA members in EAC perceive that Tanzania might be delaying certain key decisions in goods trade integration and adoption of best practices at the EAC Council in order to maintain the lead already attained through its SADC membership.
55 Consider this example: In the FY08 budget, Uganda imposed a ban on production and importation of polythene bags less than 30 microns. Kenya did not. It continues to produce polythene bags less than 30 microns and these are smuggled into Uganda. On the other hand, in Rwanda, the use all polythene bags is completely banned. Hence, Uganda, Kenya, and other members cannot export products to Rwanda using such material for packaging.
47
C. Implementation of current EAC rules and new decisions of the Council
4.68 There is widespread perception in the private sector that implementing agents (including those manning customs and ports) in each member state continue to think and act on behalf of the individual countries and not in terms of the EAC. Hence, they tend to favor their own citizens in production, trade, and transit decisions related to goods trade. Private stakeholders across the EAC recommend that all member states need to devise a mechanism to restrain domestic players from undermining regulations that are put in place by other partner states. 4.69 Several reasons are cited—by both private sector agents and officials in ministries across EAC—for the observed low commitment of member governments to remove NTMs. First, government agencies (port officials, revenue authorities, police, and others) in the region have not been fully sensitized and oriented to play their role effectively in implementing EAC directives and agreements. Second, the EAC Secretariat has only observer status at present and hence limited power to penalize noncompliant members. For example, some stakeholders are frustrated with the pace of development and application of arbitration processes at the EAC Secretariat. The process of reaching a decision on mitigation is so slow that some NTM problems reported in goods trade and transit are never resolved. EAC also lacks a policy on how firms who are recognized to have incurred business losses can be compensated. 4.70 Third, as the tariff walls have come down, NTMs are often cited as deliberate actions to protect the trade interests of the country and stem competition from neighbors. Fourth, the functioning of the National Monitoring Committees56 for NTM monitoring is hampered due to the dearth of budget resources in member governments to locate and support NMC activities, the scarcity of specific NTM information available for use, the lack of clarity of the monitoring mechanism to be adopted, and the absence of agreement on actions for reduction/removal of NTMs.
D. Flow of information
4.71 In all EAC member states, the traders and officials of traders’ associations criticize the national governments for monopolizing information (deliberately or because of lack of dissemination capacity) on decisions relevant to goods trade. Information gaps persist between the policy makers, the implementing agencies like national bureaus of standards, and the producers and traders. For example, the majority of the EAC traders are not even aware of the NTM monitoring mechanism through which they can report constraining measures. There is widespread concern that the mechanisms and the language used to explain issues concerning goods trade in the EAC are not simplified enough to be useful to small indigenous traders. This is particularly problematic for Burundi—where the government systems are focused on early stages of post conflict recovery—but are prevalent EAC-wide. The complaint is least in Kenya, where deliberate efforts have been made by the government since 2002 to consult and incorporate key private entities. 4.72 Broadening and deepening ownership of EAC among the citizens of East Africa remains a big challenge. Whereas awareness at the level of senior government and regional administration is high, public participation in the EAC member states is very limited. The task team was reminded several times that majority of the citizens of the member states do no know about the
56 The NMCs have not met since their inauguration in 2007. The framework for the NTM monitoring mechanism is yet to be implemented, and its progress to be evaluated.
48
EAC and/or what it is expected to achieve. Traders feel that unless the people are sensitized about the EAC objectives, structure, integration process, and region-wide benefits, they will remain reluctant to endorse certain strategies decided upon. This can be achieved through increased information sharing, adoption of improved networking by national governments with national and EAC-wide stakeholders, and more deliberate public interaction by the EAC Secretariat.
E. Capacity of national institutions
4.73 The regional structure for goods trade facilitation is not adequate. The capacity of the numerous regulatory bodies varies significantly and national institutional frameworks remain largely ineffective in developing and harmonizing standards. Of these, the customs administration in most member states is undergoing enhancement of capacity and modernization, though not in a very coordinated fashion within EAC. The bureaus of standards are generally not high on the national priority for capacity building— except in Kenya, through donor and private sector support. Most of the certification for the foreign exchange earning exports outside EAC is through internationally recognized laboratories in Europe. Hence, the national bureaus remain inadequately staffed and may not have the right skills to develop standards and implement the standards certification and harmonization. The junior bureau staff, in most cases carrying out the enforcement at the border, is yet to be sensitized of the regional impact of their work.
49
CHAPTER 5. LEARNING FROM OTHER REGIONAL ECNOMIC COMMUNITIES
5.1 The regional economic communities (RECs) in Africa do not have an impressive record of dealing with contentious non-tariff measures (NTMs). However, the EAC has quickly achieved a lot that remains desirable for RECs in Sub-Saharan Africa. This study suggests looking beyond the continent for examples, to learn from successes of RECs and emulate them, as appropriate, and to avoid failures.
5.2 The current chapter moves away from direct discussion of NTM issues in the EAC. We examine here the course of action taken by the European Union (EU) and Association of Southeast Asian Nations (ASEAN), since they contain a number of lessons that can help EAC plan well and minimize policy errors. Although the economic profile of the EU member states and the decision-making authority has by now evolved to be very different from the EAC, in the area of NTM removal, it has a long history and by far some of the best practices over the long term. Some ASEAN members have economic profiles closer to the founding members of the EAC. Hence, their ongoing experiences in handling NTMs are perhaps the one the EAC will be able to emulate more easily in the medium term.
I. THE EU APPROACH TO NON-TARIFF MEASURES
5.3 The European Union is a good example of a successful economic integration achieved through the removal of barriers to trade, including NTMs. The EU was established in 1957 with the Treaty of Rome, and since its inception it has called for the removal of NTMs, as has the EAC. The discussion that follows first highlights the most important steps undertaken by the EU toward the elimination of NTMs and the creation of the internal market. It describes the EU’s major tools to reduce NTMs: mutual recognition and the harmonization process. Next, it describes the catalysts—such as foreign competition and the enlargement process—that pushed toward a quicker integration process in the EU. Lastly, it briefly describes the EU tools for monitoring the emergence of new NTMs and reporting the correct transposition of EU regulations into national legislation.
A. Main direct action toward eliminating NTMs and events to establish a single market
5.4 The achievement of a working internal market in the EU has been a long and complex process, with a series of initiatives and legal steps required to achieve free trade. The European Economic Community (EEC, now EC) was established in 1957 with the signing of the Treaty of Rome. The Treaty built a customs union of six members and, through Art. 3, called for the removal of NTMs that have equivalent effect to tariffs and quotas on trade. NTMs were the main obstacles to the creation of a Single European Market (SEM) because they were the outcome of diverse national rules, regulations, taxation, and subsidies.
5.5 At first, the EU tried to remove such NTMs through the adoption of European laws and regulations, with the aim of determining European standards for a large range of products. This “old approach” required product-specific (even component-specific) legislation; implementation was based on an extensive use of directives. Needless to say, this system was extremely
50
cumbersome and difficult to implement, as it required a very technical harmonization and extensive consultations. In addition, the unanimity required in Council decision making was a tool for member states to veto any proposed European law if they considered it damaging to their own economies.
5.6 As a result, very little progress was achieved and the need became clear for a simplification of the harmonization process and for the adoption of the qualified majority in the Council.57 To overcome the difficulties of the “old approach”, in 1978 the European Court of Justice (ECJ) established the principle of mutual recognition in the famous Cassis de Dijon case (see box 5.1). The ECJ established that goods that are produced in a member state in respect of national rules and regulations should be able to be sold in any other member state. So companies should be allowed to produce according to their national rules and still be able to sell their products throughout the Community. The principle outlined in the Cassis de Dijon case provided a precedent for break with the long-used harmonization process, to be replaced by the principle of mutual recognition (finally adopted in 1985).
5.7 In the same year, the 1985 White Paper called for a program of legislation to complete the internal market by 1992. Apart from calling for a simplified harmonization process (the new approach), the White Paper also called for strengthening the capacity of the European standards bodies. Similar to the EAC’s objective of eventually adopting EAC-wide standards, these bodies in the EU were considered an essential tool in the gradual replacement of national standards by European standards. The White Paper also highlighted that the new harmonization policy had to put particular emphasis on certain sectors, such as information technology and telecommunications, construction, and foodstuffs. The EAC could similarly identify sectors in which the initial harmonization would be critical and prioritize those. As regards monitoring, the White Paper encouraged the adoption of preventive measures, such as Directive 83/189/EEC. This directive obliged member states to notify the Commission of all draft regulations and standards related to technical specifications to be introduced on national territories. In this way, the EC could monitor and prevent the raise of new national barriers to intra-EU trade.
5.8 Following the EU example, the EAC’s immediate objective is to take steps toward establishing a common market. The various planned steps toward this would impact on the elimination of NTMs. For the EU, the Single European Act (SEA) was approved by all member states in 1986, and implemented in 1987, to execute the White Paper recommendations and create a SEM. Thanks to the SEA, majority vote replaced unanimity in the Council in areas related to the establishment of the internal market. This facilitated the decision-making process and reduced the delays associated with unanimity. The SEA resulted in the establishment of a detailed program to achieve the single market, including the removal of legal barriers to the free movement of goods, services, capital, and labor. It is also important to note that the SEA established a Community Policy of Economic and Social Cohesion, to mitigate the effects of the completion of the internal market on less-developed member states and consequently reduce development discrepancies among the regions. Physical barriers for goods at the borders were removed in 1993, together with the associated customs documents. This step helped facilitate trade through reduced delivery times and lower associated costs.
57 See Brenton and Vancauteren (2000).
51
Box 5.1. Establishing the Principle of Mutual Recognition: The Cassis de Dijon Case
The Cassis de Dijon case is the founding father of the principle of mutual recognition, a huge step toward the abolition of NTMs. In 1979, the European Court of Justice ruled that Germany could not ban imports of Cassis de Dijon (a French alcoholic drink) on the basis that it did not conform to German rules governing alcoholic drinks. According to such rules, Germany prohibited the sale of any drink with alcohol content between 15 and 25 percent, arguing that beverages with low alcoholic content may encourage alcoholism more than high alcoholic content drinks. Moreover, Germany claimed that the ban had health grounds, as it was a measure to reduce the proliferation of alcoholic drinks in the German market. A German import/export company brought Germany to court with the accusation that the German regulation on minimum alcohol content was an illegal NTM. After the case was brought against the German courts, the European Court of Justice ruled that cassis could not be banned from the German market, as it met French standards. Most importantly, the Court ruled that: "There is therefore no valid reason why, provided that they have been lawfully produced and marketed in one of the Member States, alcoholic beverages should not be introduced into any other Member State."
B. Specific criteria used in EU enlargement and functioning
5.9 The following are relevant to the EAC’s learning on reducing and eliminating NTMs.
Principle of mutual recognition and the harmonization process in EU 5.10 Mutual recognition was a very important achievement toward the removal of NTMs. In the EU this principle allows free intra-EU trade in goods. Based on the mutual recognition principle, a product that is produced and marketed in one member state must be allowed in any other member state, even when the product does not fully comply with the technical rules of the member state of destination. Only in the presence of public safety, health, or environment risks is mutual recognition not applied. In such cases, the member state of destination can ban the risky product, but only after demonstrating that the implied NTM is the least trade-restrictive measure. For example, mutual recognition has facilitated trade through the removal of technical barriers to trade on beer. According to the EC, over 90 percent of EU imports of beer come from other member states.
5.11 Nonetheless, EU technical harmonization remains necessary to regulate more complex or sensitive sectors through EU directives. Mutual recognition can easily apply to new and specialized products and it can be relatively effective for equipment goods and consumer durables. It encounters difficulties where the product risk is high, and consumers or users are directly exposed (as is the case with chemicals, motor vehicles, pharmaceuticals, and foodstuffs). Here the resulting system is a combination of mutual recognition and EU harmonization, so that harmonization can ensure the free movement of goods in those cases where mutual recognition cannot work. According to the nature of the product, two different approaches are used:
• The “old approach” is based on harmonization with performance requirements, involving a single set of fully harmonized and detailed provisions. This approach is used for products (pharmaceuticals, chemicals, or automobiles) that could put consumers’ safety at risk and for which performance-oriented legislation (with detailed testing methods) is needed. For example, in the case of passenger cars, according to the EC type-approval system, once a car has been type-approved in one member state, it can be registered and
52
put on the market anywhere in the Community without further testing. The measure has resulted in an increase of both the competitiveness of the European car industry and the foreign investment into the EU, particularly from Japanese carmakers.
• The “new approach” applies to products with similar characteristics and where there has been widespread divergence of technical regulations in EU countries. This approach is more streamlined, with its reliance only on “essential requirements” and greater freedom for manufacturers on the way to satisfy those requirements. Moreover, this approach provides the private sector with a number of choices for attestation methods: self-certification against the essential requirements; generic standards; or using notified bodies for type approval and testing of conformity of type.58 For example, the Radio Equipment and Telecommunications Terminal Equipment Directive cover a vast range of radio and telecommunications equipment. Manufacturers are now allowed even to certify their own products and to attach the CE-mark, a single mark of conformity recognized throughout the Community.
EU’s Internal market and foreign competition 5.12 The process of creating the internal market was accelerated in the 1980s. These years were characterized by a slow growth rate and high unemployment in Europe. At the same time, Japanese firms were entering very sensitive European markets—cars, electronics, and computing equipment—while high technology European companies were unable to maintain their presence in these markets. In 1983 the growing difficulties in facing U.S. and Japanese competition called for a Solemn Declaration of European Union. The EU recognized that a failure to establish the internal market could only exacerbate the difficulties encountered by European firms.
5.13 Thus, the pressure of external/foreign competition was a very important catalyst for the creation of the Single European Market. It also had some consequences on foreign investment, as the Japanese example can show. Some analysts argue that economic integration produces changes in the distribution of ownership-specific advantages across international firms.59 The removal of NTMs on intra-EU trade was about to increase the degree of protection of European producers vis-à-vis extra-EU exporters. This move was encouraged by lobbies of industries threatened by the strengthening of Japanese competition. Between 1973–7 and 1983–7, the share of Japanese direct investment located in EU doubled from 6.0 to 14.5 percent, with most of the increase coinciding with the years of publication of the White Paper on the completion of the internal market and with the start of the discussions on “Fortress Europe.” It is clear that fears of protectionist European policies and an increased economic stability associated with the creation of the internal market acted as a catalyst for Japanese direct investment in the Community. Needless to say, such reaction was stronger in the sectors where the Japanese firms had considerable technological advantages over European firms: motor vehicles, electronics, and office equipment.
Internal market and EU expansion 5.14 Since the beginning, the EU expansion process has been an important factor in the creation of the internal market, for both the opportunities and the challenges associated with it. The expansion of the EEC in 1973, with the accessions of the United Kingdom, Ireland, and Denmark, was not followed by a fast integration progress. When Greece (1981) and then Spain and Portugal (1986) joined the EU, they contributed to the creation of a potential market of 320
58 Brenton and Vancauteren (2000). 59 See Yannopoulos (1990),
53
million consumers. They also brought new challenges to the integration process, with their lower level of economic development and difficulties encountered in complying with the constraint imposed by the Treaty of Rome (including the removal of barriers to trade). This situation accelerated the process of regional integration and led to the approval of the Single European Act, a necessary program for the implementation of the Single European Market.
5.15 The enlargement process60 poses new challenges to the functioning of the internal market, as new member states may bring new constraining measures to internal trade and stretch the EU monitoring capacities. In order to be eligible for accession, candidate countries must align their regulatory systems with the acquis. The Copenhagen criteria for accession (see box 5.2) —which follow mainly from the Treaty of Rome—require “the ability to assume the obligations of membership” and consequently to comply with the internal market rules allowing free trade. As a consequence, no waivers are granted to the new member states. In fact, EU membership is a long and rigorous process, which includes a pre-accession strategy meant to prepare the candidate country to become a member.
Box 5.2. The Copenhagen Criteria for Accession to the EU
Countries fulfill the Copenhagen criteria for accession into the EU, adopted in 1993, by having: • Stable institutions that guarantee democracy, the rule of law, human rights, and respect for and
protection of minorities, • A functioning market economy, as well as the ability to cope with the pressure of competition and the
market forces at work inside the EU, and • The ability to assume the obligations of membership, in particular adherence to the objectives of
political, economic, and monetary union.
5.16 The candidate’s submitted application is evaluated by the EU. If it is accepted and the applicant meets the required criteria, negotiations for accession may start. This long and cumbersome process is intended to make sure that candidate countries have the capacities to absorb and implement the EU legislation. Moreover, the EU also becomes sure of its own capacity to integrate the new members without compromising the effectiveness of the internal market and the future development of the community.
Internal market monitoring and reporting by EU 5.17 The proper functioning of the internal market is supervised primarily by the European Commission, in charge of monitoring the quality of the internal market regulatory framework. Other European institutions contribute to this important function (the European Council, the European Court of Justice, and the European Parliament), and have a set of tools to enforce European law. The EU has put in place a complex system of monitoring and reporting. This is necessary to enforce the transposition and application of European laws by every member state.
5.18 In order to check how long it takes for a member state to transpose European laws into national laws, the EU has created an internal market scoreboard. This reports the status of the harmonization process and the number of infringement proceedings initiated by the EC against member states. These proceedings are initiated as a consequence of an incorrect or missing application of an EU law by a member state. In this case, the member state is encouraged to quickly remedy the situation, and if it fails to do so it is referred to the ECJ, which can impose a 60 In 1995, Austria, Finland, and Sweden joined the EU, followed by the historic enlargement in 2004 when Cyprus, the Czech Republic, Estonia, Hungary, Latvia, Lithuania, Malta, Poland, Slovakia, and Slovenia joined. Lastly, Romania and Bulgaria joined in 2007.
54
sanction. An example is the decision taken by the ECJ against France in 2005 (IP/05/917), caused by France’s failures to comply with a Court judgment of June 1991 (regarding the fisheries control system). With this decision, the ECJ condemned France to make a lump sum penalty of € 20 million and a periodic payment of € 57.7 million every six months, until France had taken the necessary steps to revert the infringement.
5.19 Even though the monitoring system has been put in place, legislation problems arise. With the aim of solving them, the Commission has an additional tool, called SOLVIT. It is an on-line network among member states that allows every citizen or business in any member state to report directly a problem in the functioning of the Single European Market. Every member state has a SOLVIT center, which is an integral part of the national administration, and is committed to provide a real solution within ten weeks.
II. THE ASEAN APPROACH TO NON-TARIFF MEASURES
5.20 The Association of Southeast Asian Nations (ASEAN) represents a major example of regional integration and commitment to the removal of constraining measures to trade among developing countries. It was created in 1967 with the signing of the Bangkok Declaration by Indonesia, Malaysia, the Philippines, Singapore, and Thailand. The integration process is ongoing. It is meant to strengthen its members’ external linkages rather than create a protectionist bloc and is considered an example of open regionalism, based on the principle of adherence to GATT/WTO rules. Another major characteristic that distinguishes the ASEAN experience from that of the EU in dealing with NTMs is its sector-based approach. In this strategy, ASEAN has focused its economic integration and elimination of trade barriers on a few sectors (chosen among sectors with the highest potential for intra-regional trade and integration).
5.21 To enhance the learning of EAC from the ongoing process in ASEAN, the discussion below describes rather than assesses the steps undertaken so far toward the elimination of NTMs. It follows with a description of the tools (harmonization and mutual recognition agreements) and the strategy used by ASEAN to identify and eliminate such barriers. Last, it briefly covers the few steps already undertaken by the region to monitor the integration process and ASEAN’s intention to strengthen its capacity of doing so.
A. Main direct action toward eliminating NTMs and events to establish the ASEAN
5.22 In 1977, even though the ASEAN Free Trade Area (AFTA) had not been created, ASEAN countries committed to the removal of NTMs with the signing of the Preferential Trading Arrangement Agreement. A decade later, in 1987 the memorandum of understanding (MoU) on standstill and rollback on NTMs followed. This MoU was based on the principle that barriers inconsistent with the GATT rules had to be eliminated. The NTMs in line with the GATT rules still had to be removed, but on a preferential basis. In general, the member countries had to give priority to the elimination of those barriers that were affecting the most important industries for regional economic integration. With this aim, the MoU also obliged the member countries to provide the ASEAN Secretariat with an inventory of all existing NTMs and to notify it of new ones. Reverse notification was also included, so that countries were allowed to make formal complaint to the Secretariat about NTMs imposed by other members. The Secretariat was in charge of dealing with such complaints and facilitating reconciliation.
5.23 In 1992 the AFTA was created, with member agreement of a Common Effective Preferential Tariff (CEPT) Scheme. The steps included the immediate elimination of intra-regional tariffs for products enjoying concessions under the CEPT scheme. In addition, Article 5
55
of AFTA called its members to “eliminate other non-tariff measures on a gradual basis within a period of five years after the enjoyment of concessions.” To achieve this objective, the member countries agreed on a work program for the removal of NTMs, including:
• A process of verification and cross-notification: many NTMs affecting intra-regional trade have already been identified
• Update of the working definition of non-tariff barriers/non-tariff measures in ASEAN, based on the classification developed by UNCTAD
• Setting-up of a database on all NTMs maintained by member countries
• Eventual elimination of unnecessary and unjustifiable non-tariff measures.
5.24 As per the MoU, the ASEAN members had to focus on the removal of those NTMs affecting the most important products in intra-regional trade. The products identified were minerals, electrical appliances, and machineries. In order to recognize the NTMs affecting these sectors, the Secretariat used a variety of sources: submissions made by member countries, the GATT Trade Policy Review, submissions by the ASEAN Chambers of Commerce & Industry (ASEAN-CCI), and the UNCTAD's Trade Analysis and Information System (TRAINS) database. The outcome of the analysis of NTMs was the identification of the main measures affecting intra-regional trade: namely, customs surcharges, technical measures, product characteristic requirements, and monopolistic measures. Table 5.1 presents the most widespread NTMs in the ASEAN.
Table 5.1. Most Prevalent NTMs in ASEAN
Non-tariff barrier Number of tariff lines affected
Customs surcharges 2,683 Additional charges 126 Single channel for imports 65 State-trading administration 10 Technical measures 568 Product characteristic requirement 407 Marketing requirements 3 Technical regulations 3
Source: ASEAN Secretariat. 5.25 In 1997, the priority areas for harmonization (to be achieved by 2003) were identified, mainly focusing on consumer safety and health.61 The harmonization of standards for these products was achieved by 2003 based on international standards, as suggested by the WTO’s technical barriers to trade (TBT) Agreement. With the aim of protecting customers’ health and safety, two initiatives were undertaken: the harmonization of sanitary and phyto-sanitary (SPS) measures in priority crops and livestock products in 1997; and the harmonization of standards in electrical products in 1999.
61 The included products were: air conditioners, refrigerators, monitors and keyboards, inductors, loudspeakers, video apparatus, telecommunications equipment, radio, television, parts of TV and radio, capacitators, resistors, printed circuits, switches, cathode ray tubes, diodes, mounted piezo-electronic crystals, motors and generators, rubber condoms, and medical rubber gloves.
56
5.26 In 2003, the ASEAN Economic Ministers’ High Level Task Force on ASEAN Economic Integration requested accelerating the reduction of tariffs, the harmonization of customs and standards, and conformity assessment. This opened the door for accelerating the implementation of Mutual Recognition Agreements for priority sectors.
B. Specific criteria used in ASEAN functioning
Harmonization and mutual recognition in ASEAN 5.27 In 1998, the ASEAN members signed a Framework Agreement on Mutual Recognition Arrangements (MRA). These were intended as “agreements between two or more parties to mutually recognize or accept some or all aspects of one another’s conformity assessment results,” so MRAs could accelerate both bilateral and regional agreements. The signing of the framework agreement encouraged the conclusion of three sectoral MRAs in electrical and electronic equipment, telecommunication, and cosmetics. ASEAN members are currently implementing the application of these agreements. A MRA for pharmaceuticals is under preparation and a MRA for prepared foodstuffs is planned. In a number of sectors (traditional medicines and health supplements, medical device, automotive, and wood industries), ASEAN has achieved the harmonization of standards and texting procedures.
5.28 Below is a brief description of such achievements:
• Cosmetics. The ASEAN Cosmetic Directive has been the outcome of cooperation between the ASEAN cosmetic regulators and the cosmetic industry. The directive aims at facilitating the removal of TBTs for cosmetic products. By providing all requirements that cosmetic products should comply with in all ASEAN countries, the directive allows a product to be produced or marketed in an ASEAN country and to be sold in any other member country.
• Electrical and electronic equipment. The ASEAN Sectoral MRA for Electrical and Electronic Equipment has been preceded by a series of activities aimed at building confidence among member countries, such as seminars/forums for regulatory authorities, study visits to testing laboratories, and analysis of regulatory regimes in ASEAN.
• Telecommunications equipment. The MRA for telecommunications equipment was an initiative led by the ASEAN Telecommunications Regulators’ Council (ATRC). It was finalized in October 2000 and is expected to promote cross-recognition of conformity assessment procedures for type-approving telecommunications equipment in the region.
• Pharmaceuticals. The outcome of a comparative study of the ASEAN regulatory regimes for pharmaceuticals identified four areas for harmonization: quality, efficacy, safety, and administration data. With the aim of placing the requirements in a harmonized structure, an ASEAN Format of Common Technical Requirements (CTR) was developed. Member countries are working on the ASEAN Common Technical Dossier (CTD) for pharmaceutical product registration. This dossier will constitute a basis for a possible MRA in this sector.
5.29 Last but not least, the region is trying to reduce government involvement in securing health and safety standards, with the aim of increasing the role and responsibilities of the private sector. For example, the directive on cosmetics—which became effective in January 2008—aims at substituting the cumbersome pre-sale product-by-product approval system with a risk-based post-sale surveillance.
57
ASEAN strategy to remove NTMs 5.30 ASEAN members identified eleven priority sectors in 2004: namely, electronics, information technology, healthcare, wood-based products, automotives, rubber-based products, textiles and apparel, agro-based products, fisheries, air travel, and tourism. The choice of these sectors was done on the basis of comparative advantage in natural resource endowments, labor skills, and cost competitiveness, and value-added contribution to the economy of ASEAN. The importance of the priority sectors is reflected in the share of intra-regional trade (approximately 50 percent in 2003), contributing USD48.4 billion and USD43.4 billion of intra-ASEAN exports and imports, respectively. A 2005 analysis on NTMs confirmed to the Secretariat that most of these measures were in the priority sectors.62
5.31 Once identified as NTMs, ASEAN will prioritize their elimination through a combination of criteria:
• Trade impact criterion. This gives an idea of the trade restrictiveness of the measure. In order to assess such restrictiveness, the Interim Technical Working Group on CEPT for AFTA (ITWG) will consider the following elements: number of private sector complaints, difference between domestic and world prices, and trade value.
• Regulatory objective criterion. This takes into account the objective of the measure, whether consumers protection or generation of revenue.
• WTO consistency criterion. This allows ASEAN to classify NTMs on the basis of the WTO principles. According to such principles, NTMs must: be transparent, be nondiscriminatory, have scientific basis (in case of SPS measures), and have no better alternative.
5.32 The examination of all the above-mentioned criteria will allow ASEAN to classify NTMs into three main categories:
• Red–NTMs to be immediately eliminated • Amber–NTM not clearly identified as barriers • Green–NTMs that can be maintained, as they are justified.
The ESEAN monitoring system 5.33 The ASEAN model differs from the EU model in being based on a declaration (the Bangkok Declaration) rather than a legal binding treaty (the Treaty of Rome). Moreover, the ASEAN does not have a powerful body like the European Commission to guarantee and monitor implementation of decisions taken at regional level. Hence, it will be interesting for the EAC to see how ASEAN is trying to ensure compliance and more specifically monitor the correct elimination of NTMs.
5.34 The ITWG is the body currently responsible for the elimination of NTMs. However, other ASEAN bodies will have to participate in this important task. One of these bodies, the ASEAN Consultative Committee for Standards and Quality (ACCSQ), has already set up a task force to deal with NTM elimination. The strategy envisaged by ASEAN reflects its members’ reluctance to encourage rigid structures and centralization of power. Such strategy is based on: 62 World Bank (2008a). Specifically, they were prevalent in electrical equipment, organic chemicals, motor vehicles, tobacco, cereals, sugar, cosmetics, beverages, cereal/flour/milk preparations, edible fruit and nuts, pharmaceuticals, cocoa, dairy products, coffee/tea/spices, live animals, vegetables, meat/fish preparations, vegetable preparations, waste from the food industry, seeds, live trees, meat, and edible offal.
58
• Market forces, specifically the ASEAN members’ motivation to increase intra-regional trade. An increase in trade would increase the dependence among member states and consequently reduce the probability of potential retaliation.
• Third party enforcement. As per the EU experience, ASEAN is considering the possibility of creating a sovereign body. The ASEAN decision-making model is very flexible at present and is based on informal agreements rather than legal binding decisions. Consequently, the third party enforcement will be tested only on a single sector at first. A sovereign body will be created with the purpose of managing and supervising the correct functioning of this sector by issuing rules and directives when necessary and ensuring their correct transposition in national laws.
5.35 ASEAN envisages that should these mechanisms be insufficient in some sector, the enforcement of compliance will have to be ensured by counter-notification, dispute settlement, and sanctions. However, the monitoring system has not yet been put in place. For this, ASEAN is looking at the WTO’s Trade Policy Review Mechanism and at the EU Scoreboard as possible models.
59
CHAPTER 6. LOOKING FORWARD: RECOMMENDATIONS FOR FOLLOW-THROUGH
6.1 In the EAC, non-tariff measures—coupled with poor infrastructure, limited human skills capacity and considerable scope for corruption/fraudulent behavior—add to the difficulty and cost of trading goods. Since the imposition of the NTMs largely follow the trade corridors, the farther the member country and its various regions is located from the source of goods, the greater is the likelihood that NTMs will add to delays in time and monetary cost.
6.2 The instruments under the EAC Customs Union Protocol are just being initiated to curb NTMs on formal goods trade along the trade corridors. Based on the consensus at the EAC Council of Ministers on the need to eliminate most NTMs, the EAC Secretariat needs to develop a mandate and capacity for monitoring and classification of NTMs and implementation of the action plans for reduction/removal of the non-transparent and discriminatory ones. The implementation of elimination plans through the member governments may face specific challenges, ranging from difficulties in estimating the constraint imposed by individual NTMs on specific trade flows to the national political and economic interests that make targeting difficult. The phase 1 task team recommends that the EAC observe, learn from, and take specific practicable decisions to emulate the successful steps in NTM removal undertaken by other RECs, especially the EU (as discussed in chapter 5). The member states should also prepare for a prolonged period over which such decisions will actually be implemented after the decisions are taken.
6.3 The phase 1 task team makes the following recommendations:
I. NTM DECISIONS
A. General WTO consistency for existing NTMs
6.4 The team recommends that the Council of Ministers consider and agree on the principle that NTMs inconsistent with the WTO rules have to be eliminated within the EAC. As noted in chapter 3, WTO consistency requires NTMs to be “transparent,” “non-discriminatory” among the domestic goods flow and intra-EAC/international trade, “scientifically based,” and “with no better alternative.” The preliminary list of NTMs, prepared in chapter 4, should be investigated for these characteristics. At the start of this process in phase 1, it seems that the prevailing NTMs can be nontransparent and are mostly discriminatory against other EAC members. With immediate effect, NTMs that are not WTO-consistent in EAC—whether or not they restrict intra-EAC trade in certain products, and irrespective of the political economy—are to be eliminated.
B. Specific decisions for existing NTMs
6.5 The NTMs in line with the WTO rules still need to be removed, but could be considered on a preferential basis. Here, the ongoing choices in ASEAN could provide guidance for the EAC decisions (see chapter 5). The team recommends that the priority for EAC action be determined on the basis of the following criteria:
60
Regulatory objective 6.6 The choice could be on the basis of the NTM’s objective, be it national consumer protection or the generation of revenue at the national/local level. This criterion may be important for the EAC since many of the NTMs, found in chapter 4, apply across a range of products, and the revenue needs are important due to the economic status of the various members.
Trade impact 6.7 The choice could be made on the basis of the NTM’s trade restrictiveness, including the following elements: number of private sector complaints, value of export/import affected, and difference between domestic and world prices for consumer. The findings in chapter 4 are prioritized on the basis of the first element.63 Though it will be difficult to assess the total value of export/import affected by a particular NTM, chapter 2 listed the top goods by value traded in the EAC. For most EAC members, other than Kenya, these goods are also the most important ones in the value share of overall trade. Hence, prioritizing the NTMs that apply specifically to these goods will yield added benefits from expansion of EAC’s global trade. Further investigation may be needed, in phase 2, to determine the extent to which the NTMs increase the consumer prices of these goods.
6.8 One way forward for developing a strategy for reducing/removing NTMs given national differences and capacity constraints is to adopt a product/sector view in a phased manner. In ASEAN, the choice of these sectors was made on the basis of comparative advantage in natural resource endowments, labor skills, cost competitiveness, and value-added contribution to the REC economy or share of intra-regional trade. As analyzed in chapter 2, the intra-EAC trade is quite product-specific. However, the current NTMs on formal goods trade revealed by private sector firms and public sector institutions, in chapter 4, are largely not product-specific.64 Going through some of the supply chains of intra-EAC traded products and following the flows across borders would reveal the costs faced by the private sector. In this way, it would be possible to deal with the problem of formality/informality of trade and big differences between written rules and actual border practice. As noted, this is being investigated for the intra-EAC maize trade, one of the top products traded in the region by Tanzania and Uganda.
6.9 In a few goods, like milk, beef, poultry (including day-old chicks), the EAC may want to develop specific region-wide technical and/or SPS standards after detailed investigations. In choosing the specific product it would be important to consider the regulatory objective and /or intra-EAC trade impact of the NTM. Here the guidance from the ongoing process of deliberations and decisions in the ASEAN countries will be useful. This could be based on harmonization with performance requirements, involving a single set of fully harmonized and detailed provisions. This approach is used for products that could put consumers’ safety at risk and for which performance-oriented legislation is felt needed. Any capacity building initiatives in the overall area of the technical and/or SPS standards for goods should be assessed vis-à-vis clear articulated demand from end-users in the public/private sector, rather than from the national bureaus of standards.
63 The private sector complaints in the EAC are the strongest about poor infrastructure. This is followed by the NTMs listed in chapter 4, and corruption/fraudulent behavior. The private sector also complained about the limited human skills and technical capacity of the trade/transit facilitators and national government officials in the EAC. 64 Further investigation of informal trade in the EAC may lead to a revision of this conclusion, especially in traded “food and live animals.”
61
6.10 Given the fiscal and human capacity constraints that exist in the EAC for now and dependence on implementation of region-wide decisions only by national institutions, it is by no means being suggested that the EAC choose the above course of action for all major goods traded among the five members. For most goods, the “new approach” of the EU could apply to products with similar characteristics and where there is widespread divergence of technical regulations in EAC countries. This streamlined approach would rely only on the “essential requirements” and allow greater freedom for manufacturers on the way to satisfy those requirements. This would significantly reduce the red-tape originating from various standards agencies that mires goods trade in the region in particular and in developing countries in general. Gradually, this approach could provide private firms with a number of choices for attestation methods: self-certification against the essential requirements; generic standards; or using notified bodies for type approval and testing of conformity of type. On the TBT and SPS measures, the WTO guidelines tend to be most relevant for the OECD countries and the EAC is advised to be cautious as not to constrain the potential for growth in the region. C. Monitoring for new NTMs 6.11 With respect to the monitoring for new NTMs that may be imposed by member states, the EAC could learn from the EU’s adoption of preventive measures which oblige member states to notify all draft regulations and standards related to technical specifications to be introduced on national territories. In this way, the Commission is able to monitor and prevent the raise of new national barriers to intra-EU trade.
6.12 The EU’s internal market scoreboard may prove to be a useful instrument for the EAC Secretariat to emulate. The European Commission maintains this scoreboard on member adherence to REC-wide rules including those on NTMs on trade, which can be used to name and shame members into compliance. For the EAC, such a scoreboard could report the status of the NTMs action plans and the number of infringement proceedings due to new NTMs initiated against member states. These proceedings could be initiated as a consequence of continuing or new application of a NTM by a member state. In this case, the member state is encouraged to quickly remedy the situation, and if it fails to do so it is referred to the EAC court, which can impose a sanction. To supervise the proper functioning of the internal market for goods in the EAC, the Secretariat would need to develop adequate capacity for classifying NTMs reported and monitoring, as would the member states in identifying and notifying the observed NTMs. Later this could be supplemented by capacity for enforcement and redress action. Other EAC institutions could be needed to contribute to this important function.
6.13 It has been agreed by the EAC Council of Ministers that all truck drivers should carry NTM spot-and-patch forms to record all the barriers they face along the transit routes in the region. This form would then be submitted to the Ministry of Trade, Tourism and Industry in the member country for review, and subsequently forwarded to the EAC Secretariat for classification and redress action, if needed. This plan has yet to take off in the member states. The current capacity of the Secretariat to undertake this sensitive activity is unclear, as is the role of the NMCs in this monitoring activity is unclear, neither are the current capacity to do so by the NMCs or the EAC Secretariat
D. Associated Common Market Operation
6.14 The trade links of the EAC members with their external markets remain a significant source of growth for the region, as seen in chapter 2. Hence, in the development of the EAC Common Market the team recommends that the EAC consider the open regionalism model of the
62
ASEAN, based on the principle of increased adherence to WTO rules, in order not to lose benefits from the large external market size of most its members relative to other RECs. Through feasible processes, the EAC could urge its members to adopt consistency to WTO agreements on technical barriers to trade (TBT), sanitary and phyto-sanitary measures (SPS) and import licensing procedures, as well as develop the related implementation guidelines as a means for NTM elimination.
6.15 As integration deepens and associated activities expand, the EAC may want to explore the option of reaching REC-wide decision making by majority, on the lines of the EU, rather than the current decisions made by unanimity only. Majority voting in the EAC may the means to alleviate a specific member’s ability to hold the adoption of EAC-wide policies hostage, in case protectionist national interest is the basis of a specific NTM.
6.16 Such decisions will go a long way toward simplifying the monitoring, reducing, and removing of NTMs emanating from these areas.
II. WORKING WITHIN THE CURRENT EAC SYSTEM
6.17 On the private sector side, firms requested overall simplification, transparency, and more rigorous application of EAC-wide rules and procedures surrounding intra-regional goods trade. In cases where the firms were also trading in markets external to the REC – mostly in Europe – they proposed that the regional rules/standards adopted be largely consistent with their global participation. Various proposals by private firms to alleviate NTMs impeding goods trade in EAC emerged during the stocktaking interviews. The firms tended to focus on the implementing agent in the EAC. They perceive that each member state could go a long way in reforming national policy or implementing follow-up actions unilaterally behind the border to alleviate the NTMs. Examples of such recommended national action include instituting a one-stop clearance at ports and border posts; opening up private competition for management of weighbridges and pre-shipment inspection; seeking private funding to upgrade institutions for product quality control; etc. Actions recommended at the EAC level include establishing a common road transit system and a common carrier license; initiating mutual automated data exchanges; etc. Such recommendations are expected help planning of the phase 2 work program on this activity. However, a clear priority across the range of actions mentioned did not emerge clearly across various interviews, and across member states.
6.18 The task team understands that the EAC Council of Ministers may want to deliberate at length over the specific features of EAC-wide strategy for NTMs constraining goods trade - on the lines recommended in section I - in order to implement Article 13 of the Protocol effectively. NTMs that are not WTO-consistent in EAC need to be eliminated, but capacity needs to be built up to do so and monitor compliance. This remains critical.
6.19 The Council may simultaneously want estimates the time and effort it may take to make progress on implementation of reduction/removal plans under the current circumstances. A distinguishing feature could be whether or not the EAC-wide agreement is already adopted (but not implemented). This is considered further in the current section. Table 6.1 suggests some NTMs on EAC goods trade for action, where the team concurs with the private sector suggestions and tries to estimate the ease by which NTMs could be removed.
63
A. Category 1 6.20 Where EAC-wide consensus agreements exist,65 the action steps have to be devised, implemented, and mutually monitored by the members. Where a statement within the Protocol itself or a unanimous decision of the Council of Ministers the political commitment of the members to remove these NTMs has been underscored. Most of these NTMs continue to exist because member governments or their agencies are delaying implementation of the provisions in the EAC Protocol or the decisions/resolutions of EAC Council of Ministers, or the follow-up directives by responsible ministers to eliminate them. (Some others, like the ‘harmonization of technical standards’ may need a framework for decision making and several steps. Hence they would be in category 3 below). The team expects the implementation span for category 1 NTMs to be short. Such NTMs may vary in their trade restrictiveness (that is, according to the classification schemes in figure 3.1 they may lie in quadrants A or B). Technical assistance may be needed for implementation, especially for the new members, Burundi and Rwanda. Nonetheless, all category 1 NTMs may well be the low-hanging fruits that EAC may wish to target first.
B. Category 2 6.21 If an EAC-wide agreement has yet to be reached, a medium-term program of consensus building in and among the member states and unanimous agreement on policy and action steps at the Council is envisaged. Such category 2 NTMs are expected to account for the bulk of the total action in this area. In the traditional EAC thinking, such NTMs arise from policy differences or lack of cross-border harmonization and standardization of procedures and regulations.66 Benchmarking the EAC and national development of harmonized and simplified clearance and transit procedures and standards (such as by the widely used Kyoto Convention) could proceed according to WTO recommendations/ requirements or along the lines followed by other RECs. Various instruments such as Single Administrative Documents (SADs), Time Release studies, the World Customs Organization (WCO) Diagnostic, and the WCO data model have been developed to enhance this process.
6.22 However, this is not the only way forward. Sections I and II in this chapter have delineated an alternative, simplified way forward in dealing with category 2 NTMs, based on promotion of open regionalism through increased adherence to WTO rules by the members. For most products, the prolonged and resource-intensive process of harmonization of standards could be replaced by the simpler principle of mutual recognition, as in the EU (see chapter 7). In the limited number of product cases where the Council chooses to harmonize, separate EAC-wide standards do not need to be developed. Quality requirements for EAC exports outside the region already exist. Intra-EAC/national standards just need to adopt and comply with these, not revise them.
6.23 In both cases, the way forward will require technical assistance and capacity building over the short and medium term, as significant time and effort may be needed to devise and implement a plan for removing each NTM.
65 The task team has yet to verify the status of specific decisions on NTMs taken by the EAC since the Trade Review Committee report (February 2008). 66 In general, category 2 NTMs can be located anywhere in figure 3.1, although with greater political and technical complexity expected than category 1.
64
C. Category 3 6.24 Where government monopolies and/or fiscal constraints have given rise to severe infrastructure constraints, the consequent/related (category 3) NTMs will need prior large-scale investments, and long-term interventions in expansion/rehabilitation of physical infrastructure in a coordinated manner across the EAC, especially along the two corridors. Here the prioritization could consider the potential for (i) combining the economic strengths of EAC members for regional advantage; (ii) facilitating intra-EAC trade and investments; (iii) attracting and retaining manufacturing activities within EAC; (iv) promoting outsourcing in EAC; and (v) developing EAC products and services.67
6.25 The decisions and action related to technical standards for goods and the associated SPS considerations can be visualized in this category, since it is expected to take a prolonged period to intervention to adopt a general framework, adopt it and install the appropriate infrastructure and human capacity to implement the decisions
67 Despite recognition of their obvious trade-restrictive nature and country commitments made under the Uruguay Round. See the APRIS project in ASEAN for success/shortcomings of similar choices made. http://www.aseansec.org/apris2/index.htm.
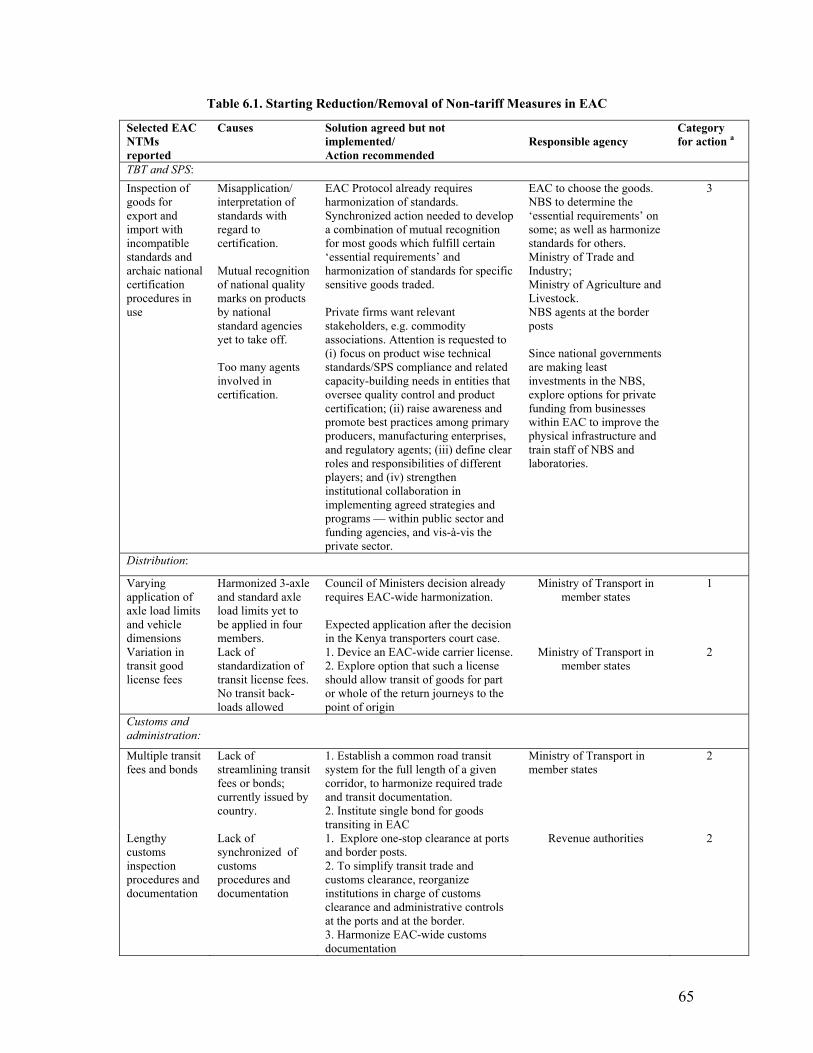
65
Table 6.1. Starting Reduction/Removal of Non-tariff Measures in EAC
Selected EAC NTMs reported
Causes Solution agreed but not implemented/ Action recommended
Responsible agency Category for action a
TBT and SPS: Inspection of goods for export and import with incompatible standards and archaic national certification procedures in use
Misapplication/ interpretation of standards with regard to certification. Mutual recognition of national quality marks on products by national standard agencies yet to take off. Too many agents involved in certification.
EAC Protocol already requires harmonization of standards. Synchronized action needed to develop a combination of mutual recognition for most goods which fulfill certain ‘essential requirements’ and harmonization of standards for specific sensitive goods traded. Private firms want relevant stakeholders, e.g. commodity associations. Attention is requested to (i) focus on product wise technical standards/SPS compliance and related capacity-building needs in entities that oversee quality control and product certification; (ii) raise awareness and promote best practices among primary producers, manufacturing enterprises, and regulatory agents; (iii) define clear roles and responsibilities of different players; and (iv) strengthen institutional collaboration in implementing agreed strategies and programs — within public sector and funding agencies, and vis-à-vis the private sector.
EAC to choose the goods. NBS to determine the ‘essential requirements’ on some; as well as harmonize standards for others. Ministry of Trade and Industry; Ministry of Agriculture and Livestock. NBS agents at the border posts Since national governments are making least investments in the NBS, explore options for private funding from businesses within EAC to improve the physical infrastructure and train staff of NBS and laboratories.
3
Distribution:
Varying application of axle load limits and vehicle dimensions
Harmonized 3-axle and standard axle load limits yet to be applied in four members.
Council of Ministers decision already requires EAC-wide harmonization. Expected application after the decision in the Kenya transporters court case.
Ministry of Transport in member states
1
Variation in transit good license fees
Lack of standardization of transit license fees. No transit back-loads allowed
1. Device an EAC-wide carrier license. 2. Explore option that such a license should allow transit of goods for part or whole of the return journeys to the point of origin
Ministry of Transport in member states
2
Customs and administration:
Multiple transit fees and bonds
Lack of streamlining transit fees or bonds; currently issued by country.
1. Establish a common road transit system for the full length of a given corridor, to harmonize required trade and transit documentation. 2. Institute single bond for goods transiting in EAC
Ministry of Transport in member states
2
Lengthy customs inspection procedures and documentation
Lack of synchronized of customs procedures and documentation
1. Explore one-stop clearance at ports and border posts. 2. To simplify transit trade and customs clearance, reorganize institutions in charge of customs clearance and administrative controls at the ports and at the border. 3. Harmonize EAC-wide customs documentation
Revenue authorities 2
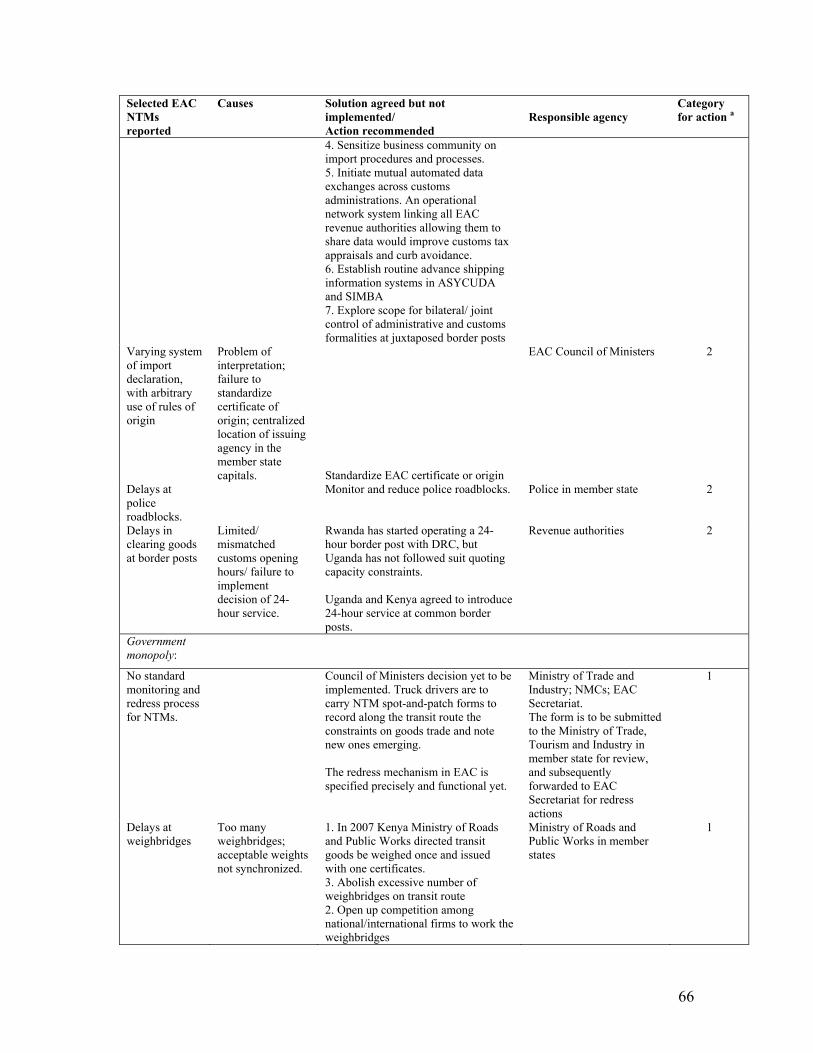
66
Selected EAC NTMs reported
Causes Solution agreed but not implemented/ Action recommended
Responsible agency Category for action a
4. Sensitize business community on import procedures and processes. 5. Initiate mutual automated data exchanges across customs administrations. An operational network system linking all EAC revenue authorities allowing them to share data would improve customs tax appraisals and curb avoidance. 6. Establish routine advance shipping information systems in ASYCUDA and SIMBA 7. Explore scope for bilateral/ joint control of administrative and customs formalities at juxtaposed border posts
Varying system of import declaration, with arbitrary use of rules of origin
Problem of interpretation; failure to standardize certificate of origin; centralized location of issuing agency in the member state capitals. Standardize EAC certificate or origin
EAC Council of Ministers 2
Delays at police roadblocks.
Monitor and reduce police roadblocks. Police in member state 2
Delays in clearing goods at border posts
Limited/ mismatched customs opening hours/ failure to implement decision of 24-hour service.
Rwanda has started operating a 24-hour border post with DRC, but Uganda has not followed suit quoting capacity constraints. Uganda and Kenya agreed to introduce 24-hour service at common border posts.
Revenue authorities 2
Government monopoly:
No standard monitoring and redress process for NTMs.
Council of Ministers decision yet to be implemented. Truck drivers are to carry NTM spot-and-patch forms to record along the transit route the constraints on goods trade and note new ones emerging. The redress mechanism in EAC is specified precisely and functional yet.
Ministry of Trade and Industry; NMCs; EAC Secretariat. The form is to be submitted to the Ministry of Trade, Tourism and Industry in member state for review, and subsequently forwarded to EAC Secretariat for redress actions
1
Delays at weighbridges
Too many weighbridges; acceptable weights not synchronized.
1. In 2007 Kenya Ministry of Roads and Public Works directed transit goods be weighed once and issued with one certificates. 3. Abolish excessive number of weighbridges on transit route 2. Open up competition among national/international firms to work the weighbridges
Ministry of Roads and Public Works in member states
1
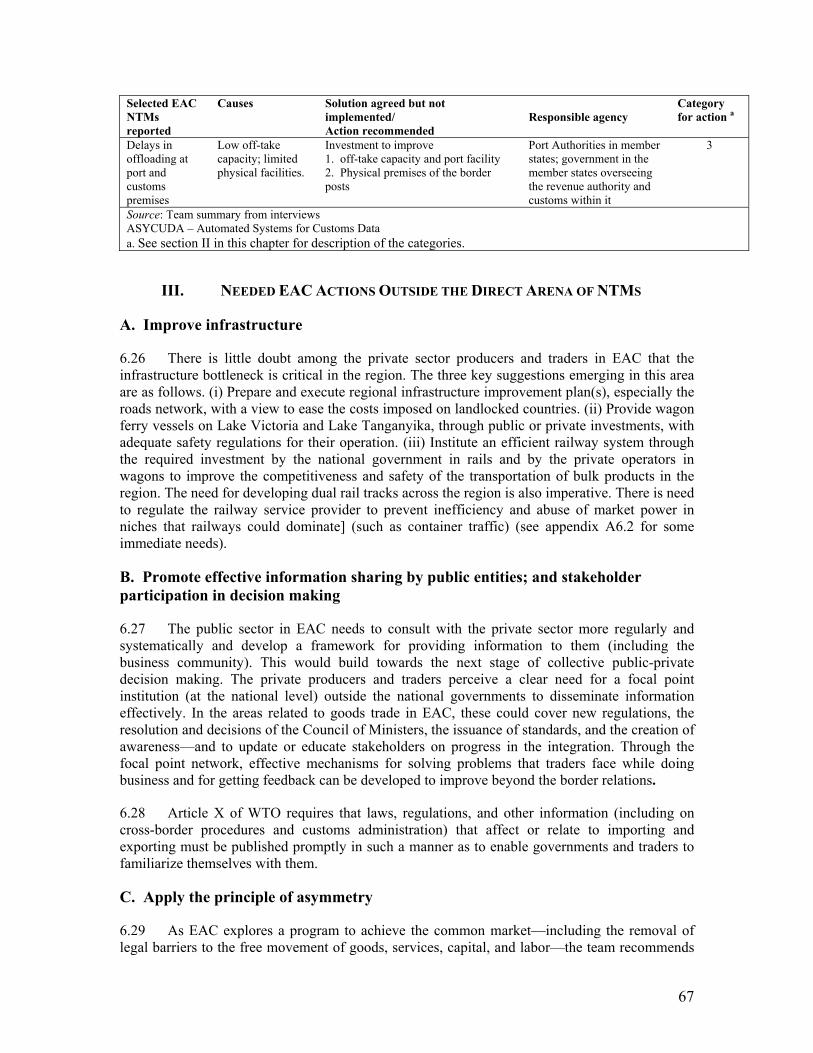
67
Selected EAC NTMs reported
Causes Solution agreed but not implemented/ Action recommended
Responsible agency Category for action a
Delays in offloading at port and customs premises
Low off-take capacity; limited physical facilities.
Investment to improve 1. off-take capacity and port facility 2. Physical premises of the border posts
Port Authorities in member states; government in the member states overseeing the revenue authority and customs within it
3
Source: Team summary from interviews ASYCUDA – Automated Systems for Customs Data a. See section II in this chapter for description of the categories.
III. NEEDED EAC ACTIONS OUTSIDE THE DIRECT ARENA OF NTMS
A. Improve infrastructure
6.26 There is little doubt among the private sector producers and traders in EAC that the infrastructure bottleneck is critical in the region. The three key suggestions emerging in this area are as follows. (i) Prepare and execute regional infrastructure improvement plan(s), especially the roads network, with a view to ease the costs imposed on landlocked countries. (ii) Provide wagon ferry vessels on Lake Victoria and Lake Tanganyika, through public or private investments, with adequate safety regulations for their operation. (iii) Institute an efficient railway system through the required investment by the national government in rails and by the private operators in wagons to improve the competitiveness and safety of the transportation of bulk products in the region. The need for developing dual rail tracks across the region is also imperative. There is need to regulate the railway service provider to prevent inefficiency and abuse of market power in niches that railways could dominate] (such as container traffic) (see appendix A6.2 for some immediate needs).
B. Promote effective information sharing by public entities; and stakeholder participation in decision making
6.27 The public sector in EAC needs to consult with the private sector more regularly and systematically and develop a framework for providing information to them (including the business community). This would build towards the next stage of collective public-private decision making. The private producers and traders perceive a clear need for a focal point institution (at the national level) outside the national governments to disseminate information effectively. In the areas related to goods trade in EAC, these could cover new regulations, the resolution and decisions of the Council of Ministers, the issuance of standards, and the creation of awareness—and to update or educate stakeholders on progress in the integration. Through the focal point network, effective mechanisms for solving problems that traders face while doing business and for getting feedback can be developed to improve beyond the border relations.
6.28 Article X of WTO requires that laws, regulations, and other information (including on cross-border procedures and customs administration) that affect or relate to importing and exporting must be published promptly in such a manner as to enable governments and traders to familiarize themselves with them.
C. Apply the principle of asymmetry
6.29 As EAC explores a program to achieve the common market—including the removal of legal barriers to the free movement of goods, services, capital, and labor—the team recommends
68
putting in place a policy to mitigate the effects of the completion of the internal market on relatively disadvantaged member states (those that are landlocked or are the least economically developed). This will reduce development discrepancies between the member states. Removal of physical barriers for goods crossing the intra-EAC borders is merely the first step to facilitate trade through reduced delivery times and lower associated costs.
D. Promote the use of English
6.30 The agreed language across EAC for overall administration, public trade facilitation, and private transactions is English. However, for members that were originally francophone, especially Burundi, concrete steps are recommended to promote English in government administration, and in doing so, facilitate the private sector goods trade of these members.
6.31 These are a few ways, expected to be explored further in phase 2, on how the EAC could rethink its strategy to encourage intra-region goods trade and effectively observe, monitor, and reduce the NTMs hampering it.
69
APPENDIX GROUP A
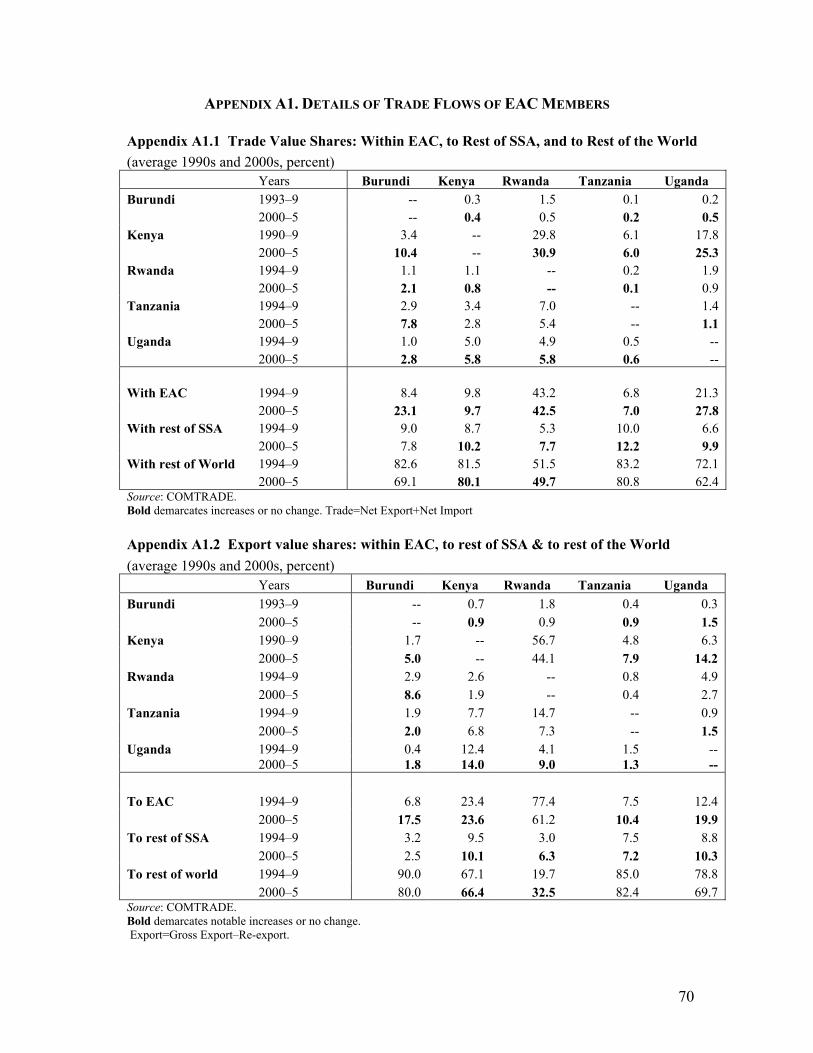
70
APPENDIX A1. DETAILS OF TRADE FLOWS OF EAC MEMBERS
Appendix A1.1 Trade Value Shares: Within EAC, to Rest of SSA, and to Rest of the World (average 1990s and 2000s, percent) Years Burundi Kenya Rwanda Tanzania Uganda Burundi 1993–9 -- 0.3 1.5 0.1 0.2 2000–5 -- 0.4 0.5 0.2 0.5 Kenya 1990–9 3.4 -- 29.8 6.1 17.8 2000–5 10.4 -- 30.9 6.0 25.3 Rwanda 1994–9 1.1 1.1 -- 0.2 1.9 2000–5 2.1 0.8 -- 0.1 0.9 Tanzania 1994–9 2.9 3.4 7.0 -- 1.4 2000–5 7.8 2.8 5.4 -- 1.1 Uganda 1994–9 1.0 5.0 4.9 0.5 -- 2000–5 2.8 5.8 5.8 0.6 -- With EAC 1994–9 8.4 9.8 43.2 6.8 21.3 2000–5 23.1 9.7 42.5 7.0 27.8 With rest of SSA 1994–9 9.0 8.7 5.3 10.0 6.6 2000–5 7.8 10.2 7.7 12.2 9.9 With rest of World 1994–9 82.6 81.5 51.5 83.2 72.1 2000–5 69.1 80.1 49.7 80.8 62.4 Source: COMTRADE. Bold demarcates increases or no change. Trade=Net Export+Net Import
Appendix A1.2 Export value shares: within EAC, to rest of SSA & to rest of the World (average 1990s and 2000s, percent) Years Burundi Kenya Rwanda Tanzania Uganda Burundi 1993–9 -- 0.7 1.8 0.4 0.3 2000–5 -- 0.9 0.9 0.9 1.5 Kenya 1990–9 1.7 -- 56.7 4.8 6.3 2000–5 5.0 -- 44.1 7.9 14.2 Rwanda 1994–9 2.9 2.6 -- 0.8 4.9 2000–5 8.6 1.9 -- 0.4 2.7 Tanzania 1994–9 1.9 7.7 14.7 -- 0.9 2000–5 2.0 6.8 7.3 -- 1.5 Uganda 1994–9 0.4 12.4 4.1 1.5 -- 2000–5 1.8 14.0 9.0 1.3 -- To EAC 1994–9 6.8 23.4 77.4 7.5 12.4 2000–5 17.5 23.6 61.2 10.4 19.9 To rest of SSA 1994–9 3.2 9.5 3.0 7.5 8.8 2000–5 2.5 10.1 6.3 7.2 10.3 To rest of world 1994–9 90.0 67.1 19.7 85.0 78.8 2000–5 80.0 66.4 32.5 82.4 69.7 Source: COMTRADE. Bold demarcates notable increases or no change. Export=Gross Export–Re-export.
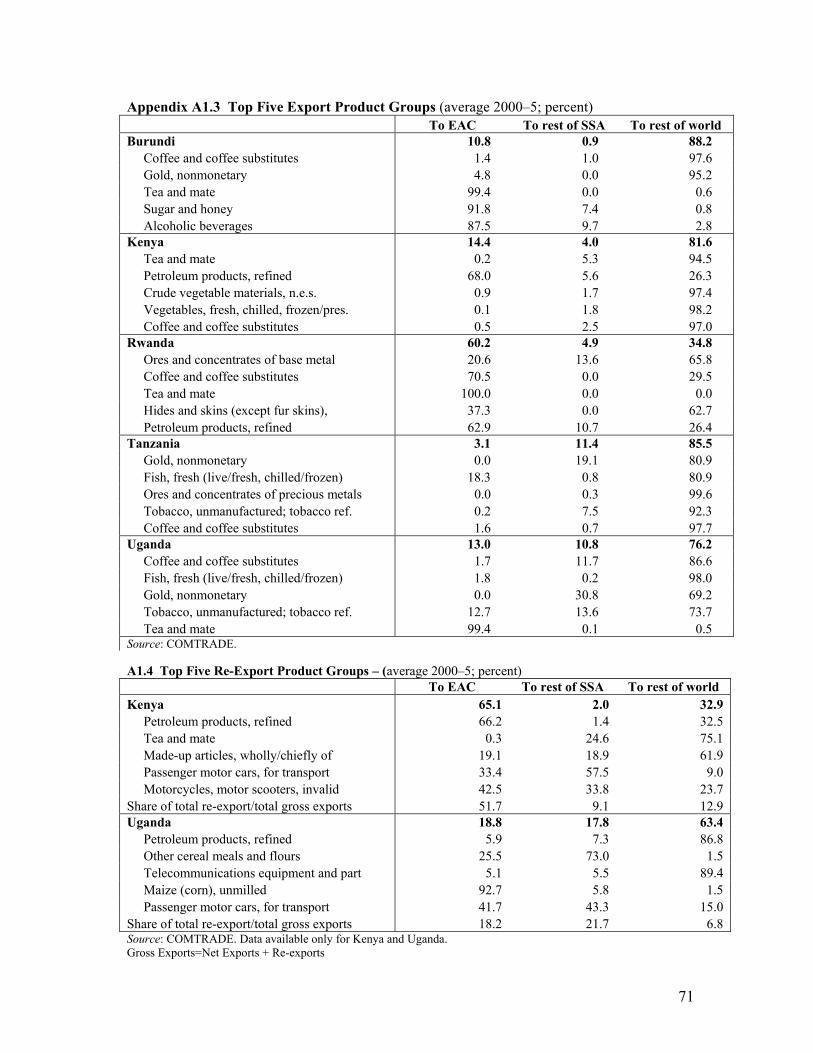
71
Appendix A1.3 Top Five Export Product Groups (average 2000–5; percent) To EAC To rest of SSA To rest of world Burundi 10.8 0.9 88.2 Coffee and coffee substitutes 1.4 1.0 97.6 Gold, nonmonetary 4.8 0.0 95.2 Tea and mate 99.4 0.0 0.6 Sugar and honey 91.8 7.4 0.8 Alcoholic beverages 87.5 9.7 2.8 Kenya 14.4 4.0 81.6 Tea and mate 0.2 5.3 94.5 Petroleum products, refined 68.0 5.6 26.3 Crude vegetable materials, n.e.s. 0.9 1.7 97.4 Vegetables, fresh, chilled, frozen/pres. 0.1 1.8 98.2 Coffee and coffee substitutes 0.5 2.5 97.0 Rwanda 60.2 4.9 34.8 Ores and concentrates of base metal 20.6 13.6 65.8 Coffee and coffee substitutes 70.5 0.0 29.5 Tea and mate 100.0 0.0 0.0 Hides and skins (except fur skins), 37.3 0.0 62.7 Petroleum products, refined 62.9 10.7 26.4 Tanzania 3.1 11.4 85.5 Gold, nonmonetary 0.0 19.1 80.9 Fish, fresh (live/fresh, chilled/frozen) 18.3 0.8 80.9 Ores and concentrates of precious metals 0.0 0.3 99.6 Tobacco, unmanufactured; tobacco ref. 0.2 7.5 92.3 Coffee and coffee substitutes 1.6 0.7 97.7 Uganda 13.0 10.8 76.2 Coffee and coffee substitutes 1.7 11.7 86.6 Fish, fresh (live/fresh, chilled/frozen) 1.8 0.2 98.0 Gold, nonmonetary 0.0 30.8 69.2 Tobacco, unmanufactured; tobacco ref. 12.7 13.6 73.7 Tea and mate 99.4 0.1 0.5 Source: COMTRADE.
A1.4 Top Five Re-Export Product Groups – (average 2000–5; percent) To EAC To rest of SSA To rest of world Kenya 65.1 2.0 32.9 Petroleum products, refined 66.2 1.4 32.5 Tea and mate 0.3 24.6 75.1 Made-up articles, wholly/chiefly of 19.1 18.9 61.9 Passenger motor cars, for transport 33.4 57.5 9.0 Motorcycles, motor scooters, invalid 42.5 33.8 23.7 Share of total re-export/total gross exports 51.7 9.1 12.9 Uganda 18.8 17.8 63.4 Petroleum products, refined 5.9 7.3 86.8 Other cereal meals and flours 25.5 73.0 1.5 Telecommunications equipment and part 5.1 5.5 89.4 Maize (corn), unmilled 92.7 5.8 1.5 Passenger motor cars, for transport 41.7 43.3 15.0 Share of total re-export/total gross exports 18.2 21.7 6.8 Source: COMTRADE. Data available only for Kenya and Uganda. Gross Exports=Net Exports + Re-exports
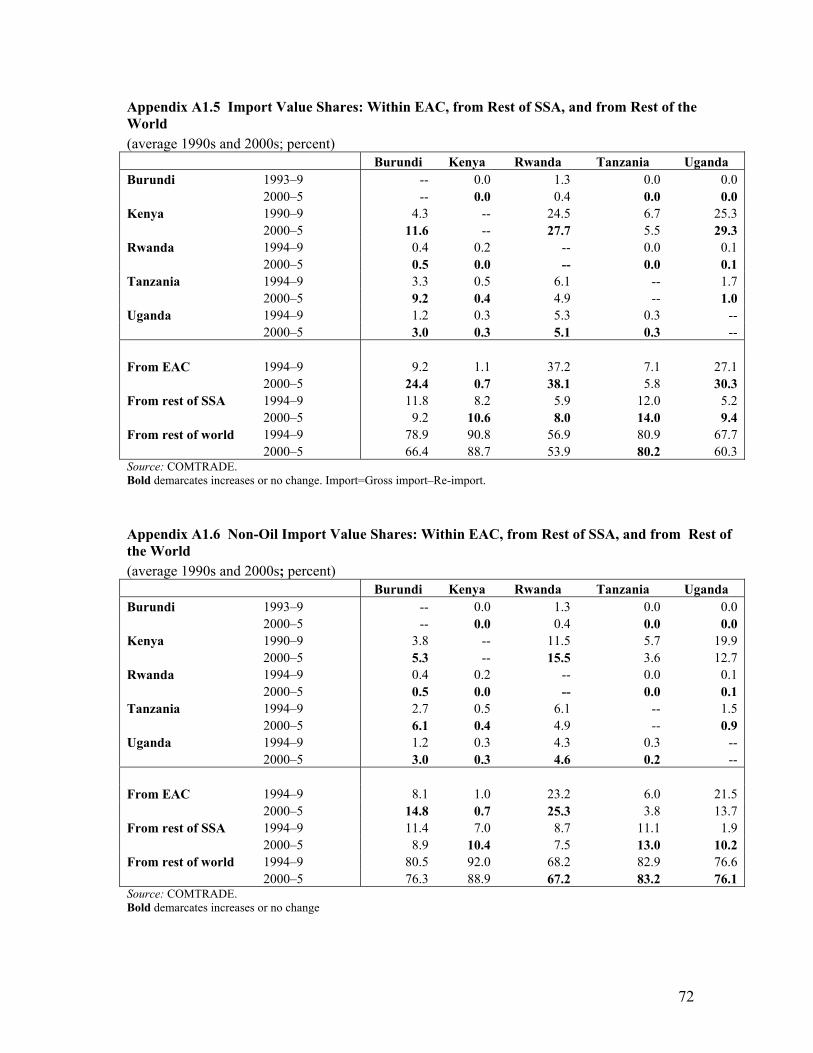
72
Appendix A1.5 Import Value Shares: Within EAC, from Rest of SSA, and from Rest of the World (average 1990s and 2000s; percent) Burundi Kenya Rwanda Tanzania Uganda Burundi 1993–9 -- 0.0 1.3 0.0 0.0 2000–5 -- 0.0 0.4 0.0 0.0 Kenya 1990–9 4.3 -- 24.5 6.7 25.3 2000–5 11.6 -- 27.7 5.5 29.3 Rwanda 1994–9 0.4 0.2 -- 0.0 0.1 2000–5 0.5 0.0 -- 0.0 0.1 Tanzania 1994–9 3.3 0.5 6.1 -- 1.7 2000–5 9.2 0.4 4.9 -- 1.0 Uganda 1994–9 1.2 0.3 5.3 0.3 -- 2000–5 3.0 0.3 5.1 0.3 -- From EAC 1994–9 9.2 1.1 37.2 7.1 27.1 2000–5 24.4 0.7 38.1 5.8 30.3 From rest of SSA 1994–9 11.8 8.2 5.9 12.0 5.2 2000–5 9.2 10.6 8.0 14.0 9.4 From rest of world 1994–9 78.9 90.8 56.9 80.9 67.7 2000–5 66.4 88.7 53.9 80.2 60.3 Source: COMTRADE. Bold demarcates increases or no change. Import=Gross import–Re-import.
Appendix A1.6 Non-Oil Import Value Shares: Within EAC, from Rest of SSA, and from Rest of the World (average 1990s and 2000s; percent) Burundi Kenya Rwanda Tanzania Uganda Burundi 1993–9 -- 0.0 1.3 0.0 0.0 2000–5 -- 0.0 0.4 0.0 0.0 Kenya 1990–9 3.8 -- 11.5 5.7 19.9 2000–5 5.3 -- 15.5 3.6 12.7 Rwanda 1994–9 0.4 0.2 -- 0.0 0.1 2000–5 0.5 0.0 -- 0.0 0.1 Tanzania 1994–9 2.7 0.5 6.1 -- 1.5 2000–5 6.1 0.4 4.9 -- 0.9 Uganda 1994–9 1.2 0.3 4.3 0.3 -- 2000–5 3.0 0.3 4.6 0.2 -- From EAC 1994–9 8.1 1.0 23.2 6.0 21.5 2000–5 14.8 0.7 25.3 3.8 13.7 From rest of SSA 1994–9 11.4 7.0 8.7 11.1 1.9 2000–5 8.9 10.4 7.5 13.0 10.2 From rest of world 1994–9 80.5 92.0 68.2 82.9 76.6 2000–5 76.3 88.9 67.2 83.2 76.1 Source: COMTRADE. Bold demarcates increases or no change
73
APPENDIX A2. TRADE ROUTES IN EAST AFRICA
The East African Community is served by two main corridors. The Northern Corridor connects the port of Mombasa to Nairobi, Kampala, Kigali, Bujumbura, and eastern Democratic Republic of Congo (DRC). The Central Corridor connects the port of Dar es Salam to Kampala, with branches to Kigali, Bujumbura, and entry points to DRC. The two corridors serve an area consisting of three landlocked countries (Burundi, Rwanda, and Uganda), the eastern part of DRC, southern Sudan, and Ethiopia. The port of Dar es Salam also serves the landlocked countries to its southwest (Malawi and Zambia). A pictorial presentation of the traditional road-rail routes of the Northern and Central Corridors is presented in map A2. The Northern Corridor This is a multimodal corridor (road, rail, inland water transport and pipeline) that connects the port of Mombasa to Nairobi, Kampala, Kigali, Bujumbura, and eastern DRC. The Northern Corridor has a longer history than the Central Corridor, and is complete within the EAC. However, there is a long missing link across DRC and parts of Central African Republic, which prevents any transit trade traffic between East and West Africa. Road. The key transit transport routes to the Great Lakes countries are from Mombasa to Bujumbura in Burundi (the southwest terminus). The average distance traveled by truck on this route is 2,050 km.68 The bulk of imports and exports destined to and from countries in the corridor are transported through either of these transit routes. From Kenya to Uganda, the Mombasa–Malaba– Kampala road (1,170 km) is preferred because the road is of relatively good quality and social amenities are available en route. Transit time in the recent months has averaged 10 days, depending on the period taken (usual is about 5 days, after the transit truck leaves the port of Mombasa). The alternative route is Mombasa–Kisumu–Busia–Kampala. From Uganda to Rwanda, the principal routes are Kampala–Kagitumba–Kigali and Kampala–Gatuna– Kigali. Bujumbura in Burundi is reached from Kigali (Rwanda) through the border post of Kanyaru–Haut. The terrain of the roads has steep slopes for the trucks to negotiate. The Northern Corridor road network by member countries is shown in table A2.1.
Table A2.1. Northern Corridor Main Road Network Country Paved (km) Unpaved (km) Total (km) Burundi 320 36 356Kenya 1196 -- 1196Rwanda 814 -- 814Uganda a 1042 657 1669Total in EAC 3372 693 4035EAC’s share of total NC road network (percent) 50 10 60
a. Does not include the Kampala–Karuma–Pakwach–Nebbi–Goli–Arua.
The road freight industry represented by the population of cargo fleets that serves the Northern Corridor has expanded rapidly in recent decades, due to the growth within EAC, the post-conflict reconstruction in many immediate neighbors of EAC, and a shift from a large share of the market
68 In all, the Mombasa-Kisangani (in DRC) route stretches for about 3,000 km to access DRC, the largest market of goods reachable through the landlocked EAC members. Bukavu, Goma, and Kisangani, all in DRC, are reached from Rwanda and Uganda.
74
previously served by rail transport. The advantage of this overland route for road freight is that no trans-shipment has been necessary at the various borders, although freight must pass through several countries. Most of the road transit traffic is operated by private companies, which transport foodstuff, agricultural produce, livestock, consumer manufactures, and other industrial products across the corridor. About two-thirds of the road network is paved. Although the condition is generally better than the Central Corridor, inadequate resources severely constrain rehabilitation and maintenance by various EAC members. Various spots—for example, the Bugarama–Bujumbura link spanning around 40 kilometers—are in extremely poor condition. Overloaded freight vehicles and poor enforcement of axle load regulations further deteriorate the road network and reduce road life spans. Security conditions have been problematic in Kenya from December 2007 to February 2008. Burundi has longer-term problems with road security, and travel between 6:00 p.m.-6:00 a.m. is not permitted. In Kenya, traffic flow is slowed by the need for a police escort within national territory for identified products. EAC has adopted regulations to a limit of 3 axle-35 ton rule trucks. To date, however, no country has been enforcing the legal axle weight along the corridor. Unlike the other countries traversed by the North Corridor in which there are limits on axle loads, Burundi has no weight restrictions on road traffic. The Northern Corridor is the route used for most of the fuel imports (over 80 percent) and tea and coffee exports for EAC. Railway. The rail transport network transports about 20 percent of the cargo shipped overland along part of the Northern Corridor. The single rail track from Mombasa to Kampala via Malaba—a total of 1,330 km—is currently the principal route for rail transit. The network is about 1,650 km, comprising of a single rail track from Mombasa through Nairobi, Nakuru to Kisumu in Kenya, through to Busia in Uganda. The main route from Mombasa goes through Nairobi, Nakuru, and Eldoret, to Malaba in Kenya. From the border at Malaba, the rail runs through Tororo, Jinja, and Kampala to Kasese in western Uganda.69 The route is served by express block trains operated by a recently appointed railway concessionaire (Rift Valley Railway), with the aim of facilitating faster movement of cargo from Mombasa to Kampala and return. According to KRC, the trains have managed to reduce transit times from 14 days in 2006 to the current best of 4–5 days. KRC estimates that average transit time is 7–9 days from the port of Mombasa to Kampala. This estimate, however, differs from business owner perception of an average transit time of 14 days. There are still no fixed schedule container trains. Shuttle trains from the port of Mombasa to Nairobi internal container depot may run two times a day, depending on availability of cargo. Pipeline. A pipeline connecting Mombasa to Eldoret and Kisumu is used for petroleum products by all EAC members, starting as far back as February 1978. The pipeline not only provides transport at a good price, but keeps many heavy vehicles with hazardous cargo off the busiest section of the Northern Corridor. About 80 per cent of imported petroleum products are destined for Kenya—including that for refining in Kenya before re-export to other countries—and 20 percent goes to the rest of the neighboring countries. Industrial fuel also constitutes a significant proportion of petroleum products transited along Northern Corridor countries. The oil pipeline links the refinery in Mombasa with Nairobi, Eldoret, and Kisumu in Kenya. The Nairobi pipeline terminus has an extension to Nakuru, Kenya. The Nairobi–Mombasa pipeline segment has pumps at Mombasa and at three intermediate booster stations located at Maungu, Mtito, Andei, and Sultan Hamud. It is 14 inches in diameter and about 450Km long. Its installed pumping capacity is 440,000 liters per day, with provisions for doubling the capacity. Even this increased capacity 69 From Kasese in Uganda, transit traffic en route to Rwanda, Burundi and DR Congo is handled by the road network
75
is way below demand for fuel in Kenya and other EAC countries, at more than 2,000,000 liters per day. Other landlocked members of EAC and inland cities in Kenya are served by transporting the petroleum products by road tankers from the end of the pipeline. Mombasa port. The port has a total annual capacity of 20 million metric tons. It has two separate terminals, one devoted solely to containers and the other for miscellaneous goods. The miscellaneous goods terminal is functioning below capacity, since there is a shift away from break bulk to containerized traffic. In contrast, the capacity of the container terminal is limited, resulting in backlogs at the offloading stages. According to the users that were met with, however, goods in transit for Burundi are stored in separate areas at the port. The transshipment procedures for goods in transit to the landlocked countries have been simplified pursuant to the arrangements negotiated under the Northern Corridor Transit Agreement signed by the Governments of Burundi, Kenya, Rwanda, and Uganda. The port is operated by a parastatal, the Kenya Ports Authority (KPA). The Government of Kenya intends to concession port operations and make KPA a port landlord and regulator, but such concessioning of operations has been highly controversial. The Mombasa-Bujumbura overland route. This is a mostly paved road in general good condition, except for the Bugarama–Bujumbura leg (spanning roughly 40 kilometers), which is in extremely poor condition in some spots. This leg has steep slopes. Security conditions are problematic, and travel between 6:00 p.m. and 8:00 a.m. is not permitted. In Kenya, traffic flow is slowed by the need for a police escort within national territory, which compounds shipping delays and costs. One major issue concerning the Northern Corridor is the fact that all goods traffic has to transit through the center of Nairobi on the Uhuru Highway. This contributes to major traffic bottlenecks for local/urban traffic and delays the transit traffic. Plans are underway to build a southern bypass around Nairobi for the transit or up country traffic. Unlike the other countries traversed by the Northern Corridor which have stipulated limits on axle loads, Burundi has no weight restrictions on road traffic. This is the route used by most of the country’s fuel imports (over 80 percent) and for tea exports. Transit through Lake Victoria. Although not operating at a level even close to its potential, lake transport could play an important role in transit traffic between Kenya and the Great Lakes countries. The routes are marked in map A2. The Kenya Maritime Authority under the Ministry of Transport regulates and coordinates all marine services in the Kenya, including ferry services at Lake Victoria, which are provided by Kenya Railway Corporation. The ferry links on Lake Victoria between Kisumu (Kenya), Port Bell/Jinja (Uganda), and Mwanza (Tanzania) could form an integral link to the rail network in the Northern Corridor. At present, the ferry cargo services between Kisumu and Port Bell is regular, though not often, and the service between Kisumu and Mwanza is irregular. The only rail-lake route on the corridor is through the Mombasa–Kisumu–Kampala route (1,242 km). This route leaves the main railway line at Nakuru to reach Kisumu on Lake Victoria. The inland water operations of KRC and URC have been taken over by the concessionaire of the Kenya–Uganda railway system. One priority activity underway is to rehabilitate two rail ferries to provide more regular IWT from Kisumu to Port Bell. Currently there are four wagons operating between Kisumu, Jinja, and Port Bell, with the average transit time to Uganda of 18–20 days. There is adequate capacity in wagon ferries operating on the lake to handle more cargo, if bottlenecks that hinder full utilization of this service are removed. Burundi and Rwanda are anxious to utilize a ferry link between Kisumu and Kemondo Bay, Tanzania, which would complete the Lake Victoria southwestern transport link between Kenya and the Great Lakes countries, for Burundi and Rwanda and for the southern towns of DRC, such as Lubumbashi. Full utilization of these water transit routes would require improving docking facilities at Kemondo Bay and rehabilitating the road links between Rwanda and Burundi.
76
Rwanda also plans to study whether navigation on the Akagera/Kagera river into Lake Victoria is technically/economically feasible. The Central Corridor
This corridor connects the Port of Dar es Salam through Tabora to Mwanza and Kampala, with branches to Kigali, Bujumbura, and entry points to DRC. The demand for the Central Corridor is currently approximately 600,000 transit metric tonnes plus about 750,000 metric tonnes of Tanzanian cargo. Burundi stands to gain the most from an upgraded Central Corridor, that would be 850 km shorter and crosses only one transit country instead of three transit countries. Rwanda will gain from a 200 km shorter route through only one transit country instead of two. Nevertheless, many products, such as tea, will continue to use the Northern Corridor because of the established auction houses or other facilities in Mombasa. Road. The Central Corridor is a combination of paved and gravel roads that can become impassable during the rainy season. An ambitious program to upgrade the whole road to bitumen standard with donor support is underway and includes rehabilitation (517 km), construction (527 km), and routine maintenance (200 km). According to the government of Rwanda, the Central Corridor section from Isaka to Rusumo Falls should be fully paved by 2010, i.e. the Central Corridor in EAC will be fully paved to Rwanda. Current demand on the road is approximately 1.1 million metric tonnes. The road network along the Central Corridor handles some 75–80 percent of goods moving to/from Burundi. It comprises two separate routes:
• By road, Dar es Salam–Bujumbura, through Mwanza and onward via border crossing at Kobero: This route is 1,200 km long and lies mostly within Tanzania. It has the advantage of having only one border-crossing point. Most of the roadway in Tanzania has been paved, with the exception of the Manyoni–Singiola (90 km) segment. In Burundi, the Bugarama–Bujumbura segment (spanning around 40 km) is in poor condition. Its steep slopes are often the cause of accidents over the travel time of five to six hours. Roundtrip cargo shipment time is estimated at about one month, taking into account the time required for travel, various customs and administrative formalities required, and loading/unloading at Dar es Salam and Bujumbura, as well as the truck maintenance.
• By a combined rail-ship route, Dar es Salam–Kigoma–Bujumbura. This route is 1,670 km long. Although the combined route is less expensive, it is being used less and less in recent years because of serious problems with aging infrastructure and transfer of shipments, which cause long delays and extra costs. Rail transport between Dar –es Salam and Kigoma is inefficient because of the poor condition of the rail tracks, shortage of wagons, and inadequacy of the locomotives. During the two annual rainy seasons, rail transport is disrupted as tracks become flooded.
Railway. Tanzania Railways (2,706 km total length) joins the port of Dar es Salam to the lake ports of Mwanza on Lake Victoria and Kigoma on Lake Tanganyika. The rail system is characterized by lack of wagons, poor track conditions, congestion at Kigoma port, time lost in intermodal transfers, and poor quality of service. Before concessioning of part of the railway system, Tanzania Railway Corporation handles only about 20 percent of the cargo from the Port of Dar es Salam. The demand on the corridor is approximately 1.3 million metric tonnes and is growing at about 10 percent a year. Two factors may increase the overall demand: the success of inland trade development and diversion of traffic to the Central Corridor because of better tariffs and service. At 20 percent, the rail share is roughly 250,000 metric tonnes. Dar es Salam port. The port of Dar es Salam has eight deep-water berths (1,478 m in length), and four terminals with a total capacity of 10 million metric tons per year. Both importers and
77
transshipment agents complain about the congestion and abnormally long delays at the other terminals at the port. Overall traffic has been growing steadily on the two corridors that the port of Dar es Salam serves. (Approximately 53 percent of transit traffic is for the Central Corridor and 47 percent is for the Southern Corridor connecting the Zambia, Malawi, DRC-Lubumbashi area). Dar es Salam handled 7.3 million metric tonnes in 2004, with an average annual growth in demand over the past five years of 10 percent. The port handled about 350,000 TEUs in 2007. The demand for container handling is growing by approximately 13 percent annually. The demand from Uganda and Rwanda for transit cargo on the Central Corridor varies year by year. Demand from Burundi and DRC, however, has steadily increased. Since 2001, the Container Terminal has realized a 60 percent increase in throughput, and transshipments have almost tripled. In 2002, the container terminal was taken over by a private sector consortium. With modernization through a computerized tracking system, it appears to have substantially improved its performance. The container terminal now operates at international standards. The terminal area is constricted, however, and the growth in container throughput has congested the terminal area. This congestion is reducing efficiency in clearing cargo from the port. The general cargo terminal is also experiencing continued performance problems. A parastatal, the Tanzania Ports Authority, operates the port of Dar es Salam. Kigoma port. The major infrastructure problems identified by the private sector are the shortage of suitable rolling stock and the age of the cargo handling equipment. This results in long delays in loading/unloading goods. The shipment on Lake Tanganyika is provided primarily by four Burundian companies: ARNOLAC, BATRALAC, SOTRALAC, and Tanganyika Transport. The Burundian fleet has a limited capacity. Its vessels are old, with some in service for over a hundred years. The country does not have its own shipyard. Bujumbura port. The port facilities have an annual capacity of 500,000 metric tons, with underutilization at current traffic levels. There are five berths, four of which are devoted to miscellaneous goods. The fifth is devoted to the loading/offloading of petroleum products. The handling equipment needs to be modernized to speed up goods loading and offloading operations. Trade Route Linking the North and Central Corridors
The Nairobi–Namanga–Arusha–Dodoma road route links the Northern and Central Corridors. This route is critical for Kenyan exports to Tanzania and southern Africa (notably Malawi and Zambia), as well as east and central Tanzania’s exports to the large Kenyan market and to southern Ethiopia and Sudan. The route section between Dodoma in Tanzania, through Arusha to Nairobi serves Tanzanian towns located along the Central Corridor road route such as Manyani, Singida, Bukombe, Tabora, and Kigoma. Rwanda and Burundi can be accessed through connection with Central Corridor railway line that runs from Dar es Salam through to Kigoma. Products exported through this road link include manufactured items such as processed foods, cosmetics and perfumery, building materials such as cement, paint, iron and steel products, pharmaceuticals and medicines, and paper and paperboard items. Imports comprise agricultural products such as rice and maize, textiles, cotton, construction timber, and unprocessed hides and skins.
78
APPENDIX A3. UNCTAD CODING SYSTEM OF TRADE CONTROL MEASURES
(Code 3000 onwards) The UNCTAD provides a comprehensive organizing principle for the myriad of constraints on trade that may be identified as NTMs (besides tariff and para-tariff measures also listed below). These precisely defined categories and subcategories include six groups of measures in areas of price control, finance, automatic licensing, quality control, monopolistic (practices), and technical (requirements).70 1000 TARIFF MEASURES 1100 STATUTORY CUSTOM DUTIES 1200 MFN DUTIES 1300 GATT CEILING DUTIES 1400 TARIFF QUOTA DUTIES
1410 Low duties 1420 High duties
1500 SEASONAL DUTIES 1510 Low duties 1520 High duties
1600 TEMPORARY REDUCED DUTIES 1700 TEMPORARY INCREASED DUTIES
1710 Retaliatory duties 1720 Urgency and safeguard duties
1900 PREFERENTIAL DUTIES UNDER TRADE AGREEMENTS 1910 Interregional agreements 1920 Regional and subregional agreements 1930 Bilateral agreements
2000 PARA-TARIFF MEASURES 2100 CUSTOMS SURCHARGES 2200 ADDITIONAL TAXES AND CHARGES
2210 Tax on foreign exchange transactions 2220 Stamp tax 2230 Import license fee 2240 Consular invoice fee 2250 Statistical tax 2260 Tax on transport facilities 2270 Taxes and charges for sensitive product categories 2290 Additional charges n.e.s.
2300 INTERNAL TAXES AND CHARGES LEVIED ON IMPORTS 2310 General sales taxes 2320 Excise taxes 2370 Taxes and charges for sensitive product categories 2390 Internal taxes and charges levied on imports n.e.s.
2400 DECREED CUSTOMS VALUATION 2900 PARA-TARIFF MEASURES N.E.S. 3000 PRICE CONTROL MEASURES 3100 ADMINISTRATIVE PRICING
3110 Minimum import prices 3190 Administrative pricing n.e.s.
70 From UNCTAD, “Coding of Trade Control Measures 2003, with Over 100 different NTMs.” UNCTAD, TD/B/COM.1/EM.27/3
79
3200 VOLUNTARY EXPORT PRICE RESTRAINT 3300 VARIABLE CHARGES
3310 Variable levies 3320 Variable components 3330 Compensatory elements 3340 Flexible import fees 3390 Variable charges n.e.s
3400 ANTIDUMPING MEASURES 3410 Antidumping investigations 3420 Antidumping duties 3430 Price undertakings
3500 COUNTERVAILING MEASURES 3510 Countervailing investigations 3520 Countervailing duties 3530 Price undertakings
3900 PRICE CONTROL MEASURES N.E.S. 4000 FINANCE MEASURES 4100 ADVANCE PAYMENT REQUIREMENTS
4110 Advance import deposit 4120 Cash margin requirement 4130 Advance payment of customs duties 4170 Refundable deposits for sensitive product categories 4190 Advance payment requirements n.e.s.
4200 MULTIPLE EXCHANGE RATES 4300 RESTRICTIVE OFFICIAL FOREIGN EXCHANGE ALLOCATION
4310 Prohibition of foreign exchange allocation 4320 Bank authorization 4390 Restrictive official foreign exchange allocation n.e.s
4500 REGULATIONS CONCERNING TERMS OF PAYMENT FOR MPORTS 4600 TRANSFER DELAYS, QUEUING 4900 FINANCE MEASURES N.E.S. 5000 AUTOMATIC LICENSING MEASURES 5100 AUTOMATIC LICENCE 5200 IMPORT MONITORING
5210 Retrospective surveillance 5220 Prior surveillance 5270 Prior surveillance for sensitive product categories
5700 SURRENDER REQUIREMENT 5900 AUTOMATIC LICENSING MEASURES N.E.S. 6000 QUANTITY CONTROL MEASURES 6100 NON-AUTOMATIC LICENSING
6110 License with no specific ex-ante criteria 6120 License for selected purchasers 6130 License for specified use 6131 Linked with export trade 6132 For purposes other than exports 6140 License linked with local production 6141 Purchase of local goods 6142 Local content requirement 6143 Barter or counter trade 6150 License linked with non-official foreign exchange 6151 External foreign exchange 6152 Importers' own foreign exchange 6160 License combined with or replaced by special import authorization
80
6170 Prior authorization for sensitive product categories 6180 License for political reasons 6190 Non-automatic licensing n.e.s.
6200 QUOTAS 6210 Global quotas 6211 Unallocated 6212 Allocated to exporting countries 6220 Bilateral quotas 6230 Seasonal quotas 6240 Quotas linked with export performance 6250 Quotas linked with purchase of local goods 6270 Quotas for sensitive product categories 6280 Quotas for political reasons 6290 Quotas n.e.s.
6300 PROHIBITIONS 6310 Total prohibition 6320 Suspension of issuance of licenses 6330 Seasonal prohibition 6340 Temporary prohibition 6350 Import diversification 6370 Prohibition for sensitive product categories 6380 Prohibition for political reasons (embargo) 6390 Prohibitions n.e.s.
6600 EXPORT RESTRAINT ARRANGEMENTS 6610 Voluntary export restraint arrangements 6620 Orderly marketing arrangements 6630 Multifibre arrangement (MFA) 6631 Quota agreement 6632 Consultation agreement 6633 Administrative co-operation agreement 6640 Export restraint arrangements on textiles outside MFA 6641 Quota agreement 6642 Consultation agreement 6643 Administrative co-operation agreement 6690 Export restraint arrangements n.e.s.
6700 ENTERPRISE-SPECIFIC RESTRICTIONS 6710 Selective approval of importers 6720 Enterprise-specific quota 6790 Enterprise-specific restrictions n.e.s.
6900 Quantity Control Measures n.e.s. 7000 MONOPOLISTIC MEASURES 7100 SINGLE CHANNEL FOR IMPORTS
7110 State trading administration 7120 Sole importing agency 7170 Single channel for sensitive product categories
7200 COMPULSORY NATIONAL SERVICES 7210 Compulsory national insurance 7220 Compulsory national transport
7900 MONOPOLISTIC MEASURES N.E.S. 8000 TECHNICAL MEASURES 8100 TECHNICAL REGULATIONS
8110 Product characteristics requirements 8120 Marking requirements 8130 Labeling requirements 8140 Packaging requirements
81
8150 Testing, inspection and quarantine requirements 8160 Information requirements 8170 Requirement relative to transit 8180 Requirement to pass through specified customs 8190 Technical regulations n.e.s.
8200 PRE-SHIPMENT INSPECTION 8300 SPECIAL CUSTOMS FORMALITIES 8400 RETURN OBLIGATION 8900 TECHNICAL MEASURES N.E.S.
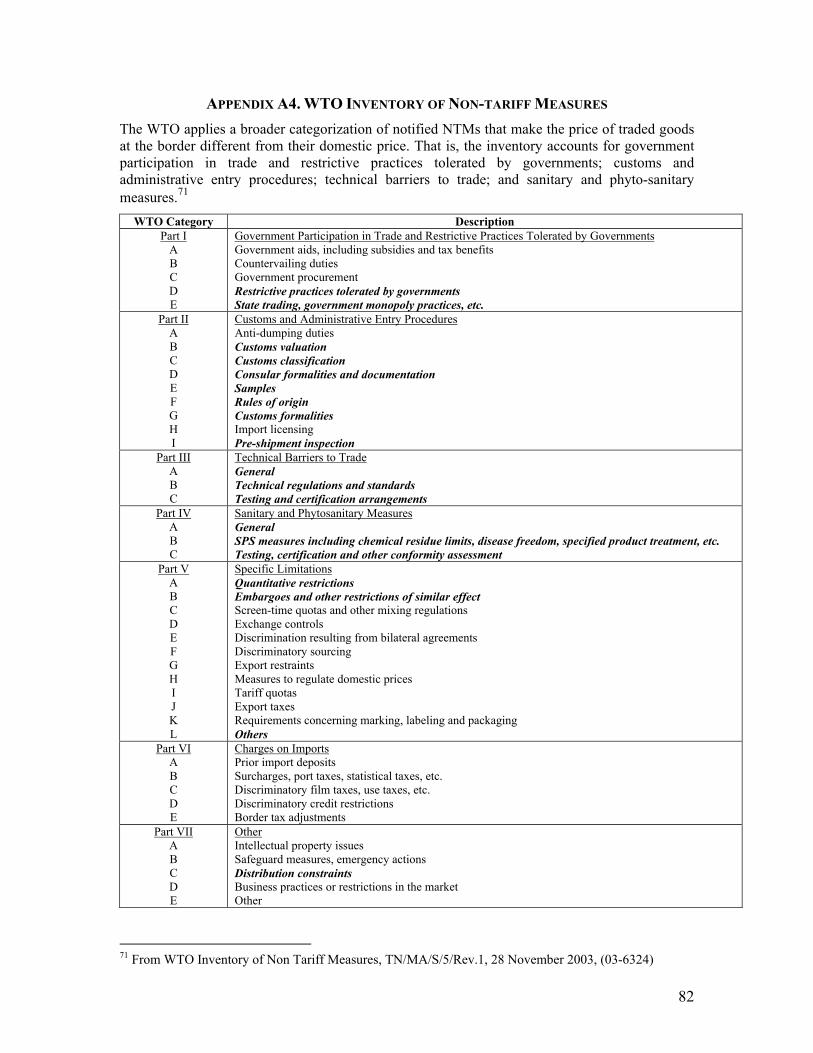
82
APPENDIX A4. WTO INVENTORY OF NON-TARIFF MEASURES The WTO applies a broader categorization of notified NTMs that make the price of traded goods at the border different from their domestic price. That is, the inventory accounts for government participation in trade and restrictive practices tolerated by governments; customs and administrative entry procedures; technical barriers to trade; and sanitary and phyto-sanitary measures.71
WTO Category Description Part I
A B C D E
Government Participation in Trade and Restrictive Practices Tolerated by Governments Government aids, including subsidies and tax benefits Countervailing duties Government procurement Restrictive practices tolerated by governments State trading, government monopoly practices, etc.
Part II A B C D E F G H I
Customs and Administrative Entry Procedures Anti-dumping duties Customs valuation Customs classification Consular formalities and documentation Samples Rules of origin Customs formalities Import licensing Pre-shipment inspection
Part III A B C
Technical Barriers to Trade General Technical regulations and standards Testing and certification arrangements
Part IV A B C
Sanitary and Phytosanitary Measures General SPS measures including chemical residue limits, disease freedom, specified product treatment, etc. Testing, certification and other conformity assessment
Part V A B C D E F G H I J K L
Specific Limitations Quantitative restrictions Embargoes and other restrictions of similar effect Screen-time quotas and other mixing regulations Exchange controls Discrimination resulting from bilateral agreements Discriminatory sourcing Export restraints Measures to regulate domestic prices Tariff quotas Export taxes Requirements concerning marking, labeling and packaging Others
Part VI A B C D E
Charges on Imports Prior import deposits Surcharges, port taxes, statistical taxes, etc. Discriminatory film taxes, use taxes, etc. Discriminatory credit restrictions Border tax adjustments
Part VII A B C D E
Other Intellectual property issues Safeguard measures, emergency actions Distribution constraints Business practices or restrictions in the market Other
71 From WTO Inventory of Non Tariff Measures, TN/MA/S/5/Rev.1, 28 November 2003, (03-6324)
83
APPENDIX A5. TRANSPORT COSTS AND PRICES IN EAST AFRICA
From: World Bank flagship study: Africa’s Transport Price/Cost, 2008 (S. Teravaninthorn, AFTTR). High transport prices/costs are a major obstacle to increased trade and economic growth of the East Africa region. Amjadi and Yeats (1995) concluded that, in Africa, the effect of high transport costs are a higher trade barrier than import tariffs and trade restrictions. World Bank (2007) demonstrates that transport prices are high compared to values of goods traded and that transport predictability and reliability are low by international standards.72 Rizet and Hine (1993) estimated that prices of road transport in three francophone African countries (Cameroon, Côte d'Ivoire and Mali) were up to six times higher than in Pakistan, and about 40 percent higher than in France where labor rates are much higher. Rizet and Gwet (1998) comparing seven countries in three continents - Africa (Ghana, Cameroon, Burkina, Côte d’Ivoire), South-East Asia (Indonesia, Vietnam) and Latin America (Costa Rica) - demonstrated that for distances up to 300 kilometers, the unit costs of road transport were 40-100 percent higher in Africa than in South-East Asia. MacKellar et al. (2002) found that transport prices for most African landlocked countries range from 15-20 percent of imports costs, which is three to four times higher than in most developed countries. It has been observed that trade is highly sensitive to transport prices and costs – a 10 percent drop in transport costs increases trade by about 25 percent and that transport costs are sensitive to the quality of infrastructure, as measured by such variables as the density of the road and rail network. The principal causes of low productivity of the trucking industry and high transportation costs East Africa are the infrastructure constraints (Pedersen, 2001; Limao and Venables, 2001) and low levels of competition between service providers (Rizet and Hine, 1993). Poor condition of infrastructure characterized by inadequate quantity and substandard quality of transport network, long distance from the ports and multiple roadblocks increases transportation costs. A framework for Transport Costs and Prices A distinction has to be made between transport prices (or tariffs), transport costs, and vehicle operating costs. This distinction is useful both since the prices may/may not reflect transport costs, and the vehicle operating costs provide a good reflection on the quality of road infrastructure and the type of vehicles. A brief description of transport costs and prices are given below:
(i) Vehicle operating costs (VOC) include the various direct costs the transport provider must pay to operate a given vehicle, notably labor, capital, fuel, tires, maintenance and depreciation cost of a vehicle.
(ii) Transport costs (TC) are the costs the transport operator incurs when transporting a cargo. It covers VOC and other indirect costs, such as license fee, road block payments, etc.
(iii) Transport prices/tariffs (TP) are the rates charged by a transport company or a freight forwarder to the shipper or importer. Transport prices usually are the result of negotiated rates between the shipper and the transport service provider. Transport price normally covers TC and the operator’s overheads and profit margin.
72 World Bank (2007d), Agriculture in Sub-Saharan Africa.
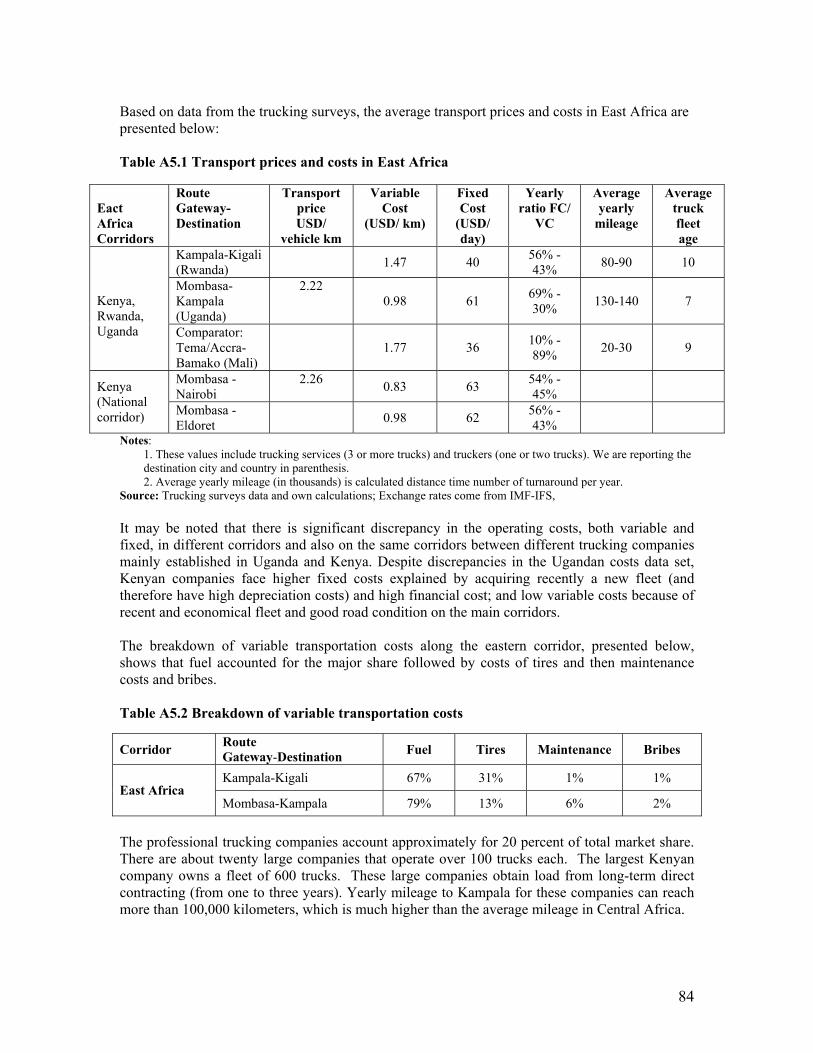
84
Based on data from the trucking surveys, the average transport prices and costs in East Africa are presented below: Table A5.1 Transport prices and costs in East Africa
Notes: 1. These values include trucking services (3 or more trucks) and truckers (one or two trucks). We are reporting the destination city and country in parenthesis. 2. Average yearly mileage (in thousands) is calculated distance time number of turnaround per year.
Source: Trucking surveys data and own calculations; Exchange rates come from IMF-IFS, It may be noted that there is significant discrepancy in the operating costs, both variable and fixed, in different corridors and also on the same corridors between different trucking companies mainly established in Uganda and Kenya. Despite discrepancies in the Ugandan costs data set, Kenyan companies face higher fixed costs explained by acquiring recently a new fleet (and therefore have high depreciation costs) and high financial cost; and low variable costs because of recent and economical fleet and good road condition on the main corridors. The breakdown of variable transportation costs along the eastern corridor, presented below, shows that fuel accounted for the major share followed by costs of tires and then maintenance costs and bribes. Table A5.2 Breakdown of variable transportation costs
The professional trucking companies account approximately for 20 percent of total market share. There are about twenty large companies that operate over 100 trucks each. The largest Kenyan company owns a fleet of 600 trucks. These large companies obtain load from long-term direct contracting (from one to three years). Yearly mileage to Kampala for these companies can reach more than 100,000 kilometers, which is much higher than the average mileage in Central Africa.
Eact Africa Corridors
Route Gateway-Destination
Transport price USD/
vehicle km
Variable Cost
(USD/ km)
Fixed Cost
(USD/ day)
Yearly ratio FC/
VC
Average yearly
mileage
Average truck fleet age
Kampala-Kigali (Rwanda)
1.47 40 56% - 43% 80-90 10
Mombasa-Kampala (Uganda)
2.22 0.98 61 69% -
30% 130-140 7 Kenya, Rwanda, Uganda Comparator:
Tema/Accra-Bamako (Mali)
1.77 36 10% -
89% 20-30 9
Mombasa - Nairobi
2.26 0.83 63 54% - 45% Kenya
(National corridor) Mombasa -
Eldoret 0.98 62 56% -
43%
Corridor Route Gateway-Destination Fuel Tires Maintenance Bribes
Kampala-Kigali 67% 31% 1% 1% East Africa
Mombasa-Kampala 79% 13% 6% 2%
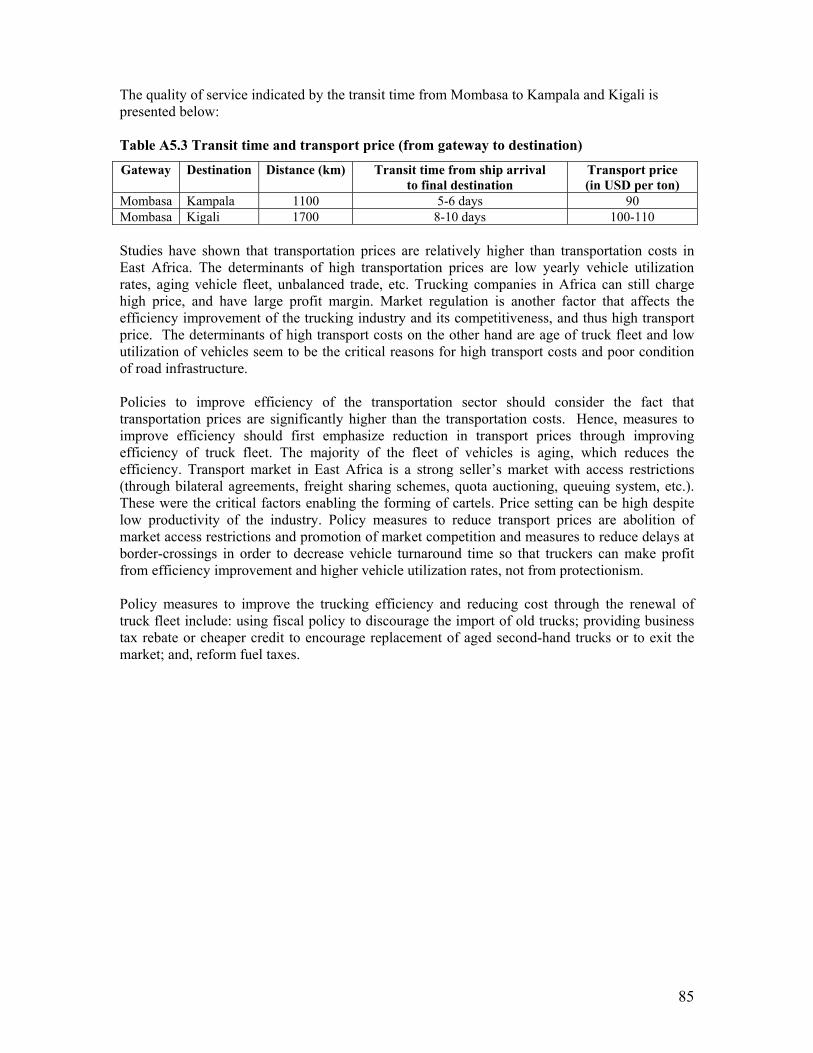
85
The quality of service indicated by the transit time from Mombasa to Kampala and Kigali is presented below: Table A5.3 Transit time and transport price (from gateway to destination)
Gateway Destination Distance (km) Transit time from ship arrival to final destination
Transport price (in USD per ton)
Mombasa Kampala 1100 5-6 days 90 Mombasa Kigali 1700 8-10 days 100-110 Studies have shown that transportation prices are relatively higher than transportation costs in East Africa. The determinants of high transportation prices are low yearly vehicle utilization rates, aging vehicle fleet, unbalanced trade, etc. Trucking companies in Africa can still charge high price, and have large profit margin. Market regulation is another factor that affects the efficiency improvement of the trucking industry and its competitiveness, and thus high transport price. The determinants of high transport costs on the other hand are age of truck fleet and low utilization of vehicles seem to be the critical reasons for high transport costs and poor condition of road infrastructure. Policies to improve efficiency of the transportation sector should consider the fact that transportation prices are significantly higher than the transportation costs. Hence, measures to improve efficiency should first emphasize reduction in transport prices through improving efficiency of truck fleet. The majority of the fleet of vehicles is aging, which reduces the efficiency. Transport market in East Africa is a strong seller’s market with access restrictions (through bilateral agreements, freight sharing schemes, quota auctioning, queuing system, etc.). These were the critical factors enabling the forming of cartels. Price setting can be high despite low productivity of the industry. Policy measures to reduce transport prices are abolition of market access restrictions and promotion of market competition and measures to reduce delays at border-crossings in order to decrease vehicle turnaround time so that truckers can make profit from efficiency improvement and higher vehicle utilization rates, not from protectionism. Policy measures to improve the trucking efficiency and reducing cost through the renewal of truck fleet include: using fiscal policy to discourage the import of old trucks; providing business tax rebate or cheaper credit to encourage replacement of aged second-hand trucks or to exit the market; and, reform fuel taxes.
86
APPENDIX A6.1 RANGE OF CONSTRAINING INFRASTRUCTURE IN EAC
Some examples of widespread problems are listed below.
• Poor roads and bridges. In East Africa, the main regional corridors and core road network are mostly paved. Acute problems arise due to the variable condition of parts of the core/regional road network, and the fact that roads around/through major urban agglomerations and for access to the ports are increasingly congested. The cost of road services is 38–56 percent above the rail rates (World Bank 2006). Goods transported between Mombasa–Kampala cost about US$3,000 per container. The bridge at Rusomo between Rwanda and Tanzania (50 meters long and 6 meters wide) allows only one truck to pass at a time.
• Dilapidated railways.73 Disrepair of railroad infrastructure and equipment is characterized by the aging track, shortage of cars, and inadequate locomotives. The railway network has virtually collapsed along the Central Corridor, and is not much better in the Northern Corridor. In Uganda, only two lines are functional: Kampala–Malaba and Tororo–Soroti, commissioned in July 2004. Along the Dar es Salam–Kigoma railway, the Isaka–Gitega–Musongati connection is yet to be constructed. Most of the railway system in Kenya, Uganda and Tanzania has now been concessioned out. This is expected to eventually lead to improved operational and financial performance of the railway transport. The viability of constructing new railway lines in the EAC needs to be scrutinized carefully due to very high cost and potentially relatively low levels of traffic.
• Inadequate ports and inland container freight stations. Problems include inadequate storage and handling capacity; the poor condition of handling equipment, such as cranes; and lack of adequate rolling stock at Kigoma, Bujumbura, and Dar es Salam. Burundi and Rwanda have yet to reach agreements with Ethiopia and Kenya on land allocation earmarked for the development of a CFS to handle their cargo and maintenance at Dar es Salam and Mombasa, respectively. Just as an illustration, the port of Dar es Salam, with built capacity is 250,000 TEU is operating at 350,000 TEU in 2007. Even then, at any given moment, there are about 10 cargo ships waiting to be offloaded. About 700 containers are offloaded per day, but maximum capacity of Tanzania International Container Terminal Services (TICTS) to deliver containers out of the port is only 300. Inland CFS, such as at Isaka, Tanzania have similar problems or are not fully functional.
• Insufficient cargo vessel capacity at the Great Lakes. Age and disrepair of the merchant fleet on Lake Tanganyika and Lake Victoria is grave. There is no shipyard on Lake Tanganyika that could maintain/renovate the existing fleet. Considering the current low levels of traffic, a shipbuilding yard may not be viable at present.
• Inadequate facilities at the border posts. Problems include: understaffing of border posts in relation to the volume of activities and cargo handled, such as at Malaba, Uganda; limited parking space for cargo trucks at most posts, such as at Katuna, Uganda; no parking yard at Rusomo, Rwanda; lack of truck scales at Kayanza and Gitega, Burundi so customs agents estimate the actual figures; dilapidated, small offices; scarce computer equipment; accommodation and public amenities located about 50–100 km from the border; inadequate bonded warehouses. For example, Rusomo, Rwanda has only one customs bonded warehouse and Tanzania has none.
• Poor power supply. Power supply may be infrequent at the remote, key border posts, such as in Uganda. At posts like Rusumo on the border of Tanzania and Rwanda, there is no electricity
73 All over the world, including in the EAC, railways remains the cheapest means for transporting heavy, large volume goods over land.
87
and the post is dependant on unreliable small generators that often run out of fuel. This forces manual book-keeping at the very least.
• Expensive cross-border communication. Counterpart revenue authorities located just across a border communicate on land phones charging international rates. Private telecommunication companies—such as Zion, MTN, and Safaricom—are developing special arrangements for cross-border phone calls at local rates, but these do not cover Burundi.
88
APPENDIX A6.2 INFRASTRUCTURE IMPROVEMENTS THAT WOULD MAKE A DIFFERENCE
Stakeholders provided the following feedback:
• Convert the Northern Corridor into a dual carriageway. The cost of this for the whole Northern Corridor is extremely high and may not be justifiable from the current economic point of view. What is required is a staged approach where within the next five years the stretches going through major urban agglomerations are converted to four lanes. Progressively, depending on traffic growth, other stretches can be converted, with the whole process taking 10-15 years.
• Upgrade:
- Stretches of the Northern Corridor in Uganda to Rwanda, with the DRC link from Kyanika near the Rwanda border, as well as the Mbarara-Katuna main link
– Manyoni–Singiola segment of the Dar es Salam–Kobero road
– Eldoret–Nairobi in Kenya
– Ntungamo–Lyantonde in Uganda
–Kampala– Busia/Malaba.
• Make adequate government investment on the rail lines along both corridors. The private management agencies should invest in more wagons and improve operation. The model that has been adopted is concessioning out of all aspects of operating the railway systems in Kenya, Uganda and Tanzania. Thus, at this point, there is no plan for governments to invest in railway infrastructure on the two corridors.
• Develop the Tanga–Moshi–Arusha–Shinyanga rail link to operationalize alternatives for access to the sea via the port of Dar es Salam. Here comparing the large investment costs vis-avis the current traffic levels is critical
• Rehabilitate wagon ferries on Lake Victoria and Lake Tanganyika. Purchase a new ferry wagon to replace the MV Kabalega, which sank in 2004, as being done with supportfrom the EATTFP
• Expand storage areas and acquire new handling equipment for ports, especially Dar es Salam, Bujumbura, and Kigoma.
• Implement the port authority’s plans to operate the Dar es Salam port on a 24 hour/7 day basis.
• Replace dilapidated weighbridges and have multiple weighbridges at each checkpoint to minimize congestion. Parts of this are already being undertaken with from the EATTFP.
• Upgrade and furnish border posts and customs clearance offices, together with computerization. At juxtaposed border posts, ensure adequate parking/waiting areas and public amenities. Parts of this are already being undertaken with from the EATTFP.
• Fast track construction of the southern/eastern bypasses of Nairobi
• Upgrade access/link rods to the port of Mombasa
• Complete bypass of Kampala and Kigali
• Assess medium term requirements to construct bypasses around major urban agglomerations on the Central and Northern Corridors
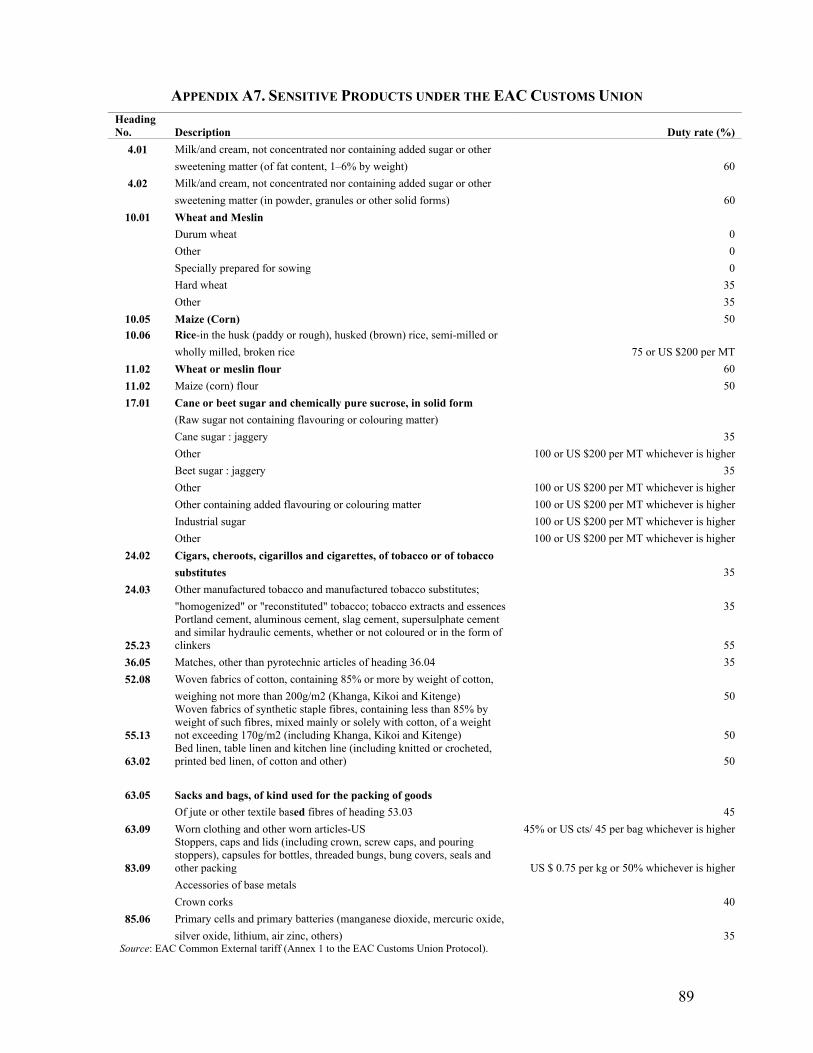
89
APPENDIX A7. SENSITIVE PRODUCTS UNDER THE EAC CUSTOMS UNION Heading No. Description Duty rate (%)
4.01 Milk/and cream, not concentrated nor containing added sugar or other sweetening matter (of fat content, 1–6% by weight) 60
4.02 Milk/and cream, not concentrated nor containing added sugar or other sweetening matter (in powder, granules or other solid forms) 60
10.01 Wheat and Meslin Durum wheat 0 Other 0 Specially prepared for sowing 0 Hard wheat 35 Other 35
10.05 Maize (Corn) 50 10.06 Rice-in the husk (paddy or rough), husked (brown) rice, semi-milled or
wholly milled, broken rice 75 or US $200 per MT 11.02 Wheat or meslin flour 60 11.02 Maize (corn) flour 50 17.01 Cane or beet sugar and chemically pure sucrose, in solid form
(Raw sugar not containing flavouring or colouring matter) Cane sugar : jaggery 35 Other 100 or US $200 per MT whichever is higher Beet sugar : jaggery 35 Other 100 or US $200 per MT whichever is higher
Other containing added flavouring or colouring matter 100 or US $200 per MT whichever is higher Industrial sugar 100 or US $200 per MT whichever is higher Other 100 or US $200 per MT whichever is higher
24.02 Cigars, cheroots, cigarillos and cigarettes, of tobacco or of tobacco substitutes 35
24.03 Other manufactured tobacco and manufactured tobacco substitutes; "homogenized" or "reconstituted" tobacco; tobacco extracts and essences 35
25.23
Portland cement, aluminous cement, slag cement, supersulphate cement and similar hydraulic cements, whether or not coloured or in the form of clinkers 55
36.05 Matches, other than pyrotechnic articles of heading 36.04 35 52.08 Woven fabrics of cotton, containing 85% or more by weight of cotton,
weighing not more than 200g/m2 (Khanga, Kikoi and Kitenge) 50
55.13
Woven fabrics of synthetic staple fibres, containing less than 85% by weight of such fibres, mixed mainly or solely with cotton, of a weight not exceeding 170g/m2 (including Khanga, Kikoi and Kitenge) 50
63.02 Bed linen, table linen and kitchen line (including knitted or crocheted, printed bed linen, of cotton and other) 50
63.05 Sacks and bags, of kind used for the packing of goods
Of jute or other textile based fibres of heading 53.03 45 63.09 Worn clothing and other worn articles-US 45% or US cts/ 45 per bag whichever is higher
83.09
Stoppers, caps and lids (including crown, screw caps, and pouring stoppers), capsules for bottles, threaded bungs, bung covers, seals and other packing US $ 0.75 per kg or 50% whichever is higher
Accessories of base metals Crown corks 40
85.06 Primary cells and primary batteries (manganese dioxide, mercuric oxide, silver oxide, lithium, air zinc, others) 35 Source: EAC Common External tariff (Annex 1 to the EAC Customs Union Protocol).
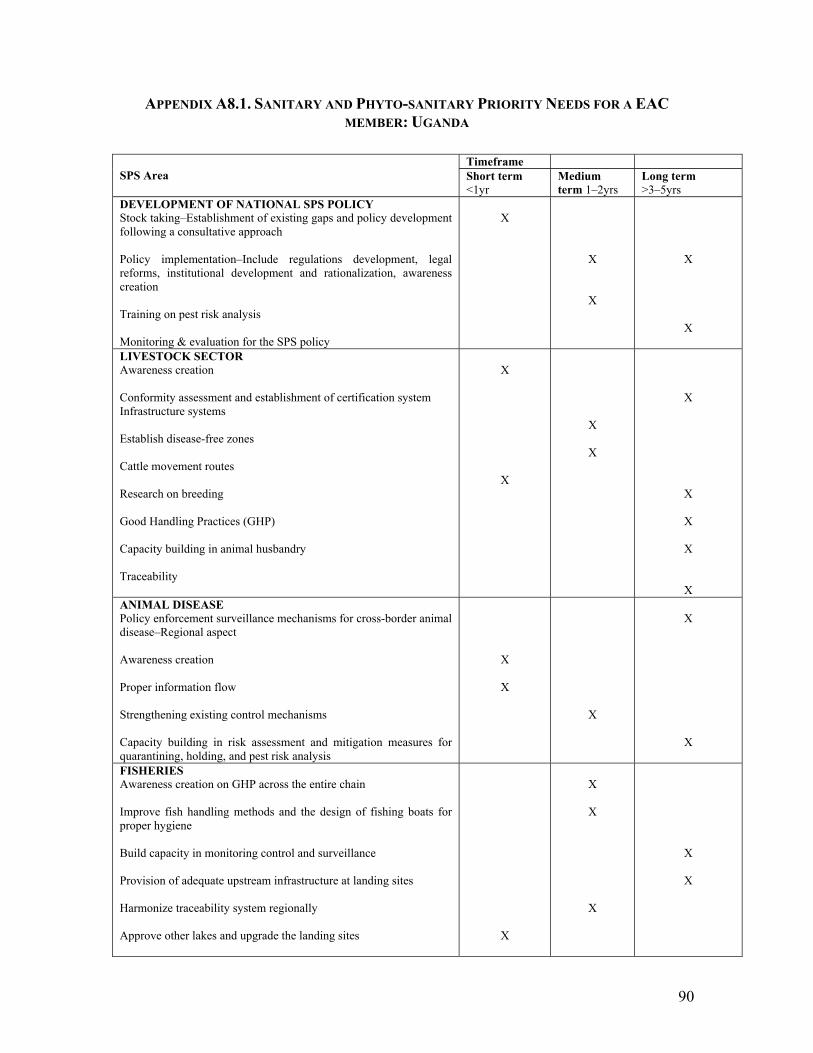
90
APPENDIX A8.1. SANITARY AND PHYTO-SANITARY PRIORITY NEEDS FOR A EAC MEMBER: UGANDA
Timeframe
SPS Area Short term <1yr
Medium term 1–2yrs
Long term >3–5yrs
DEVELOPMENT OF NATIONAL SPS POLICY Stock taking–Establishment of existing gaps and policy development following a consultative approach Policy implementation–Include regulations development, legal reforms, institutional development and rationalization, awareness creation Training on pest risk analysis Monitoring & evaluation for the SPS policy
X
X
X
X
X
LIVESTOCK SECTOR Awareness creation Conformity assessment and establishment of certification system Infrastructure systems Establish disease-free zones Cattle movement routes Research on breeding Good Handling Practices (GHP) Capacity building in animal husbandry Traceability
X
X
X
X
X
X
X
X
X ANIMAL DISEASE Policy enforcement surveillance mechanisms for cross-border animal disease–Regional aspect Awareness creation Proper information flow Strengthening existing control mechanisms Capacity building in risk assessment and mitigation measures for quarantining, holding, and pest risk analysis
X
X
X
X
X
FISHERIES Awareness creation on GHP across the entire chain Improve fish handling methods and the design of fishing boats for proper hygiene Build capacity in monitoring control and surveillance Provision of adequate upstream infrastructure at landing sites Harmonize traceability system regionally Approve other lakes and upgrade the landing sites
X
X
X
X
X
X
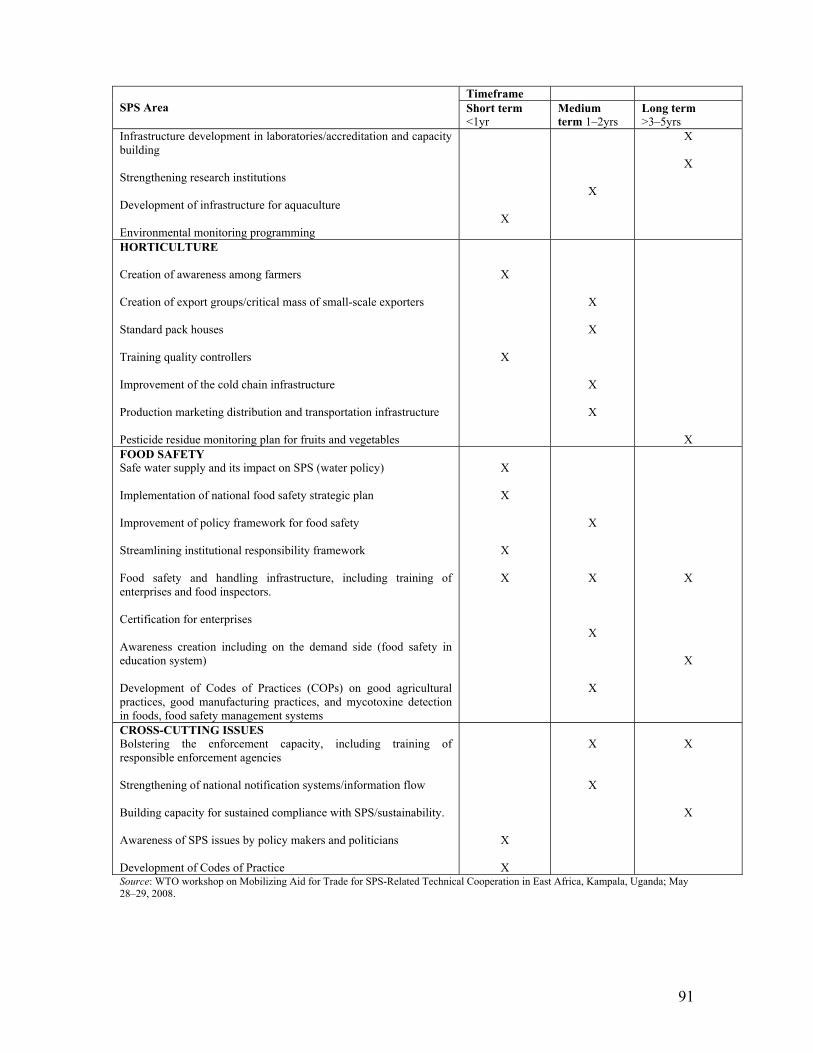
91
Timeframe SPS Area Short term
<1yr Medium term 1–2yrs
Long term >3–5yrs
Infrastructure development in laboratories/accreditation and capacity building Strengthening research institutions Development of infrastructure for aquaculture Environmental monitoring programming
X
X
X
X
HORTICULTURE Creation of awareness among farmers Creation of export groups/critical mass of small-scale exporters Standard pack houses Training quality controllers Improvement of the cold chain infrastructure Production marketing distribution and transportation infrastructure Pesticide residue monitoring plan for fruits and vegetables
X
X
X
X
X
X
X FOOD SAFETY Safe water supply and its impact on SPS (water policy) Implementation of national food safety strategic plan Improvement of policy framework for food safety Streamlining institutional responsibility framework Food safety and handling infrastructure, including training of enterprises and food inspectors. Certification for enterprises Awareness creation including on the demand side (food safety in education system) Development of Codes of Practices (COPs) on good agricultural practices, good manufacturing practices, and mycotoxine detection in foods, food safety management systems
X
X
X
X
X
X
X
X
X
X
CROSS-CUTTING ISSUES Bolstering the enforcement capacity, including training of responsible enforcement agencies Strengthening of national notification systems/information flow Building capacity for sustained compliance with SPS/sustainability. Awareness of SPS issues by policy makers and politicians Development of Codes of Practice
X
X
X
X
X
X
Source: WTO workshop on Mobilizing Aid for Trade for SPS-Related Technical Cooperation in East Africa, Kampala, Uganda; May 28–29, 2008.
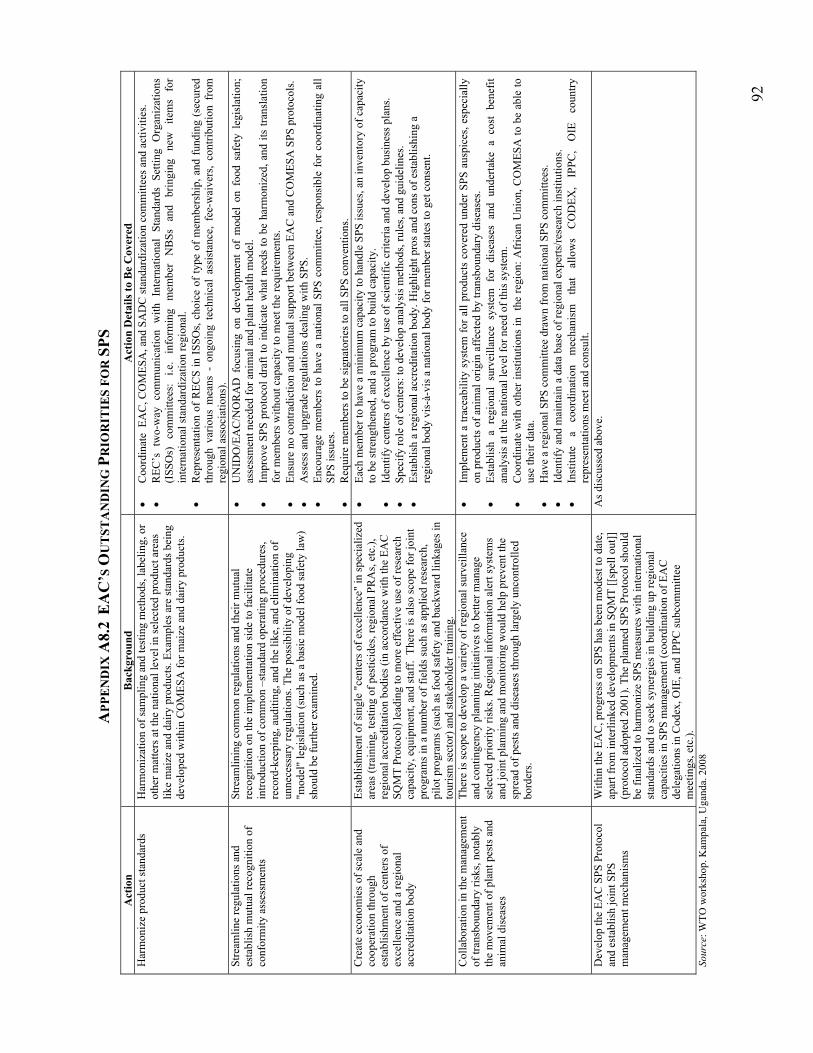
92
APP
EN
DIX
A8.
2 E
AC
’S O
UT
STA
ND
ING
PR
IOR
ITIE
S FO
R S
PS
Act
ion
Bac
kgro
und
Act
ion
Det
ails
to B
e C
over
ed
Har
mon
ize
prod
uct s
tand
ards
Har
mon
izat
ion
of sa
mpl
ing
and
test
ing
met
hods
, lab
elin
g, o
r ot
her m
atte
rs a
t the
nat
iona
l lev
el in
sele
cted
pro
duct
are
as
like
mai
ze a
nd d
airy
pro
duct
s. Ex
ampl
es a
re st
anda
rds b
eing
de
velo
ped
with
in C
OM
ESA
for m
aize
and
dai
ry p
rodu
cts.
• C
oord
inat
e E
AC
, CO
MES
A, a
nd S
AD
C st
anda
rdiz
atio
n co
mm
ittee
s and
act
iviti
es.
• R
EC’s
tw
o-w
ay c
omm
unic
atio
n w
ith I
nter
natio
nal
Stan
dard
s Se
tting
Org
aniz
atio
ns
(ISS
Os)
co
mm
ittee
s:
i.e.
info
rmin
g m
embe
r N
BSs
an
d br
ingi
ng
new
ite
ms
for
inte
rnat
iona
l sta
ndar
diza
tion
regi
onal
. •
Rep
rese
ntat
ion
of R
ECS
in IS
SOs,
choi
ce o
f typ
e of
mem
bers
hip,
and
fund
ing
(sec
ured
th
roug
h va
rious
mea
ns -
ong
oing
tec
hnic
al a
ssis
tanc
e, f
ee-w
aive
rs,
cont
ribut
ion
from
re
gion
al a
ssoc
iatio
ns).
Stre
amlin
e re
gula
tions
and
es
tabl
ish
mut
ual r
ecog
nitio
n of
co
nfor
mity
ass
essm
ents
Stre
amlin
ing
com
mon
regu
latio
ns a
nd th
eir m
utua
l re
cogn
ition
on
the
impl
emen
tatio
n si
de to
faci
litat
e in
trodu
ctio
n of
com
mon
–st
anda
rd o
pera
ting
proc
edur
es,
reco
rd-k
eepi
ng, a
uditi
ng, a
nd th
e lik
e, a
nd e
limin
atio
n of
un
nece
ssar
y re
gula
tions
. The
pos
sibili
ty o
f dev
elop
ing
"mod
el"
legi
slat
ion
(suc
h as
a b
asic
mod
el fo
od sa
fety
law
) sh
ould
be
furth
er e
xam
ined
.
• U
NID
O/E
AC
/NO
RA
D f
ocus
ing
on d
evel
opm
ent
of m
odel
on
food
saf
ety
legi
slat
ion;
as
sess
men
t nee
ded
for a
nim
al a
nd p
lant
hea
lth m
odel
. •
Impr
ove
SPS
prot
ocol
dra
ft to
indi
cate
wha
t nee
ds to
be
harm
oniz
ed, a
nd it
s tra
nsla
tion
for m
embe
rs w
ithou
t cap
acity
to m
eet t
he re
quire
men
ts.
• En
sure
no
cont
radi
ctio
n an
d m
utua
l sup
port
betw
een
EAC
and
CO
MES
A S
PS p
roto
cols
. •
Ass
ess a
nd u
pgra
de re
gula
tions
dea
ling
with
SPS
. •
Enco
urag
e m
embe
rs to
hav
e a
natio
nal S
PS c
omm
ittee
, res
pons
ible
for
coor
dina
ting
all
SPS
issu
es.
• R
equi
re m
embe
rs to
be
sign
ator
ies t
o al
l SPS
con
vent
ions
. C
reat
e ec
onom
ies o
f sca
le a
nd
coop
erat
ion
thro
ugh
esta
blis
hmen
t of c
ente
rs o
f ex
celle
nce
and
a re
gion
al
accr
edita
tion
body
Esta
blis
hmen
t of s
ingl
e "c
ente
rs o
f exc
elle
nce"
in sp
ecia
lized
ar
eas (
train
ing,
test
ing
of p
estic
ides
, reg
iona
l PR
As,
etc.
), re
gion
al a
ccre
dita
tion
bodi
es (i
n ac
cord
ance
with
the
EAC
SQ
MT
Prot
ocol
) lea
ding
to m
ore
effe
ctiv
e us
e of
rese
arch
ca
paci
ty, e
quip
men
t, an
d st
aff.
The
re is
als
o sc
ope
for j
oint
pr
ogra
ms i
n a
num
ber o
f fie
lds s
uch
as a
pplie
d re
sear
ch,
pilo
t pro
gram
s (su
ch a
s foo
d sa
fety
and
bac
kwar
d lin
kage
s in
tour
ism
sect
or) a
nd st
akeh
olde
r tra
inin
g.
• Ea
ch m
embe
r to
have
a m
inim
um c
apac
ity to
han
dle
SPS
issu
es, a
n in
vent
ory
of c
apac
ity
to b
e st
reng
then
ed, a
nd a
pro
gram
to b
uild
cap
acity
. •
Iden
tify
cent
ers o
f exc
elle
nce
by u
se o
f sci
entif
ic c
riter
ia a
nd d
evel
op b
usin
ess p
lans
. •
Spec
ify ro
le o
f cen
ters
: to
deve
lop
anal
ysis
met
hods
, rul
es, a
nd g
uide
lines
. •
Esta
blis
h a
regi
onal
acc
redi
tatio
n bo
dy. H
ighl
ight
pro
s and
con
s of e
stab
lishi
ng a
re
gion
al b
ody
vis-
à-vi
s a n
atio
nal b
ody
for m
embe
r sta
tes t
o ge
t con
sent
.
Col
labo
ratio
n in
the
man
agem
ent
of tr
ansb
ound
ary
risks
, not
ably
th
e m
ovem
ent o
f pla
nt p
ests
and
an
imal
dis
ease
s
Ther
e is
scop
e to
dev
elop
a v
arie
ty o
f reg
iona
l sur
veill
ance
an
d co
ntin
genc
y pl
anni
ng in
itiat
ives
to b
ette
r man
age
sele
cted
prio
rity
risks
. Reg
iona
l inf
orm
atio
n al
ert s
yste
ms
and
join
t pla
nnin
g an
d m
onito
ring
wou
ld h
elp
prev
ent t
he
spre
ad o
f pes
ts a
nd d
isea
ses t
hrou
gh la
rgel
y un
cont
rolle
d bo
rder
s.
• Im
plem
ent a
trac
eabi
lity
syst
em fo
r all
prod
ucts
cov
ered
und
er S
PS a
uspi
ces,
espe
cial
ly
on p
rodu
cts o
f ani
mal
orig
in a
ffec
ted
by tr
ansb
ound
ary
dise
ases
. •
Esta
blis
h a
regi
onal
sur
veill
ance
sys
tem
for
dis
ease
s an
d un
derta
ke a
cos
t be
nefit
an
alys
is a
t the
nat
iona
l lev
el fo
r nee
d of
this
syst
em.
• C
oord
inat
e w
ith o
ther
inst
itutio
ns in
the
regi
on: A
fric
an U
nion
, CO
MES
A to
be
able
to
use
thei
r dat
a.
• H
ave
a re
gion
al S
PS c
omm
ittee
dra
wn
from
nat
iona
l SPS
com
mitt
ees.
•
Iden
tify
and
mai
ntai
n a
data
bas
e of
regi
onal
exp
erts
/rese
arch
inst
itutio
ns.
• In
stitu
te
a co
ordi
natio
n m
echa
nism
th
at
allo
ws
CO
DEX
, IP
PC,
OIE
co
untry
re
pres
enta
tions
mee
t and
con
sult.
D
evel
op th
e EA
C S
PS P
roto
col
and
esta
blis
h jo
int S
PS
man
agem
ent m
echa
nism
s
With
in th
e EA
C, p
rogr
ess o
n SP
S ha
s bee
n m
odes
t to
date
, ap
art f
rom
inte
rlink
ed d
evel
opm
ents
in S
QM
T [[
spel
l out
]] (p
roto
col a
dopt
ed 2
001)
. The
pla
nned
SPS
Pro
toco
l sho
uld
be fi
naliz
ed to
har
mon
ize
SPS
mea
sure
s with
inte
rnat
iona
l st
anda
rds a
nd to
seek
syne
rgie
s in
build
ing
up re
gion
al
capa
citie
s in
SPS
man
agem
ent (
coor
dina
tion
of E
AC
de
lega
tions
in C
odex
, OIE
, and
IPPC
subc
omm
ittee
m
eetin
gs, e
tc.).
As d
iscu
ssed
abo
ve.
Sour
ce: W
TO w
orks
hop.
Kam
pala
, Uga
nda.
200
8
93
BIBLIOGRAPHY
Abegaz, M. 2008. “Mobilizing Aid for Trade for SPS-related Technical Cooperation in East Africa: SPS
Balance Sheet for Uganda.” Unpublished report presented at WTO, World Bank, FAO, WHO workshop on mobilizing aid for trade, Kampala, May 28–29.
Amjadi A., and Yeats A. J. (1995), “Have Transport Costs Contributed to the Relative Decline of Sub-
Saharan African Exports”, World Bank Policy Research Working Paper 1559. Anderson, James and Peter J. Neary. 2003. “The Mercantilist Index of Trade Policy.” International
Economic Review 44 (2): 627–49. Ayoki, M. 2007. “Strengthening South-South Cooperation Amongst East African Community Member
States.” Report prepared for United Nations Development Programme. Bank of the Republic of Burundi. Various years. Rapports Annuels, 2000–6. Bujumbura, Burundi: Bank
of the Republic of Burundi. Brenton, P., and M. Vancauteren. 2000. “Technical Barriers to Trade in the European Union: Importance
for Accession Countries.” Center for European Policy Studies Working Document No. 144, Brussels. http://www.ceps.be
CEMAC (Commission de la Communaute Economique). 2002. “Vers l’Union douanière en Afrique
Centrale.» Bangui, Central African Republic. http://www.cemac.cf/ Dufly, Cl., J. Puons, and M. Steenlandt. 2002. Vers L’ Union Douaniere en Afrique Centrale, November.
Communauté Economique et Monétaire de. Bangui, Central African Republic. http://www.cemac.net
EABC (East Africa Business Council). 2007. “East African Community 2006/2007 Business Climate
Index Survey.” Arusha, Tanzania. EAC (East African Community). 1999. Protocol on the Establishment of the East African Community
Customs Union. East African Community Secretariat, Arusha, Tanzania. ---------. 2000. Freeing Cross-border Trade in Agricultural Products, by Chris Ackello-Ogutu. East
African Community Secretariat, Arusha, Tanzania ---------. 2004. Protocol on the Establishment of East African Community Customs Union, March 2, 2004,
East African Community Secretariat, Arusha, Tanzania. ---------. 2007. “NTB Elimination Plans for Kenya, Tanzania and Uganda.” Arusha, Tanzania. East African Community Secretariat-East African Business Council (EAC-EABC). 2006. “Proposed
Mechanism of the Elimination of Non-tariff Barriers in EAC.” Arusha, Tanzania. EATI (East African Transportation Initiative). 1999. “Enhancing Transport Policy Harmonization in
Eastern and Southern Africa Through Dialogue.” Quarterly Newsletter, third issue (November).
94
Economic Commission for Africa. 2000. “Transit Problems of Land-locked African Countries.” ECA/RCI/45/00 Rev. II, Addis Ababa, Ethiopia.
---------.2004, 2006/7. “Business Climate Index Survey Reports.” Arusha, Tanzania. Commission of the European Communities. 1985. “Completing the Internal Market.” White Paper from
the Commission to the European Council. Office for Official Publications of the European Communities, Luxembourg. http://europa.eu.int/comm/off/pdf/1985.
---------. 2003. “The Internal Market-Ten Years Without Frontiers.” White Paper from the Commission to
the European Council. Office for Official Publications of the European Communities, Luxembourg. http://europa.eu.int/comm/internal market/10 years/workingdoc
Hammels, D. 2001. “Time as a Trade Barrier.” Global Trade Analysis Project Working Paper 18, Purdue
University. International Food Policy Research Institute. 2008. “Review of East African Grain Trade.” Washington
DC IMF (International Monetary Fund). 2006a. “Burundi: Selected Issues and Statistical Appendix.” IMF
Country Report 06/307, International Monetary Fund, Washington, DC. ---------. 2006b. “IMF Survey” (October). International Monetary Fund, Washington, D.C. ---------. 2007. “Burundi: Fifth Review Under the Arrangement Under the Poverty Reduction and Growth
Facility and Request for Waiver of a Performance Criterion—Staff Report; Press Release on the Executive Board Discussion; and Statement by the Executive Director for Burundi.” IMF Country Report 07/113 (March), International Monetary Fund, Washington, DC.
Integrated Framework, World Bank. 2006. “Uganda: Diagnostic Trade Integration Study”. ---------. 2003. “Burundi: Diagnostic Trade Integration Study.” ---------. 2005a. “Kenya: Diagnostic Trade Integration Study.” ---------. 2005b. “Rwanda: Diagnostic Trade Integration Study.” ---------. 2005c. “Tanzania: Diagnostic Trade Integration Study.” Kadede, Th. 2007. “L’adhésion du Burundi à la Communauté de l’Afrique de l’Est : opportunités et défis
en perspective .” Cahiers de l’Institut de Développement Economique (IDEC) 2 (1) (April). ---------. 2008. “Etude sur la coopération douanière entre le COMESA et la Communauté de l’Afrique de
l’Est.” Final Report, Economic Commission for Africa (January). Addis Ababa, Ethiopia: Economic Commission for Africa.
Kalarnogo, Coulibab, and Tembo R. B. Maburuki. 2006. “Cross-border trade in Rwanda.” Background
paper for the Rwanda Country Economic Memorandum. World Bank, Washington, DC.
95
KAM (Knowledge Assessment Methodology). 2008. “Trade Facilitation Study.” Kee, Hiau Looi, Alessandro Nicita and Marcelo Olarreaga. 2006. “Estimating Trade Restrictiveness
Indices.” Policy Research Working Paper no. 3840, World Bank, Washington, DC. -------. 2004. “Import demand elasticities and trade distortions”, Policy Research Working Paper no. 3452,
The World Bank, Washington, DC. Kenya Revenue Authority. 2004. “Time Release Study: Kenya”. 56p.
http://www.kra.go.ke/knowledgemanagement/pdf/other/Kenya Leamer, E. Edward. 1990. “Latin America as a Target of Trade Barriers Erected by the Major Developed
Countries in 1988.” Journal of Development Economics 32: 337–68. Limao N. and Venables A.J. (2001), “Infrastructure, Geographical Disadvantage and Transport Costs”,
World Bank Economic Review, Volume 15, Number 3, pp.451-479. Mackellar L., Wörgötter A. and Wörz J. (2002), “Economic Growth of Landlocked Countries”, in
Chaloupek, G., Guger, A., Nowotny, E. and Schwödiauer, G., Ökonomie in Theorie und Praxis, Springer, Berlin, pp.213-226.
Michalopoulos, Constantine. 1999.“Trade Policy and Market Access Issues for Developing Countries.”
Policy Research Working Paper, World Bank, Washington, DC (October). Mitakaro, Jean-Jacques. 2000. “Problématique du transport international et intégration régionale.”
Cahiers de l’Institut de Développement Economique (IDEC), Bujumbura (November). Mold, Andrew. 2005. “Non-Tariff Barriers–Their Prevalence and Relevance for African Countries.”
ATPC Work in Progress No. 25, Economic Commission for Africa, Addis Ababa. Pearson, M. 2006. “Enhancing African Regional Integration: Trade Policy and Trade Facilitation.”
Presentation to the World Bank Course on Regional Integration in Africa and Economic Partnership Agreements, Nairobi, May 22–4.
Pedersen, P. O., 2001, Freight transport under globalization and its impact on Africa, Journal of
Transport Geography 9(2):85-99. Raman, V. 2006. “Transport and Trade Facilitation in Uganda.” Background paper for the Uganda
Diagnostic Trade Integration Study, World Bank, Washington, DC. Republic of Burundi. 2003. “Examen des politiques commerciales du Burundi.” Republic of Burundi,
Bujumbura. ---------. 2005. “Document de Cadre Stratégique de croissance et de Lutte contre la Pauvreté-Complet.”
Republic of Burundi, Bujumbura. Republic of Uganda (GOU). 2008. “Background to the Budget 2008/09, Achieving Property for all
through Infrastructure Development, Enhancing Employment and Economic Growth.” Ministry of Finance, Planning and Economic Development, Kampala (June).
Rizet, C. and Gwet, H. (1998), “Transport de Marchandises: Une Comparaison Internationale des Prix du
Camionnage. Afrique, Asie du Sud Est, Amérique Centrale”.
96
Rizet C and Hine, J. (1993), “A Comparison of the Costs and Productivity of Road Freight Transport in
Africa and Pakistan”, Transport Reviews, Vol 13, No.2. Rwanda Private Sector Federation. 2007. “Trade Facilitation along the Northern and Central Corridors–
An Experiential Study Trip by the Rwanda Private Sector Federation, June and August 2007. http://www.rpsf.org.rw/
SADC (Southern African Development Community). 2004. “Inventory of Regional Non Tariff Barriers:
Synthesis Report.” Regional Trade Facilitation Program, Gaborone, Botswana, (November). Steenlandt, Marcel, Jean Puons, and Claude Dufly. 2002. "Communauté Economique et Monétaire de
l'Afrique Centrale (CEMAC): Vers l'Union Douanière en Afrique Centrale." Paris (November). UNCTAD (United Nations Conference on Trade and Development). 2003. “Coding of Trade Control
Measures 2003, with Over 100 Different NTMs.” TD/B/COM.1/EM.27/3, UNCTAD, Geneva. ---------. 2005. “Methodologies, Classifications, Qualification and Development Impacts of Non-tariff
Barriers.” Note by UNCTAD Secretariat, TD/B/COM.1/EM.27/2, June 23, Geneva. UNECA (United Nations Economic Commission for Africa). 1999. «Cadre pour une politique de
développement et de mise en place des Accords de transit en Afrique.» Document ECA/RCID/098/99 (September).
---------. 2004. “Assessing Regional Integration in Africa.” Trade and Regional Integration Division,
United Nations Economic Commission for Africa, Addis Ababa. USAID (United States Agency for International Development). 2003. Maize Trade Regional Policy
Conference Report for COMESA and EAC, Sept. 1-13, 2003. Regional Agricultural Trade Expansion Support (RATES) Program.
World Bank. 2003. Standards and Global Trade: A Voice for Africa. Washington, DC: World Bank. ---------. 2004. Etude diagnostique sur l’intégration commerciale du Burundi. World Bank, Washington,
DC (September). ---------. 2006. East Africa Trade Facilitation Project” Project Appraisal Document, Report No: 34178-
AFR. ---------. 2007a. Doing Business 2006. Washington, DC: World Bank. ---------. 2007b. “Option for Strengthening East African Community’s Trade Integration.” Report No.
40978–AFR, World Bank, Washington, DC (September). ---------. 2007c. Kenya: Unleashing the Potential for Trade and Growth. Report No: 37688-KE.DTIS. ---------. 2007d. Agriculture in Sub-Saharan Africa. An Independent Evaluation Group Review of World
Bank Assistance. ---------. 2008a. “A Survey of Non-Tariff Measures in the East Asia and Pacific Region.” Policy
Research Report No 42853, World Bank, Washington, DC (January).
97
---------. 2008b. World Trade Indicators 2008, including the Trade At-A-Glance (TAAG) Country Tables. Washington, DC: World Bank (June).
WTO (World Trade Organization). 2000a. “Trade Policy Review: Kenya.” Report by the Secretariat.
Geneva: World Trade Organization. ---------. 2000b. “Trade Policy Review: Tanzania.” Report by the Secretariat. Geneva: World Trade
Organization. ---------. 2001. “Trade Policy Review: Uganda.” Report by the Secretariat. Geneva: World Trade
Organization. ---------. 2003a. “Trade Policy Review: Burundi.” Report by the Secretariat. Geneva: World Trade
Organization. ---------. 2003b. “Inventory of Non Tariff Measures.” TN/MA/S/5/Rev.1, 28 November, (03-6324).
Geneva: World Trade Organization. ---------. 2004a. “Trade Policy Review: Rwanda.” Report by the Secretariat. Geneva: World Trade
Organization. ---------. 2004b. “Technical Barriers to Trade–The Problem.” Geneva: World Trade Organization.
http://www.wto.org/english/thewto_e/whatis_e/eol/wto03/wto3_3.htm ---------. 2005. Doha Declarations. Geneva: World Trade Organization. ---------. 1986. General Agreement on Tariffs and Trade. Geneva 105p.
http://www.wto.org/english/docs_e/legal_e/gatt47_e.pdf Yannopoulos, G. 1990. “The Effects of the Single Market on the Pattern of Japanese Investment.”
National Institute Economic Review, Number 134: 93–8.
98
WEB SITES
ASEAN: http://www.us-asean.org/afta.asp; http://www.aseansec.org/16620.htm;
http://www.aseansec.org/apris2/index.htm Bank of the Republic of Burundi. www.brb.bi Integrated Framework .www.integratedframework.org European Union. http://europa.eu/scadplus/treaties/singleact_en.htm# Kenya Ministry of Transport Web site, EA Trade and Transport Facilitation Project. www.transport.go.ke Northern Corridor Transit Transport Coordination Authority Web site. http://www.ttcanc.org Tanzania Ministry of Communications and Transport, with respect to information on the Central Corridor. http://www.tanzania.go.tz/communication.htm UNCTAD TRAINS database Web site. www.unctad.org/Trians USAID: Regional Agricultural Trade Expansion Support (RATES) Program. 2003.
http://eastafrica.usaid.gov/en/activity.1006.aspx Wikipedia, with respect to the Great North Road. http://en.wikipedia.org/wiki/Great_North_Road