Embed Size (px)
Citation preview
Sony IR Day 2014
Entertainment
NOVEMBER 18, 2014
Non-U.S. GAAP Measures
Adjusted OIBDA:
Adjusted OIBDA = Operating income before “depreciation and amortization” and “restructuring charges.” Adjusted OIBDA is not a measure in accordance with U.S. GAAP. Sony does not believe that this measure is a substitute for operating income in accordance with U.S. GAAP. However, Sony does believe that this supplemental disclosure for the Pictures and Music segments may provide additional useful analytical information to investors. A reconciliation of Adjusted OIBDA to operating income in accordance with U.S. GAAP can be found in the appendix to this presentation.
* FYE = Fiscal Year Ended (e.g. FYE 2015 = Fiscal Year Ending March 2015)
Sony IR Day 2014
Sony Entertainment
Michael LyntonCEO, Sony Entertainment
3
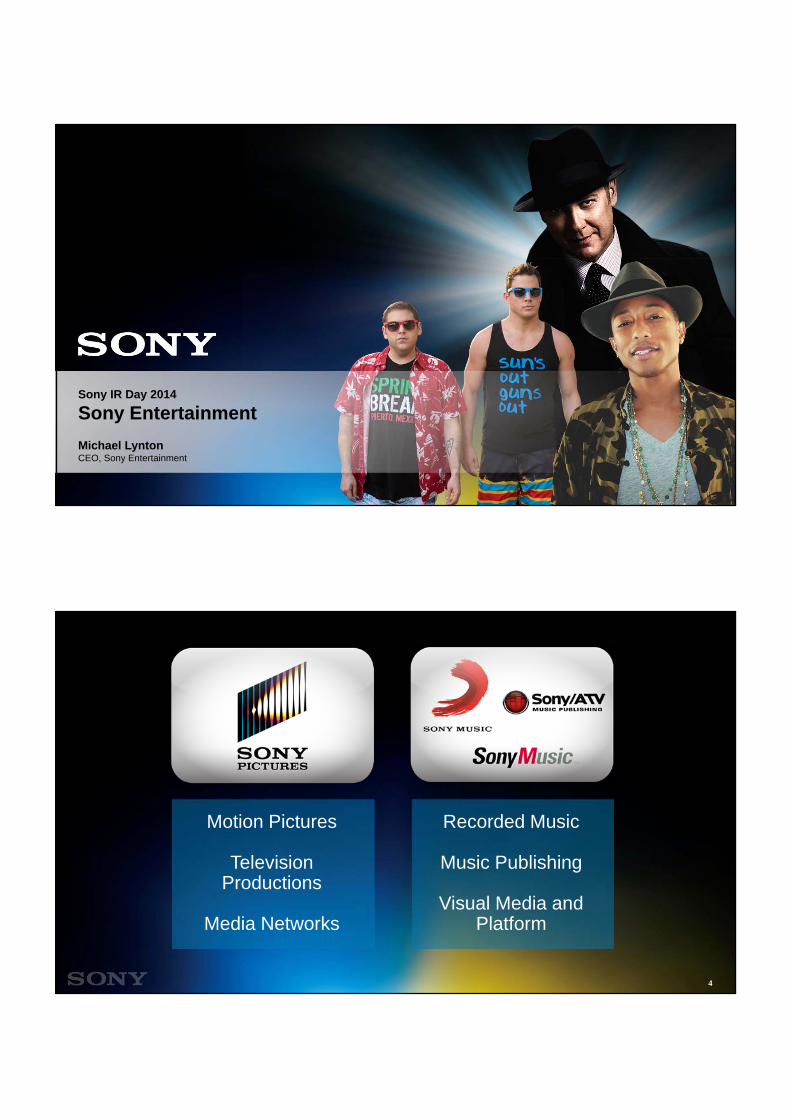
Recorded Music
Music Publishing
Visual Media and Platform
Motion Pictures
Television Productions
Media Networks
4
Sony Pictures Entertainment
6
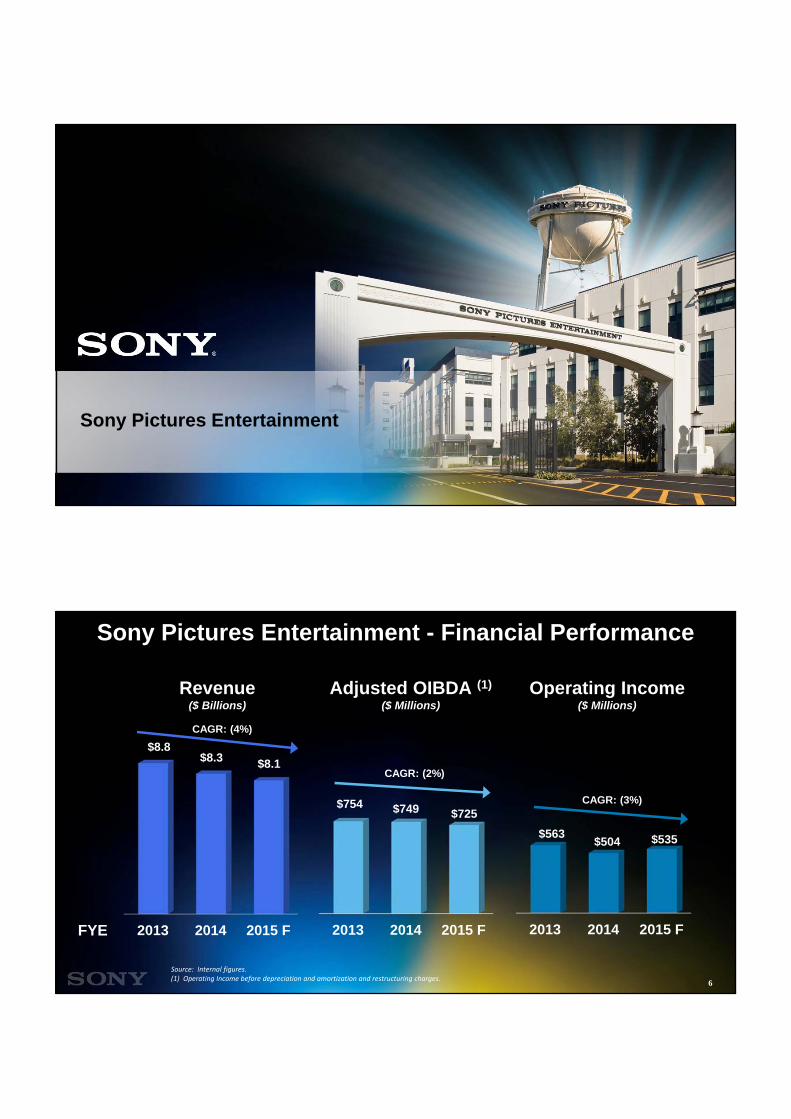
Sony Pictures Entertainment - Financial Performance
2013 2014 2015 F
$563 $504 $535
Revenue($ Billions)
2013 2014 2015 F
$754 $749 $725
Adjusted OIBDA (1)
($ Millions)
2013 2014 2015 F
$8.8 $8.3 $8.1
Operating Income($ Millions)
Source: Internal figures.(1) Operating Income before depreciation and amortization and restructuring charges.
FYE
CAGR: (4%)
CAGR: (2%)
CAGR: (3%)

7
Promising Opportunities Ahead
Motion PicturesSONY PICTURES ENTERTAINMENT

9
Recent Box Office Hits Ranging from Action to Drama to Comedy
10
FYE15 and FYE16 Upcoming Film Slate - Select Titles
BOND 24
11
12
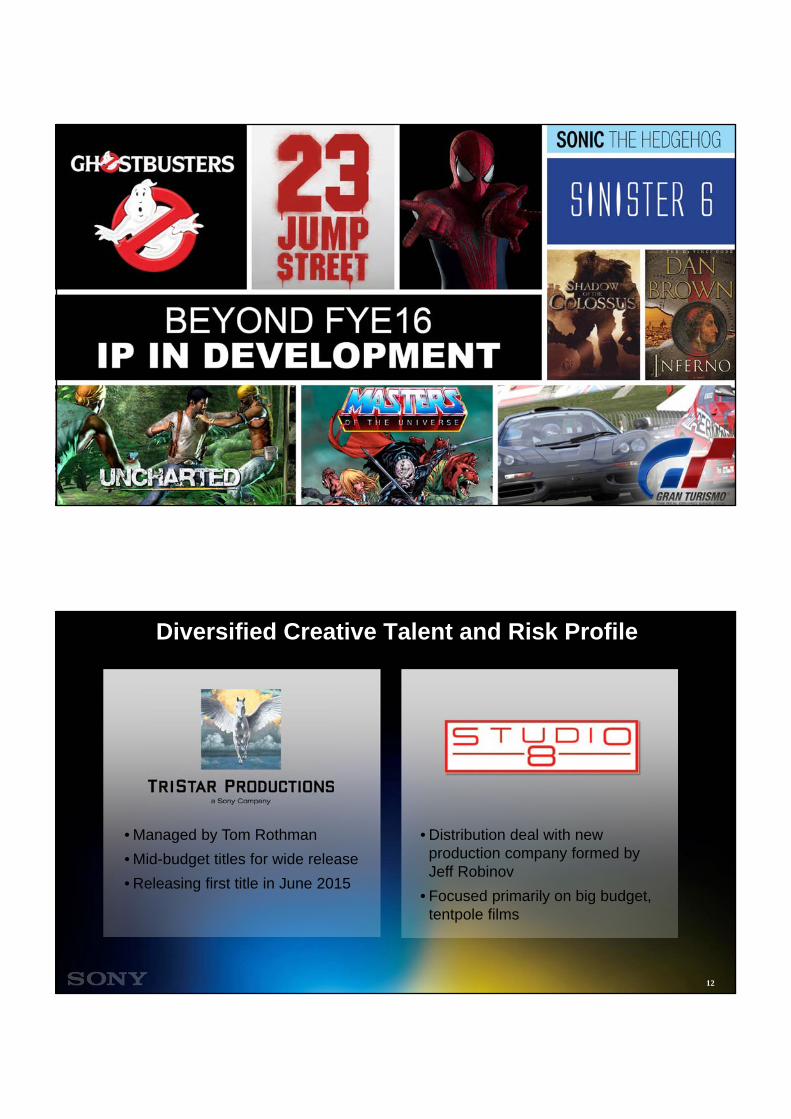
• Distribution deal with new production company formed byJeff Robinov
• Focused primarily on big budget, tentpole films
• Managed by Tom Rothman
• Mid-budget titles for wide release
• Releasing first title in June 2015
Diversified Creative Talent and Risk Profile
Film Slate Financing
• As of April 2014, SPE entered into a three year co-financing agreement with LStar Capital, whereby LStar Capital will invest in a majority of SPE’s films
• In addition, Village Roadshow has agreed to finance a selection of SPE film titles
• Film financing partners partially finance the production of a film or slate of films in exchange for a financial interest
• Film financing deals provide additional capital and help manage risk
• SPE’s continued ability to secure film financing partners reinforces that our films offer an attractive financial opportunity
13
Television Productions
SONY PICTURES ENTERTAINMENT
15
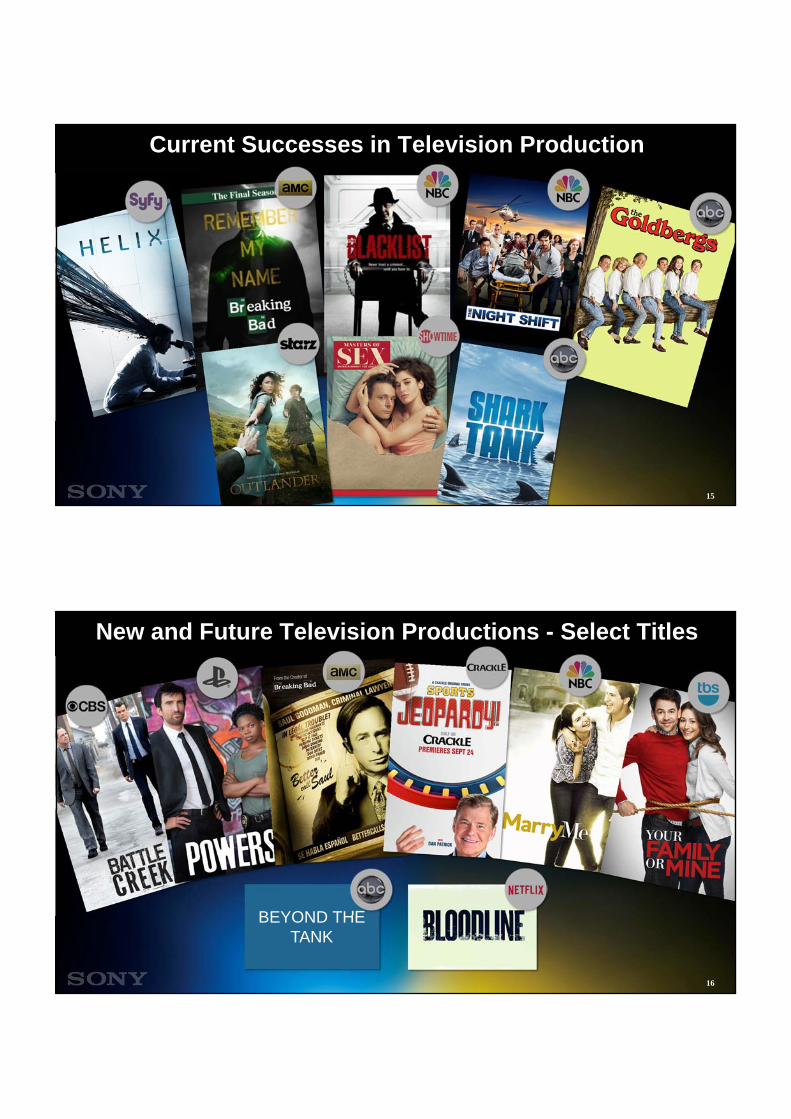
Current Successes in Television Production
16
New and Future Television Productions - Select Titles
BEYOND THE TANK
17
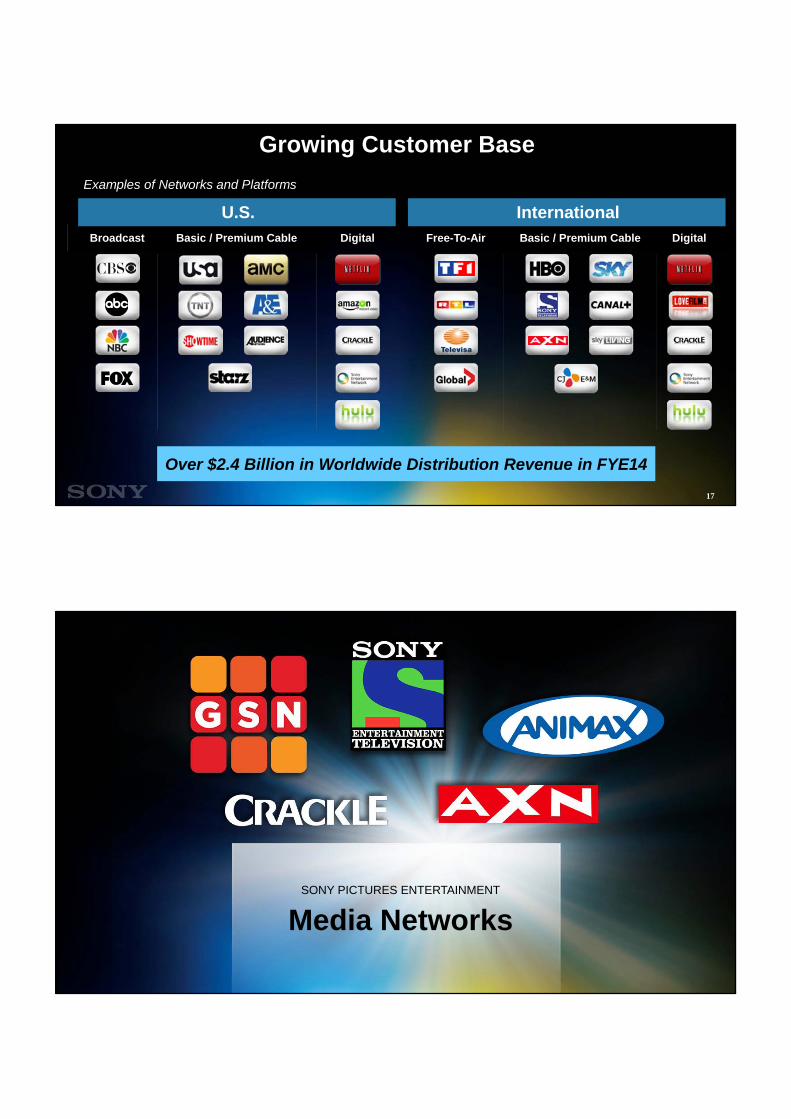
Growing Customer Base
Broadcast Digital Free-To-Air DigitalBasic / Premium CableBasic / Premium Cable
U.S.
Examples of Networks and Platforms
International
Over $2.4 Billion in Worldwide Distribution Revenue in FYE14
Media NetworksSONY PICTURES ENTERTAINMENT
19
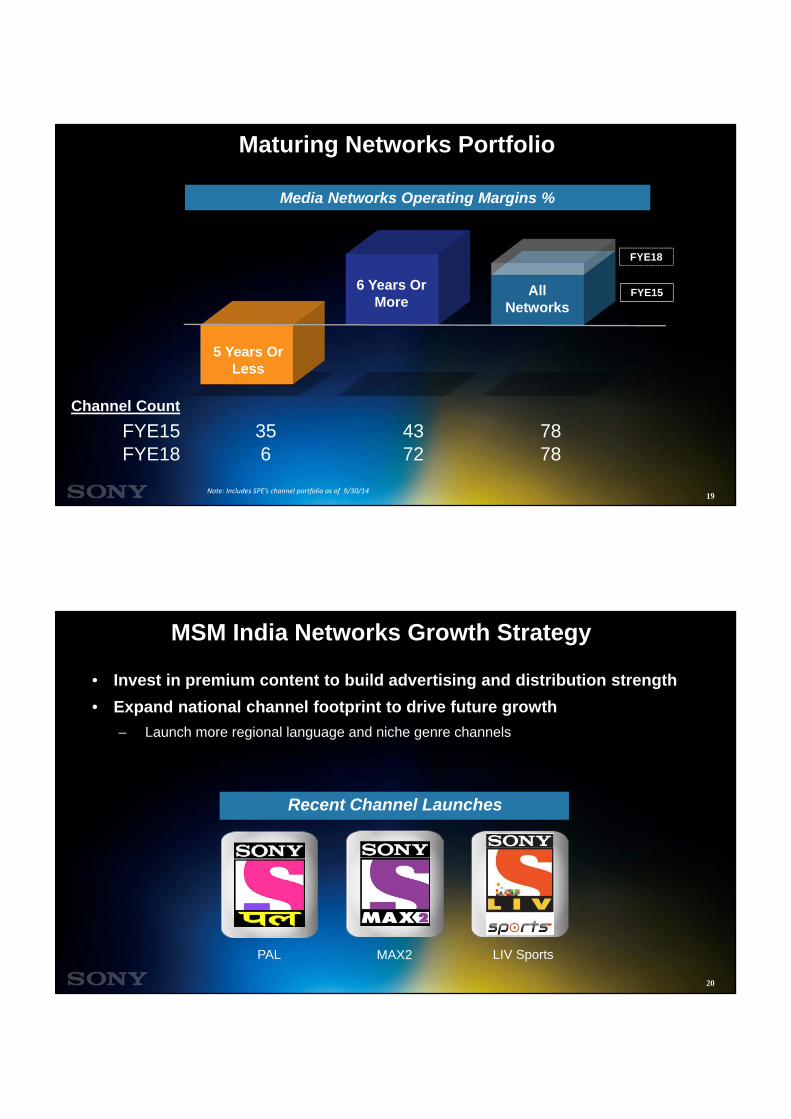
Maturing Networks Portfolio
356
4372
FYE15FYE18
Note: Includes SPE’s channel portfolio as of 9/30/14
7878
Media Networks Operating Margins %
Channel Count
5 Years Or Less
6 Years Or More
All Networks
FYE18
FYE15
20
MSM India Networks Growth Strategy
• Invest in premium content to build advertising and distribution strength
• Expand national channel footprint to drive future growth
– Launch more regional language and niche genre channels
Recent Channel Launches
PAL MAX2 LIV Sports
21
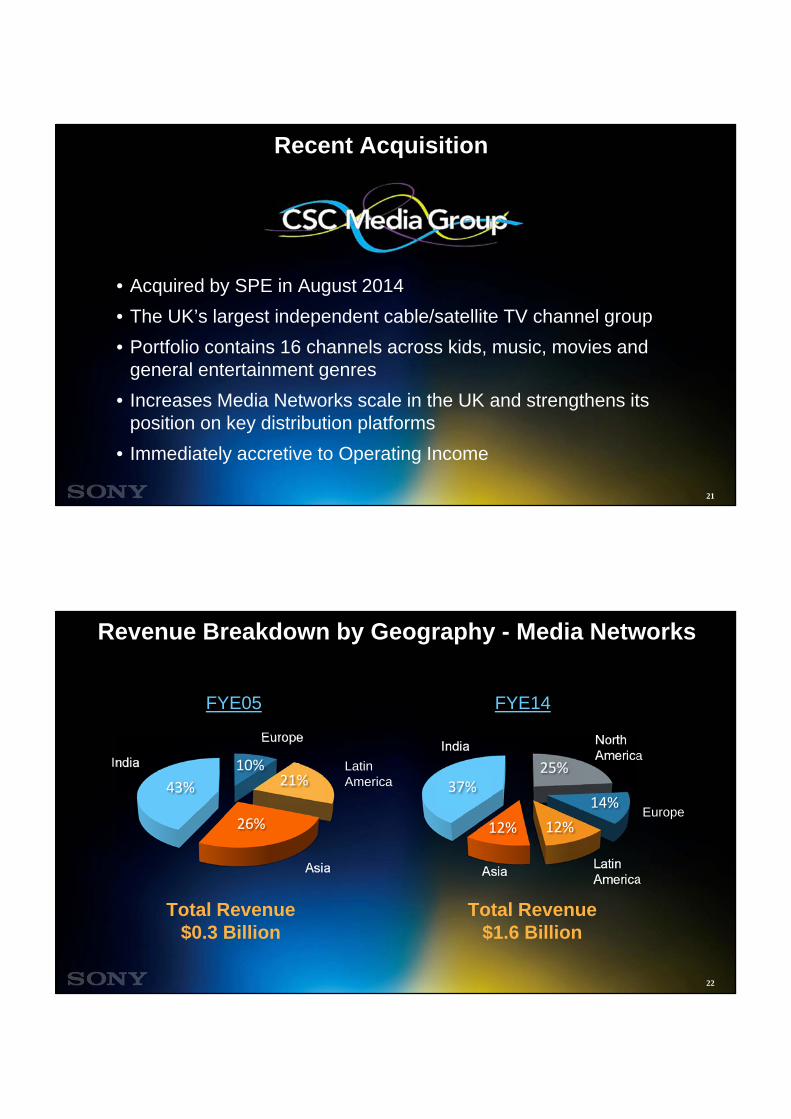
Recent Acquisition
• Acquired by SPE in August 2014
• The UK’s largest independent cable/satellite TV channel group
• Portfolio contains 16 channels across kids, music, movies and general entertainment genres
• Increases Media Networks scale in the UK and strengthens its position on key distribution platforms
• Immediately accretive to Operating Income
22
Asia
FYE05 FYE14
Europe
Latin America
India
North America
Asia
Europe
Latin America
India
Revenue Breakdown by Geography - Media Networks
26%
Total Revenue$0.3 Billion
Total Revenue$1.6 Billion
43%
10%21% 37%
25%
14%
12%12%
23
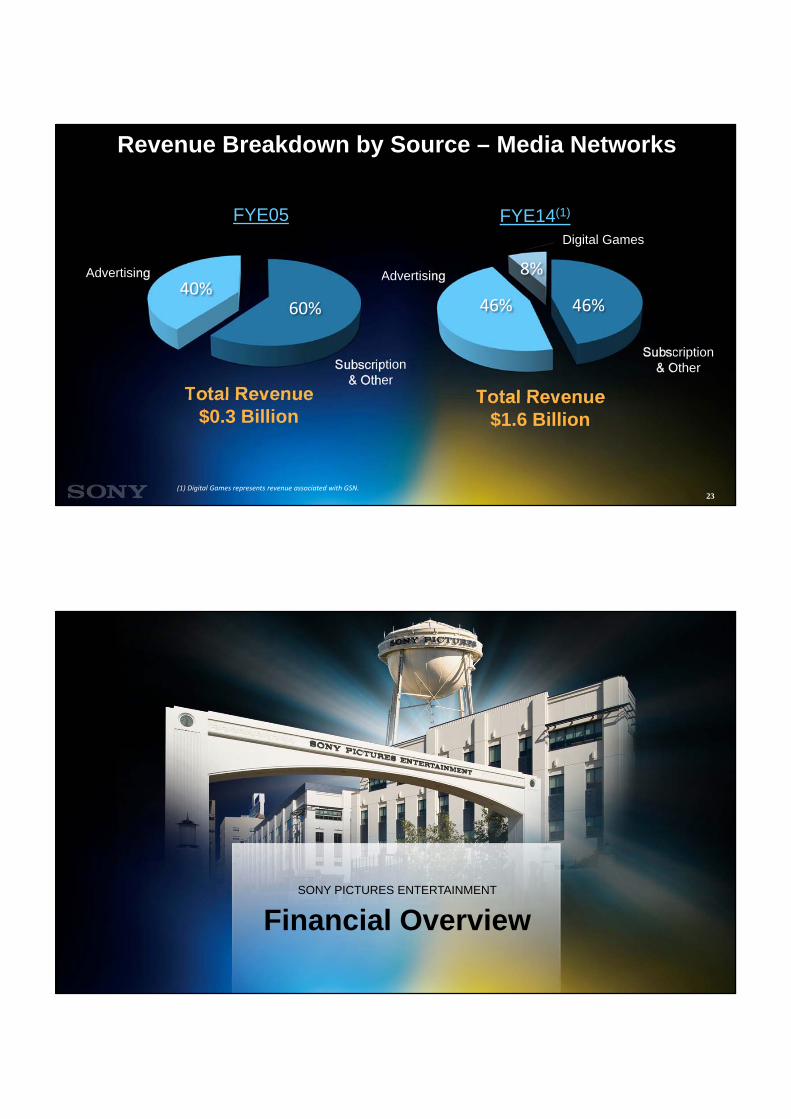
FYE05 FYE14(1)
Total Revenue$0.3 Billion
Total Revenue$1.6 Billion
Revenue Breakdown by Source – Media Networks
Advertising
Subscription & Other
Advertising
Subscription & Other
(1) Digital Games represents revenue associated with GSN.
60%40%
46%46%
Digital Games
8%
Financial OverviewSONY PICTURES ENTERTAINMENT
25
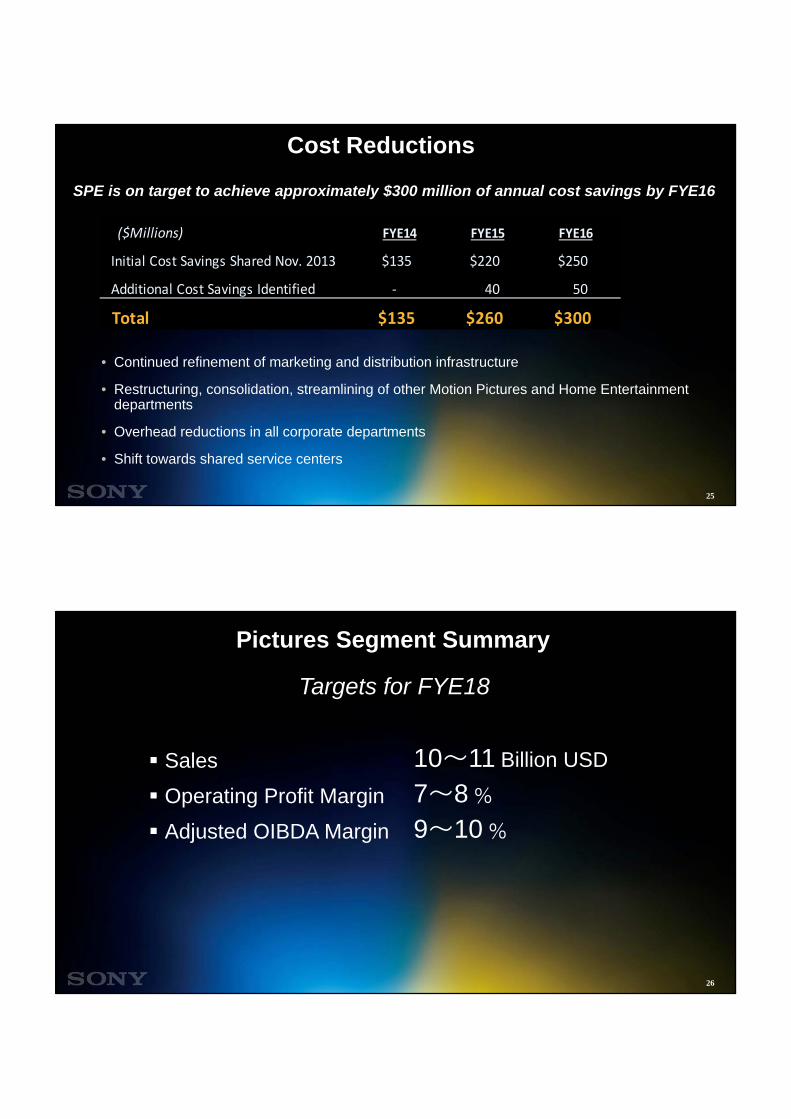
($Millions) FYE14 FYE15 FYE16
Initial Cost Savings Shared Nov. 2013 $135 $220 $250
Additional Cost Savings Identified ‐ 40 50
Total $135 $260 $300
SPE is on target to achieve approximately $300 million of annual cost savings by FYE16
Cost Reductions
• Continued refinement of marketing and distribution infrastructure
• Restructuring, consolidation, streamlining of other Motion Pictures and Home Entertainment departments
• Overhead reductions in all corporate departments
• Shift towards shared service centers
26
Pictures Segment Summary
Targets for FYE18
Sales 10~11 Billion USD
Operating Profit Margin 7~8 %
Adjusted OIBDA Margin 9~10 %
Sony Music
27
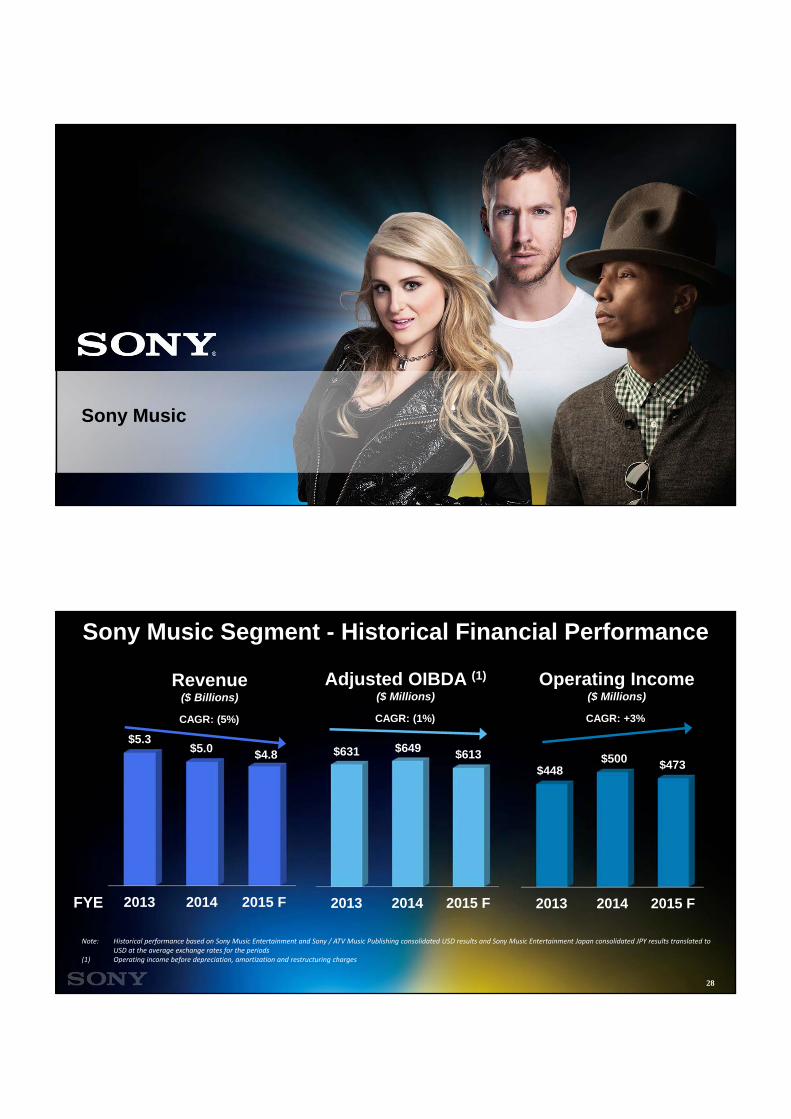
Sony Music Segment - Historical Financial Performance
Note: Historical performance based on Sony Music Entertainment and Sony / ATV Music Publishing consolidated USD results and Sony Music Entertainment Japan consolidated JPY results translated to USD at the average exchange rates for the periods
(1) Operating income before depreciation, amortization and restructuring charges
Revenue($ Billions)
2013 2014 2015 F
$5.3$5.0 $4.8
CAGR: (5%)
Operating Income($ Millions)
2013 2014 2015 F
$448$500 $473
CAGR: +3%
Adjusted OIBDA (1)
($ Millions)
2013 2014 2015 F
$631 $649 $613
CAGR: (1%)
FYE
28
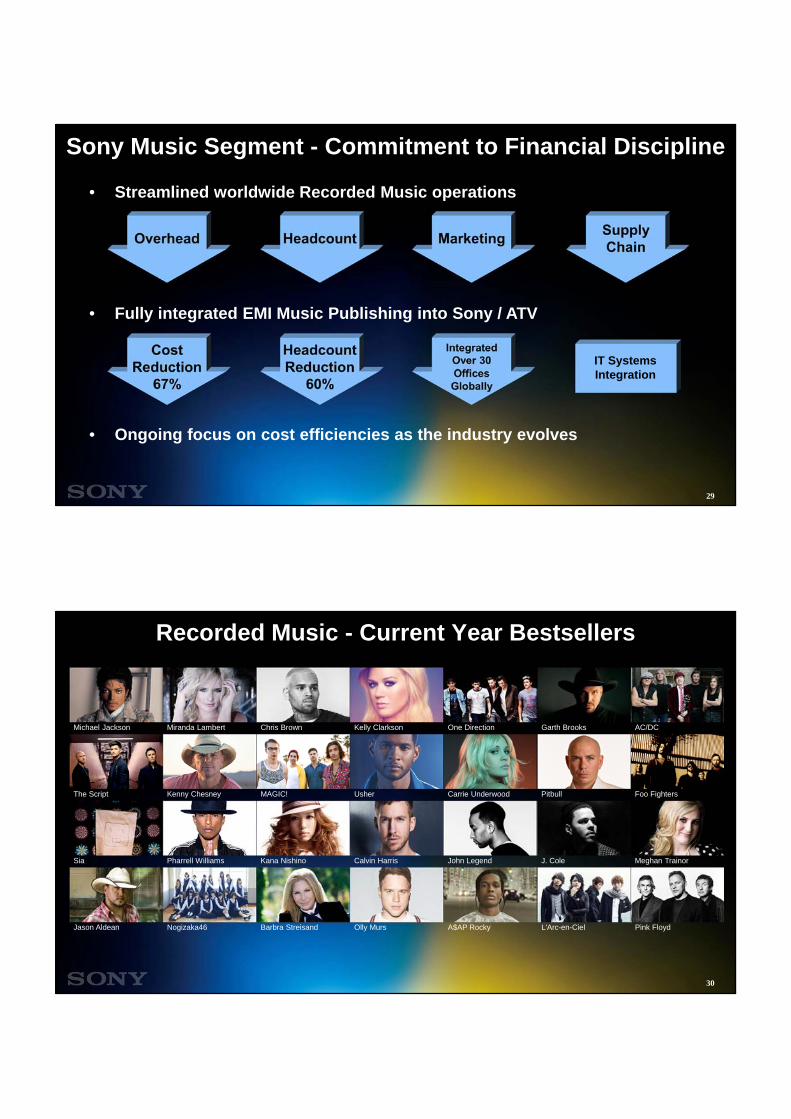
Sony Music Segment - Commitment to Financial Discipline
• Streamlined worldwide Recorded Music operations
• Fully integrated EMI Music Publishing into Sony / ATV
• Ongoing focus on cost efficiencies as the industry evolves
IT Systems Integration
29
Michael Jackson Miranda Lambert Chris Brown Kelly Clarkson One Direction Garth Brooks AC/DC
The Script Kenny Chesney MAGIC! Usher Carrie Underwood Pitbull Foo Fighters
Sia Pharrell Williams Kana Nishino Calvin Harris John Legend J. Cole Meghan Trainor
Jason Aldean Nogizaka46 Barbra Streisand Olly Murs A$AP Rocky L'Arc-en-Ciel Pink Floyd
Recorded Music - Current Year Bestsellers
30
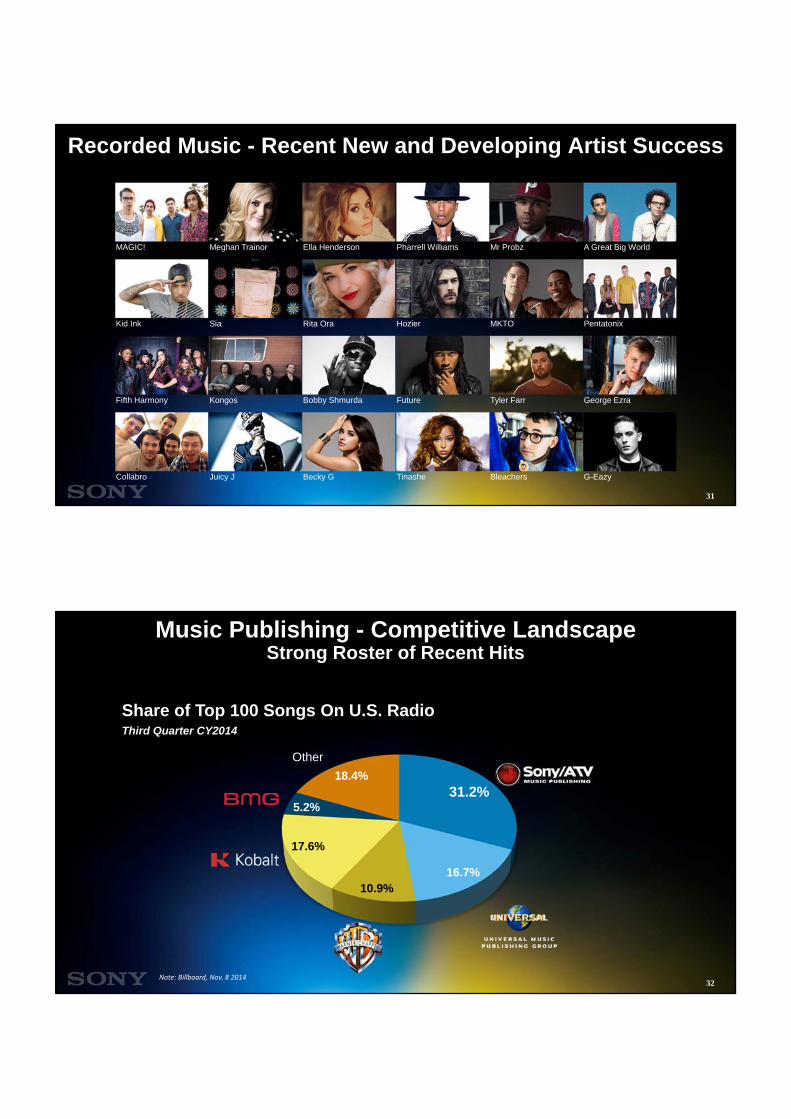
Recorded Music - Recent New and Developing Artist Success
MAGIC! Meghan Trainor Ella Henderson Pharrell Williams Mr Probz A Great Big World
Kid Ink Sia Rita Ora Hozier MKTO Pentatonix
Fifth Harmony Kongos Bobby Shmurda Future Tyler Farr George Ezra
Collabro Juicy J Becky G Tinashe Bleachers G-Eazy
31
31.2%
16.7%10.9%
17.6%
5.2%
18.4%
Music Publishing - Competitive LandscapeStrong Roster of Recent Hits
Share of Top 100 Songs On U.S. RadioThird Quarter CY2014
Other
Note: Billboard, Nov. 8 201432
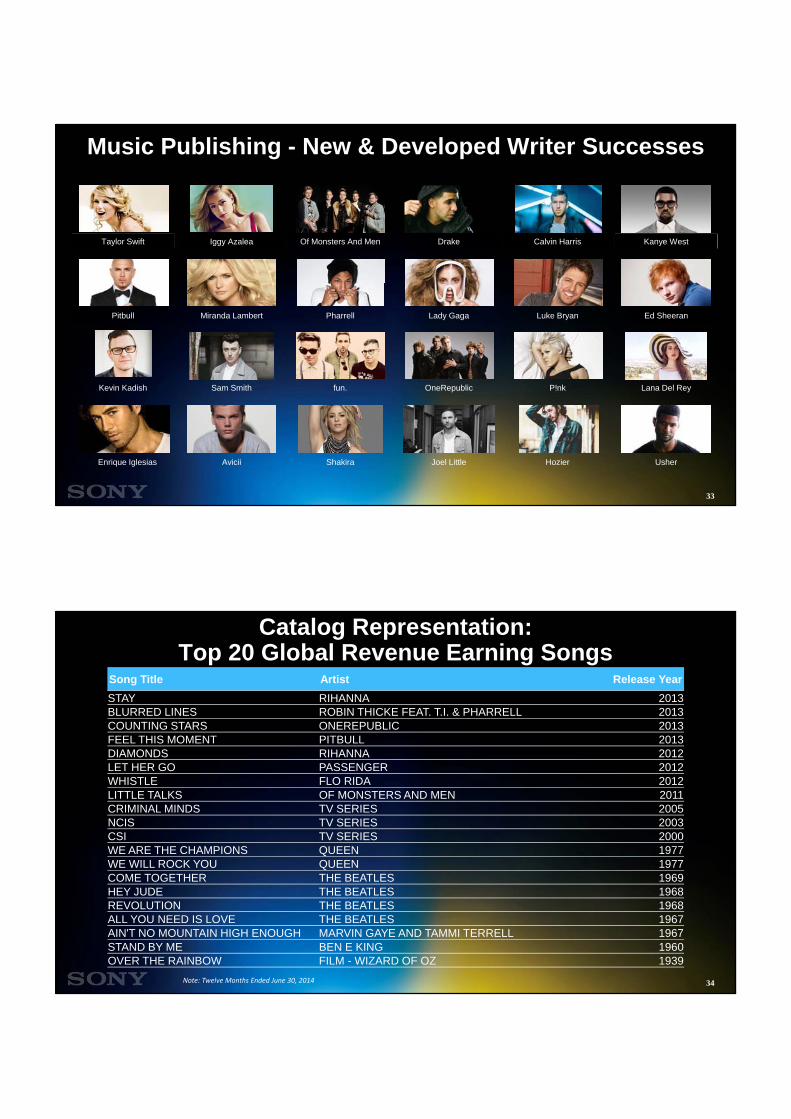
Music Publishing - New & Developed Writer Successes
Drake Calvin Harris Kanye West
Lady Gaga Luke Bryan Ed Sheeran
OneRepublic P!nk Lana Del Rey
Joel Little Hozier Usher
Taylor Swift Iggy Azalea Of Monsters And Men
Pitbull Miranda Lambert Pharrell
Kevin Kadish Sam Smith fun.
Enrique Iglesias Avicii Shakira
33
Catalog Representation:Top 20 Global Revenue Earning Songs
Song Title Artist Release Year
STAY RIHANNA 2013BLURRED LINES ROBIN THICKE FEAT. T.I. & PHARRELL 2013COUNTING STARS ONEREPUBLIC 2013FEEL THIS MOMENT PITBULL 2013DIAMONDS RIHANNA 2012LET HER GO PASSENGER 2012WHISTLE FLO RIDA 2012LITTLE TALKS OF MONSTERS AND MEN 2011CRIMINAL MINDS TV SERIES 2005NCIS TV SERIES 2003CSI TV SERIES 2000WE ARE THE CHAMPIONS QUEEN 1977WE WILL ROCK YOU QUEEN 1977COME TOGETHER THE BEATLES 1969HEY JUDE THE BEATLES 1968REVOLUTION THE BEATLES 1968ALL YOU NEED IS LOVE THE BEATLES 1967AIN'T NO MOUNTAIN HIGH ENOUGH MARVIN GAYE AND TAMMI TERRELL 1967STAND BY ME BEN E KING 1960OVER THE RAINBOW FILM - WIZARD OF OZ 1939
Note: Twelve Months Ended June 30, 2014 34
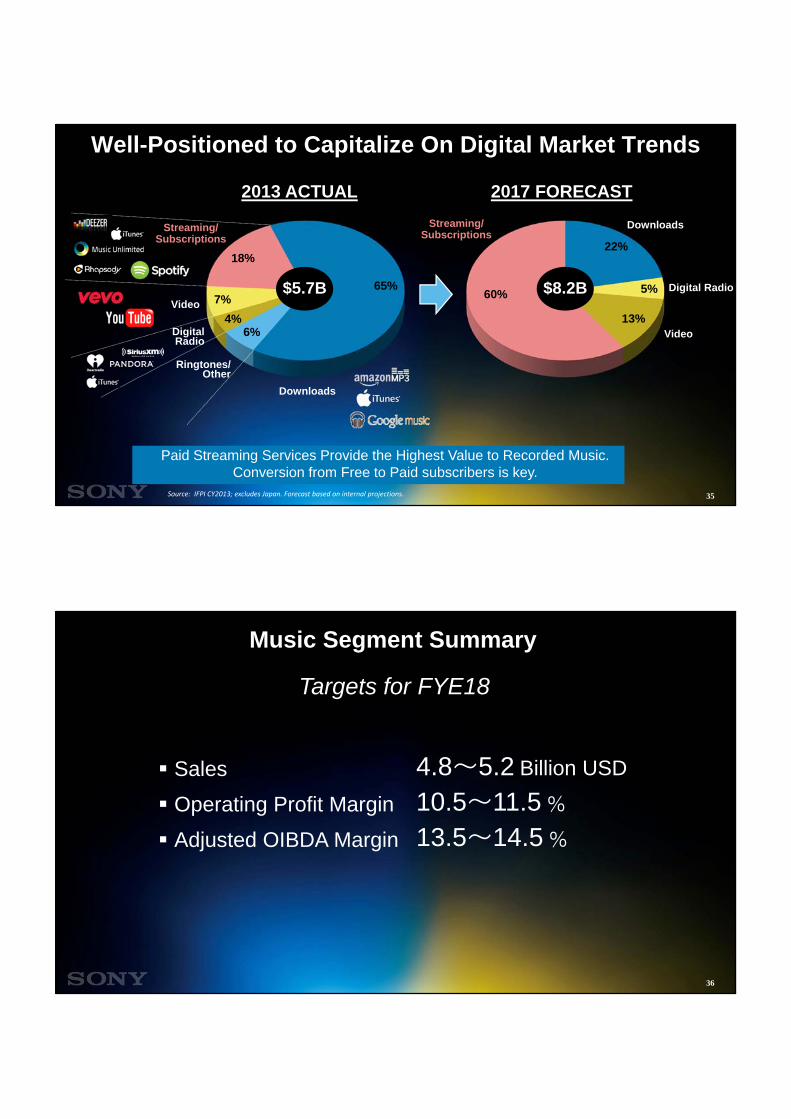
Well-Positioned to Capitalize On Digital Market Trends
65%
6%4%
7%
18%22%
5%
13%
60%
Downloads
Ringtones/Other
DigitalRadio
Streaming/Subscriptions
Video
DownloadsStreaming/Subscriptions
Video
Digital Radio
2013 ACTUAL 2017 FORECAST
Source: IFPI CY2013; excludes Japan. Forecast based on internal projections.
$5.7B $8.2B
Paid Streaming Services Provide the Highest Value to Recorded Music. Conversion from Free to Paid subscribers is key.
35
Music Segment Summary
Sales 4.8~5.2 Billion USD
Operating Profit Margin 10.5~11.5 %
Adjusted OIBDA Margin 13.5~14.5 %
Targets for FYE18
36
Conclusion
Creating, acquiring and distributing the best content
Investing for growth
Embracing new technologies
Committed to financial discipline
Dedicated to One Sony strategy
37
Appendix
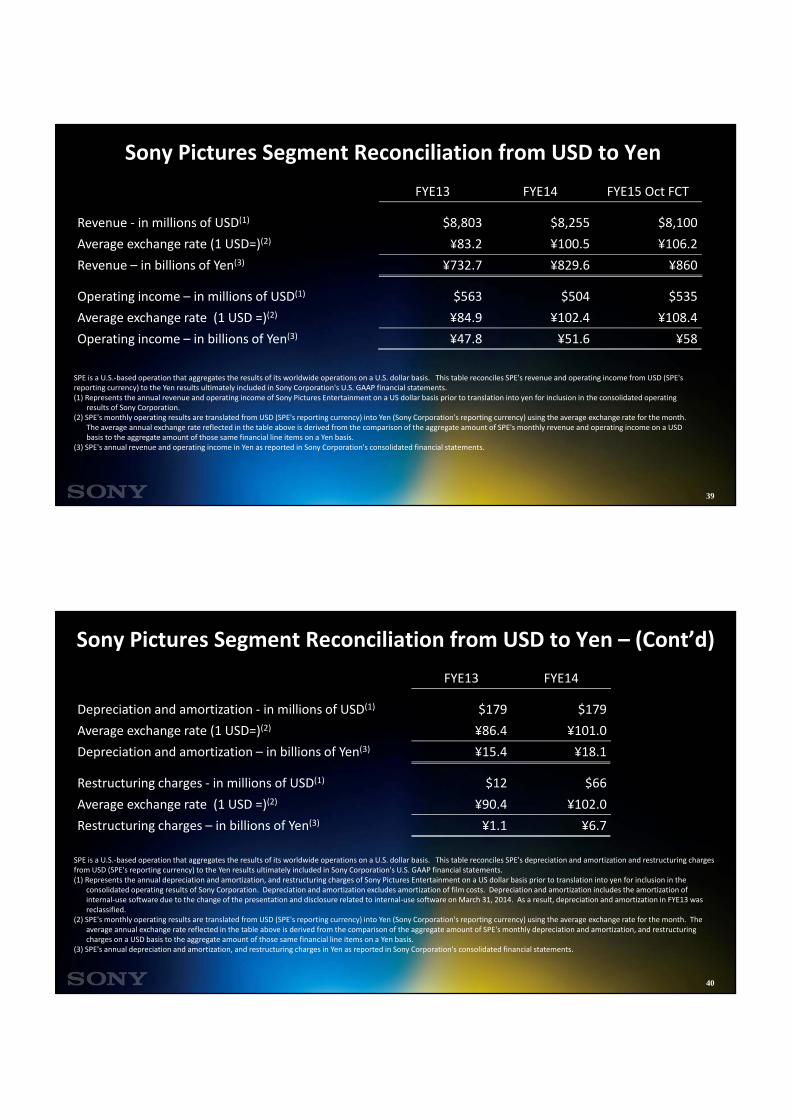
Sony Pictures Segment Reconciliation from USD to Yen
FYE13 FYE14 FYE15 Oct FCT
Revenue ‐ in millions of USD(1) $8,803 $8,255 $8,100
Average exchange rate (1 USD=)(2) ¥83.2 ¥100.5 ¥106.2
Revenue – in billions of Yen(3) ¥732.7 ¥829.6 ¥860
Operating income – in millions of USD(1) $563 $504 $535
Average exchange rate (1 USD =)(2) ¥84.9 ¥102.4 ¥108.4
Operating income – in billions of Yen(3) ¥47.8 ¥51.6 ¥58
SPE is a U.S.‐based operation that aggregates the results of its worldwide operations on a U.S. dollar basis. This table reconciles SPE's revenue and operating income from USD (SPE's reporting currency) to the Yen results ultimately included in Sony Corporation's U.S. GAAP financial statements.(1) Represents the annual revenue and operating income of Sony Pictures Entertainment on a US dollar basis prior to translation into yen for inclusion in the consolidated operating
results of Sony Corporation.(2) SPE's monthly operating results are translated from USD (SPE's reporting currency) into Yen (Sony Corporation's reporting currency) using the average exchange rate for the month.
The average annual exchange rate reflected in the table above is derived from the comparison of the aggregate amount of SPE's monthly revenue and operating income on a USD basis to the aggregate amount of those same financial line items on a Yen basis.
(3) SPE's annual revenue and operating income in Yen as reported in Sony Corporation's consolidated financial statements.
39
Sony Pictures Segment Reconciliation from USD to Yen – (Cont’d)
SPE is a U.S.‐based operation that aggregates the results of its worldwide operations on a U.S. dollar basis. This table reconciles SPE's depreciation and amortization and restructuring charges from USD (SPE's reporting currency) to the Yen results ultimately included in Sony Corporation's U.S. GAAP financial statements.(1) Represents the annual depreciation and amortization, and restructuring charges of Sony Pictures Entertainment on a US dollar basis prior to translation into yen for inclusion in the
consolidated operating results of Sony Corporation. Depreciation and amortization excludes amortization of film costs. Depreciation and amortization includes the amortization of internal‐use software due to the change of the presentation and disclosure related to internal‐use software on March 31, 2014. As a result, depreciation and amortization in FYE13 was reclassified.
(2) SPE's monthly operating results are translated from USD (SPE's reporting currency) into Yen (Sony Corporation's reporting currency) using the average exchange rate for the month. The average annual exchange rate reflected in the table above is derived from the comparison of the aggregate amount of SPE's monthly depreciation and amortization, and restructuring charges on a USD basis to the aggregate amount of those same financial line items on a Yen basis.
(3) SPE's annual depreciation and amortization, and restructuring charges in Yen as reported in Sony Corporation's consolidated financial statements.
FYE13 FYE14
Depreciation and amortization ‐ in millions of USD(1) $179 $179
Average exchange rate (1 USD=)(2) ¥86.4 ¥101.0
Depreciation and amortization – in billions of Yen(3) ¥15.4 ¥18.1
Restructuring charges ‐ in millions of USD(1) $12 $66
Average exchange rate (1 USD =)(2) ¥90.4 ¥102.0
Restructuring charges – in billions of Yen(3) ¥1.1 ¥6.7
40
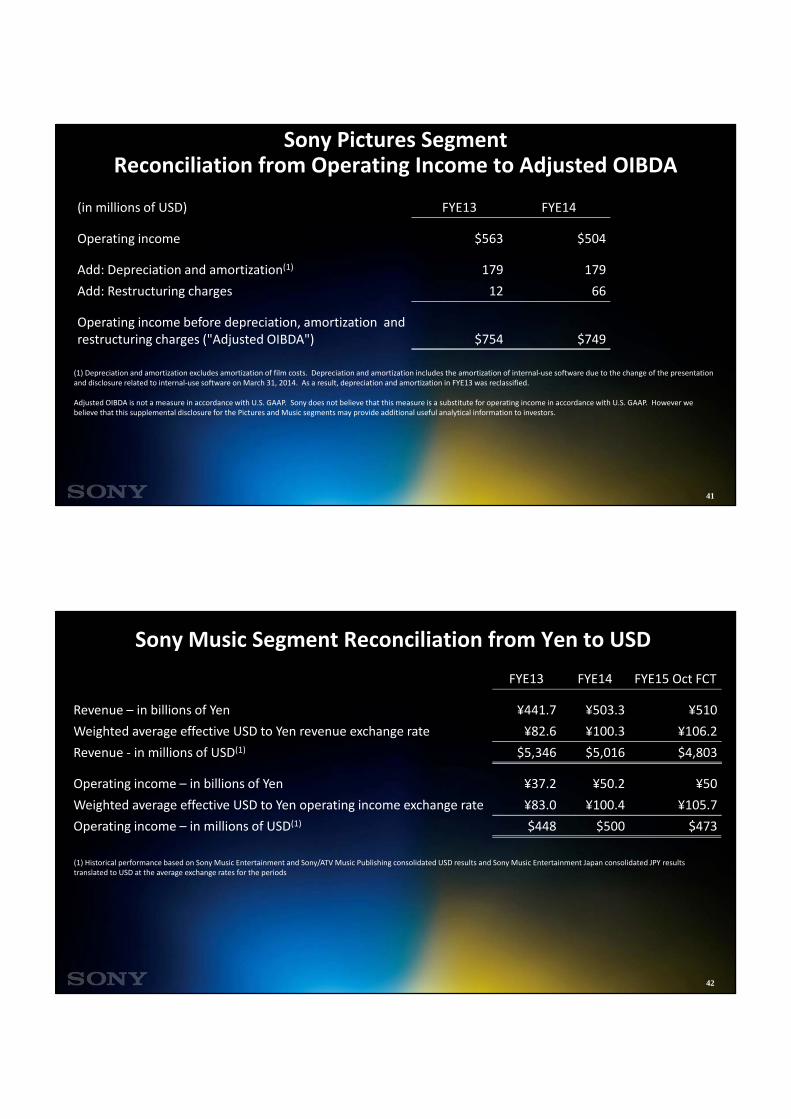
Sony Pictures Segment Reconciliation from Operating Income to Adjusted OIBDA
(1) Depreciation and amortization excludes amortization of film costs. Depreciation and amortization includes the amortization of internal‐use software due to the change of the presentation and disclosure related to internal‐use software on March 31, 2014. As a result, depreciation and amortization in FYE13 was reclassified.
Adjusted OIBDA is not a measure in accordance with U.S. GAAP. Sony does not believe that this measure is a substitute for operating income in accordance with U.S. GAAP. However we believe that this supplemental disclosure for the Pictures and Music segments may provide additional useful analytical information to investors.
(in millions of USD) FYE13 FYE14
Operating income $563 $504
Add: Depreciation and amortization(1) 179 179
Add: Restructuring charges 12 66
Operating income before depreciation, amortization and restructuring charges ("Adjusted OIBDA") $754 $749
41
Sony Music Segment Reconciliation from Yen to USD
FYE13 FYE14 FYE15 Oct FCT
Revenue – in billions of Yen ¥441.7 ¥503.3 ¥510
Weighted average effective USD to Yen revenue exchange rate ¥82.6 ¥100.3 ¥106.2
Revenue ‐ in millions of USD(1) $5,346 $5,016 $4,803
Operating income – in billions of Yen ¥37.2 ¥50.2 ¥50
Weighted average effective USD to Yen operating income exchange rate ¥83.0 ¥100.4 ¥105.7
Operating income – in millions of USD(1) $448 $500 $473
(1) Historical performance based on Sony Music Entertainment and Sony/ATV Music Publishing consolidated USD results and Sony Music Entertainment Japan consolidated JPY results translated to USD at the average exchange rates for the periods
42
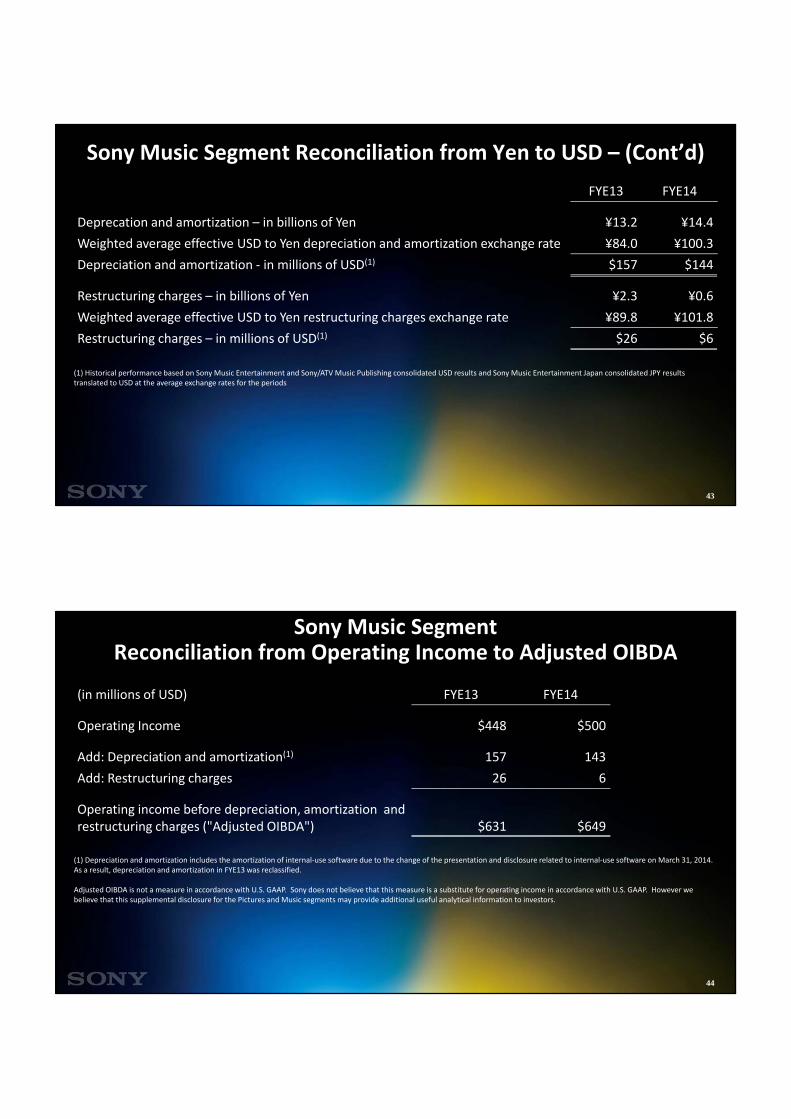
Sony Music Segment Reconciliation from Yen to USD – (Cont’d)
FYE13 FYE14
Deprecation and amortization – in billions of Yen ¥13.2 ¥14.4
Weighted average effective USD to Yen depreciation and amortization exchange rate ¥84.0 ¥100.3
Depreciation and amortization ‐ in millions of USD(1) $157 $144
Restructuring charges – in billions of Yen ¥2.3 ¥0.6
Weighted average effective USD to Yen restructuring charges exchange rate ¥89.8 ¥101.8
Restructuring charges – in millions of USD(1) $26 $6
(1) Historical performance based on Sony Music Entertainment and Sony/ATV Music Publishing consolidated USD results and Sony Music Entertainment Japan consolidated JPY results translated to USD at the average exchange rates for the periods
43
Sony Music Segment Reconciliation from Operating Income to Adjusted OIBDA
(1) Depreciation and amortization includes the amortization of internal‐use software due to the change of the presentation and disclosure related to internal‐use software on March 31, 2014. As a result, depreciation and amortization in FYE13 was reclassified.
Adjusted OIBDA is not a measure in accordance with U.S. GAAP. Sony does not believe that this measure is a substitute for operating income in accordance with U.S. GAAP. However we believe that this supplemental disclosure for the Pictures and Music segments may provide additional useful analytical information to investors.
(in millions of USD) FYE13 FYE14
Operating Income $448 $500
Add: Depreciation and amortization(1) 157 143
Add: Restructuring charges 26 6
Operating income before depreciation, amortization and restructuring charges ("Adjusted OIBDA") $631 $649
44
Cautionary StatementStatements made in this presentation with respect to Sony’s current plans, estimates, strategies and beliefs and other statements that are not historical facts are forward-looking statements about the future performance of Sony. Forward-looking statements include, but are not limited to, those statements using words such as “believe,” “expect,” “plans,” “strategy,” “prospects,” “forecast,” “estimate,” “project,” “anticipate,” “aim,” “intend,” “seek,” “may,” “might,” “could” or “should,” and words of similar meaning in connection with a discussion of future operations, financial performance, events or conditions. From time to time, oral or written forward-looking statements may also be included in other materials released to the public. These statements are based on management’s assumptions, judgments and beliefs in light of the information currently available to it. Sony cautions investors that a number of important risks and uncertainties could cause actual results to differ materially from those discussed in the forward-looking statements, and therefore investors should not place undue reliance on them. Investors also should not rely on any obligation of Sony to update or revise any forward-looking statements, whether as a result of new information, future events or otherwise. Sony disclaims any such obligation. Risks and uncertainties that might affect Sony include, but are not limited to:(i) the global economic environment in which Sony operates and the economic conditions in Sony’s markets, particularly levels of consumer spending;(ii) foreign exchange rates, particularly between the yen and the U.S. dollar, the euro and other currencies in which Sony makes significant sales and incurs production costs, or in
which Sony’s assets and liabilities are denominated;(iii) Sony’s ability to continue to design and develop and win acceptance of, as well as achieve sufficient cost reductions for, its products and services, including televisions, game
platforms and smartphones, which are offered in highly competitive markets characterized by severe price competition and continual new product and service introductions, rapid development in technology and subjective and changing consumer preferences;
(iv) Sony’s ability and timing to recoup large-scale investments required for technology development and production capacity;(v) Sony’s ability to implement successful business restructuring and transformation efforts under changing market conditions;(vi) Sony’s ability to implement successful hardware, software, and content integration strategies for all segments excluding the Financial Services segment, and to develop and
implement successful sales and distribution strategies in light of the Internet and other technological developments;(vii) Sony’s continued ability to devote sufficient resources to research and development and, with respect to capital expenditures, to prioritize investments correctly (particularly in
the electronics businesses);(viii) Sony’s ability to maintain product quality;(ix) the effectiveness of Sony’s strategies and their execution, including but not limited to the success of Sony’s acquisitions, joint ventures and other strategic investments;(x) significant volatility and disruption in the global financial markets or a ratings downgrade;(xi) Sony’s ability to forecast demands, manage timely procurement and control inventories;(xii) the outcome of pending and/or future legal and/or regulatory proceedings;(xiii) shifts in customer demand for financial services such as life insurance and Sony’s ability to conduct successful asset liability management in the Financial Services segment;(xiv) the impact of unfavorable conditions or developments (including market fluctuations or volatility) in the Japanese equity markets on the revenue and operating income of the
Financial Services segment; and(xv) risks related to catastrophic disasters or similar events.Risks and uncertainties also include the impact of any future events with material adverse impact.
45Sony Corporation Investor Relations