Embed Size (px)
Citation preview
Enomae, T., Han, Y.-H. and Isogai, A., "Nondestructive determination of fiber orientation distribution of fiber surface by image analysis", Nordic Pulp and Paper Research Journal 21(2): 253-259(2006) .
1
NONDESTRUCTIVE DETERMINATION OF FIBER ORIENTATION DISTRIBUTION OF PAPER SURFACE BY IMAGE ANALYSIS
Toshiharu Enomae, Yoon-Hee Han and Akira Isogai
Paper Science Laboratory, Department of Biomaterial Sciences
Graduate School of Agricultural and Life Sciences
The University of Tokyo
JAPAN
SUMMARY
Fiber orientation is a criterion used to ascertain the manufacturing district and manufacturing technique of ancient
paper as a material of cultural properties. Image analysis using fast Fourier transform with suitable modifications was
demonstrated to be an applicable and nondestructive method to determine the orientation angle and anisotropy. In order to
improve its accuracy, two new procedures—the binarization process of the microscopic images of the paper surface and
precise calculations of the average Fourier coefficients as an angular distribution by linear interpolation—have been
introduced to the existing procedures. This analytical method was applied to digital optical micrographs of paper surfaces.
As predicted, the method was able to distinguish among laboratory handsheet, copier paper, Japanese paper, and
wood-containing paper in terms of the papermaking processes. Traditionally manufactured Korean and Japanese papers
showed their own characteristic orientation behavior in accordance with the motion of the bamboo wire in papermaking.
ADDRESS OF THE AUTHORS: Toshiharu Enomae ([email protected]), Yoon-Hee Han
([email protected]) and Akira Isogai ([email protected]): The University of Tokyo, Graduate School of
Agricultural and Life Sciences, Yayoi 1-1-1, Bunkyo-ku, Tokyo 113-8657, JAPAN.
Corresponding author: Toshiharu Enomae
KEYWORDS Fourier transform, Japanese paper, Korean paper, fiber orientation angle, anisotropy
INTRODUCTION Pulp fibers assume a variety of spatial configurations in paper; their alignment is an important aspect of paper
structures. Statistically, fiber alignment is defined as the distribution of fiber orientation as a function of angle θ when the
cross-machine direction of a web or sheet is assumed to be θ = 0. Fiber orientation is manifested due to the flow of pulp
suspension; therefore, the flow conditions including the turbulence level and orienting shear alter it through the web or
sheet thickness and across the wire plane. Fiber orientation greatly affects physical properties like anisotropy in strength,
drying shrinkage and wet straining, and further curl and two-sidedness if there is a variation of in-plane orientation through
the sheet thickness (Niskanen et al. 2001).
For handmade papers manufactured using traditional methods in East Asian countries, fiber orientation is very evident
in spite of the manual process. This is because during dehydration, the fibers flow on a bamboo splints-aligned wire
(referred to as “bamboo wire” hereafter), which is tilted in order to facilitate good formation. Even in the case of
Enomae, T., Han, Y.-H. and Isogai, A., "Nondestructive determination of fiber orientation distribution of fiber surface by image analysis", Nordic Pulp and Paper Research Journal 21(2): 253-259(2006) .
2
traditional European handmade papers that are manufactured mainly by the sedimentation method, the directionality, as
measured by the ratio of in-plane elastic constants, was reported to be significant though the elastic constants do not
always reflect fiber orientation (Waterhouse and Barrett 1991). Fiber orientation angle and anisotropy, that is, degree of
orientation primarily depend on the motion of the bamboo wire (su), which is characteristic of the manufacturing district,
and the manufacturing process. Therefore, fiber orientation can function as one of the criteria in the classification of
ancient papers. Recently, a considerable quantity of ancient documents and historical papers have been restored using
restoration paper—most of which are Japanese and Korean papers that match the properties of the original paper under
restoration. In addition, fiber orientation is one of the important factors in the selection of appropriate restoration paper
because it influences the shrinkage and curl of the restored paper over time.
Several methods have been developed for the estimation of fiber orientation (Niskanen and Sadowski 1989). These
methods make use of anisotropy in mechanical properties such as tensile strength, elastic modulus and elastic modulus
determined by ultrasound velocity, etc. The elastic modulus, which is calculated from the velocity at which ultrasound
travels in paper and the apparent density of paper, is easily measured; additionally, it is a good indicator of anisotropy.
However, these methods indicate only the anisotropy of the mechanical properties and do not necessarily reveal the fiber
orientation distribution because they are influenced by drying restraints (Waterhouse 1994), etc. Structural properties were
examined using diffraction (Yang et al. 1987, Abe et al. 1991, Fiadeiro et al. 2002) and reflection (Abe et al 1995) of light,
particularly with a laser beam. More precisely, the dielectric permittivity of microwave (Osaki 1987, Habeger and Baum
1987) and X-ray diffraction can also be an appropriate parameter for anisotropy more directly related to fiber orientation,
assuming that cellulose principal chains run, on an average, parallel to the fiber axis.
Some researchers employed the image analysis method for this purpose. Asplund and Norman (2004) investigated the
fiber orientation anisotropy in the jet stream of nylon fibers. The fiber angle β to the machine direction was determined for
each of many distinct fibers in images taken with a digital video camera under illumination of a thin sheet of laser light.
The anisotropy A was defined as ∑ =
n
i i1cos β divided by∑ =
n
i i1sin β . This direct method of fiber angle determination is
appropriate for discrete fibers, but difficult to apply to fibers densely present in paper surfaces. More adequately for paper
surface fibers, Scharcanski and Dodson (1996, 1999) used a local image gradient of all the pixels of the images by
β-radiography and light transmission. They estimated orientation angle in the direction in which the total length of the
projected gradient vectors is maximized. The authors developed a procedure for detecting the local facet orientation. To
make the procedure more simple and quick, Sobel operators were applied as a local filtering operator to determine fiber
orientation distribution in the thickness direction of paper using images of tape-split layers (Erikkila 1998), distinguish
paper surface roughness (Chinga 2003) and relate the surface structure to gloss (Chinga 2004) successfully. Such local
filtering operator-based procedures are excellent to accomplish a quick operation, in particular, prospectively for an on-line
system. However, thick fibers are not weighted depending on their fiber width because only edges are detected sensitively
by those filtering operators. Considering that there is no need for quick operation because the final purpose of
determination of fiber orientation is to analyze a limited number of ancient document papers and there is need for fiber
dimension-weighted orientation to predict mechanical behavior of restoration paper, the filtering operator methods were
not adopted in the present work, but an alternative method of FFT analysis was adopted in spite of the time-consuming
process. Yuhara et al. (1991) determined fiber mass orientation by converting the X-Y coordinates to polar coordinates to
obtain a power spectrum of the mass distribution images of the paper by using soft X-ray transmission. FFT analyses were
Enomae, T., Han, Y.-H. and Isogai, A., "Nondestructive determination of fiber orientation distribution of fiber surface by image analysis", Nordic Pulp and Paper Research Journal 21(2): 253-259(2006) .
3
used for video images or micrographs in textile, nonwoven (Kim Pourdeyhimi 2001, Thorr 1997), and wood fiberboard
(Fujita 1995) fields. For example, Murata and Fujita (1999) introduced the technique of a circular cut and a choice of
frequency range for power accumulation in order to avoid the abnormally large power in optical micrographs of fiberboard
cross sections. However, the binarization process adopted here renders the circular cut unnecessary, and the unnecessary
choice of the frequency range does not limit the fiber dimension to the calculation. In addition, the total power is
accumulated for angles of every 11.25 degrees in his software application, which seems to be a satisfactory angle
resolution for wood fiber boards, but does not for pulp fibers in paper. Therefore, the importance of a standardized and
versatile system for image processing has been emphasized in this work.
The image analysis system developed here is aimed at non-contact analysis and two-sidedness detection techniques,
which were originally developed for the examination of ancient documents and historical papers in combination with a
digital optical microscope. Applications specific to these types of papers will be presented elsewhere, but the determination
procedures were developed to be as general as possible in order to extend them to commercial paper, textile, and any type
of fiber structure.
MATERIALS AND METHODS Paper samples
The samples used were circular laboratory handsheets of 69.7 g/m2 in basis weight prepared from beaten bleached
kraft pulp, fine copier paper of 67.4 g/m2, handmade Japanese paper (Washi) from paper mulberry fibers of 48.9 g/m2, and
wood-containing paper of 51.5 g/m2 including 50 % recycled pulp.
Additionally, restoration paper designed for ancient documents and artwork was used. Two types of Korean paper
(Hanji) manufactured in crafts studios in the traditional papermaking districts Uiryeong and Zangji, Korea, were used. In
general, Hanji is manufactured in such a manner that an extra-fiber slurry flows out in all, particularly left and right,
directions over the edges of a bamboo wire. These samples are referred to as Uiryeong-k and Zangji-k, respectively. The
third sample—Yoshino-j—is a Japanese paper traditionally prepared in Yoshino, Nara, Japan with the addition of rice
powder. In general, the traditional Japanese method entails that excessive on-wire slurry needs to be thrown away over the
far edge of the wire from the craftsman so that residence time for fibers to agglomerate may not be given.
Values of ultrasound-determined anisotropy were calculated. The ultrasound velocity was measured every 30 degrees
with a sheet sonic tester SST-110, Nomura Shoji, Japan, and the ratio of the highest velocity to its crosswise velocity was
defined as the ultrasound anisotropy. The anisotropy was 1.01, 1.63, 1.87, and 2.15 for the laboratory handsheet, copier
paper, Japanese paper, and wood-containing paper, respectively.
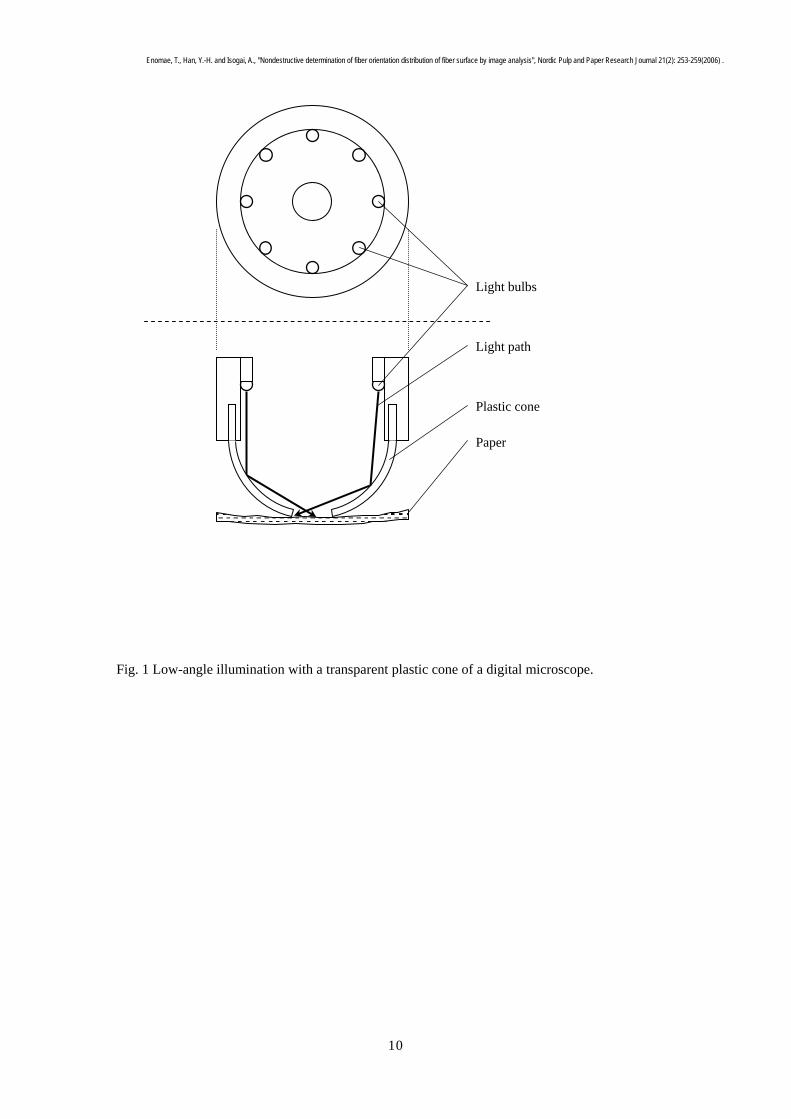
Method of acquiring surface image A digital microscope DG-2, Scholar Co. Ltd., Japan was used to acquire reflected light images of paper surfaces with
a lens of 100 times magnification. Specimens on a scanning stage were illuminated at a low angle with eight light sources
arranged equidistant in a plastic cone to emphasize surface shape, as shown in Figure 1. Five images were captured from
each of the nine evenly spaced locations; these locations were horizontally located in groups of three along the top, middle,
and bottom of a sheet. The individual images were 1792 × 1184 pixels. The central 1024 × 1024 pixels region of these
images corresponding to 1.66 × 1.66 mm2 was subjected to FFT followed by the calculation of fiber orientation
distribution. Micrographs taken with a scanning electron microscope (SEM), S-4000, Hitachi, Japan, were also used as
Enomae, T., Han, Y.-H. and Isogai, A., "Nondestructive determination of fiber orientation distribution of fiber surface by image analysis", Nordic Pulp and Paper Research Journal 21(2): 253-259(2006) .
4
image objects for the FFT image analysis. Specimens from two separate locations within the sheet were cut into areas of 8
× 4 mm2. Micrographs were taken at a magnification of 40x using an image capture device to obtain an image size of 2392
× 1942 pixels that is subsequently reduced to 1024 × 1024 pixels corresponding to 1.27 × 1.27 mm2 for image analysis.
Twelve SEM images of each sample were analyzed.
The restoration paper samples were photographed with the digital microscope at two locations approximately 100 mm
apart within the sheet in order to examine the in-sheet variations of fiber orientation. Five micrographs were taken at each
location and separately subjected to the image analysis. For these images, the bottom side corresponds to the position from
which the craftsman held the wooden frame with a bamboo wire. Therefore, a fiber orientation angle of 0 degrees, for
example, is equivalent to the left-and-right direction from the craftsman’s view.
Conversion of Fourier transform to polar coordinates
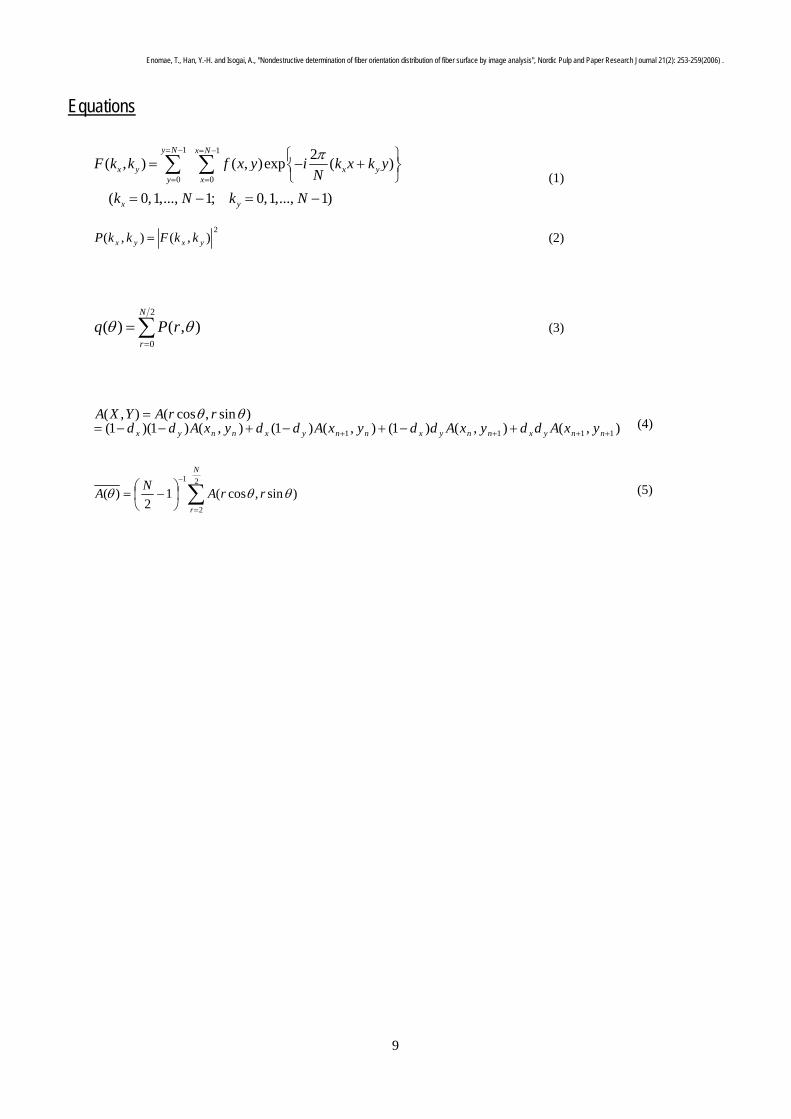
Suppose an image f(x, y), which is composed of N2 pixels, represents a gray level at position (x, y). In this case,
Equation (1) expresses F(kx, ky), namely, the Fourier transform of f(x, y). A power spectrum P(kx, ky) of Fourier Transform
F(kx, ky), as defined in Equation (2), can be converted from X-Y coordinates to polar coordinates with variables r and θ
denoting the radius and polar angle from the kx axis, respectively.
Fiber orientation distribution by Fourier transform Fiber orientation can, in principle, be defined as an angular distribution of a power spectrum as a result of the
integration q(θ) of a power spectrum P(r, θ) in the polar coordinates, as shown in Equation (3).
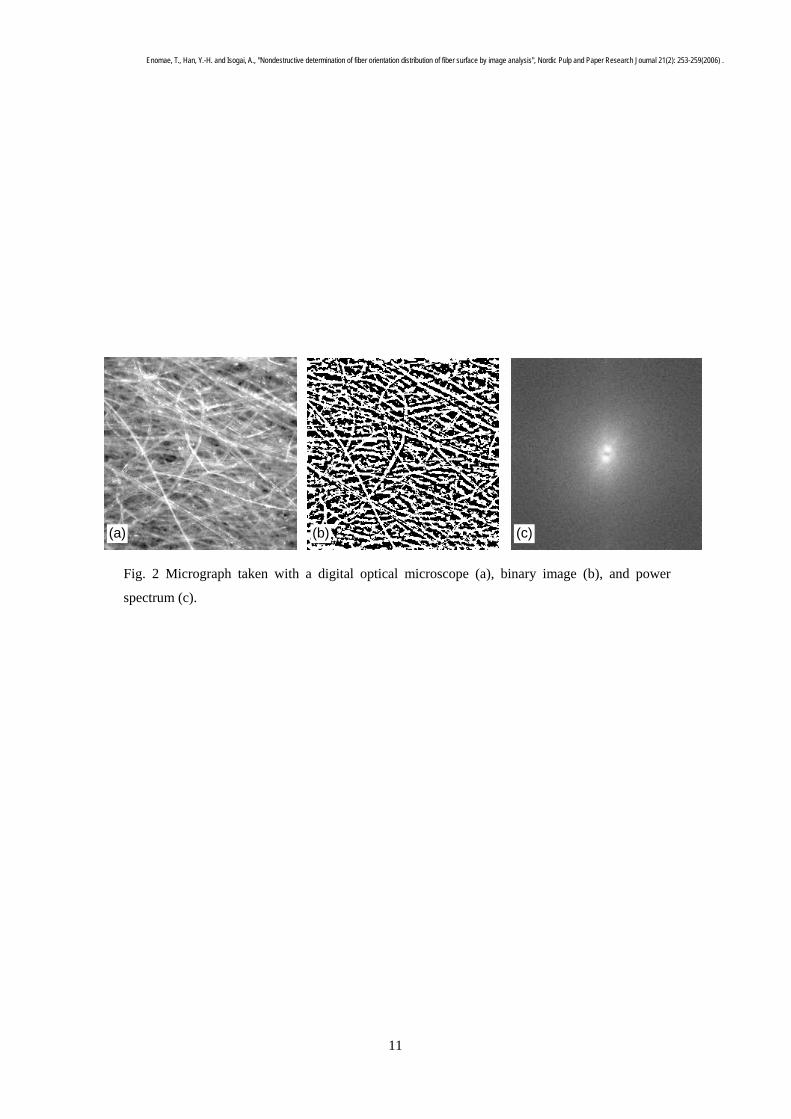
The major direction of the fibers was determined by the following steps. First, a 256 gray level micrograph image was
trimmed to a size of 1024 × 1024 pixels or 512 × 512 pixels (Fig. 2a) for fast Fourier transform (FFT). In the case of a
24-bit color image, the green component image with the maximum luminous efficiency, namely, the one to which the
human eye is most sensitive, extracted from it was regarded as a gray level image for fast calculation. This is despite the
fact that the general conversion from an RGB image to a gray level image requires the use of an equation that takes the red
and blue components into account. However, every 24-bit color image actually looked like a gray level image with even
ratios of RGB components and it was confirmed that the red or blue component images resulted in a similar orientation
angle and anisotropy. Second, the images were binarized using a dynamic threshold method of a simple moving average
(Fig. 2b). In this method, the white (level 255) or black (level 0) level of every pixel is judged by comparing it with its
surrounding pixels in a 41 × 41 pixels block. The fiber width ranges from 10 to 20 pixels in the digital microscope images.
The block size 41 × 41 fits this fiber size. The dynamic threshold method sets the only threshold value without any
smoothing effect. Technically, an efficient routine was adopted to avoid repeated addition of the same gray levels. The
1 1
0 0
2( , ) ( , )exp ( )
( 0,1,..., 1; 0,1,..., 1)
y N x N
x y x yy x
x y
F k k f x y i k x k yN
k N k N
π= − = −
= =
⎧ ⎫= − +⎨ ⎬⎩ ⎭
= − = −
∑ ∑ (1)
2),(),( yxyx kkFkkP = (2)
∑=
=2
0
),()(N
r
rPq θθ (3)
Enomae, T., Han, Y.-H. and Isogai, A., "Nondestructive determination of fiber orientation distribution of fiber surface by image analysis", Nordic Pulp and Paper Research Journal 21(2): 253-259(2006) .
5
moving average method applied in this work can correct the shading of images taken under non-uniform illumination that
would frequently obscure the measurement of true fiber orientation. A two-dimensional Fourier transform inevitably
produces irregular large power only in the kx and ky axes when the gray levels of the left and right edges and the top and
bottom edges of the image differ greatly because Fourier transform assumes infinite repetitions of the image in those
directions. This binarization process efficiently reduces this abnormally large power by assigning an almost identical
number of pixels to black or white. Additionally, this method of binarization can extract the edges of out-of-focus fibers
located below in-focus top fibers even in completely out-of-focus images. The FFT was computed with these binary
images using an application based on Visual Basic 6.0, Microsoft Corp. developed by the authors. Figure 2c is an example
of a power spectrum. The FFT routine was programmed using a well established procedure (Sakai 2003).
In the process of determining fiber orientation by conversion to polar coordinates, the amplitude of the Fourier
coefficient was added in a radial direction from the pole, that is, the center of the image toward the peripheral, and its
mean was determined for each value of angle θ from 0 to less than 180 degrees. However, this apparently simple
conversion was not as easy as we had initially expected because each discrete frequency value of the Fourier coefficients
in the X-Y coordinates cannot be easily converted to the exact corresponding position in the polar coordinates. If one
draws the radius of a given angle from the X-Y (practically kx-ky) coordinate origin, it would pass through only a few
discrete positions. The interpolation was thus applied in the following manner.
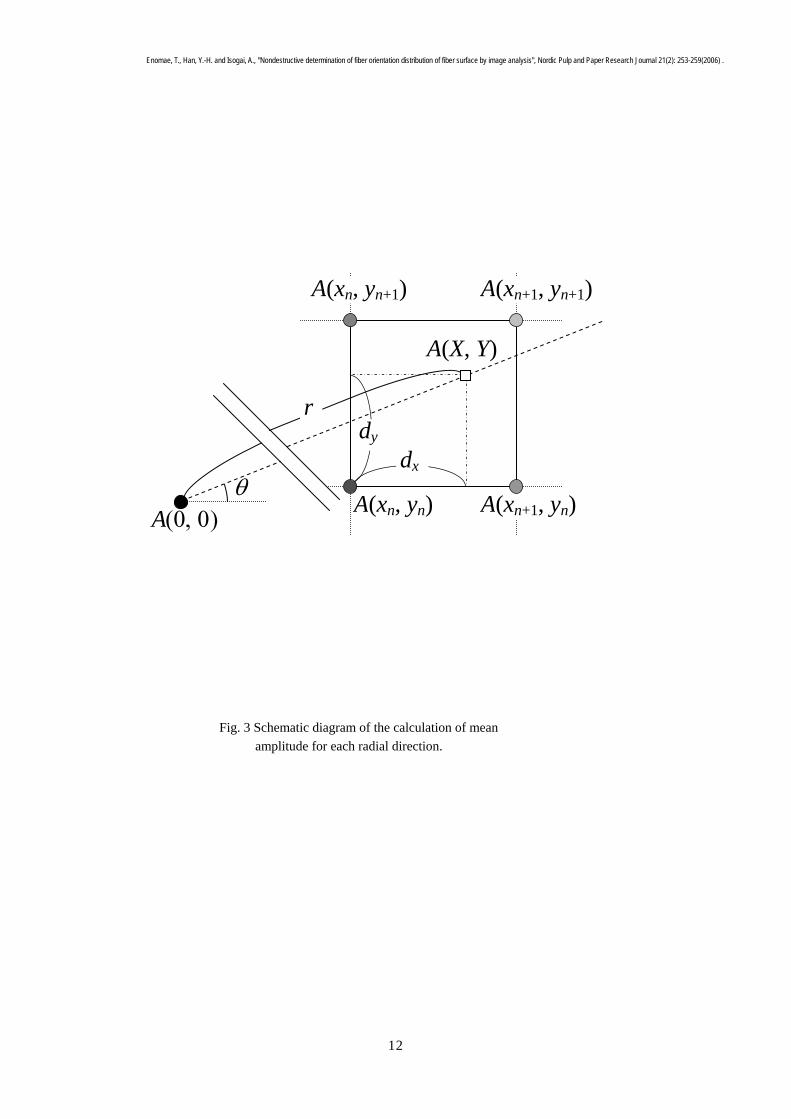
Let us suppose that the amplitude of a Fourier coefficient at a position (X, Y) in the X-Y coordinates of the frequency
space is A(X, Y), as shown in Figure 3. We calculated the amplitude A(X, Y) at angle θ and radius r by using linear
interpolation, as shown in Equation (4). This interpolation technique is essential to the precise determination of the
orientation angle and the anisotropy, as is the most unique point in the present work that have never been introduced to any
methods reported previously. Next, the mean amplitude )(θA in every direction of angle θ was calculated according to
Equation (5), and it was defined as the fiber orientation distribution in this work.
In this equation, the addition of amplitude starts with r = 2 and not with r = 1 or r = 0. This is due to the following
reason: at r = 0, A(0, 0) denotes an average of the gray level of all the pixels in the original micrograph, which does not
represent directionality. Overall brightness, that is, the mean gray level of a micrograph is not related to fiber orientation;
thus, A(0, 0) need not be included. Even at r = 1, A(0, 0) is partially included in the calculation except for θ = 0 or 90
degrees. A(0, 0) is usually considerably larger than the other amplitudes and greatly affects the mean amplitude. In order to
eliminate this adverse effect, the calculation was programmed to start with r = 2. Without this linear interpolation method,
the amplitude of the Fourier coefficients with relatively large values at low frequencies would show a large error.
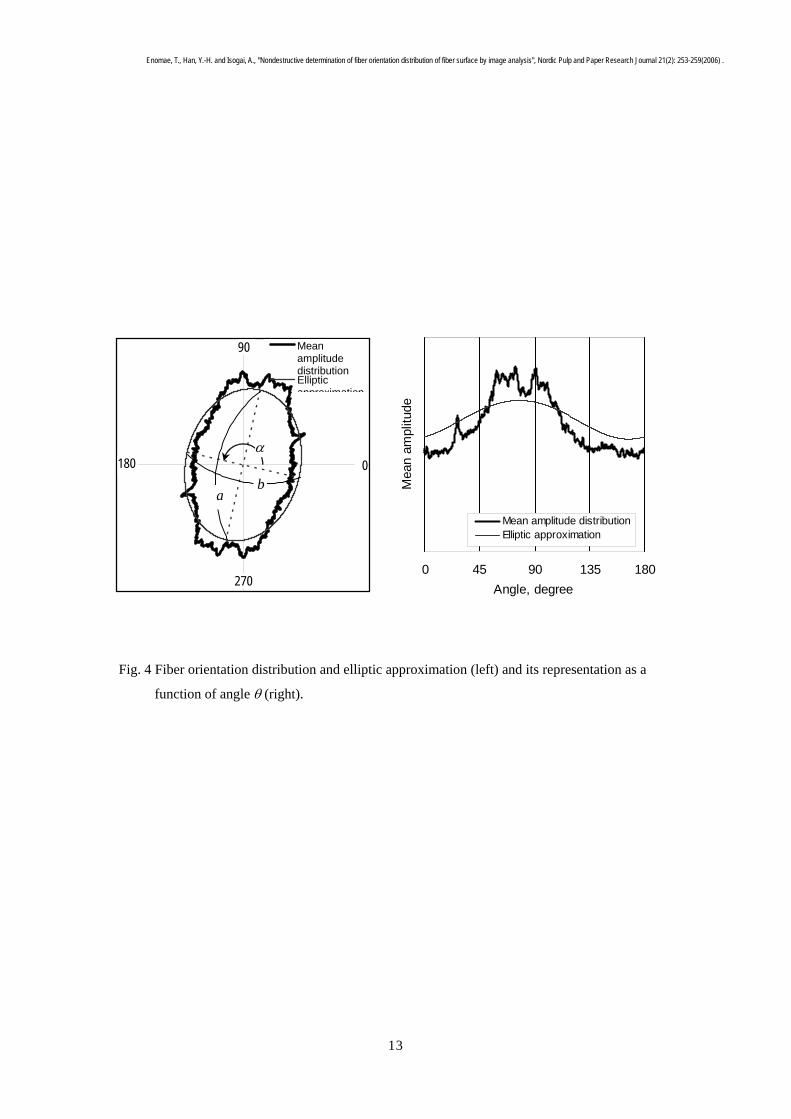
)(θA is a function with some peaks at angle θ perpendicular to the fiber orientation direction. This curve was
approximated to an ellipse. FFT followed by inverse FFT was initially performed with the curve after low-pass filtering in
the frequency domain (with frequencies n > 3 cut off). This process is equivalent to an approximation to a composite
),(),()1(),()1(),()1)(1()sin,cos(),(
1111 ++++ +−+−+−−==
nnyxnnyxnnyxnnyx yxAddyxAddyxAddyxAddrrAYXA θθ
(4)
∑=
−
⎟⎠⎞
⎜⎝⎛ −=
2
2
1
)sin,cos(12
)(
N
r
rrANA θθθ (5)
Enomae, T., Han, Y.-H. and Isogai, A., "Nondestructive determination of fiber orientation distribution of fiber surface by image analysis", Nordic Pulp and Paper Research Journal 21(2): 253-259(2006) .
6
function of two sine curves with two frequencies, n = 1 and n = 2. The maximum value a, value b in the direction
crosswise to a, and the angle α, that is, θ at )(θA = b, were adopted as the lengths of the major axis, minor axis, and the
orientation angle for elliptic parameters, respectively. Figure 4 shows )(θA as a fiber orientation diagram as well as an
ellipse determined by the method mentioned above from the sample image of Figure 2. Highly anisotropic sheets tend to
be estimated to be lower than the actual anisotropy with this approximation procedure. More sophisticated approximation
procedures may lead to a better fitting to an ellipse.
As for the fiber orientation parameters, the angle α represents the fiber orientation angle and the major axis a divided
by the minor axis b represents the anisotropy (See Figure 4). Please note that, in the frequency domain, the direction of the
minor axis means the fiber orientation angle because of the least ups and downs of gray levels in the major orientation
direction. In order to determine the overall fiber orientation from several images for the identical sheet, the mean
amplitude values of all the images were accumulated for each angle and the overall orientation angle and anisotropy were
calculated in the same manner as the procedure for a single image. For determining the deviation among images of the
same type of sample, a standard deviation was calculated from individual values of the orientation angle and anisotropy for
every image.
RESULTS AND DISCUSSION
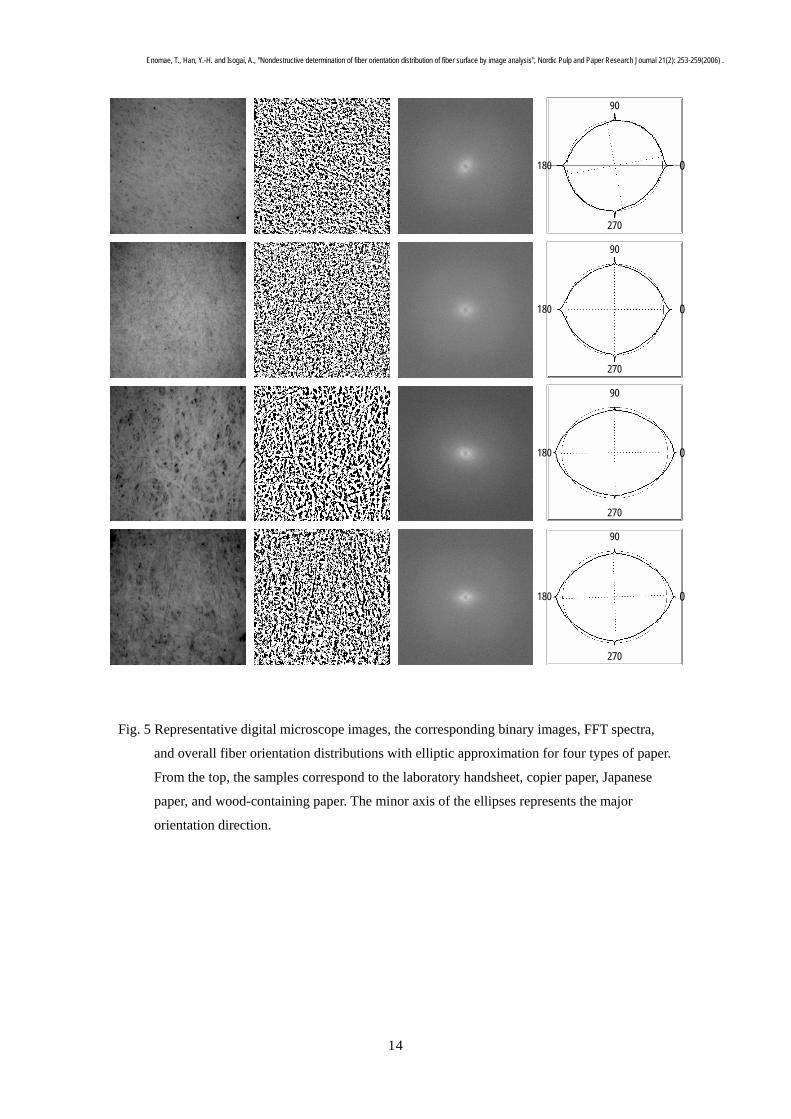
Figure 5, from left to right, shows images of paper surfaces photographed with the digital microscope for the four types of
paper samples, their binary images, their FFT power spectra, and their fiber orientation diagrams with elliptic
approximations. Each sample image in this figure was selected from more than 40 images of each paper sample to best
represent its overall orientation angle and anisotropy. The fiber orientation diagrams present the overall (accumulated)
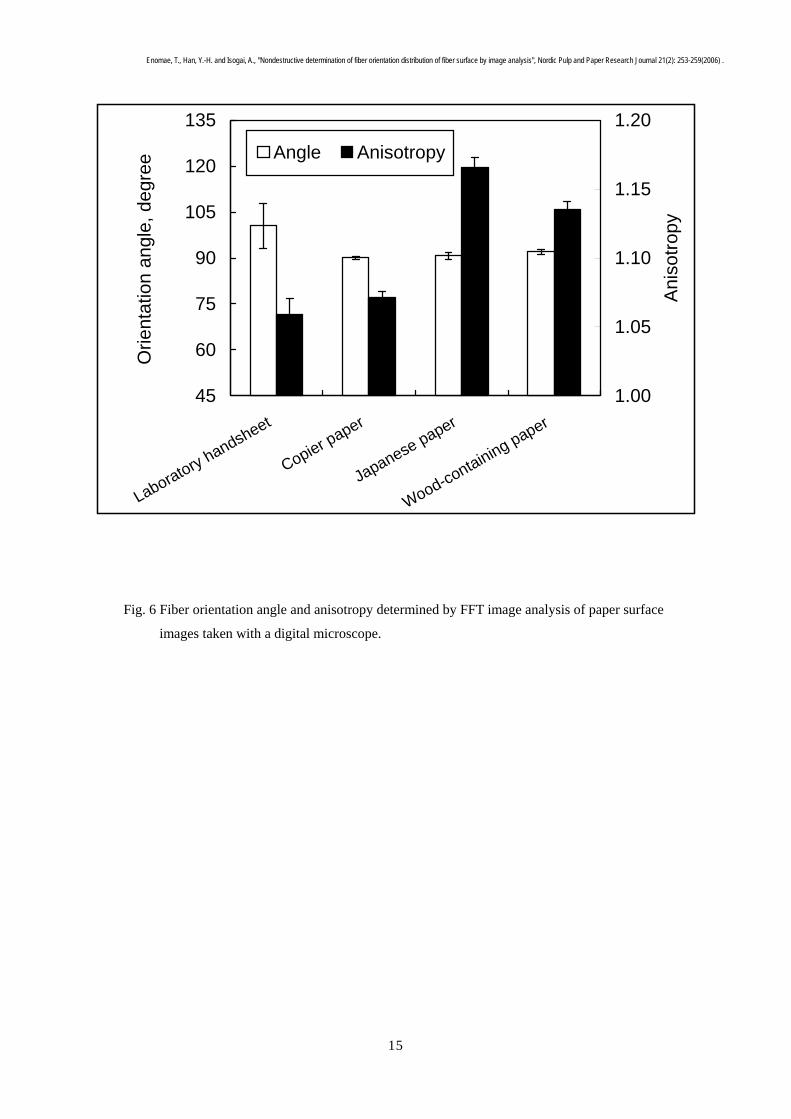
amplitude values. Figure 6 shows the overall values of the fiber orientation angle and anisotropy determined from the
images of the digital microscope. The error bars denote 95% confidence intervals calculated from standard deviations
among images of the same sample. The laboratory handsheet was evaluated to have a certain orientation angle when a
given direction was assumed to be 0 degrees; however, its 95% confidence interval was sufficiently wide to judge it as
almost random. This result agrees with the very low anisotropy. For the digital microscope image, if the anisotropy is less
than 1.05, the orientation is moderate or almost random; however, if it is greater than 1.10, it is clear and intense. The
orientation angles of the other samples are approximately 90 degrees with a confidence interval of 1 degree or narrower.
The copier paper has a relatively low anisotropy, reflecting a characteristic design that reduces wrinkle formation in the hot
roll nip of copiers. Japanese paper shows the highest anisotropy. Although it is commonly believed that handmade paper
does not possess fiber orientation, fiber slurry, in traditional papermaking processes, is made to flow on a bamboo wire by
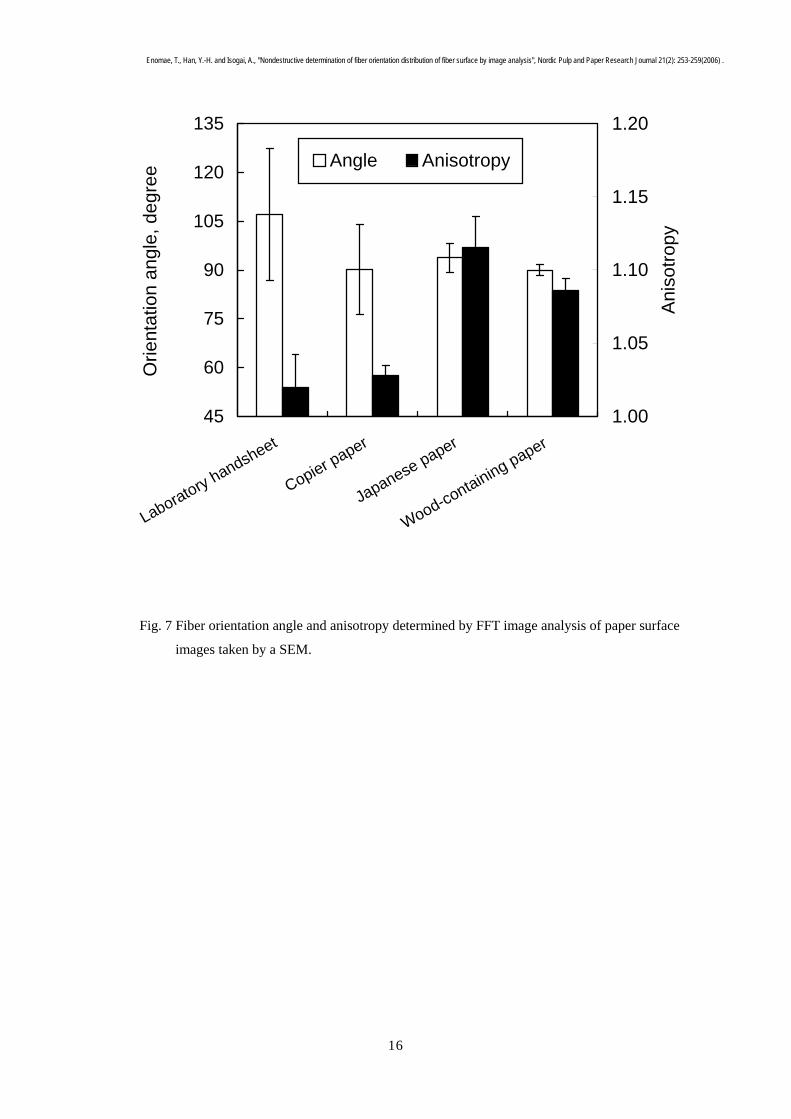
tilting it during dehydration. Wood-containing paper used in commercial printing also has a high anisotropy. Figure 7
shows the fiber orientation for SEM images. The orientation angle and anisotropy were consistent with those of the digital
microscope images in spite of wider confidence intervals; this was because a fewer number (twelve) of images were
subjected to calculation. The anisotropy level is lower on the whole for the SEM images than for the digital microscope
images. Fibers are not extracted properly in the binary SEM images as the fibers body appears mottled in black and white
dots except their clearly white edges. In contrast, the whole fibers appear white in binary digital microscope images
although their edges appear rather indistinct. The mottled appearance of the fibers in the SEM images is considered to
lower the anisotropy. Anyway, the result demonstrated that the image analysis using FFT functions properly in order to
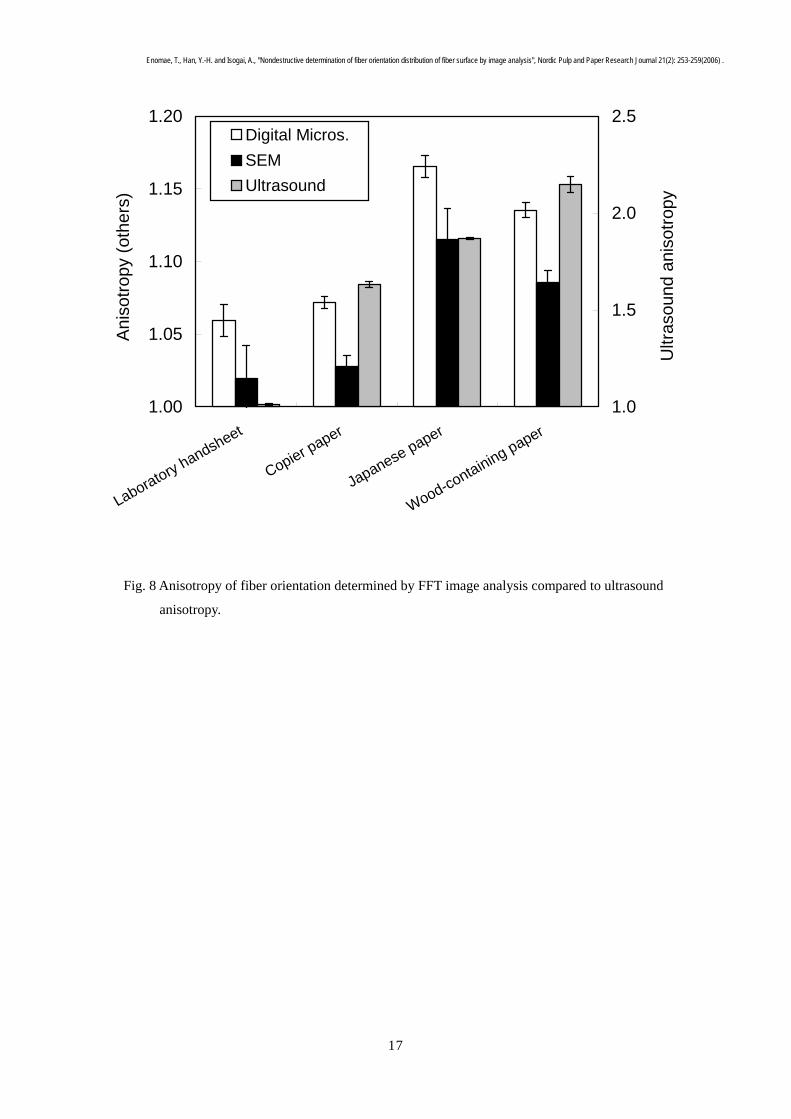
compare papers relatively although the anisotropy level is influenced by the image acquisition method. Figure 8 shows the
Enomae, T., Han, Y.-H. and Isogai, A., "Nondestructive determination of fiber orientation distribution of fiber surface by image analysis", Nordic Pulp and Paper Research Journal 21(2): 253-259(2006) .
7
comparison in anisotropy between the FFT analysis applied to the two types of paper surface images and the ultrasound
method. There is an anisotropy inversion between the Japanese paper and the wood-containing paper. Ultrasound
anisotropy does not represent the two-sidedness because of its wavelength is usually shorter than paper thickness.
Therefore, ultrasound anisotropy reflects the elastic modulus over the whole thickness of the sheet. Japanese paper is often
manufactured with the bamboo wire shaken in the left-and-right direction from the craftsman’s view as well as
back-and-forth direction. The left-and-right shaking is conducted in the middle of the sheet forming process, thus
generating the left-and-right orientation in the inner layer of the sheet despite the dominant back-and-forth orientation in
the outer layers. This is the reason why, for the Japanese paper, the ultrasound anisotropy is lower than the anisotropy
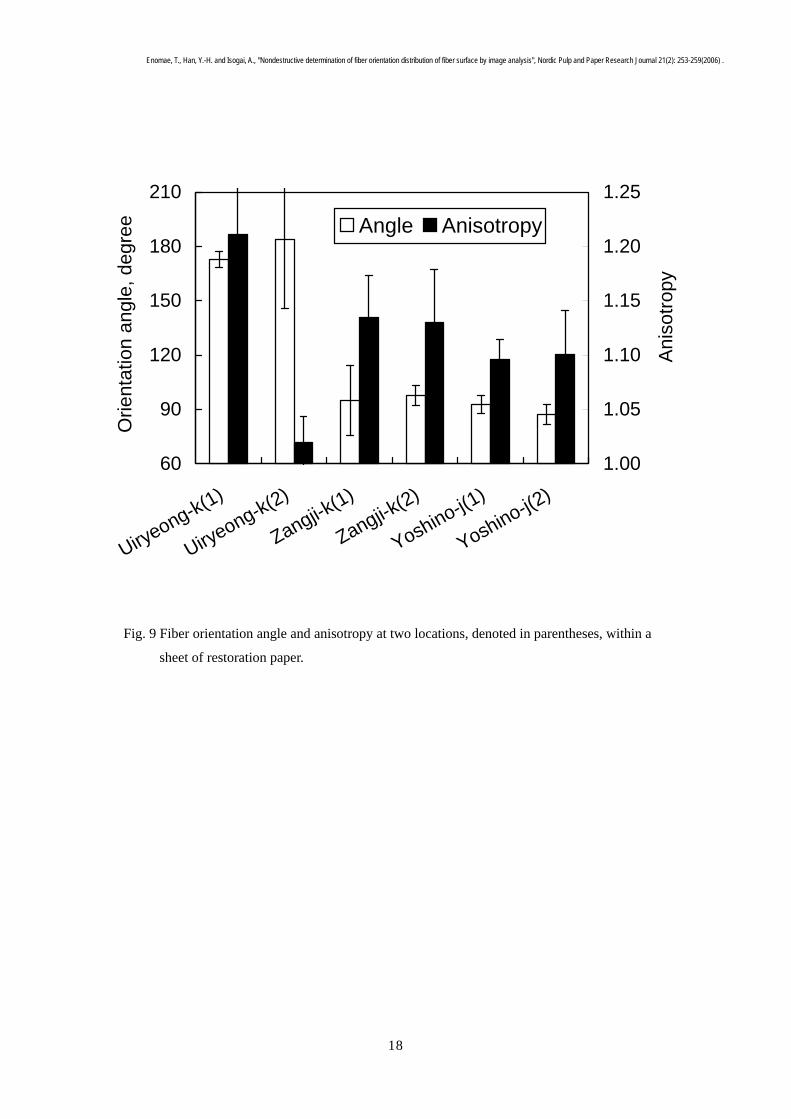
determined from fibers in paper surfaces. Figure 9 shows the fiber orientation result for two locations within a sheet of
each of the restoration papers. Uiryeong-k showed an orientation angle of around 180 degrees (equal to 0 degrees) at both
the locations with a high anisotropy at location 1 but a very low one at location 2. The estimated orientation angle indicates
that the fibers are oriented in the left-and-right direction from the craftsman’s view, corresponding to the motion of the
bamboo wire in the manufacturing process; however, the fiber orientation is likely to have occurred partly because of fiber
aggregation at location 2. Zangji-k and Yoshino-j showed an orientation angle of around 90 degrees, that is, the
back-and-forth direction, with a high anisotropy for the former and a reasonably high one for the latter. Commonly, in the
traditional Japanese method, double-layered sheets are formed. The first thin layer is formed on a bamboo wire by pouring
out a small quantity of fiber slurry from a tub over the near edge of the wire to the craftsman and then allowing the extra
slurry to flow down over the far edge or again toward the near edge and over it. In this thin layer, the fibers tend to be
oriented in the back-and-forth direction. Zangji-k was manufactured in this manner, and the wire-side of the sheet was
photographed. Yoshino-j is characteristic of Japanese paper and is considered to show high anisotropy in the
back-and-forth direction. However, the anisotropy was rather low presumably because the addition of a large quantity of
rice powder particles to the slurry disturbed fiber orientation in the slurry stream on the tilted bamboo wire.
CONCLUSION
Image analysis using FFT was demonstrated to be applicable in determining the fiber orientation angle and anisotropy. The
binarization process of the micrograph images of the paper surface and precise calculations of the average Fourier
coefficients as an angular distribution by linear interpolation were developed in this research. This method was applied to
digital optical micrographs and scanning electron micrographs of paper. A laboratory handsheet showed a very low
anisotropy, indicating random orientation. Copier paper showed a low anisotropy corresponding to the manufacturing
conditions customized for its use. Japanese paper showed a higher anisotropy than wood-containing paper. Korean and
Japanese papers manufactured using traditional methods and used for restoring ancient documents showed their own
characteristic orientation behavior in accordance with the motion of the bamboo wire. The original objective of examining
the fiber orientations of paper surfaces in a nondestructive manner was achieved. This method is expected to be utilized for
the nondestructive testing of ancient and historical papers to determine the extent of fiber orientation and the methods of
papermaking involved.
ACKNOWLEDGEMENT
This research was partially supported by Fukutake Foundation for Promotion of Culture (2003).
Enomae, T., Han, Y.-H. and Isogai, A., "Nondestructive determination of fiber orientation distribution of fiber surface by image analysis", Nordic Pulp and Paper Research Journal 21(2): 253-259(2006) .
8
LITERATURE
Abe, Y. and Sakamoto, A. (1991): Measurement of the Z-direction profile of fiber orientation in paper by laser diffraction, Japan Tappi J. 45(6), 694. Abe Y., Todoroki, H., Takeuti, N. and Sakamoto, A. (1995): Measurement method of fiber orientation on paper surface, Japan Tappi J. 49(5), 849. Asplund, G. and Norman, B. (2004): Fiber orientation anisotropy profile over the thickness of a headbox jet, J. Pulp Paper Sci., 30(8): 217 Chinga, G., Gregersen O., and Dougherty B. (2003): Paper surface characterization by laser profilometry and image analysis, Microscopy and Analysis (UK), 96, 21 Chinga, G. (2004): Detailed Characterization of Paper surface structure for gloss assessment, J. Pulp Paper Sci., 30(8): 222 Erikkila, A.-L., Pakarinen, P. and Odell, M. (1998), Sheet forming studies using layered orientation analysis, J. Pulp Paper Canada 99:1, 81 Fiadeiro, P.T., Pereira, M.J.T., Jesus, M.E.P. and Silvy, J.J. (2002): The surface measurement of fibre orientation anisotropy and misalignment angle by laser diffraction, J. Pulp Paper Sci. 28:10, 341. Fujita, M., Kajita, H., Maekawa, T. and Saiki, H. (1995): Evaluation of particle orientation by the Fourier transform image analysis, J. Soc. Mat. Sci., Japan 44:498, 267. Habeger, C. C and Baum, G. A. (1987): The use of microwave attenuation as a measure of fiber orientation anisotropy, Tappi 70(2), 109. Kim, H.S. and Pourdeyhimi, B. (2001): The role of structure on mechanical properties of nonwoven fabrics, International Nonwovens J., Summer, 32. Murata, K. and Fujita, M. (1999): FFT-estimation of fiber orientation on wood fiberboard, J. Soc. Mat. Sci., Japan 48:1, 77. Niskanen, K. Kajanto, I. and Pakarinen, P. (2001): In "Paper Physics", Chapter 1, "Paper structure", Vol 16 of the Papermaking Sci. and Tech. Series, TAPPI press, Atlanta. Niskanen, K.J. and Sadowski, J.W. (1989): Evaluation of some fibre orientation measurements, J. Pulp Paper Sci. 15(6): 220. Osaki, S. (1987): Microwaves quickly determine the fiber orientation of paper, Tappi 70(2), 105. Sakai, K. (2003): In “Introduction to digital image processing”, CQ publishing, Tokyo, p.161. Scharcanski, J. and Dodson, C.T.J. (1999): Local spatial anisotropy and its variability, J. Pulp Paper Sci. 25:11, 393-397. Scharcanski, J. and Dodson, C.T.J. (1996): Texture image analysis for paper anisotropy and its variability, Appita 49(2), 100. Thorr, F., Adolphe, D. and Drean, J. Y. (1997): Study of nonwoven mass reorganization under tensile stress thanks to a new optical sensor and image analysis, Sensors and Actuators, A62, 565. Waterhouse J. F. (1994): Ultrasonic testing of paper and paperboard: principles and applications, Tappi J. 77(1): 120. Waterhouse J. F. and Barrett, T. D. (1991): The aging characteristics of European handmade papers: 1400-1800, Tappi J. 74(2): 207 Yang, C.F., Crosby, C.M., Eusufzai, A.R.K. and Mark R.E. (1987): Determination of paper sheet fiber orientation distributions by a laser optical diffraction method, J. Applied Polymer Sci. 34(3), 1145. Yuhara, T., Hasuike, M. and Murakami, K. (1991): "Fibre orientation measurement with the two-dimensional power spectrum of a high-resolution soft X-ray image", J. Pulp Paper Sci., 17:4, J110.
Enomae, T., Han, Y.-H. and Isogai, A., "Nondestructive determination of fiber orientation distribution of fiber surface by image analysis", Nordic Pulp and Paper Research Journal 21(2): 253-259(2006) .
9
Equations
1 1
0 0
2( , ) ( , )exp ( )
( 0,1,..., 1; 0,1,..., 1)
y N x N
x y x yy x
x y
F k k f x y i k x k yN
k N k N
π= − = −
= =
⎧ ⎫= − +⎨ ⎬⎩ ⎭
= − = −
∑ ∑ (1)
2),(),( yxyx kkFkkP = (2)
∑=
=2
0
),()(N
r
rPq θθ (3)
),(),()1(),()1(),()1)(1()sin,cos(),(
1111 ++++ +−+−+−−==
nnyxnnyxnnyxnnyx yxAddyxAddyxAddyxAddrrAYXA θθ
(4)
∑=
−
⎟⎠⎞
⎜⎝⎛ −=
2
2
1
)sin,cos(12
)(
N
r
rrANA θθθ (5)
Enomae, T., Han, Y.-H. and Isogai, A., "Nondestructive determination of fiber orientation distribution of fiber surface by image analysis", Nordic Pulp and Paper Research Journal 21(2): 253-259(2006) .
10
Light bulbs
Light path
Plastic cone
Paper
Fig. 1 Low-angle illumination with a transparent plastic cone of a digital microscope.
Enomae, T., Han, Y.-H. and Isogai, A., "Nondestructive determination of fiber orientation distribution of fiber surface by image analysis", Nordic Pulp and Paper Research Journal 21(2): 253-259(2006) .
11
Fig. 2 Micrograph taken with a digital optical microscope (a), binary image (b), and power
spectrum (c).
(a) (b) (c)
Enomae, T., Han, Y.-H. and Isogai, A., "Nondestructive determination of fiber orientation distribution of fiber surface by image analysis", Nordic Pulp and Paper Research Journal 21(2): 253-259(2006) .
12
θ A(0, 0) A(xn, yn)
r
A(xn+1, yn)
A(xn+1, yn+1) A(xn, yn+1)
dy
dx
A(X, Y)
Fig. 3 Schematic diagram of the calculation of mean amplitude for each radial direction.
Enomae, T., Han, Y.-H. and Isogai, A., "Nondestructive determination of fiber orientation distribution of fiber surface by image analysis", Nordic Pulp and Paper Research Journal 21(2): 253-259(2006) .
13
0 45 90 135 180Angle, degree
Mea
n am
plitu
de
Mean amplitude distributionElliptic approximation
MeanamplitudedistributionEllipticapproximation
α
ba
90
180 0
270
Fig. 4 Fiber orientation distribution and elliptic approximation (left) and its representation as a
function of angle θ (right).
Enomae, T., Han, Y.-H. and Isogai, A., "Nondestructive determination of fiber orientation distribution of fiber surface by image analysis", Nordic Pulp and Paper Research Journal 21(2): 253-259(2006) .
14
Fig. 5 Representative digital microscope images, the corresponding binary images, FFT spectra,
and overall fiber orientation distributions with elliptic approximation for four types of paper.
From the top, the samples correspond to the laboratory handsheet, copier paper, Japanese
paper, and wood-containing paper. The minor axis of the ellipses represents the major
orientation direction.
0
90
180
270
0
90
180
270
0
90
180
270
0
90
180
270
Enomae, T., Han, Y.-H. and Isogai, A., "Nondestructive determination of fiber orientation distribution of fiber surface by image analysis", Nordic Pulp and Paper Research Journal 21(2): 253-259(2006) .
15
45
60
75
90
105
120
135
Laboratory handsheet
Copier paper
Japanese paper
Wood-containing paper
Orie
ntat
ion
angl
e, d
egre
e
1.00
1.05
1.10
1.15
1.20
Ani
sotro
py
Angle Anisotropy
Fig. 6 Fiber orientation angle and anisotropy determined by FFT image analysis of paper surface
images taken with a digital microscope.
Enomae, T., Han, Y.-H. and Isogai, A., "Nondestructive determination of fiber orientation distribution of fiber surface by image analysis", Nordic Pulp and Paper Research Journal 21(2): 253-259(2006) .
16
45
60
75
90
105
120
135
Laboratory handsheet
Copier paper
Japanese paper
Wood-containing paper
Orie
ntat
ion
angl
e, d
egre
e
1.00
1.05
1.10
1.15
1.20
Ani
sotro
py
Angle Anisotropy
Fig. 7 Fiber orientation angle and anisotropy determined by FFT image analysis of paper surface
images taken by a SEM.
Enomae, T., Han, Y.-H. and Isogai, A., "Nondestructive determination of fiber orientation distribution of fiber surface by image analysis", Nordic Pulp and Paper Research Journal 21(2): 253-259(2006) .
17
1.00
1.05
1.10
1.15
1.20
Laboratory handsheet
Copier paper
Japanese paper
Wood-containing paper
Ani
sotro
py (o
ther
s)
1.0
1.5
2.0
2.5
Ultr
asou
nd a
niso
tropy
Digital Micros.SEMUltrasound
Fig. 8 Anisotropy of fiber orientation determined by FFT image analysis compared to ultrasound
anisotropy.
Enomae, T., Han, Y.-H. and Isogai, A., "Nondestructive determination of fiber orientation distribution of fiber surface by image analysis", Nordic Pulp and Paper Research Journal 21(2): 253-259(2006) .
18
60
90
120
150
180
210
Uiryeong-k(1)
Uiryeong-k(2)
Zangji-k(1)
Zangji-k(2)
Yoshino-j(1)
Yoshino-j(2)
Orie
ntat
ion
angl
e, d
egre
e
1.00
1.05
1.10
1.15
1.20
1.25
Ani
sotro
py
Angle Anisotropy
Fig. 9 Fiber orientation angle and anisotropy at two locations, denoted in parentheses, within a
sheet of restoration paper.