Embed Size (px)
Citation preview
Research ArticleNoninterest Income and Performance of CommercialBanking in China
Limei Sun1 Siqin Wu1 Zili Zhu2 and Alec Stephenson2
1School of Economics and Management Harbin Engineering University Heilongjiang China2Data 61 CSIRO Melbourne VIC Australia
Correspondence should be addressed to Limei Sun slm0451163com
Received 27 September 2016 Revised 3 November 2016 Accepted 21 November 2016 Published 15 February 2017
Academic Editor Xiaofeng Xu
Copyright copy 2017 Limei Sun et al This is an open access article distributed under the Creative Commons Attribution Licensewhich permits unrestricted use distribution and reproduction in any medium provided the original work is properly cited
Noninterest income is what most Chinese banks are striving for in recent years because of the vigorous competition amongcommercial banks due to the increasingly openmarket and tough regulation from the central bank of China But the problem is thereal effect of noninterest income on profit and risks A panel thresholdmodel is usedwith balanced panel dataset of 16 listed Chinesecommercial banks for the period of 2007 to 2013 to investigate the relationship between noninterest income and performanceThefindings show two main conclusions (1) the existence of two thresholds shows that there is nonlinear relationship (2) there isa general negative correlation between the noninterest income ratio and performance of commercial banks Furthermore whenthe noninterest income ratio is higher than the two thresholds the negative correlation decreases Implications of the paper arethat the ratio should be controlled in a range or noninterest income will not positively affect the performance and a high level ofperformance can be gained only by raising the ratio to a certain level
1 Introduction
With the significant development of financial liberalizationand globalization banks choosing to expand their noninter-est income activities are confronted with increasingly severeinterbank competition so as to grow realize efficiency andreduce idiosyncratic risk [1] The Chinese banking indus-try has just started its focus on diversification of businessin recent years The noninterest income business has hadcontinuous development But whether noninterest incomecan help enhance bank performance has always been con-troversial Some previous literature pays a lot of attentionto the relationship between noninterest based activities andthe performance of banks in countries outside of ChinaHowever similar attention has not been given much tothe Chinese case This paper investigates the relationshipbetween noninterest income ratio and the performance ofChinese commercial banksrsquo and the influence of noninterestincome ratio on its performance The remainder of thepaper is structured as follows In Section 2 we describerecent academic developments in this field In Section 3 wereview mechanism of the noninterest income which affects
the performance In Section 4 the dataset and the empiricalmodel are described In Section 5we present and interpret theempirical results Finally policy implication of the paper hasbeen drawn in Section 6
2 Literature Review
Researchers from USA UK India Ghana and so on haveexplored relationships between noninterest income and busi-ness performance [2ndash11] (Abeyratna Gunasekarage et al2014)There are three different schools of thought on optimalbank scope One set of arguments hold that restrictingbanking scope to the traditional activities reduces likelihoodof failure related to risk businesses while the second setargue that noninterest income enhances bank profitabilityand reduces risk the third set holds that impact of noninterestincome on bank performance is uncertain
Some researchers deem that noninterest income businesscan improve the total income since banks can expand thesource of income by diversifying income Eisemann [12]stated that the noninterest income business was composed
HindawiScientific ProgrammingVolume 2017 Article ID 4803840 8 pageshttpsdoiorg10115520174803840
2 Scientific Programming
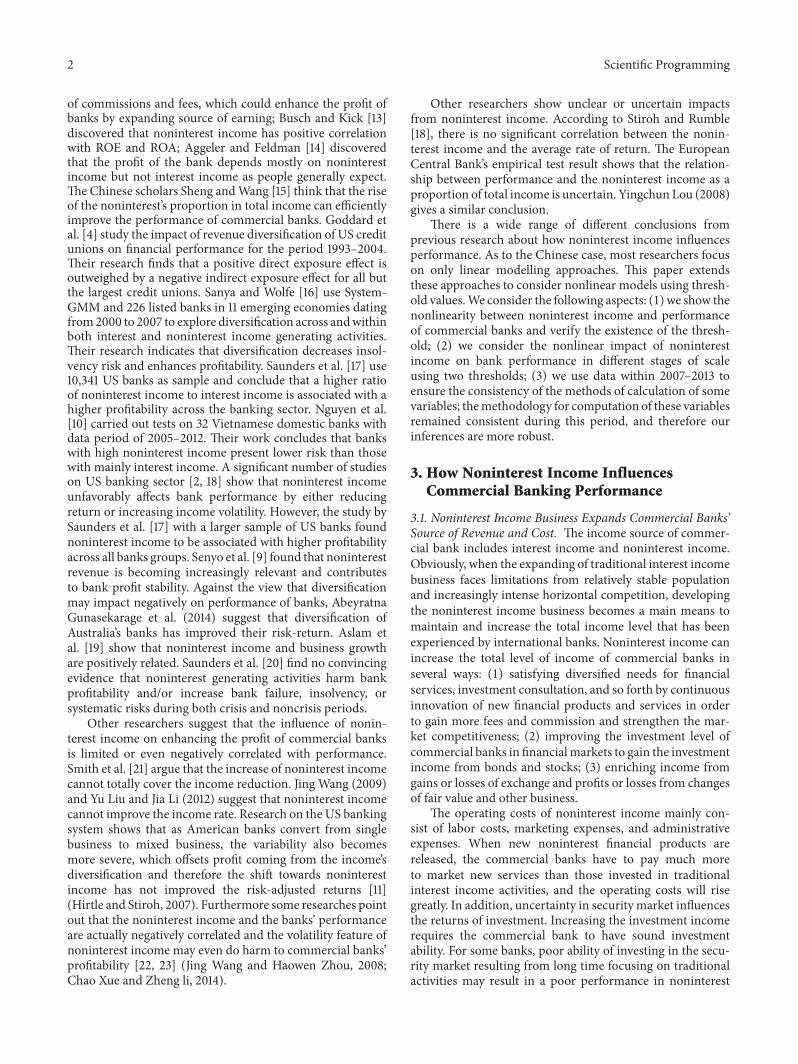
of commissions and fees which could enhance the profit ofbanks by expanding source of earning Busch and Kick [13]discovered that noninterest income has positive correlationwith ROE and ROA Aggeler and Feldman [14] discoveredthat the profit of the bank depends mostly on noninterestincome but not interest income as people generally expectThe Chinese scholars Sheng andWang [15] think that the riseof the noninterestrsquos proportion in total income can efficientlyimprove the performance of commercial banks Goddard etal [4] study the impact of revenue diversification of US creditunions on financial performance for the period 1993ndash2004Their research finds that a positive direct exposure effect isoutweighed by a negative indirect exposure effect for all butthe largest credit unions Sanya and Wolfe [16] use System-GMM and 226 listed banks in 11 emerging economies datingfrom2000 to 2007 to explore diversification across andwithinboth interest and noninterest income generating activitiesTheir research indicates that diversification decreases insol-vency risk and enhances profitability Saunders et al [17] use10341 US banks as sample and conclude that a higher ratioof noninterest income to interest income is associated with ahigher profitability across the banking sector Nguyen et al[10] carried out tests on 32 Vietnamese domestic banks withdata period of 2005ndash2012 Their work concludes that bankswith high noninterest income present lower risk than thosewith mainly interest income A significant number of studieson US banking sector [2 18] show that noninterest incomeunfavorably affects bank performance by either reducingreturn or increasing income volatility However the study bySaunders et al [17] with a larger sample of US banks foundnoninterest income to be associated with higher profitabilityacross all banks groups Senyo et al [9] found that noninterestrevenue is becoming increasingly relevant and contributesto bank profit stability Against the view that diversificationmay impact negatively on performance of banks AbeyratnaGunasekarage et al (2014) suggest that diversification ofAustraliarsquos banks has improved their risk-return Aslam etal [19] show that noninterest income and business growthare positively related Saunders et al [20] find no convincingevidence that noninterest generating activities harm bankprofitability andor increase bank failure insolvency orsystematic risks during both crisis and noncrisis periods
Other researchers suggest that the influence of nonin-terest income on enhancing the profit of commercial banksis limited or even negatively correlated with performanceSmith et al [21] argue that the increase of noninterest incomecannot totally cover the income reduction Jing Wang (2009)and Yu Liu and Jia Li (2012) suggest that noninterest incomecannot improve the income rate Research on the US bankingsystem shows that as American banks convert from singlebusiness to mixed business the variability also becomesmore severe which offsets profit coming from the incomersquosdiversification and therefore the shift towards noninterestincome has not improved the risk-adjusted returns [11](Hirtle and Stiroh 2007) Furthermore some researches pointout that the noninterest income and the banksrsquo performanceare actually negatively correlated and the volatility feature ofnoninterest income may even do harm to commercial banksrsquoprofitability [22 23] (Jing Wang and Haowen Zhou 2008Chao Xue and Zheng li 2014)
Other researchers show unclear or uncertain impactsfrom noninterest income According to Stiroh and Rumble[18] there is no significant correlation between the nonin-terest income and the average rate of return The EuropeanCentral Bankrsquos empirical test result shows that the relation-ship between performance and the noninterest income as aproportion of total income is uncertain Yingchun Lou (2008)gives a similar conclusion
There is a wide range of different conclusions fromprevious research about how noninterest income influencesperformance As to the Chinese case most researchers focuson only linear modelling approaches This paper extendsthese approaches to consider nonlinear models using thresh-old valuesWe consider the following aspects (1) we show thenonlinearity between noninterest income and performanceof commercial banks and verify the existence of the thresh-old (2) we consider the nonlinear impact of noninterestincome on bank performance in different stages of scaleusing two thresholds (3) we use data within 2007ndash2013 toensure the consistency of the methods of calculation of somevariables themethodology for computation of these variablesremained consistent during this period and therefore ourinferences are more robust
3 How Noninterest Income InfluencesCommercial Banking Performance
31 Noninterest Income Business Expands Commercial BanksrsquoSource of Revenue and Cost The income source of commer-cial bank includes interest income and noninterest incomeObviously when the expanding of traditional interest incomebusiness faces limitations from relatively stable populationand increasingly intense horizontal competition developingthe noninterest income business becomes a main means tomaintain and increase the total income level that has beenexperienced by international banks Noninterest income canincrease the total level of income of commercial banks inseveral ways (1) satisfying diversified needs for financialservices investment consultation and so forth by continuousinnovation of new financial products and services in orderto gain more fees and commission and strengthen the mar-ket competitiveness (2) improving the investment level ofcommercial banks in financialmarkets to gain the investmentincome from bonds and stocks (3) enriching income fromgains or losses of exchange and profits or losses from changesof fair value and other business
The operating costs of noninterest income mainly con-sist of labor costs marketing expenses and administrativeexpenses When new noninterest financial products arereleased the commercial banks have to pay much moreto market new services than those invested in traditionalinterest income activities and the operating costs will risegreatly In addition uncertainty in security market influencesthe returns of investment Increasing the investment incomerequires the commercial bank to have sound investmentability For some banks poor ability of investing in the secu-rity market resulting from long time focusing on traditionalactivities may result in a poor performance in noninterest
Scientific Programming 3
income business The loss in noninterest income activitieswill lead to loss in total revenue
32 Noninterest Income Increases Volatility of Bank EarningsVolatility brought by noninterest income of commercialbanks has been highlighted in a previous literature Someexplain the impact of noninterest income on bank perfor-mancewith portfolio theory consistentwith portfolio theoryan increased reliance on noninterest income is associatedwith higher volatility of returns Similar conclusions havebeen drawn by Stiroh and Rumble [18] Calmes and Liu[24] Jaffar et al [7] and Senyo et al [9] who argue that thebanksrsquo greater reliance on noninterest income is associatedwith higher systemic riskThe results of these studies indicatenoninterest income is much more volatile than interestincome from a global viewpoint and for each individual bankDeyoung and Roland [2] proposed three reasons to explainvolatility induced by noninterest income on bank earningsFirstly switching costs of noninterest income are much lowerthan that of interest income because most fee-based activitiesare not relationship based which contributes to the volatilitySecondly noninterest income activities may require greateroperating leverage than interest income activities because themain input needed to produce more fee-based products istypically fixed or quasi-fixed other than for interest expensesneeded to produce more loans Thirdly noninterest incomeactivities likely employ greater financial leverage than lendingactivities because most noninterest income activities requireholding little or no fixed assets and little or no regulatorycapital All these factors lead to volatility from noninterestincome increasing risk for commercial banks
33 Noninterest Income Increases Operating Risk Firstly theexpansion of noninterest income requires more investmentin labor and facility which leads to increasing operatingcosts Thus the larger operating leverage may induce largeroperating risk To acquire revenue from noninterest incomecommercial banks have to invest much in both labor andfacilities These investments lead to high fixed costs Whenindustry profitability drops with competition among banksand the costs remain stable the profit level drops sharplyHence in this case high operating leverage will increase theoperating risk
Secondly noninterest business increases commercialbankrsquos operating risk while innovating new services and newproducts During the process of developing noninterest busi-ness it is necessary to create new services and new productsalong with the changes of costumersrsquo needs But with morekinds of business development the management difficultywill increase as well as management cost For example theasset securitization products released by commercial bankscan promote the circulation of asset improve the liquidityand also increase the risk of price fluctuation In this casehigh quality administration is required in commercial banks
Finally noninterest income business requires highermanagement ability but Chinese banks may lack this exper-tise Noninterest income will increase the existing risk ofcommercial banks For example if a commercial bank lacksthe experience in the investment field when developing
noninterest business it will meet high investment riskHowever at present the noninterest products of Chinesecommercial banks mostly derive from traditional businessespecially when client resources are depending on the long-term building up of traditional business
Noninterest income can lead to commercial banksrsquo overallincome increasing in the initial stage of development But asthe scale expands themarginal cost of developing noninterestincome is rising and the marginal income of noninterestincome is decreasing so the rising operating costs willdecrease the net income Huang and Chen [25] find thatthe banks with either relatively higher or lower ratios ofnoninterest incomes to operating incomes perform morecost-efficiently during the examination periods Anotherview [26] holds that if the proportion of commission intotal income is much too high the total profit will decreaseNoninterest incomersquos influence on the commercial bankrsquos per-formance may have constraints and the interaction betweennoninterest income and interest income must be managed
4 Methodology
41 Threshold Effect Model To account for the potentialvariability in the relationship between noninterest incomeandperformance across different commercial banks we allowfor a turning point or a ldquothresholdrdquo within our model Thethreshold effect refers to such a state namely when aneconomic parameter reaches a specific value it will leadto another model parameterrsquos alteration The specific valueis called threshold value The regression model based onthis effect is called the threshold regression model If themodelled data contains multiple individuals and multipleyears the model is a panel threshold model We use themodel of Hansen [27] Compared with the former thresholdeffect regressionmodel the Hansen [27] threshold regressionmodel has two advantages firstly this threshold regressionmodel does not need to separate the endogenous variablesand the exogenous variables so the threshold and the esti-mated parameters depend only on the endogeneity secondlythe threshold model theory offers an asymptotic distributiontheory to determine the confidence interval of the parametersand to estimate the thresholdrsquos statistical significance
Based on the hypothesis above this paper applies thepanel threshold model of Hansen [27] to study the rela-tionship between the bankrsquos performance and noninterestincome The specific single threshold model is as follows
119910119894119905 = 119906119894 + 11990910158401198941199051205731 + 119890119894119905 119902119894119905 le 120574119910119894119905 = 119906119894 + 11990910158401198941199051205732 + 119890119894119905 119902119894119905 gt 120574
(1)
Among these 119894 denotes company and 119905 denotes time 119910119894119905is the response variable 119909119894119905 is 119901times1 order explanatory variablevector and 119902119894119905 is the threshold variable We use return onequity as the response variable performance measure andnoninterest income as a proportion of total operating incomeas the main explanatory variable The remaining explanatoryvariables are described in Section 43
We also take the noninterest income proportion for thethreshold variable The role of the threshold variable is to
4 Scientific Programming
Table 1 The explanation of the model variables
Category Variable Calculation of the variable ExplanationExplained variable Performance ROE Net profitnet asset The performance of profitability
Explanatory variable Noninterestincome NIR Noninterest incometotal operating
incomeHow much and how well bankscarry out noninterest business
Control variable
Bad loan ratio (BAD) Nonperforming loansbalance of loans The credit assetsrsquo securitycondition
Capital adequacy ratio (CAR) Capitalrisk-weighted asset How well the risk control abilityis
Cost ratio (COST) Operating costoperating income Ability of control of the cost
divide the samples into different groups and the turning pointof the regime changing The different regimes in the modelcan be denoted into two states in one state the thresholdvariable is bigger than the specific threshold in the other thethreshold variable is smaller than the specific threshold
Define dummy variable 119889119894(120574) = (119902119894 le 120574) (sdot) is theindicator function which means when 119902119894 le 120574 (sdot) = 1 or(sdot) = 0 This way the equations above can be expressed by asingle equation
119910119894119905 = 119906119894 + 1199091015840119894119905120573 + 1199091015840119894119905119889119894119905 (120574) 120579 + 119890119894119905 119890119894119905 sim iid (0 1205902) (2)
Thereinto 120573 = 1205732 120579 = 1205731minus1205732Using any threshold value120574 we can get the model fit and determine the residual sum ofsquares (RSS) Following Hansen [27] we take the optimalthreshold as the value that minimizes the RSS
42 The Test of Threshold Effect Model Test of the modelincludes two aspects one is significance test of the thresholdeffect the other is equivalence test between the estimatorand its real value The first null hypothesis we consider is1198670 1205731 = 1205732 and the test statistic is
1198651 = 1198780 minus 1198781 ()2 (3)
In formula (3) 1198780 is the RSS obtained under the hypoth-esis 1198670 Under the null hypothesis 1198670 the threshold value120574 cannot be identified so the statistical distribution of 1198651 isnot standard To solve this problem we use bootstrapping toapproximate the asymptotic distribution and then build the119875value The second null hypothesis we consider is1198670 = 1205740and the corresponding maximum likelihood ratio statistic is
LR1 (120574) = 119878 (120574) minus 119878 ()2 (4)
The statistical distribution is also not standard Nonethe-less Hansen [27] offers a simple formula to calculate arejection region When LR1(120574) le 119888(120572) we cannot reject thenull hypothesis where 119888(120572) = minus2 ln(1 minusradic1 minus 120572) and where 120572is the significance level
43 Data and Indicators This paper analyses a datasetcontaining 16 listed commercial banks covering the period of2007 to 2013This includes 5 state owned commercial banks 8
joint-equity commercial banks and 3 municipal commercialbanks The resources of data are Almanac of Chinarsquos Financeand Banking the public annual report of each commercialbank and the BankScope database
There are three types of variables in this paper com-mercial bankrsquos performance (the dependent variable) thenoninterest income as a proportion of total income andother control variates (see Table 1) We use return on equity(ROE) to represent the performance of commercial banksThe reason is that according to the DuPont formula
ROE = net profitnet equity
= ( net profitoperating income
) lowast (operating incometotal asset
)
lowast ( total assetnet equity
)= profit margin lowast asset turnover lowast leverage
(5)
In theDuPont formula the profitmargin reflects the ability ofthe bank to earn profit and control costs The asset turnoverreflects the efficiency of capital operation Therefore it isreasonable to choose ROE as the indicator of commercialbankrsquos performance
In total the dataset includes five variables for the periodof 2007 to 2013 ROE (return on equity) NIR (the noninterestincome as a proportion of total income) BAD (nonperform-ing loan ratio) CAR (capital adequacy ratio) andCOST (costratio)
As to the explanatory variables we set NIR as the mainexplanatory variable to reflect howmuch and how well thosecommercial banks carry out noninterest business it also hasindirect impact on the scale of noninterest rate business to thewhole business We choose nonperforming loan ratio (BAD)to reflect the security condition of credit assets The less theratio of nonperforming loan is the safer the operation ofbanks is and the more the support noninterest rate businesswill get from interest rate business CAR shows how well thecommercial banks manage risk control and COST reflectsthe ability of commercial bank to control costs A lower levelof the cost ratio indicates the ability to provide resources fornoninterest income business
Scientific Programming 5
The estimationmodel under single threshold condition isas follows
ROE119894119905 = 119906119894119905 + 1205731BAD119894119905 + 1205732COST119894119905 + 1205733CAR119894119905+ 1205734NIR119894119905 (119902119894119905 le 120574) + 1205735NIR119894119905 (119902119894119905 gt 120574)+ 119890119894119905 119890119894119905 sim iid (0 1205902)
(6)
44 Descriptive Statistical Analysis In this section we con-sider descriptive statistics for every variable in the datasetand also consider separately the relevant variables of stateowned commercial banks joint-equity commercial banksand municipal commercial banks
441 Return on Equity (ROE) Themean ROE of joint-equitycommercial banks across all years (2126) is higher than themean for the other two kinds of banks and is also higherthan the mean of all 16 commercial banks (1919) Thehighest ROE is 4112 coming from China Everbright Bankin year 2007 The state owned commercial banks and joint-equity commercial banksrsquo mean ROE are 1908 and 1706respectively The performance of city commercial banks ismuch worse than state owned commercial banks and joint-equity commercial banks among which the highest ROE ismerely 1735 However the statistical standard deviation ofthe variables shows that municipal commercial banks aremore stable than state owned commercial banks and joint-equity commercial banks although the ROE of municipalcommercial banks is comparatively lower Those joint-equitycommercial banks have highest ROE but fluctuate muchmore than other kinds of banks
442 Nonincome Return Proportion The state owned com-mercial banksrsquo average NIR across all years is 2045 whichis the highest among the three kinds of commercial banksJoint-equity commercial banksrsquo NIR (1505) takes the sec-ond place 466 lower than that of the overall mean This ismostly because state owned commercial banks are predom-inant in scale and market share and have massive customerresources in the traditional deposits and loans business Inthis case the noninterest business can be developed mucheasier for state owned banks Inevitably the higher nonin-terest income is associated with higher volatility Joint-equitycommercial banksrsquo performance is better than state ownedbanks but their NIR is lower than state owned commercialbanks which indicates that the higher noninterest incomerate does not necessarily lead to better performance Tosome extent this validates our earlier assumption about therelationship between noninterest income and performance
443 Control Variates This paper selects BAD CAR andCOST as the control variates It is found that except forstate owned commercial banks both the nonperformingloan ratios of joint-equity commercial banks and municipalcommercial banks are lower than the overall mean Amongthese the nonperforming loan ratio ofmunicipal commercialbank is the lowest (097) and the standard deviation isalso the lowest As for cost control average cost ratio for
Table 2 The stationary test LLC result
Variable LLC testCoefficient 119905-value 119905-star 119875 gt 119905
ROE minus090519 minus19427 minus1551336 00000lowastlowastlowastNIR minus099370 minus18402 minus1763716 00000lowastlowastlowastBAD minus028727 minus11725 minus816048 00000lowastlowastlowastCAR minus066458 minus14243 minus1349747 00000lowastlowastlowastCOST minus060142 minus10544 minus758969 00000lowastlowastlowastNotes lowast lowast lowast denotes significance at 1 level
16 listed commercial banks across all years is 3446 Thecost ratios of state owned commercial banks joint-equitycommercial banks and municipal commercial banks are2270 3612 and 3119 respectively Among these thecost ratio of joint-equity commercial bank is higher than themean value As for risk control the capital adequacy ratiofor municipal commercial banks is much higher than thatfor joint-equity commercial banks The Bank of Nanjing hasthe largest CAR in any year 3067 in 2007 This showsthat municipal commercial banks are relatively conservativeon risk management On the one hand it is because theirscales are relatively small and the deposits and loans businessis limited on the other hand according to their relativelylower noninterest income the expansion of commission andfee business is also limited Meanwhile there municipalcommercial banks alsomeet gaps with state owned banks andjoint-equity commercial banks in investment management
5 Empirical Results and Analysis
51 Variable Stationary Test We usually have to make surethat every variable is stationary when using the panel thresh-old regression model So we should test the stationarity ofthe variable which is known as a panel unit root test usingLLC as the test methodThe test results are shown in Table 2The null hypothesis of the LLC is 1198670 there exist unit rootsAccording to the 119875 value of variable ROE NIR BAD andCAR wemake the conclusion that the null hypothesis shouldbe rejected and there are no unit roots
52 Endogeneity Test An explanatory variablersquos endogeneitycould lead to the estimation bias To avoid any possibleendogenous variable problems we use the Hausman endoge-nous test method (see Table 3) to test the explanatoryvariables
Fe is the coefficient of the fixed effect Re is the coefficientof random effect According to the null hypothesis there isno systematic difference between the fixed effect and randomeffect coefficients Table 3 gives an overall 119875 value of 04473We accept the null hypothesis that no endogeneity exists inthe explanatory variables
53 Threshold Value Test When using panel data to estimatethreshold model we should first define the quantity of thethresholds which is also the quantity of structural changepoints to determine the specific form of the model Weconsider that as the noninterest income rate changes there
6 Scientific Programming
Table 3 Endogeneity test result
Variable (119887)fe
(119861)re
(119887 minus 119861)Difference
sqrt(diag(119881 119887 minus 119881 119861))SE
BAD minus08938821 minus08729335 minus00209486 00827101COST minus01579967 minus0194983 00369863 00755033CAR minus04142893 minus05194039 01051146 00974391NIR minus01971864 minus01767028 minus00204837 00602813119887 = consistent under1198670 and119867119886 obtained from xtreg119861 = inconsistent under119867119886 and efficient under1198670 obtained from xtregTest1198670 difference in coefficients not systematicchi2 (4) = (119887 minus 119861)[(119881 119887 minus 119881 119861)and(minus1)](119887 minus 119861)= 371Prob gt chi2 = 04473
Table 4 Threshold test results
Model F-statistic 119875 value The frequency of bootstrap Critical value1 5 10
Single threshold 245959lowastlowastlowast 00000 1000 686629 416177 283850Double threshold 111334lowastlowastlowast 00020 1000 654412 362866 271744Triple threshold 59955lowastlowast 00180 1000 592804 351374 259486Note lowast lowast lowast and lowastlowast separately denote the significance at 1 and 5 level
may be up to three structural change points (thresholds)between noninterest income and the performance We esti-mate themodels and test for existence of change points usingthe 119865-statistic and the associated 119875 value derived from 1000bootstrap replications These are shown in Table 4
From Table 4 the 119865-statistics for single threshold doublethreshold and triple threshold are 245959 111334 and59955 respectively Single threshold and double thresholdmodels are both significant at 1 level and the bootstrap119875 values are 00000 and 00020 the triple threshold is onlysignificant at 5 levelWe use a 1 level and therefore employa double threshold model
The estimated thresholds for the double threshold modelare 00998 and 01662 This means that the effect of non-interest income on performance of commercial banks willchange structurally when noninterest income rate is lowerthan 998 between 998 and 1662 and higher than1662
For comparison purposes we fit both the no thresholdmodel and the double threshold model The parameterestimates are shown in Tables 5 and 6 FromTable 5 under theno threshold model at 5 significance level the significantnegative coefficients are merely nonperforming loan ratio(BAD) and CAR The coefficients of COST and NIT are alsonegative but not significant at the 5 level although thecoefficient of NIT is significant at the 10 level
Intuitively the higher the NIT is the better the per-formance of commercial bank will be However the nothreshold model shows that NIT and the performance arenegatively related The reason can be summarized as followsthe operating expenses deriving from noninterest incomebusiness are much higher than that of the interest incomebusiness The interest income derives from loan businessFrom the current situation management and cost control
level for loan business cannot be further improved So themarginal cost of interest income is quite low and barely growsafter the interest income increases However the noninterestincome has been newly developed in the last 10 yearsCompared to the loan business management and cost controllevel these emerging businesses still have a long way to goMoreover banks investment income and exchange earningare influenced by secondary market and foreign exchangemarket price fluctuation so negative profits are commonwhich means that deficits often happen in these two opera-tions even though human and material resources have beenallocated The composition of the above two factors causesthe higher expenses of acquiring noninterest income thaninterest income Therefore NIR can be negatively correlatedwith bank performance
On the other hand the result of the no threshold modelshows that the coefficient of noninterest is only significantat 10 level This may be caused by the strict supervisionof China Banking Regulatory Commission (CBRC) Someinnovation applications of noninterest operation have beenrefused by CBRC with the consideration of unfavorableimpacts on noninterest business The constraints of thepolicy make the effect of noninterest operation on bankrsquosperformance more limited
From Table 6 when we add the two threshold val-ues noninterest income ratio becomes significant And thecoefficients are significantly different in different thresholdinterval When noninterest income ratio is less than 00998the coefficient estimated by thresholdmodel isminus18229 whichmeans the return on equity (ROE) is negatively correlatedwith noninterest income (NIR) when the noninterest incomeratio is between 0998 and 01662 the coefficient of nonin-terest income grows to minus07525 but the correlation betweenROE and NIR is still negative When noninterest income
Scientific Programming 7
Table 5 Estimated results of no threshold model
Explanatory variable Coef Std 119905 ProbBAD minus08939 02043 minus43758 00000lowastlowastlowastCOST minus01580 01302 minus12132 02281CAR minus04143 01856 minus22321 00280lowastlowastNIR minus01972 01013 minus19458 00547lowastNote lowast lowast lowast lowastlowast and lowast separately denote the significance at 1 5 and 10 level
Table 6 Estimates of double threshold model
Explanatory variable Coef Std 119905 ProbBAD minus08595 01771 minus48516 00000lowastlowastlowastCOST minus00539 01121 minus04805 06321CAR minus04234 01628 minus26010 00109lowastlowastNIR (lt00998) minus18229 02784 minus65482 00000lowastlowastlowastNIR (00998sim01662) minus07527 01562 minus48202 00000lowastlowastlowastNIR (gt01662) minus05046 01042 minus48443 00000lowastlowastlowastNote lowast lowast lowast and lowastlowast separately denote the significance at 1 and 5 level
ratio surpasses the second threshold 01662 the coefficientof noninterest income ratio grows further to 05046 As thenoninterest ratio grows up the negative effect of noninter-est income reduces which means the performance can beimproved
The reasonwhy the coefficient of noninterest income ratiogrows after noninterest income ratio and generates thresholdeffects can be summarized as follows
Firstly the average cost of noninterest business reducesafter the noninterest business grows At the initial periodof commencing noninterest business the investment is rel-atively high The investment includes new manpower theexpense of product research and marketing cost Howeverwhen noninterest business has been finely developed thebank only needs to maintain the clients and the systemso the operation cost reduces Overall the preparation ofnoninterest business is a massive investment but when thebusiness line is highly developed the variable cost just slightlygrows with volume growing which means the fixed costis high but the marginal cost is quite low The reductionof average cost of noninterest business will improve theperformance of commercial banks
Secondly the increase of noninterest income ratio willenhance the total asset turnover of commercial banks Totalasset turnover is equal to net operation income withina certain period divided by total average assets of thatperiod Compared with loan operation the main characterof noninterest business is that noninterest business is notlinked with assets while the income from loans is linkedwith assets of the bank In this way on the development ofbanks the rising rate of the interest income is remarkablysimilar to the average rising rate of total assets So when thenoninterest income ratio rises the numerator of total assetturnover grows faster than denominator so the total assetturnover can be improved From DuPont formula ROE isa product of 3 different parts total asset turnover return onsales and leverage ratio So when the rise of the noninterest
income ratio makes the total asset turnover improve theperformance can be also improved
6 Conclusion
Generally noninterest income of Chinese commercial banksis influenced by regulations from the central bank tech-niques and innovation Faced with intensified competitioninduced by increasingly open market policies of ChinaChinese commercial banks strive to compete in noninterestincome activities This paper analyses whether the noninter-est income activities help enhance the banksrsquo performanceStarting with the hypothesis of a threshold effect from non-interest income business on commercial banksrsquo performancethis paper builds empirical model of the threshold effect andevaluates the threshold valueThis indicates the following (1)noninterest rate is negatively correlatedwith the performanceof commercial bank the higher the noninterest rate is thelower the performance of commercial bank will be (2) twothresholds are 00998 and 01662 which shows that theinfluence of noninterest income business on commercialbanks performance has structural change in three intervalslower than 998 between 998 and 1662 and higherthan 1662
When noninterest rate is higher than the two thresholdvalues the negative relationship will weaken so that whennoninterest income reaches that point it will improve therelative performance Our research also shows the coefficientbetween noninterest income rate and performance inclines tozero as the noninterest income rises This suggests that whennoninterest income reaches higher threshold the negativerelationship will gradually recede and the coefficient mayeven become positive which means the increase of nonin-terest income may improve the performance So the policyimplication of our research is to provide more resources tononinterest income activities and put more emphasis on the
8 Scientific Programming
quality supervision and efficiency supervision on noninterestincome activities
Competing Interests
The authors declare that they have no competing interests
References
[1] AM Santomero andD L Eckles ldquoThe determinants of successin the new financial services environment now that firms cando everything what should they do and why should regulatorscarerdquo Federal Reserve Bank of New York Economic PolicyReview vol 6 no 4 pp 11ndash23 2000
[2] R Deyoung and K P Roland ldquoProduct mix and earnings vola-tility at commercial banks evidence from a degree of total leve-rage modelrdquo Journal of Financial Intermediation vol 10 no 1pp 54ndash84 2001
[3] M Ariff and F F Cheng ldquoDo accounting disclosures of feeincome affect commercial bank share pricesrdquo CARF WorkingPaper 7 2008
[4] J Goddard D McKillop and J O S Wilson ldquoThe diversifica-tion and financial performance of US credit unionsrdquo Journal ofBanking amp Finance vol 32 no 9 pp 1836ndash1849 2008
[5] B S Damankah O Anku-Tsede and A Amankwaa Interna-tional Journal of Academic Research in Accounting vol 4 no 4pp 263ndash271 2014
[6] R Engle F Moshirian S Sahgal and B Zhang ldquoBanksnon-interest income and global financial stabilityrdquo ResearchWorking Paper Series 3-56 Working Paper No 0152014 CIFR2014
[7] K Jaffar KMabwe and RWebb ldquoChanging bank income stru-cture evidence from large UK banksrdquoAsian Journal of Financeamp Accounting vol 6 no 2 pp 195ndash215 2014
[8] S R Trivedi ldquoBanking innovations and new income streamsimpact on banksrsquo performancerdquo Vikalpa vol 40 no 1 pp 28ndash41 2015
[9] D B Senyo A-T Olivia andAMusah ldquoIncome diversificationand financial stability of banks in Ghanardquo International Journalof Business and Social Science vol 6 no 6 2015
[10] T C Nguyen D V Vo and V C Nguyen ldquoRisk and incomediversification in the Vietnamese banking systemrdquo Journal ofApplied Finance amp Banking vol 5 no 1 pp 93ndash109 2015
[11] R De Young and T Rice ldquoHow do banks make money Thefallacies of fee incomerdquo Federal Reserve Bank of Chicago Eco-nomic Perspectives vol 40 pp 34ndash51 2004
[12] P Eisemann ldquoDiversification and the congeneric bank holdingcompanyrdquo Journal of Bank Research vol 7 no 1 pp 68ndash77 1976
[13] R Busch and T Kick Income Diversification in the GermanBanking Industry Discussion Paper 9 Bundes Bank 2009
[14] H Aggeler and R Feldman ldquoRecord bank profitability howwho and what does it meanrdquo Federal Reserve Bank of Min-neapolis no 10 1998
[15] H Sheng and B Wang ldquoImpact of non-interest income on per-formance of Chinese listed commercial banksrdquo Finance Forumno 6 pp 8ndash11 2008
[16] S Sanya and SWolfe ldquoCan banks in emerging economies bene-fit from revenue diversificationrdquo Journal of Financial ServicesResearch vol 40 no 1 pp 79ndash101 2011
[17] A Saunders M Schmid and I Walter Non-Interest Incomeand Bank Performance Is Banksrsquo Increased Reliance on Non-Interest Income Bad 2014 httpssrncomabstract=2504675
[18] K J Stiroh and A Rumble ldquoThe dark side of diversification thecase of US financial holding companiesrdquo Journal of Banking andFinance vol 30 no 8 pp 2131ndash2161 2006
[19] F Aslam B Mehmood and S Ali ldquoDiversification in bankingis non interest income the answer for Pakistanrsquos caserdquo ScienceInternational (Lahore) vol 27 no 3 pp 2791ndash2794 2015
[20] A Saunders M Schmid and I Walter Non-Interest Incomeand Bank Performance Does Ring-Fencing Reduce Bank Risk2016 httpssrncomabstract=2504675
[21] R Smith C Staikoura andGWood ldquoNon-interest income andtotal income stabilityrdquo Working Paper 198 Bank of England2003 httpwwwbankofenglandcoukwpindexhtml
[22] S Mercieca K Schaeck and S Wolfe ldquoSmall European banksbenefits from diversificationrdquo Journal of Banking and Financevol 31 no 7 pp 1975ndash1998 2007
[23] R K Mndeme ldquoImpact of non interest income on bankingPerformance in Tanzaniardquo International Journal of EconomicsCommerce and Management vol 3 no 5 pp 75ndash92 2015
[24] C Calmes and Y Liu ldquoFinancial structure change and bankingincome a Canada-US comparisonrdquo Journal of InternationalFinancialMarkets Institutions andMoney vol 19 no 1 pp 128ndash139 2009
[25] L-W Huang and Y-K Chen ldquoDoes bank performance benefitfrom non-traditional activities A case of non-interest incomesin Taiwan Commercial Banksrdquo Asian Journal of Managementand Humanity Sciences vol 1 no 3 pp 359ndash378 2006
[26] L Lepetit E Nys P Rous and A Tarazi ldquoThe expansion ofservices in European banking implications for loan pricing andinterest marginsrdquo Journal of Banking and Finance vol 32 no 11pp 2325ndash2335 2008
[27] B E Hansen ldquoThreshold effects in non-dynamic panels esti-mation testing and inferencerdquo Journal of Econometrics vol 93no 2 pp 345ndash368 1999
Submit your manuscripts athttpswwwhindawicom
Computer Games Technology
International Journal of
Hindawi Publishing Corporationhttpwwwhindawicom Volume 2014
Hindawi Publishing Corporationhttpwwwhindawicom Volume 2014
Distributed Sensor Networks
International Journal of
Advances in
FuzzySystems
Hindawi Publishing Corporationhttpwwwhindawicom
Volume 2014
International Journal of
ReconfigurableComputing
Hindawi Publishing Corporation httpwwwhindawicom Volume 2014
Hindawi Publishing Corporationhttpwwwhindawicom Volume 2014
Applied Computational Intelligence and Soft Computing
thinspAdvancesthinspinthinsp
Artificial Intelligence
HindawithinspPublishingthinspCorporationhttpwwwhindawicom Volumethinsp2014
Advances inSoftware EngineeringHindawi Publishing Corporationhttpwwwhindawicom Volume 2014
Hindawi Publishing Corporationhttpwwwhindawicom Volume 2014
Electrical and Computer Engineering
Journal of
Journal of
Computer Networks and Communications
Hindawi Publishing Corporationhttpwwwhindawicom Volume 2014
Hindawi Publishing Corporation
httpwwwhindawicom Volume 2014
Advances in
Multimedia
International Journal of
Biomedical Imaging
Hindawi Publishing Corporationhttpwwwhindawicom Volume 2014
ArtificialNeural Systems
Advances in
Hindawi Publishing Corporationhttpwwwhindawicom Volume 2014
RoboticsJournal of
Hindawi Publishing Corporationhttpwwwhindawicom Volume 2014
Hindawi Publishing Corporationhttpwwwhindawicom Volume 2014
Computational Intelligence and Neuroscience
Industrial EngineeringJournal of
Hindawi Publishing Corporationhttpwwwhindawicom Volume 2014
Modelling amp Simulation in EngineeringHindawi Publishing Corporation httpwwwhindawicom Volume 2014
The Scientific World JournalHindawi Publishing Corporation httpwwwhindawicom Volume 2014
Hindawi Publishing Corporationhttpwwwhindawicom Volume 2014
Human-ComputerInteraction
Advances in
Computer EngineeringAdvances in
Hindawi Publishing Corporationhttpwwwhindawicom Volume 2014
2 Scientific Programming
of commissions and fees which could enhance the profit ofbanks by expanding source of earning Busch and Kick [13]discovered that noninterest income has positive correlationwith ROE and ROA Aggeler and Feldman [14] discoveredthat the profit of the bank depends mostly on noninterestincome but not interest income as people generally expectThe Chinese scholars Sheng andWang [15] think that the riseof the noninterestrsquos proportion in total income can efficientlyimprove the performance of commercial banks Goddard etal [4] study the impact of revenue diversification of US creditunions on financial performance for the period 1993ndash2004Their research finds that a positive direct exposure effect isoutweighed by a negative indirect exposure effect for all butthe largest credit unions Sanya and Wolfe [16] use System-GMM and 226 listed banks in 11 emerging economies datingfrom2000 to 2007 to explore diversification across andwithinboth interest and noninterest income generating activitiesTheir research indicates that diversification decreases insol-vency risk and enhances profitability Saunders et al [17] use10341 US banks as sample and conclude that a higher ratioof noninterest income to interest income is associated with ahigher profitability across the banking sector Nguyen et al[10] carried out tests on 32 Vietnamese domestic banks withdata period of 2005ndash2012 Their work concludes that bankswith high noninterest income present lower risk than thosewith mainly interest income A significant number of studieson US banking sector [2 18] show that noninterest incomeunfavorably affects bank performance by either reducingreturn or increasing income volatility However the study bySaunders et al [17] with a larger sample of US banks foundnoninterest income to be associated with higher profitabilityacross all banks groups Senyo et al [9] found that noninterestrevenue is becoming increasingly relevant and contributesto bank profit stability Against the view that diversificationmay impact negatively on performance of banks AbeyratnaGunasekarage et al (2014) suggest that diversification ofAustraliarsquos banks has improved their risk-return Aslam etal [19] show that noninterest income and business growthare positively related Saunders et al [20] find no convincingevidence that noninterest generating activities harm bankprofitability andor increase bank failure insolvency orsystematic risks during both crisis and noncrisis periods
Other researchers suggest that the influence of nonin-terest income on enhancing the profit of commercial banksis limited or even negatively correlated with performanceSmith et al [21] argue that the increase of noninterest incomecannot totally cover the income reduction Jing Wang (2009)and Yu Liu and Jia Li (2012) suggest that noninterest incomecannot improve the income rate Research on the US bankingsystem shows that as American banks convert from singlebusiness to mixed business the variability also becomesmore severe which offsets profit coming from the incomersquosdiversification and therefore the shift towards noninterestincome has not improved the risk-adjusted returns [11](Hirtle and Stiroh 2007) Furthermore some researches pointout that the noninterest income and the banksrsquo performanceare actually negatively correlated and the volatility feature ofnoninterest income may even do harm to commercial banksrsquoprofitability [22 23] (Jing Wang and Haowen Zhou 2008Chao Xue and Zheng li 2014)
Other researchers show unclear or uncertain impactsfrom noninterest income According to Stiroh and Rumble[18] there is no significant correlation between the nonin-terest income and the average rate of return The EuropeanCentral Bankrsquos empirical test result shows that the relation-ship between performance and the noninterest income as aproportion of total income is uncertain Yingchun Lou (2008)gives a similar conclusion
There is a wide range of different conclusions fromprevious research about how noninterest income influencesperformance As to the Chinese case most researchers focuson only linear modelling approaches This paper extendsthese approaches to consider nonlinear models using thresh-old valuesWe consider the following aspects (1) we show thenonlinearity between noninterest income and performanceof commercial banks and verify the existence of the thresh-old (2) we consider the nonlinear impact of noninterestincome on bank performance in different stages of scaleusing two thresholds (3) we use data within 2007ndash2013 toensure the consistency of the methods of calculation of somevariables themethodology for computation of these variablesremained consistent during this period and therefore ourinferences are more robust
3 How Noninterest Income InfluencesCommercial Banking Performance
31 Noninterest Income Business Expands Commercial BanksrsquoSource of Revenue and Cost The income source of commer-cial bank includes interest income and noninterest incomeObviously when the expanding of traditional interest incomebusiness faces limitations from relatively stable populationand increasingly intense horizontal competition developingthe noninterest income business becomes a main means tomaintain and increase the total income level that has beenexperienced by international banks Noninterest income canincrease the total level of income of commercial banks inseveral ways (1) satisfying diversified needs for financialservices investment consultation and so forth by continuousinnovation of new financial products and services in orderto gain more fees and commission and strengthen the mar-ket competitiveness (2) improving the investment level ofcommercial banks in financialmarkets to gain the investmentincome from bonds and stocks (3) enriching income fromgains or losses of exchange and profits or losses from changesof fair value and other business
The operating costs of noninterest income mainly con-sist of labor costs marketing expenses and administrativeexpenses When new noninterest financial products arereleased the commercial banks have to pay much moreto market new services than those invested in traditionalinterest income activities and the operating costs will risegreatly In addition uncertainty in security market influencesthe returns of investment Increasing the investment incomerequires the commercial bank to have sound investmentability For some banks poor ability of investing in the secu-rity market resulting from long time focusing on traditionalactivities may result in a poor performance in noninterest
Scientific Programming 3
income business The loss in noninterest income activitieswill lead to loss in total revenue
32 Noninterest Income Increases Volatility of Bank EarningsVolatility brought by noninterest income of commercialbanks has been highlighted in a previous literature Someexplain the impact of noninterest income on bank perfor-mancewith portfolio theory consistentwith portfolio theoryan increased reliance on noninterest income is associatedwith higher volatility of returns Similar conclusions havebeen drawn by Stiroh and Rumble [18] Calmes and Liu[24] Jaffar et al [7] and Senyo et al [9] who argue that thebanksrsquo greater reliance on noninterest income is associatedwith higher systemic riskThe results of these studies indicatenoninterest income is much more volatile than interestincome from a global viewpoint and for each individual bankDeyoung and Roland [2] proposed three reasons to explainvolatility induced by noninterest income on bank earningsFirstly switching costs of noninterest income are much lowerthan that of interest income because most fee-based activitiesare not relationship based which contributes to the volatilitySecondly noninterest income activities may require greateroperating leverage than interest income activities because themain input needed to produce more fee-based products istypically fixed or quasi-fixed other than for interest expensesneeded to produce more loans Thirdly noninterest incomeactivities likely employ greater financial leverage than lendingactivities because most noninterest income activities requireholding little or no fixed assets and little or no regulatorycapital All these factors lead to volatility from noninterestincome increasing risk for commercial banks
33 Noninterest Income Increases Operating Risk Firstly theexpansion of noninterest income requires more investmentin labor and facility which leads to increasing operatingcosts Thus the larger operating leverage may induce largeroperating risk To acquire revenue from noninterest incomecommercial banks have to invest much in both labor andfacilities These investments lead to high fixed costs Whenindustry profitability drops with competition among banksand the costs remain stable the profit level drops sharplyHence in this case high operating leverage will increase theoperating risk
Secondly noninterest business increases commercialbankrsquos operating risk while innovating new services and newproducts During the process of developing noninterest busi-ness it is necessary to create new services and new productsalong with the changes of costumersrsquo needs But with morekinds of business development the management difficultywill increase as well as management cost For example theasset securitization products released by commercial bankscan promote the circulation of asset improve the liquidityand also increase the risk of price fluctuation In this casehigh quality administration is required in commercial banks
Finally noninterest income business requires highermanagement ability but Chinese banks may lack this exper-tise Noninterest income will increase the existing risk ofcommercial banks For example if a commercial bank lacksthe experience in the investment field when developing
noninterest business it will meet high investment riskHowever at present the noninterest products of Chinesecommercial banks mostly derive from traditional businessespecially when client resources are depending on the long-term building up of traditional business
Noninterest income can lead to commercial banksrsquo overallincome increasing in the initial stage of development But asthe scale expands themarginal cost of developing noninterestincome is rising and the marginal income of noninterestincome is decreasing so the rising operating costs willdecrease the net income Huang and Chen [25] find thatthe banks with either relatively higher or lower ratios ofnoninterest incomes to operating incomes perform morecost-efficiently during the examination periods Anotherview [26] holds that if the proportion of commission intotal income is much too high the total profit will decreaseNoninterest incomersquos influence on the commercial bankrsquos per-formance may have constraints and the interaction betweennoninterest income and interest income must be managed
4 Methodology
41 Threshold Effect Model To account for the potentialvariability in the relationship between noninterest incomeandperformance across different commercial banks we allowfor a turning point or a ldquothresholdrdquo within our model Thethreshold effect refers to such a state namely when aneconomic parameter reaches a specific value it will leadto another model parameterrsquos alteration The specific valueis called threshold value The regression model based onthis effect is called the threshold regression model If themodelled data contains multiple individuals and multipleyears the model is a panel threshold model We use themodel of Hansen [27] Compared with the former thresholdeffect regressionmodel the Hansen [27] threshold regressionmodel has two advantages firstly this threshold regressionmodel does not need to separate the endogenous variablesand the exogenous variables so the threshold and the esti-mated parameters depend only on the endogeneity secondlythe threshold model theory offers an asymptotic distributiontheory to determine the confidence interval of the parametersand to estimate the thresholdrsquos statistical significance
Based on the hypothesis above this paper applies thepanel threshold model of Hansen [27] to study the rela-tionship between the bankrsquos performance and noninterestincome The specific single threshold model is as follows
119910119894119905 = 119906119894 + 11990910158401198941199051205731 + 119890119894119905 119902119894119905 le 120574119910119894119905 = 119906119894 + 11990910158401198941199051205732 + 119890119894119905 119902119894119905 gt 120574
(1)
Among these 119894 denotes company and 119905 denotes time 119910119894119905is the response variable 119909119894119905 is 119901times1 order explanatory variablevector and 119902119894119905 is the threshold variable We use return onequity as the response variable performance measure andnoninterest income as a proportion of total operating incomeas the main explanatory variable The remaining explanatoryvariables are described in Section 43
We also take the noninterest income proportion for thethreshold variable The role of the threshold variable is to
4 Scientific Programming
Table 1 The explanation of the model variables
Category Variable Calculation of the variable ExplanationExplained variable Performance ROE Net profitnet asset The performance of profitability
Explanatory variable Noninterestincome NIR Noninterest incometotal operating
incomeHow much and how well bankscarry out noninterest business
Control variable
Bad loan ratio (BAD) Nonperforming loansbalance of loans The credit assetsrsquo securitycondition
Capital adequacy ratio (CAR) Capitalrisk-weighted asset How well the risk control abilityis
Cost ratio (COST) Operating costoperating income Ability of control of the cost
divide the samples into different groups and the turning pointof the regime changing The different regimes in the modelcan be denoted into two states in one state the thresholdvariable is bigger than the specific threshold in the other thethreshold variable is smaller than the specific threshold
Define dummy variable 119889119894(120574) = (119902119894 le 120574) (sdot) is theindicator function which means when 119902119894 le 120574 (sdot) = 1 or(sdot) = 0 This way the equations above can be expressed by asingle equation
119910119894119905 = 119906119894 + 1199091015840119894119905120573 + 1199091015840119894119905119889119894119905 (120574) 120579 + 119890119894119905 119890119894119905 sim iid (0 1205902) (2)
Thereinto 120573 = 1205732 120579 = 1205731minus1205732Using any threshold value120574 we can get the model fit and determine the residual sum ofsquares (RSS) Following Hansen [27] we take the optimalthreshold as the value that minimizes the RSS
42 The Test of Threshold Effect Model Test of the modelincludes two aspects one is significance test of the thresholdeffect the other is equivalence test between the estimatorand its real value The first null hypothesis we consider is1198670 1205731 = 1205732 and the test statistic is
1198651 = 1198780 minus 1198781 ()2 (3)
In formula (3) 1198780 is the RSS obtained under the hypoth-esis 1198670 Under the null hypothesis 1198670 the threshold value120574 cannot be identified so the statistical distribution of 1198651 isnot standard To solve this problem we use bootstrapping toapproximate the asymptotic distribution and then build the119875value The second null hypothesis we consider is1198670 = 1205740and the corresponding maximum likelihood ratio statistic is
LR1 (120574) = 119878 (120574) minus 119878 ()2 (4)
The statistical distribution is also not standard Nonethe-less Hansen [27] offers a simple formula to calculate arejection region When LR1(120574) le 119888(120572) we cannot reject thenull hypothesis where 119888(120572) = minus2 ln(1 minusradic1 minus 120572) and where 120572is the significance level
43 Data and Indicators This paper analyses a datasetcontaining 16 listed commercial banks covering the period of2007 to 2013This includes 5 state owned commercial banks 8
joint-equity commercial banks and 3 municipal commercialbanks The resources of data are Almanac of Chinarsquos Financeand Banking the public annual report of each commercialbank and the BankScope database
There are three types of variables in this paper com-mercial bankrsquos performance (the dependent variable) thenoninterest income as a proportion of total income andother control variates (see Table 1) We use return on equity(ROE) to represent the performance of commercial banksThe reason is that according to the DuPont formula
ROE = net profitnet equity
= ( net profitoperating income
) lowast (operating incometotal asset
)
lowast ( total assetnet equity
)= profit margin lowast asset turnover lowast leverage
(5)
In theDuPont formula the profitmargin reflects the ability ofthe bank to earn profit and control costs The asset turnoverreflects the efficiency of capital operation Therefore it isreasonable to choose ROE as the indicator of commercialbankrsquos performance
In total the dataset includes five variables for the periodof 2007 to 2013 ROE (return on equity) NIR (the noninterestincome as a proportion of total income) BAD (nonperform-ing loan ratio) CAR (capital adequacy ratio) andCOST (costratio)
As to the explanatory variables we set NIR as the mainexplanatory variable to reflect howmuch and how well thosecommercial banks carry out noninterest business it also hasindirect impact on the scale of noninterest rate business to thewhole business We choose nonperforming loan ratio (BAD)to reflect the security condition of credit assets The less theratio of nonperforming loan is the safer the operation ofbanks is and the more the support noninterest rate businesswill get from interest rate business CAR shows how well thecommercial banks manage risk control and COST reflectsthe ability of commercial bank to control costs A lower levelof the cost ratio indicates the ability to provide resources fornoninterest income business
Scientific Programming 5
The estimationmodel under single threshold condition isas follows
ROE119894119905 = 119906119894119905 + 1205731BAD119894119905 + 1205732COST119894119905 + 1205733CAR119894119905+ 1205734NIR119894119905 (119902119894119905 le 120574) + 1205735NIR119894119905 (119902119894119905 gt 120574)+ 119890119894119905 119890119894119905 sim iid (0 1205902)
(6)
44 Descriptive Statistical Analysis In this section we con-sider descriptive statistics for every variable in the datasetand also consider separately the relevant variables of stateowned commercial banks joint-equity commercial banksand municipal commercial banks
441 Return on Equity (ROE) Themean ROE of joint-equitycommercial banks across all years (2126) is higher than themean for the other two kinds of banks and is also higherthan the mean of all 16 commercial banks (1919) Thehighest ROE is 4112 coming from China Everbright Bankin year 2007 The state owned commercial banks and joint-equity commercial banksrsquo mean ROE are 1908 and 1706respectively The performance of city commercial banks ismuch worse than state owned commercial banks and joint-equity commercial banks among which the highest ROE ismerely 1735 However the statistical standard deviation ofthe variables shows that municipal commercial banks aremore stable than state owned commercial banks and joint-equity commercial banks although the ROE of municipalcommercial banks is comparatively lower Those joint-equitycommercial banks have highest ROE but fluctuate muchmore than other kinds of banks
442 Nonincome Return Proportion The state owned com-mercial banksrsquo average NIR across all years is 2045 whichis the highest among the three kinds of commercial banksJoint-equity commercial banksrsquo NIR (1505) takes the sec-ond place 466 lower than that of the overall mean This ismostly because state owned commercial banks are predom-inant in scale and market share and have massive customerresources in the traditional deposits and loans business Inthis case the noninterest business can be developed mucheasier for state owned banks Inevitably the higher nonin-terest income is associated with higher volatility Joint-equitycommercial banksrsquo performance is better than state ownedbanks but their NIR is lower than state owned commercialbanks which indicates that the higher noninterest incomerate does not necessarily lead to better performance Tosome extent this validates our earlier assumption about therelationship between noninterest income and performance
443 Control Variates This paper selects BAD CAR andCOST as the control variates It is found that except forstate owned commercial banks both the nonperformingloan ratios of joint-equity commercial banks and municipalcommercial banks are lower than the overall mean Amongthese the nonperforming loan ratio ofmunicipal commercialbank is the lowest (097) and the standard deviation isalso the lowest As for cost control average cost ratio for
Table 2 The stationary test LLC result
Variable LLC testCoefficient 119905-value 119905-star 119875 gt 119905
ROE minus090519 minus19427 minus1551336 00000lowastlowastlowastNIR minus099370 minus18402 minus1763716 00000lowastlowastlowastBAD minus028727 minus11725 minus816048 00000lowastlowastlowastCAR minus066458 minus14243 minus1349747 00000lowastlowastlowastCOST minus060142 minus10544 minus758969 00000lowastlowastlowastNotes lowast lowast lowast denotes significance at 1 level
16 listed commercial banks across all years is 3446 Thecost ratios of state owned commercial banks joint-equitycommercial banks and municipal commercial banks are2270 3612 and 3119 respectively Among these thecost ratio of joint-equity commercial bank is higher than themean value As for risk control the capital adequacy ratiofor municipal commercial banks is much higher than thatfor joint-equity commercial banks The Bank of Nanjing hasthe largest CAR in any year 3067 in 2007 This showsthat municipal commercial banks are relatively conservativeon risk management On the one hand it is because theirscales are relatively small and the deposits and loans businessis limited on the other hand according to their relativelylower noninterest income the expansion of commission andfee business is also limited Meanwhile there municipalcommercial banks alsomeet gaps with state owned banks andjoint-equity commercial banks in investment management
5 Empirical Results and Analysis
51 Variable Stationary Test We usually have to make surethat every variable is stationary when using the panel thresh-old regression model So we should test the stationarity ofthe variable which is known as a panel unit root test usingLLC as the test methodThe test results are shown in Table 2The null hypothesis of the LLC is 1198670 there exist unit rootsAccording to the 119875 value of variable ROE NIR BAD andCAR wemake the conclusion that the null hypothesis shouldbe rejected and there are no unit roots
52 Endogeneity Test An explanatory variablersquos endogeneitycould lead to the estimation bias To avoid any possibleendogenous variable problems we use the Hausman endoge-nous test method (see Table 3) to test the explanatoryvariables
Fe is the coefficient of the fixed effect Re is the coefficientof random effect According to the null hypothesis there isno systematic difference between the fixed effect and randomeffect coefficients Table 3 gives an overall 119875 value of 04473We accept the null hypothesis that no endogeneity exists inthe explanatory variables
53 Threshold Value Test When using panel data to estimatethreshold model we should first define the quantity of thethresholds which is also the quantity of structural changepoints to determine the specific form of the model Weconsider that as the noninterest income rate changes there
6 Scientific Programming
Table 3 Endogeneity test result
Variable (119887)fe
(119861)re
(119887 minus 119861)Difference
sqrt(diag(119881 119887 minus 119881 119861))SE
BAD minus08938821 minus08729335 minus00209486 00827101COST minus01579967 minus0194983 00369863 00755033CAR minus04142893 minus05194039 01051146 00974391NIR minus01971864 minus01767028 minus00204837 00602813119887 = consistent under1198670 and119867119886 obtained from xtreg119861 = inconsistent under119867119886 and efficient under1198670 obtained from xtregTest1198670 difference in coefficients not systematicchi2 (4) = (119887 minus 119861)[(119881 119887 minus 119881 119861)and(minus1)](119887 minus 119861)= 371Prob gt chi2 = 04473
Table 4 Threshold test results
Model F-statistic 119875 value The frequency of bootstrap Critical value1 5 10
Single threshold 245959lowastlowastlowast 00000 1000 686629 416177 283850Double threshold 111334lowastlowastlowast 00020 1000 654412 362866 271744Triple threshold 59955lowastlowast 00180 1000 592804 351374 259486Note lowast lowast lowast and lowastlowast separately denote the significance at 1 and 5 level
may be up to three structural change points (thresholds)between noninterest income and the performance We esti-mate themodels and test for existence of change points usingthe 119865-statistic and the associated 119875 value derived from 1000bootstrap replications These are shown in Table 4
From Table 4 the 119865-statistics for single threshold doublethreshold and triple threshold are 245959 111334 and59955 respectively Single threshold and double thresholdmodels are both significant at 1 level and the bootstrap119875 values are 00000 and 00020 the triple threshold is onlysignificant at 5 levelWe use a 1 level and therefore employa double threshold model
The estimated thresholds for the double threshold modelare 00998 and 01662 This means that the effect of non-interest income on performance of commercial banks willchange structurally when noninterest income rate is lowerthan 998 between 998 and 1662 and higher than1662
For comparison purposes we fit both the no thresholdmodel and the double threshold model The parameterestimates are shown in Tables 5 and 6 FromTable 5 under theno threshold model at 5 significance level the significantnegative coefficients are merely nonperforming loan ratio(BAD) and CAR The coefficients of COST and NIT are alsonegative but not significant at the 5 level although thecoefficient of NIT is significant at the 10 level
Intuitively the higher the NIT is the better the per-formance of commercial bank will be However the nothreshold model shows that NIT and the performance arenegatively related The reason can be summarized as followsthe operating expenses deriving from noninterest incomebusiness are much higher than that of the interest incomebusiness The interest income derives from loan businessFrom the current situation management and cost control
level for loan business cannot be further improved So themarginal cost of interest income is quite low and barely growsafter the interest income increases However the noninterestincome has been newly developed in the last 10 yearsCompared to the loan business management and cost controllevel these emerging businesses still have a long way to goMoreover banks investment income and exchange earningare influenced by secondary market and foreign exchangemarket price fluctuation so negative profits are commonwhich means that deficits often happen in these two opera-tions even though human and material resources have beenallocated The composition of the above two factors causesthe higher expenses of acquiring noninterest income thaninterest income Therefore NIR can be negatively correlatedwith bank performance
On the other hand the result of the no threshold modelshows that the coefficient of noninterest is only significantat 10 level This may be caused by the strict supervisionof China Banking Regulatory Commission (CBRC) Someinnovation applications of noninterest operation have beenrefused by CBRC with the consideration of unfavorableimpacts on noninterest business The constraints of thepolicy make the effect of noninterest operation on bankrsquosperformance more limited
From Table 6 when we add the two threshold val-ues noninterest income ratio becomes significant And thecoefficients are significantly different in different thresholdinterval When noninterest income ratio is less than 00998the coefficient estimated by thresholdmodel isminus18229 whichmeans the return on equity (ROE) is negatively correlatedwith noninterest income (NIR) when the noninterest incomeratio is between 0998 and 01662 the coefficient of nonin-terest income grows to minus07525 but the correlation betweenROE and NIR is still negative When noninterest income
Scientific Programming 7
Table 5 Estimated results of no threshold model
Explanatory variable Coef Std 119905 ProbBAD minus08939 02043 minus43758 00000lowastlowastlowastCOST minus01580 01302 minus12132 02281CAR minus04143 01856 minus22321 00280lowastlowastNIR minus01972 01013 minus19458 00547lowastNote lowast lowast lowast lowastlowast and lowast separately denote the significance at 1 5 and 10 level
Table 6 Estimates of double threshold model
Explanatory variable Coef Std 119905 ProbBAD minus08595 01771 minus48516 00000lowastlowastlowastCOST minus00539 01121 minus04805 06321CAR minus04234 01628 minus26010 00109lowastlowastNIR (lt00998) minus18229 02784 minus65482 00000lowastlowastlowastNIR (00998sim01662) minus07527 01562 minus48202 00000lowastlowastlowastNIR (gt01662) minus05046 01042 minus48443 00000lowastlowastlowastNote lowast lowast lowast and lowastlowast separately denote the significance at 1 and 5 level
ratio surpasses the second threshold 01662 the coefficientof noninterest income ratio grows further to 05046 As thenoninterest ratio grows up the negative effect of noninter-est income reduces which means the performance can beimproved
The reasonwhy the coefficient of noninterest income ratiogrows after noninterest income ratio and generates thresholdeffects can be summarized as follows
Firstly the average cost of noninterest business reducesafter the noninterest business grows At the initial periodof commencing noninterest business the investment is rel-atively high The investment includes new manpower theexpense of product research and marketing cost Howeverwhen noninterest business has been finely developed thebank only needs to maintain the clients and the systemso the operation cost reduces Overall the preparation ofnoninterest business is a massive investment but when thebusiness line is highly developed the variable cost just slightlygrows with volume growing which means the fixed costis high but the marginal cost is quite low The reductionof average cost of noninterest business will improve theperformance of commercial banks
Secondly the increase of noninterest income ratio willenhance the total asset turnover of commercial banks Totalasset turnover is equal to net operation income withina certain period divided by total average assets of thatperiod Compared with loan operation the main characterof noninterest business is that noninterest business is notlinked with assets while the income from loans is linkedwith assets of the bank In this way on the development ofbanks the rising rate of the interest income is remarkablysimilar to the average rising rate of total assets So when thenoninterest income ratio rises the numerator of total assetturnover grows faster than denominator so the total assetturnover can be improved From DuPont formula ROE isa product of 3 different parts total asset turnover return onsales and leverage ratio So when the rise of the noninterest
income ratio makes the total asset turnover improve theperformance can be also improved
6 Conclusion
Generally noninterest income of Chinese commercial banksis influenced by regulations from the central bank tech-niques and innovation Faced with intensified competitioninduced by increasingly open market policies of ChinaChinese commercial banks strive to compete in noninterestincome activities This paper analyses whether the noninter-est income activities help enhance the banksrsquo performanceStarting with the hypothesis of a threshold effect from non-interest income business on commercial banksrsquo performancethis paper builds empirical model of the threshold effect andevaluates the threshold valueThis indicates the following (1)noninterest rate is negatively correlatedwith the performanceof commercial bank the higher the noninterest rate is thelower the performance of commercial bank will be (2) twothresholds are 00998 and 01662 which shows that theinfluence of noninterest income business on commercialbanks performance has structural change in three intervalslower than 998 between 998 and 1662 and higherthan 1662
When noninterest rate is higher than the two thresholdvalues the negative relationship will weaken so that whennoninterest income reaches that point it will improve therelative performance Our research also shows the coefficientbetween noninterest income rate and performance inclines tozero as the noninterest income rises This suggests that whennoninterest income reaches higher threshold the negativerelationship will gradually recede and the coefficient mayeven become positive which means the increase of nonin-terest income may improve the performance So the policyimplication of our research is to provide more resources tononinterest income activities and put more emphasis on the
8 Scientific Programming
quality supervision and efficiency supervision on noninterestincome activities
Competing Interests
The authors declare that they have no competing interests
References
[1] AM Santomero andD L Eckles ldquoThe determinants of successin the new financial services environment now that firms cando everything what should they do and why should regulatorscarerdquo Federal Reserve Bank of New York Economic PolicyReview vol 6 no 4 pp 11ndash23 2000
[2] R Deyoung and K P Roland ldquoProduct mix and earnings vola-tility at commercial banks evidence from a degree of total leve-rage modelrdquo Journal of Financial Intermediation vol 10 no 1pp 54ndash84 2001
[3] M Ariff and F F Cheng ldquoDo accounting disclosures of feeincome affect commercial bank share pricesrdquo CARF WorkingPaper 7 2008
[4] J Goddard D McKillop and J O S Wilson ldquoThe diversifica-tion and financial performance of US credit unionsrdquo Journal ofBanking amp Finance vol 32 no 9 pp 1836ndash1849 2008
[5] B S Damankah O Anku-Tsede and A Amankwaa Interna-tional Journal of Academic Research in Accounting vol 4 no 4pp 263ndash271 2014
[6] R Engle F Moshirian S Sahgal and B Zhang ldquoBanksnon-interest income and global financial stabilityrdquo ResearchWorking Paper Series 3-56 Working Paper No 0152014 CIFR2014
[7] K Jaffar KMabwe and RWebb ldquoChanging bank income stru-cture evidence from large UK banksrdquoAsian Journal of Financeamp Accounting vol 6 no 2 pp 195ndash215 2014
[8] S R Trivedi ldquoBanking innovations and new income streamsimpact on banksrsquo performancerdquo Vikalpa vol 40 no 1 pp 28ndash41 2015
[9] D B Senyo A-T Olivia andAMusah ldquoIncome diversificationand financial stability of banks in Ghanardquo International Journalof Business and Social Science vol 6 no 6 2015
[10] T C Nguyen D V Vo and V C Nguyen ldquoRisk and incomediversification in the Vietnamese banking systemrdquo Journal ofApplied Finance amp Banking vol 5 no 1 pp 93ndash109 2015
[11] R De Young and T Rice ldquoHow do banks make money Thefallacies of fee incomerdquo Federal Reserve Bank of Chicago Eco-nomic Perspectives vol 40 pp 34ndash51 2004
[12] P Eisemann ldquoDiversification and the congeneric bank holdingcompanyrdquo Journal of Bank Research vol 7 no 1 pp 68ndash77 1976
[13] R Busch and T Kick Income Diversification in the GermanBanking Industry Discussion Paper 9 Bundes Bank 2009
[14] H Aggeler and R Feldman ldquoRecord bank profitability howwho and what does it meanrdquo Federal Reserve Bank of Min-neapolis no 10 1998
[15] H Sheng and B Wang ldquoImpact of non-interest income on per-formance of Chinese listed commercial banksrdquo Finance Forumno 6 pp 8ndash11 2008
[16] S Sanya and SWolfe ldquoCan banks in emerging economies bene-fit from revenue diversificationrdquo Journal of Financial ServicesResearch vol 40 no 1 pp 79ndash101 2011
[17] A Saunders M Schmid and I Walter Non-Interest Incomeand Bank Performance Is Banksrsquo Increased Reliance on Non-Interest Income Bad 2014 httpssrncomabstract=2504675
[18] K J Stiroh and A Rumble ldquoThe dark side of diversification thecase of US financial holding companiesrdquo Journal of Banking andFinance vol 30 no 8 pp 2131ndash2161 2006
[19] F Aslam B Mehmood and S Ali ldquoDiversification in bankingis non interest income the answer for Pakistanrsquos caserdquo ScienceInternational (Lahore) vol 27 no 3 pp 2791ndash2794 2015
[20] A Saunders M Schmid and I Walter Non-Interest Incomeand Bank Performance Does Ring-Fencing Reduce Bank Risk2016 httpssrncomabstract=2504675
[21] R Smith C Staikoura andGWood ldquoNon-interest income andtotal income stabilityrdquo Working Paper 198 Bank of England2003 httpwwwbankofenglandcoukwpindexhtml
[22] S Mercieca K Schaeck and S Wolfe ldquoSmall European banksbenefits from diversificationrdquo Journal of Banking and Financevol 31 no 7 pp 1975ndash1998 2007
[23] R K Mndeme ldquoImpact of non interest income on bankingPerformance in Tanzaniardquo International Journal of EconomicsCommerce and Management vol 3 no 5 pp 75ndash92 2015
[24] C Calmes and Y Liu ldquoFinancial structure change and bankingincome a Canada-US comparisonrdquo Journal of InternationalFinancialMarkets Institutions andMoney vol 19 no 1 pp 128ndash139 2009
[25] L-W Huang and Y-K Chen ldquoDoes bank performance benefitfrom non-traditional activities A case of non-interest incomesin Taiwan Commercial Banksrdquo Asian Journal of Managementand Humanity Sciences vol 1 no 3 pp 359ndash378 2006
[26] L Lepetit E Nys P Rous and A Tarazi ldquoThe expansion ofservices in European banking implications for loan pricing andinterest marginsrdquo Journal of Banking and Finance vol 32 no 11pp 2325ndash2335 2008
[27] B E Hansen ldquoThreshold effects in non-dynamic panels esti-mation testing and inferencerdquo Journal of Econometrics vol 93no 2 pp 345ndash368 1999
Submit your manuscripts athttpswwwhindawicom
Computer Games Technology
International Journal of
Hindawi Publishing Corporationhttpwwwhindawicom Volume 2014
Hindawi Publishing Corporationhttpwwwhindawicom Volume 2014
Distributed Sensor Networks
International Journal of
Advances in
FuzzySystems
Hindawi Publishing Corporationhttpwwwhindawicom
Volume 2014
International Journal of
ReconfigurableComputing
Hindawi Publishing Corporation httpwwwhindawicom Volume 2014
Hindawi Publishing Corporationhttpwwwhindawicom Volume 2014
Applied Computational Intelligence and Soft Computing
thinspAdvancesthinspinthinsp
Artificial Intelligence
HindawithinspPublishingthinspCorporationhttpwwwhindawicom Volumethinsp2014
Advances inSoftware EngineeringHindawi Publishing Corporationhttpwwwhindawicom Volume 2014
Hindawi Publishing Corporationhttpwwwhindawicom Volume 2014
Electrical and Computer Engineering
Journal of
Journal of
Computer Networks and Communications
Hindawi Publishing Corporationhttpwwwhindawicom Volume 2014
Hindawi Publishing Corporation
httpwwwhindawicom Volume 2014
Advances in
Multimedia
International Journal of
Biomedical Imaging
Hindawi Publishing Corporationhttpwwwhindawicom Volume 2014
ArtificialNeural Systems
Advances in
Hindawi Publishing Corporationhttpwwwhindawicom Volume 2014
RoboticsJournal of
Hindawi Publishing Corporationhttpwwwhindawicom Volume 2014
Hindawi Publishing Corporationhttpwwwhindawicom Volume 2014
Computational Intelligence and Neuroscience
Industrial EngineeringJournal of
Hindawi Publishing Corporationhttpwwwhindawicom Volume 2014
Modelling amp Simulation in EngineeringHindawi Publishing Corporation httpwwwhindawicom Volume 2014
The Scientific World JournalHindawi Publishing Corporation httpwwwhindawicom Volume 2014
Hindawi Publishing Corporationhttpwwwhindawicom Volume 2014
Human-ComputerInteraction
Advances in
Computer EngineeringAdvances in
Hindawi Publishing Corporationhttpwwwhindawicom Volume 2014
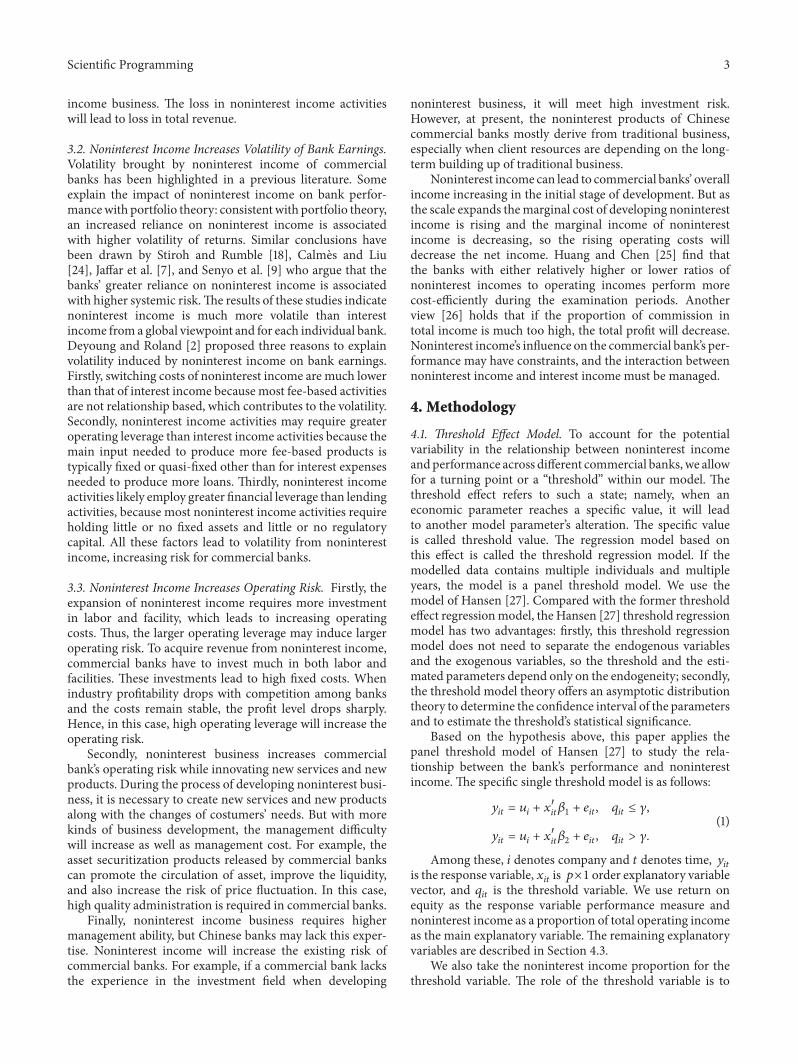
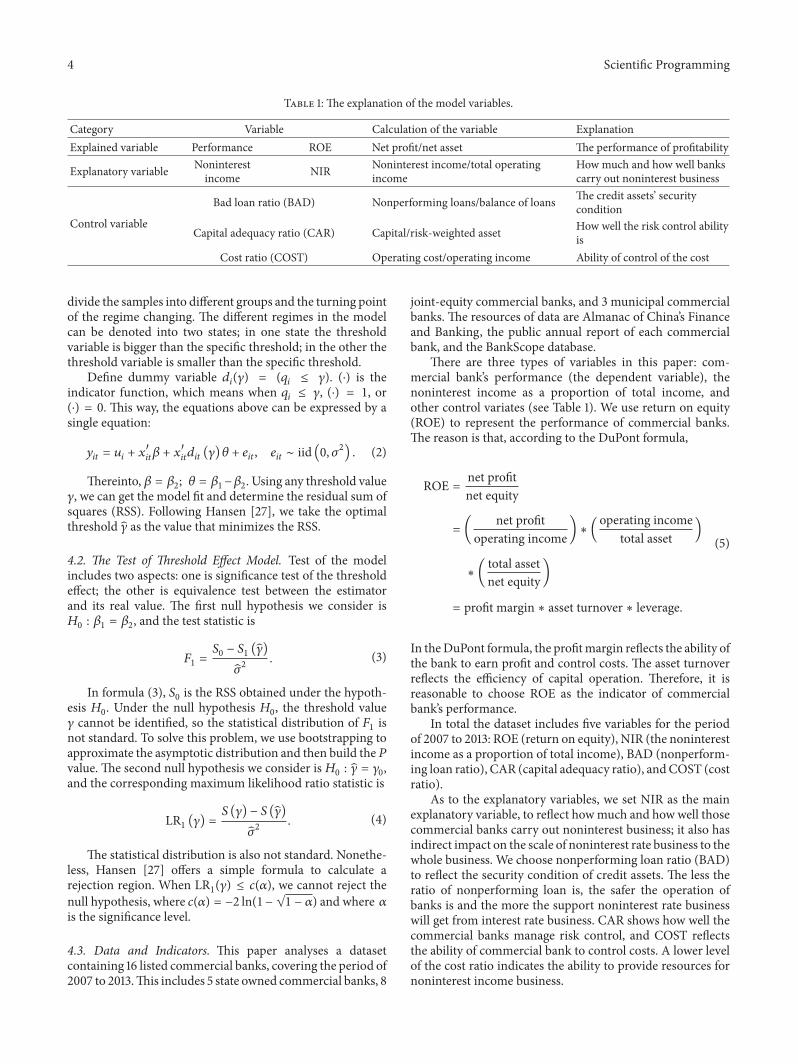
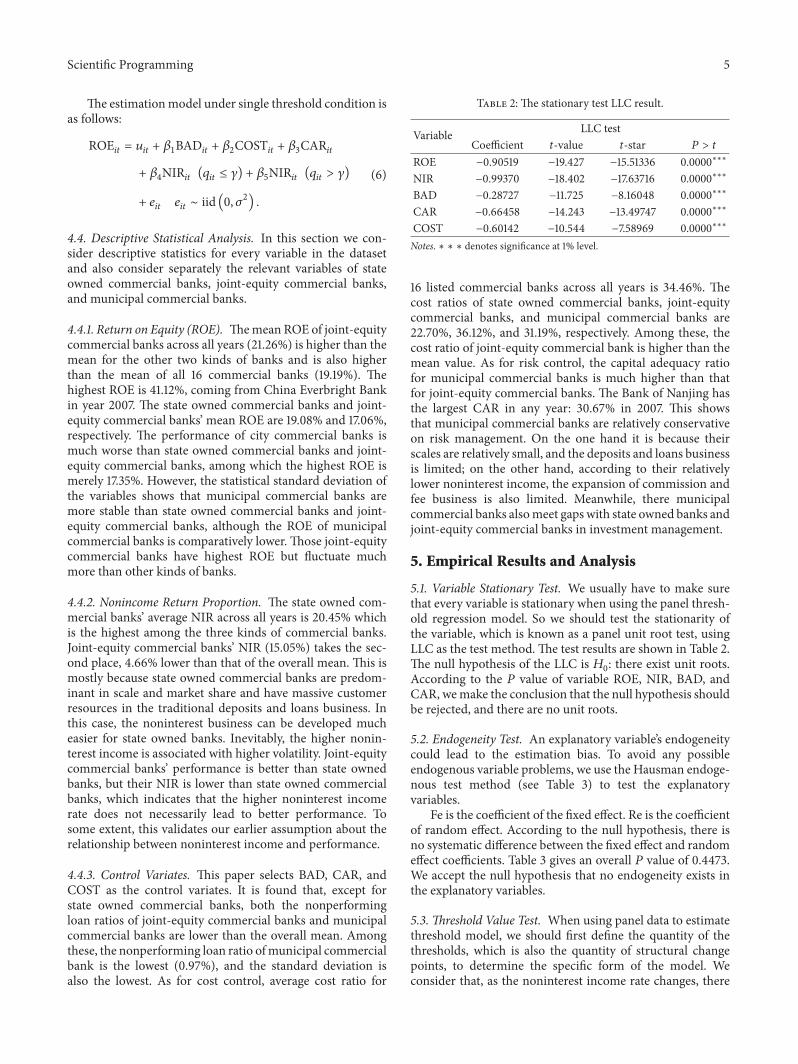
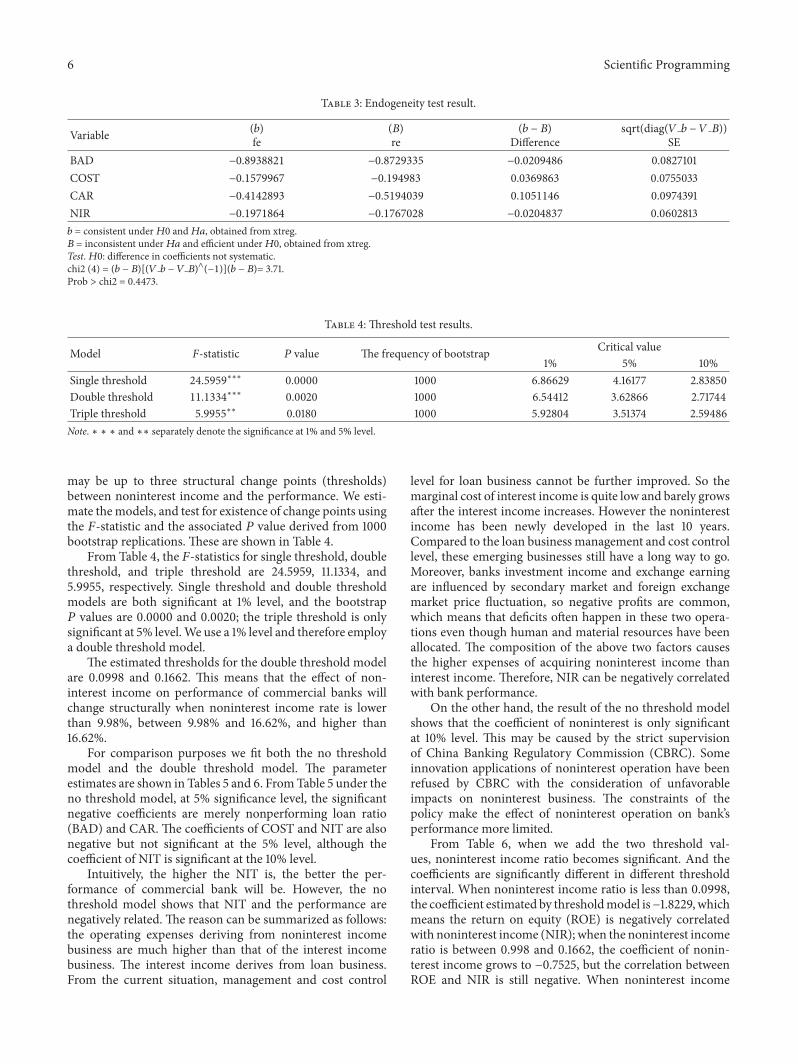
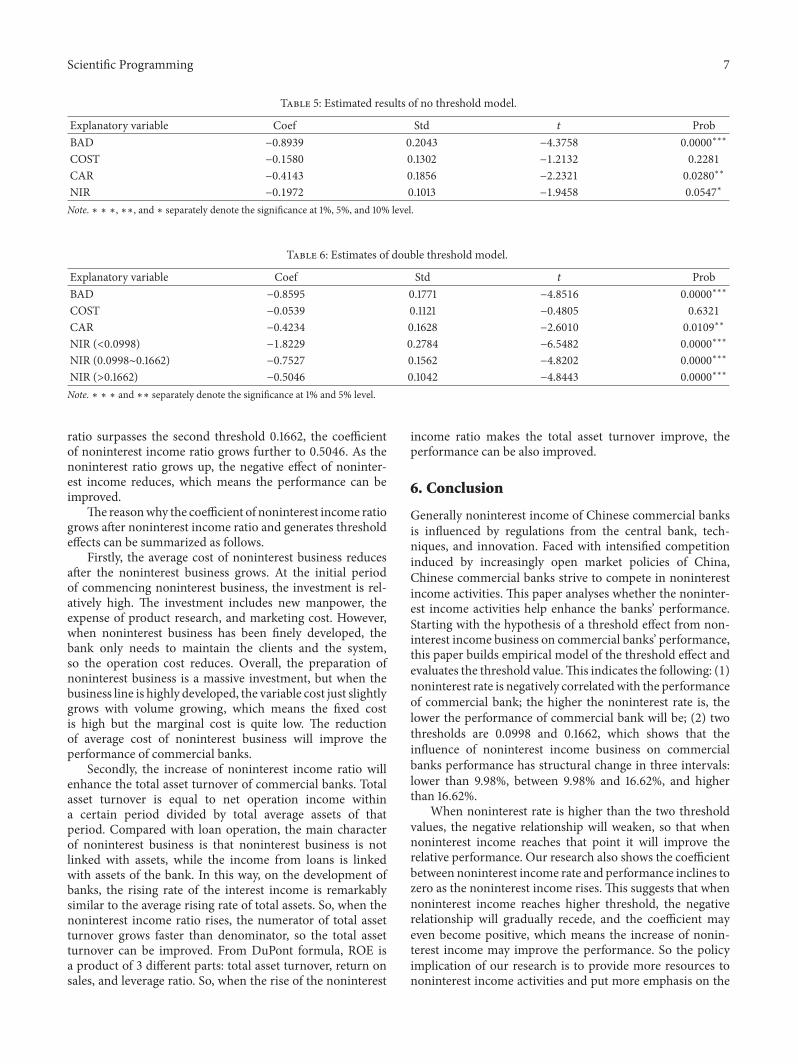


![Operational Efficiency: Process Improvement Opportunities ...€¦ · est income + noninterest income)] of credit unions and banks with between $500 million and $17 billion in assets](https://img.pdfslide.net/doc/110x75/5f8e222444b10129ff7e534d/operational-efficiency-process-improvement-opportunities-est-income-noninterest.jpg)