Embed Size (px)
Citation preview

Noninvasive Realistic Stimulation/Recording of Freely Swimming Weakly
Electric Fish: Movement Detection and Discharge Entropy to Infer Fish
Behavior
Caroline G. Forlim1,2, Reynaldo D. Pinto2
1 Lab. Fenômenos Não-Lineares, Instituto de Física, Universidade de São Paulo – Cx. Postal 66318, 05315-970, São
Paulo, SP, Brazil2 Lab. Neurodinâmica/Neurobiofísica, Instituto de Física de São Carlos/USP - Cx. Postal 369, 13560-970, São Carlos,
SP, Brazil
contact e-mail: [email protected], [email protected]
short title: Realistic Stimulation of Weakly Electric Pulse Fish.
Keywords: Gymnotus carapo, electric organ discharge, weakly electric fish, electrolocation,
electrocommunication, inter pulse interval entropy, long transient behavior when exposed to a new
environment, discrimination between conspecific and random timestamp sequences of stimuli,
electric organ-like discharges, jamming avoidance response, refractory period after detecting a
pulse, novelty response.
Acknowledgements:
This work was supported by the Brazilian agencies: FAPESP, CAPES, and CNPq.
List of abbreviations:
ADC - Analog to Digital ConverterDAC - Digital to Analog ConverterEOD – Electric Organ DischargeIPI – Inter Pulse IntervalLIA - Local Induced AmplitudeJAR - Jamming Avoidance ResponseNR - Novelty ResponsePSTH - Post Stimulus Time Histograms
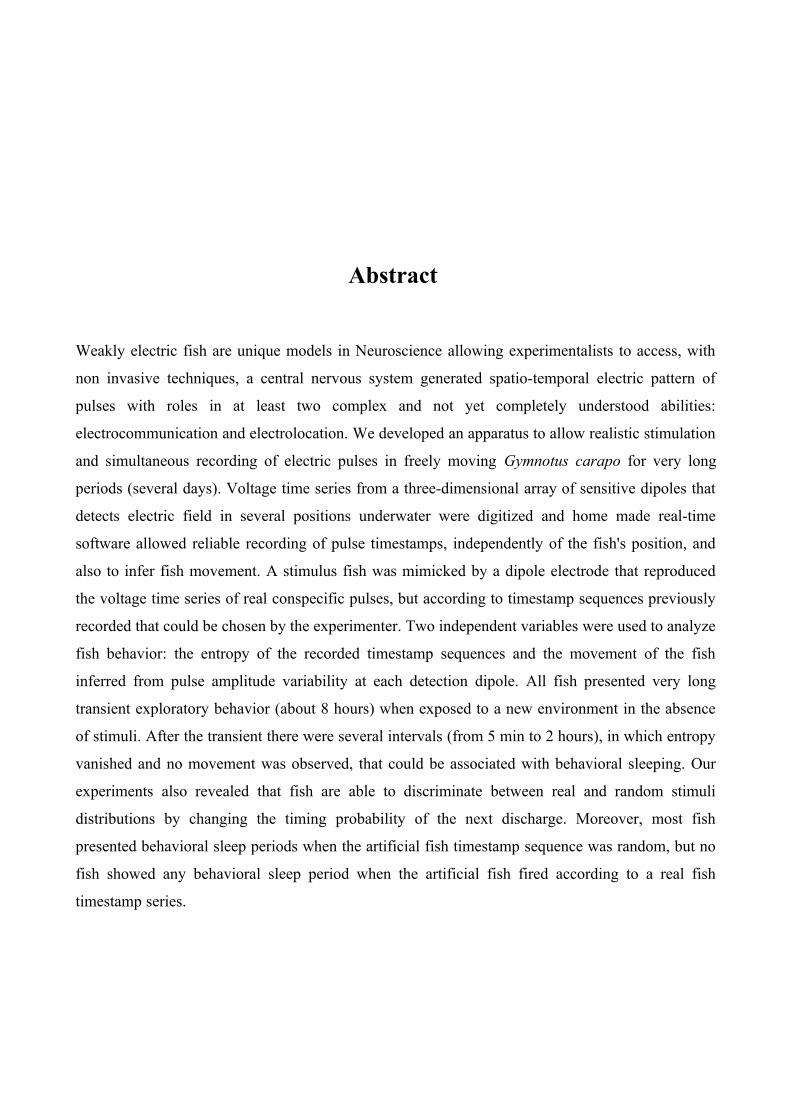
Abstract
Weakly electric fish are unique models in Neuroscience allowing experimentalists to access, with
non invasive techniques, a central nervous system generated spatio-temporal electric pattern of
pulses with roles in at least two complex and not yet completely understood abilities:
electrocommunication and electrolocation. We developed an apparatus to allow realistic stimulation
and simultaneous recording of electric pulses in freely moving Gymnotus carapo for very long
periods (several days). Voltage time series from a three-dimensional array of sensitive dipoles that
detects electric field in several positions underwater were digitized and home made real-time
software allowed reliable recording of pulse timestamps, independently of the fish's position, and
also to infer fish movement. A stimulus fish was mimicked by a dipole electrode that reproduced
the voltage time series of real conspecific pulses, but according to timestamp sequences previously
recorded that could be chosen by the experimenter. Two independent variables were used to analyze
fish behavior: the entropy of the recorded timestamp sequences and the movement of the fish
inferred from pulse amplitude variability at each detection dipole. All fish presented very long
transient exploratory behavior (about 8 hours) when exposed to a new environment in the absence
of stimuli. After the transient there were several intervals (from 5 min to 2 hours), in which entropy
vanished and no movement was observed, that could be associated with behavioral sleeping. Our
experiments also revealed that fish are able to discriminate between real and random stimuli
distributions by changing the timing probability of the next discharge. Moreover, most fish
presented behavioral sleep periods when the artificial fish timestamp sequence was random, but no
fish showed any behavioral sleep period when the artificial fish fired according to a real fish
timestamp series.

Introduction
Weakly electric fish offer an unique opportunity to study and interact with living intact nervous
systems with non-invasive methods since their electric organ discharges (EODs) are not only
complex signals that belong to the processing of environmental sensory information but they are
also easy-to-detect (Lissmann, 1958; Bullock, 1999; Fortune et al., 2006, Engelmann et al., 2008).
The production of electric signal in pulse-type weakly electric fish has two basic components, the
waveform and the timing of the electric pulses (Lissmann, 1958). The pulse waveforms are species-
specific and the inter EOD intervals, or inter pulse intervals (IPIs), can vary from 10 to hundreds of
milliseconds (Caputi, 2004). Each EOD generates electric fields that propagates into the water,
interact with the surroundings, and reach a myriad of electroreceptors disposed to detect changes in
the electric field that cause small alterations in self or conspecific transcutaneous currents (Bullock,
1999; Caputi, 2004).
Fish are able to localize and measure distance of nearby objects with different impedance from that
of the surrounding water by analyzing the alterations suffered in the self-generated electric field, in
a process called active electrolocation (von der Emde et al., 1998, 2008, 2010; Caputi et al., 2002;
von der Emde and Fetz, 2007; Engelmann, 2008). They also perform electrocommunication, in
which one fish's EODs interfere with the other fish's receptors. During this task, each fish emits and
receives self and conspecific generated EODs (Caputi and Budelli, 1995; von der Emde, 1999;
Doiron et al., 2003). Neuroethology of electrolocation and electrocommunication remain as
interesting and active fields of research (Engelmann et al., 2010; Ho et al., 2010; von der Emde et
al., 2010; Cuddy et al., 2011).
In many pulse-type species, such as Gymnotus carapo studied here, the EOD present among
individuals a stereotyped pulse shape with no sexual dimorphism (Caputi et al., 2002). In such
species the electrocommunication must be realized by modulating the IPIs. Moreover, fish can also
vary their IPIs depending on the environmental context: when a new stimulus (light, sound,

electrical field, vibration) is presented a transient acceleration of the EOD rate, called novelty
response (NR) (Post and von der Emde, 1999; Aguilera and Caputi 2002) is triggered. There was
also been reported a mechanism of jamming avoidance response (JAR) in which closer fish slightly
adjust their EOD timing to avoid discharging at the same time and interfere with each others'
electrolocation (Heiligenberg et al., 1978; Capurro e Malta, 2004).
The EODs generate a complex spatio-temporal pattern that is experimentally difficult to deal with
in freely moving fish (Westby, 1975). This is the main reason, in spite of the sensitivity of the fish
IPI patterns to stimuli, environment, and manipulation, many previous experiments to characterize
the electrosensory system were conducted restricting the fish movements. While deeply interfering
with the fish normal behavior and consequently with the informational content of IPIs precluded
studying the social interaction among fish, such experiments were invaluable to the knowledge of
the mechanisms involved in electrolocation (Caputi et al., 2002; Bullock et al. 2005; Hitschfeld et
al. 2009). Studies of electrical interactions between fish were mostly possible in species that
presented, at least during breeding season, an accentuated sexual dimorphism in EOD shape (Wong
and Hopkins, 2007; Perrone et al., 2009) or in cases where specimens with very different sizes were
used (Westby, 1975; Westby, 1979; Arnegard and Carlson, 2005).
In this context we developed an apparatus that allowed non invasive, realistic and controlled
stimulation with the simultaneous recording of electric pulses in freely moving Gymnotus carapo
for very long periods of time (several days). We concentrate our experiments in two different
situations: (1) non stimulated fish; (2) fish receives stimuli from an artificial fish that mimics the
pulse shape of a conspecific. We could successfully address: how long the stress caused by
exposing the fish to a new environment distorts the patterns of electrical activity, the changes in the
electrical activity when exposed to real (conspecific) or random distributions of stimuli IPIs, the
presence of a JAR mechanism, and the use of inferred entropy and movement of the fish to classify
its behavior.

Materials and methods
Animals
Adult specimens, 15-25cm long, of unsexed Gymnotus carapo were acquired from local fishermen
in the state of São Paulo, Brazil. The fish were maintained in individual 30 liter (30x35x30 cm)
unplanted tanks exposed to natural illumination at room temperature and furnished with some
lengths of PVC pipe (hiding places). Water conductivity in all experimental installations was in the
range 100±5 μS/cm, similar to that found in the streams/lagoons where fish are usually captured.
While in the lab, fish were fed twice a week on a variety of living food: small fish, worms, and
artemia salina (brine shrimp). A total of 13 fish were used in the experiments reported, some of
them were recorded several times in different protocols.
All experimental protocols and procedures followed the ethical principles suggested by the Society
for Neuroscience and were approved by the Committee on Ethics in Animal Experimentation of the
Federal University of São Carlos – UFSCar (Protocol number 007/2009).
Measurement aquarium
The experimental setup, totally developed in our laboratory (Pinto et al., 2007, Forlim, 2008, Forlim
et al., 2011) consists of a 64 liters glass aquarium (40 x 40 x 45 cm) (Fig. 1), enclosed in a double
Faraday cage (1 mm aluminum sheets) shielding electrical noise, and two 3,0 cm thick layers of
insulating foam confining a 4,0 cm air layer to attenuate sound waves. Other possible low
amplitude, low frequency mechanic vibrations were attenuated by hanging the whole heavy
apparatus on steel cables attached to the ceiling of the building.
Artificial stimulus generation
A dipole electrode inside a 15 cm PVC pipe was used to generate artificial stimuli mimicking the
geometry of a medium size fish. Artificial fish stimuli were generated by a Digital to Analog
Converter (DAC) board (Digidata 1200B, Axon Instruments, Union City, CA), controlled by real-
time software developed by our research group (Pinto et al., 2001, Nowotny et al., 2006) to mimic a
real Gymnotus carapo EOD waveform, previously stored in a PC compatible computer (Fig. 2A),
and rescaled to a fixed peak amplitude of 5V. Two stimuli timestamp sequences (30 min long)
could be chosen by the experimenter: one pre-recorded from an unstimulated real fish, and one with

random (flat distribution) generated inter-pulse intervals (IPI) in the same range of the real fish
(between 15 and 20 ms).
Figure 1. Measurement aquarium. The experimental setup, developed in our own laboratory, consists on a
64 liters glass aquarium (40x40x45 cm). Two boxes made of fiberboard (MDF, 20 mm thick) were used as
support for the apparatus. A double Faraday cage (1 mm aluminum sheets) shields electrical noise and two
3 cm thick layers of insulating foam confining a 4,0 cm air layer attenuates sound waves. Possible low
amplitude, low frequency mechanic vibrations were attenuated by hanging the whole heavy apparatus on
steel cables attached to the ceiling of the building.
Multi-electrode detection system
Spatio-temporal EOD was measured using a three-dimensional array of 8 electrodes, each one
consisting of a 0.2 mm diameter stainless steel wire tightly inserted through silicone glue, between
glass aquarium's walls, dipping typically 1-2 mm inside the water. The electrodes were placed in a
cubic arrangement (~ 40 cm on a side, Fig. 2A). Signals from seven electrodes were differentialy
amplified (gain = 100x, home-made) using the electrode at the base of the aquarium as a common
reference.
Time series of all differential amplifiers, containing both EOD and artificial stimulus signals, were
digitized at 50 kHz by an analog to digital converter (ADC) board (PCI MIO 16-E1, National
Instruments, Texas) in an acquisition PC compatible computer.

Figure 2. Acquisition and stimulation setup. A- hardware: EODs from real (f) and artificial stimulus (S)
fish are measured using a 3D array of 8 electrodes ((1)-(7), and (R)). Signals are differentially amplified (x
100, (R) is the common reference) and digitized at 50 kHz by an ADC board. The artificial fish is a dipole
electrode inside a 15 cm PVC pipe driven by a DAC output of a computer running real-time home made
stimulation software that mimics a real fish pulse shape with IPIs defined by the experimenter. B-
acquisition software: the square of the digitized artificial signal is delayed (to account for propagation in
water and electronics) and subtracted from the squared and summed electrode signals to separate only real
fish pulses. Real fish EODs are then detected with a simple threshold level and the timestamps and the
amplitude of the pulses at each electrode are stored for posterior analyses.

Acquisition software
Gymnotus carapo generates a multi-phasic EOD pulse (Castelló et al., 2009). A simple way to
detect the timing of an EOD is to determine the occurrence of the major component of the pulse.
However, depending on the fish orientation, the major component can be either negative or positive
in a given electrode, making detection difficult. To overcome this problem our detection software
squared and summed the digitized time series registered by all electrodes, compressing EOD
information in a single time series. By simply comparing the compressed time series with a
threshold level we were able to reliably detect the EODs (Fig. 2B), with a resolution of 20 μs.
For each EOD detected, the program recorded the timestamp of the event and the locally induced
amplitude (LIA) at each electrode, defined here as the difference between the maximum and
minimum values of voltage induced during the EOD.
In experiments with artificial stimulation, a delay was added to the ADC input of the artificial
signal to account for the propagation time through water. Since the ADC input signals from the
electrodes contained both real fish and artificial pulses together, we subtracted the square of the
artificial signal from the sum signal to avoid detecting artificial pulses as real fish ones (Fig. 2B).
The detection software was written in Dasylab graphic language (Dasytech, Germany). Real fish
timestamps, their LIAs, and artificial timestamps were stored in the acquisition computer for
posterior analysis.
Data analyses
Information Theory provides invaluable tools to study neural coding (Borst & Theunissen, 1999).
Here we infer the variability of the timestamp sequences by calculating the entropy H(T) as a
function of time, using a direct method (de Ruyter van Steveninck et al., 1998) adapted to our data
using programs developed in our laboratory.
We analyse the timestamp sequences in T=40 s windows, but the same qualitative results were
found using 20 and 60 seconds windows. The first window spans from 0 to 40 s, the second one
from 20 to 60 s, and so on, maintaining a 20 s time distance between the start of successive
windows (Fig. 3). In a particular window we calculate the probability of observing different EOD
patterns and obtain the entropy from this probability distribution.

To compute the entropy H(T) the time axis was discretized into b sec wide bins. The presence of an
EOD in each bin was represented by 1 and the absence by 0. Thus we encode a sequence of EODs
as a binary string (Fig. 3). The entropy H depends on our choice of b: H = Hb. If b is too small,
most of the bits of our strings will be zero and very few patterns will be found. On the other hand, if
b is too big, most bits will be set to one, leading again to very few patterns. In both cases the low
values of entropy will not satisfactory represent the variability of the data. Hence there must be an
intermediate optimal value of b able to express more correctly the variability of the data. In
agreement with the principle of maximization of entropy (Shannon, 1948), choosing b such that Hb
is a maximum will also produce the least structured set of patterns consistent with the data.
Intuitively, suitable values of b should provide strings with similar amounts of zeros and ones. In
our case, the fish average IPI is about 20-40 ms, hence b should be of the order of 10-20 ms. To
ensure finding the “best” value of b we compute the entropy for b between 3 and 40 ms, in steps of
1 ms.
Figure 3. Binarization and set of patterns for entropy calculations. Time axis is discretized into small
bins. The presence (absence) of an EOD in each bin is represented by 1 (0). Timestamp sequences are
analyzed in bit strings obtained in 40 s windows. Each pattern is a 4 bit word. Starting from the beginning of
the bit string a 4 bit mask is moved one bit to the right to extract a new word until the end of the window,
forming the set of words W = {w1, w2, w3,... , wN}. From the set of probabilities of each word wi we compute
the entropy H(W).

To proceed we have to decide on the length L of patterns, whose probability we are going to
compute. In our analysis each pattern will be represented by a word composed by L=4 bits. For a
given b we start at the very beginning of the corresponding string and using a 4-bit mask we copy
the first 4 bits to the word w1. Then we move the mask one bit to the right and copy the bits to the
word w2 (Fig. 3). This process is repeated until the mask reaches the end of the window. W = {w1,
w2, w3,... , wN} is the set of all words (patterns) from which we compute the probabilities P(w) of
finding each one of the 24 = 16 different words. The entropy of W for that particular value of b is
given by:
To ensure a good statistical estimation of P(w) one should use stationary data and the largest
window length possible. However, the whole timestamp sequences are not stationary (some of them
are several days long), and we want to explore this feature by analyzing changes in the entropy
along the sequence and relate them to the fish behavior. T=40 s was long enough to provide an
average number of words N ~ (40 s / 15 ms) ~ 2500 words, giving a good statistics of P(w) for all
possible 16 words and still capturing the fish behavior in a sub-minute scale.
Besides entropy, the electrical behavior was also characterized using IPI histograms and standard
deviations of the LIAs, all calculated according to their classical definitions and for the same
sequence of 40 s windows used in the entropy computation for direct comparison. To study the
behavior of the fish when stimulated by different distributions of IPIs we built post stimulus time
histograms (PSTHs), where we plotted the experimental probability of a fish EOD occurs
immediately after a stimulus EOD (set as time reference).
The experimental setup allowed us to simultaneously address electrical and locomotor behavior of
the fish. Since LIA at each electrode is strongly sensitive to the fish's position, we used the sum of
standard deviations of these amplitudes to estimate the fish movement in the 40 s windows. The
electrode that presented the maximum pulse amplitude was also used to infer the fish's position and
orientation at each EOD.
Analysis programs were developed in C++ language and Matlab (The Mathworks Inc., Natick, MA)
and ran in free open source Ubuntu Linux 10.04 (Canonical Ltd., London, UK) based AMD64
3200MHz PC-computers or similar. Graphics were designed with Matlab (The MathWorks, Inc.,
Massachusetts, USA) and Gnuplot 4.2 (http://www.gnuplot.info).
H bW =−∑w
Pw log2 P w

Results
Non stimulated fish
To investigate how locomotor and electrical behavior change in long periods we acquired ~ 48 h
continuous data from freely moving non stimulated fish. All acquisitions started immediately after
introducing the fish in the measurement aquarium and were performed in complete darkness. Each
experiment started at a different time of the day. Fish were moved back to the maintenance
aquarium with natural illumination at the end of the experiments.
A transient behavior, characterized by low average values of IPIs (high frequency of EODs) (Fig.
4A), was observed at the beginning of all recordings. After the transient the behavior reached a
stationary state that persisted throughout the experiment: the IPIs distributions oscillated over time
between the same two main peaks: a sharper one corresponding to higher values of IPI and another
one corresponding to lower values of IPI. Between 24 and 48 hours of recording there was a period
of approximately 12 hours with the predominance of the higher IPIs peak (lower frequency),
indicating the influence of a circadian rhythm even with the experiment performed in darkness. In
the beginning of the transient, the IPIs presented a much flatter distribution with a single mean, just
a little higher than the stationary lower IPIs peak. This initial shape of the distribution changed
slowly into the shapes of the stationary state over time, along the transient. The typical transient in
response to the new environment lasted several hours, corresponding to a long relaxation time TR,
defined as the time needed to the IPIs reach the stationary state. For all fish recorded (N = 4) TR =
(10.2 ± 4.8) h. Despite quantitative differences all fish presented a long initial transient and a final
stationary state oscillating between two well defined mean IPIs.
From each experiment data set we also inferred the fish movement by computing the sum of
standard deviations of the LIA at each electrode (Fig. 4B). Since the LIA is inversely proportional
to the fish-electrode distance, if the fish stands still for a certain time, the LIA will be practically the
same from pulse to pulse, providing a low value of standard deviation. Conversely, the amplitude
will change from pulse to pulse at least in a few electrodes in an active moving fish, producing
higher values of standard deviation for those electrodes. By summing the standard deviations over
all electrodes we estimated the fish movement, disregarding its position and direction. Our results
pointed that the fish movement was maximum during the initial transient and evolved to a
stationary state that alternated periods of vigorous activity and absence of movement (Fig. 4B). The
duration of the transient in the movement analysis coincided with that of the transient in EOD
activity.

Figure 4. Non estimulated fish (48 h experiment). A- Sliding window histogram of IPIs versus time. The
histograms are calculated in 40s windows. High probabilities are shown in red and low probabilities in blue.
There is a transient behavior, at the beginning of the recording, characterized by low average values of IPIs.
After 10h the behavior reaches a stationary state that persists throughout the experiment: the IPIs
distributions oscillate over time between the same two main peaks of IPIs. B - Inferred movement versus
time. The fish movement was maximum during the initial transient and evolved to a stationary state that
alternated periods of vigorous activity and total absence of movement. C - Entropy versus time. During the
transient period the entropy presents intermediate values. After the transient, the entropy oscillates between
higher and almost zero values. D – Detail during the transient behavior. Above: Sliding window histogram of
IPIs versus time. Bellow: Inferred movement (black) and entropy (red) versus time. At the beginning of the
transient there are low IPIs values (high EOD frequencies) with constant values of entropy and restless
movement. E- Same as D after habituation to the aquarium. In the stationary state, the IPIs oscillate between
two mean values. Movement and entropy are entrained.

Analysis of EOD patterns entropy along time (Fig. 4C) revealed the same qualitative behaviors
described above. After a long transient period, the entropy followed qualitatively the peaks and
valleys of the locomotor activity: peaks (valleys) of locomotor activity correspond to high (low)
variability of EOD timing.
Comparing the locomotor activity and the entropy along time at the beginning of the transient
(where no absence of movement was found) with those corresponding to the stationary state (were
long periods of absence of movement take place) (Figs. 4D and 4E) we found that the same
qualitative information can be obtained from both signals.
During the transient we found higher and mostly constant values of locomotor activity and entropy.
Along the stationary state both locomotor activity and entropy entrained their peaks and valleys to
clearly express changes in the EOD rhythm. When the IPIs distribution along time was dominated
by the higher IPI mean, both locomotor activity and entropy vanish. Nevertheless, their peaks
reached the same maximum values found during the transient state when the distribution was
dominated by the lower IPI mean.
A more detailed movement analysis, based on the signal of the major component of the EOD pulse
at each electrode, revealed a preference of staying at the bottom of the aquarium, near the walls,
when both locomotor activity and entropy were low (data not shown). No orientation preferences
were noted. Similar qualitative behavior was found for all fish.
Experiments with stimulation
Both locomotor and electrical behavior changed when we suddenly turned on the stimuli: an EOD
timestamp sequence pre-recorded from another (non stimulated) fish (Fig. 5 e 6). By visual
inspection we found that the start/end of the stimulation arouse almost all fish. Most of them,
quickly approached the area near the artificial fish, some tried to bite it or just kept swimming
around. Depending on the fish, the electrical response varied from short or sustained increasing of
frequency, to the absence of EODs for minutes. The most common reaction was the decreasing of
IPI while increasing their variability (Fig. 5, 6A and 6D).

Figure 5. Effect of stimulation in IPIs series. The arrow shows the moment that the stimuli were turned on.
Fish immediately responds to the stimuli by increasing both EOD rate and variability.
To compare the effect of the distinct distributions of stimuli IPIs, a real one (pre-recorded from a
fish without stimulation) and a random (flat) distribution of IPIs between 15 and 20 ms, we used
two protocols, each one consisting on a sequence of 5 sections of 30 min each. The sequence of
sections in one protocol was: control recording (without stimulation) started immediately after
introducing a fish in the measurement aquarium, stimulation with a real distribution of IPIs, control,
stimulation with random distribution of IPIs, and a final control (Fig. 6); while in the second
protocol we inverted the order of presentation of the real and the random stimuli (not shown).

Figure 6. Experiments with stimulation. The protocol was a sequence of 5 sections (30 min each) as follows: control recording (without stimulation), stimulation with a real distribution of IPIs (green bar), control, stimulation with random distribution of IPIs (yellow bar), and a final control. In the analysis windows of 40s were considered. A- Sliding window histogram of IPIs versus time. High (low) probabilities are shown in red (blue). B - Inferred movement, and C - entropy versus time. Fish reacted to both stimuli by decreasing the IPIs values (increasing the EODs frequency) and increasing their variability. During random stimuli (yellow bar) fish presented a slight relaxation with the peak of IPIs tending to higher values over time. The fish was restless moving during the whole experiment with no simple relation to the stimulation sections. The entropy clearly increased (decreased) when both stimuli were turned on (off). D-F - same as A-C but for an experiment performed 2 weeks later with the same individual. Same qualitative behavior was found with the remarkable exception that during the stimulation with a random distribution fish presented several epochs characterized by: very high IPI values, absence of movement, and very low entropy values, characteristics of behavioral sleep that was expected only during control sections.

During stimulation using the first protocol all fish (N=6) presented a persistent increase in the
amplitude of IPI oscillations (typical behavior shown in Fig. 5). All fish showed more discharge
interruptions when submitted to the real than to the random stimuli. Spontaneous brief interruptions
(IPI > 0,1 s) also happened to non stimulated fish. Five animals out of six (83%) responded to the
beginning of all stimuli sections with a transient increase in the EOD frequency. In 3 animals (50%)
the EOD frequency increasing for the real stimuli section was two fold that presented for the
random stimuli section. In a single case (17%) the real stimuli section evoked dozens of discharge
interruptions (~0.5 s each one), but the fish just increased the EOD frequency for the random
stimuli section. Qualitatively similar behavior was obtained for fish (N=3) submitted to the second
(inverted) protocol.
Fish typically reacted differently when submitted to the stimulation protocol for the first time, just a
few days after arriving at the laboratory (Fig. 6 A-C), and after ~ 2 weeks (Fig. 6 D-F). Besides the
usual increasing in the EOD frequency during all the real stimuli sections (green bar in Fig. 6 A,D)
fish presented, two weeks after arriving at the lab, a distinct reaction to the random stimuli sections
(yellow bar in Fig. 6 A, D) by decreasing both EOD frequency and variability. Similar tendency
was found in the locomotor behavior (Fig. 6 B, E), as well as in the entropy (Fig. 6 C, F).
Particularly interesting, two weeks after arriving at the lab, both entropy and movement vanished
for periods of up to 10 min when the EOD frequency decreased at the end of the random stimuli
section (yellow bar in Fig. 6 B,C,E,F). In general, the oscillations on locomotor activity were not
directly related to the stimuli sections. Nevertheless, the entropy was clearly higher when the fish
was stimulated.
To address whether or not fish manifested clear distinctive behavior when submitted to real or
random IPI distributions we built normalized Post Stimulus Time Histograms (PSTH), where we
plotted the experimental probability of a fish EOD occurs immediately after an artificial EOD (set
as time reference), both for real and random IPI stimuli distributions (Fig. 7). After an artificial
EOD from a random stimuli distribution the fish presented a flat EOD probability up to the limit of
the average stimulus IPI (~14 ms, Fig. 7). However, after an artificial EOD from a real stimuli
distribution, the fish EOD probability smoothly dropped in the interval [1, 5] ms and increased in
the interval [6, 12] ms. PSTHs for experiment sections with the real stimuli distribution revealed a
fish preference of firing 3% to 5% of the total number of EODs later than observed in PSTHs for
experiment sections using the random stimuli distribution.
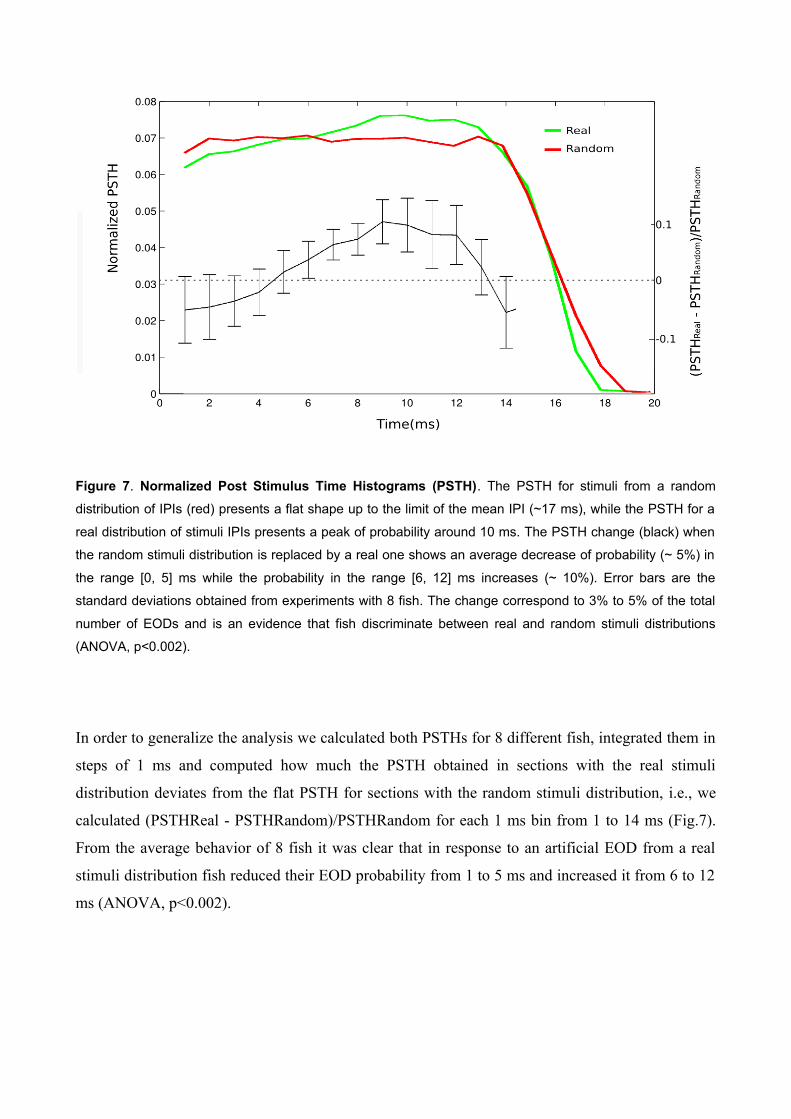
Figure 7. Normalized Post Stimulus Time Histograms (PSTH). The PSTH for stimuli from a random
distribution of IPIs (red) presents a flat shape up to the limit of the mean IPI (~17 ms), while the PSTH for a
real distribution of stimuli IPIs presents a peak of probability around 10 ms. The PSTH change (black) when
the random stimuli distribution is replaced by a real one shows an average decrease of probability (~ 5%) in
the range [0, 5] ms while the probability in the range [6, 12] ms increases (~ 10%). Error bars are the
standard deviations obtained from experiments with 8 fish. The change correspond to 3% to 5% of the total
number of EODs and is an evidence that fish discriminate between real and random stimuli distributions
(ANOVA, p<0.002).
In order to generalize the analysis we calculated both PSTHs for 8 different fish, integrated them in
steps of 1 ms and computed how much the PSTH obtained in sections with the real stimuli
distribution deviates from the flat PSTH for sections with the random stimuli distribution, i.e., we
calculated (PSTHReal - PSTHRandom)/PSTHRandom for each 1 ms bin from 1 to 14 ms (Fig.7).
From the average behavior of 8 fish it was clear that in response to an artificial EOD from a real
stimuli distribution fish reduced their EOD probability from 1 to 5 ms and increased it from 6 to 12
ms (ANOVA, p<0.002).

Discussion
Pulse-type weakly electric fish allow noninvasive access to central nervous system patterns
involved in interesting and not yet completely known tasks: electrolocation and
electrocommunication (Lissman,1958; Heiligenberg, 1991; Bullock, 1999).
However, due to the experimental difficulties of dealing with a complex spatio-temporal electrical
pattern self-generated by a freely moving fish, most work dealt with interaction between fish with
very different pulse amplitudes (Westby, 1975; Arnegard and Carlson, 2005), remarkable progress
has been made by restricting the fish movement (Bell et al., 1974) to obtain a simpler temporal
pattern of stereotyped electric pulses, which is a completely valid simplification for electrolocation
study purposes (Caputi et al., 2002; Bullock et al. 2005; Hitschfeld et al. 2009).
From these important seminal experiments we have learned many details of the pulse generation by
the electric organ of the fish (Bullock et al. 2005), as well as how the detection of self- and
conspecific- generated signals occurs in the sensitive electroreceptor organs in the skin and is path
into the fish brain (Aguilera et al., 2001; Caputi, 2004).
It was also reported that fish usually respond to environmental changes or stimulus (light, electric,
mechanic, vibration) with a transient increasing of electric organ discharge frequency (Kramer,
1994), called novelty response (Post and von der Emde, 1999; Aguilera and Caputi, 2002). This
poses an important question: if the fish produces an electrical pattern that is sensitive to very subtle
perturbations it might also behave in a completely unnatural way while its movements are
restricted, precluding any study of its social interaction through electrocommunication. Moreover,
the stress caused by manipulating a fish, restricting its movements, or simply moving it to a
measurement aquarium could alter the patterns of electrical activity for unknown periods of time.
Recently many advances have been made with new and improved acquisition hardware that allowed
researchers to study fishes freely moving in two dimensional (shallow) water tanks (Perrone et al.,
2009). The response of the fish was also addressed in studies of social interaction between
specimens of a specie that present sexually dimorphic pulse shapes (Wong and Hopkins, 2007;
Perrone et al., 2009), due to the difficulties in splitting the pulses of specimens that present very
similar pulses.

Here we described the development of an apparatus to address several of these issues. By using a
cubic arrangement of electrodes and dedicated real-time software we were able to detect and record
the EOD timestamps of a fish while freely swimming in three dimensions during several days, and
in the absence of external acoustic, electric, light and mechanical noisy stimuli to avoid undesirable
novelty responses. Pulse to pulse variations of the electrical field induced in the electrodes were
also recorded and associated to the fish movement. By calculating the entropy of the fish EOD
pattern we could compare the electrical and the locomotor behavior. A real-time software allowed
us to stimulate the fish in a controlled way, mimicking the pulses of a conspecific but according to a
distribution of IPIs chosen by the experimenter among one pre-recorded from an unstimulated real
fish, and one with a random (flat) distribution. Besides the electrical shielding that is usual in
electrophysiologycal experiments, an efficient acoustic and mechanical insulation was invaluable to
allow good recordings: the sensory system of the fish proved to be so sensitive that even small
perturbations, such as those provided by closing a door in another floor of the building or someone
walking around, were enough to elicit novelty responses.
Our 48h experiments with non-stimulated fish revealed that introducing a fish into a novel
environment (the acquisition aquarium) triggered a transient exploratory behavior characterized by
high entropy and restless movement all around the aquarium. After a long period (the order of 10
hours) a final stationary state with the EODs oscillating between two mean frequencies was
reached. In spite of the experiments been performed in complete darkness we could still see a
circadian modulation in the predominance of such frequencies.
It was not expected that locomotor and electrical behavior (entropy of IPIs patterns) could be
related since electrogenesis and body movements are controlled by different neural systems:
electromotor and skeletomotor command systems (Caputi, 2004). Surprisingly, after the transient
period, movement and entropy were entrained. When the fish is moving, faster updates of the
electrical images are needed, thus the EOD frequency is increased. During the transient period, in
which the fish is stressed and presenting a restless exploratory behavior in the darkness, they need
to update the electrical images as fast as possible, so they fire EODs close to the maximum possible
frequency in an almost periodic fashion. This behavior results in high values of inferred movement
and low values of entropy.
After the transient, when the fish habituate to the environment, they alternate between periods of
vigorous but discontinuous movement resulting in high entropy (NRs elicited by the own random

movement) and periods with lack of movement (very low entropy values). These periods with the
absence of movement and low values of entropy remarkably concentrate in the day-light part of the
circadian rhythm, so we inferred they are indicators of behavioral sleep. This way, entropy and
movement obtained through this non-invasive method could be used to characterize fish sleep in
behavioral experiments.
During stimulation experiments turning on/off the stimulus arouse almost all fish. Most animals
attacked the 'artificial fish', showing the same aggressive behavior presented when two fish are put
together in the same aquarium without hiding places. Usually fish with aggressive behavior also
presented NR while most fish that avoided approaching the stimulus electrode also presented
absence of EODs for periods up to minutes in some cases, according to the dominance/submission
rules found in natural environment between real animals. These are evidences that fish actually
react as if there was a real fish inside the PVC pipe that houses the stimulation electrode.
Both stimuli with real and random distributions of IPIs triggered increases in the EOD frequency,
however we found that the increase due to the beginning of a real stimuli section is bigger than the
increase due to the random stimuli beginning. During the stimulation with the random IPIs
distribution the peak of frequency slowly decays as it happens during the transient period observed
in the recordings with non stimulated fish. In experiments with stimulation the entropy and the
movement were not correlated, except in a few periods of behavioral sleep, in the second time the
fish was exposed to the same protocol.
We also found other differences between the electrical behavior recorded at the first time the fish
was exposed to stimulation, just a few days after arriving at the laboratory, and a second experiment
repeated after two weeks. In the second one, the same fish usually presented more episodes of
behavioral sleep (absence of movement and entropy vanished) during the control non stimulated
sections and sometimes even during the random stimuli section, but never during real stimulation.
The same qualitative behavior was found by using a protocol where the random stimuli was
presented before the real one, indicating the differences observed are due to the nature of the
artificial fish IPIs distributions and not due to a stronger response to the stimuli first presented.
Under stimulation, fish perfomed both electrolocation and electrocommunication, therefore entropy
and movement were mostly not correlated. Moreover, some mechanism of JAR could also be
present. To clarify this issue we compared several fish EOD occurence probabilities immediately

after being exposed to a real or a random stimulus in PSTHs. The probability of an EOD after a
pulse coming from a random distribution of IPIs is constant over time. However, the probability of
an EOD after a stimulus pulse coming from a real distribution of IPIs is slightly reduced (3-5% of
the pulses) for short times and increased for longer times. This result is a clear evidence that fish is
able to discriminate between these two distributions. Moreover, the result obtained with the real
stimuli agrees with those preliminary found in an experiment with two real fish hidden in plastic
pipes (Westby, 1979). We also built PSTHs for both real and random IPIs distributions using finer
time bins (not shown) to analyze the probability around time=0 (coincidences), and there were no
evidences of a JAR mechanism.
It has been already hypothesized that electric fish might separate their own electric pulses from
external ones (Szabo et al, 1975; Caputi and Nogueira, 2012). Recently it was shown, in brain
slices, that spherical neurons at the fast electrosensory path of Gymnotus omarorum have an
intrinsic refractory time of ~10 ms which is about half of the average IPIs in those fish (Nogueira
and Caputi, 2011). In the same work there are also evidences, from chronically implanted fish
experiments, that the animal uses this refractory time to minimize the interference of conspecific
pulses in the sensory pathway. Our PSTH results revealed a preference for discharging after the half
of the average IPI of the conspecific (stimuli from real distribution), which means after the
conspecific refractory period. In other words, our results point that in our experimental conditions
the fish changes the timing of the EOD to be detected by the conspecific that would have to delay
its next EOD to avoid the refractory period of its own spherical neurons.
We propose that a fish estimates the refractory period of a conspecific and choose to discharge
within or out of this period. For example, to electrolocate without been detected it would be
interesting to discharge within the refractory period; whereas to communicate a fish would
discharge out of the conspecific refractory period. If this is the case, one must take in account both
refractory periods when analyzing communication between fish.
To confirm this hypotheses and to estimate the refractory period in freely moving fish Gymnotus
carapo, we are currently planning real-time experiments in which stimulus pulses will be delivered
according to the fish's own EODs, as well as experiments with two fish in the same tank and
software techniques to classify and split their pulses.

References
Aguilera P.A., Castelló, M.E., Caputi, A.A. (2001). Electroreception in Gymnotus carapo: differences between self-generated and conspecific-generated signal carriers. J. Exp. Biol. 204, 185-98.
Aguilera, P.A., Caputi A.A. (2002). Electroreception in G. carapo: detection of changes in waveform of the electrosensory signals. J. Exp. Biol. 206, 989-998.
Arnegard, M.E., Carlson, B.A. (2005). Electric organ discharge patterns during group hunting by a mormyrid fish. Proc Biol Sci. 272, 1305-14.
Bell, C.C., Myers, J.P., Russell, C.J. (1974). Electric Organ Discharge Patterns during Dominance Related Behavioral Displays in Gnathonemus petersii Mormyridae). J Comp Physiol. 92, 201-228.
Borst, A., Theunissen, F.E. (1999). Information theory and neural coding. Nature neurosci. 2, 947-57.
Bullock, T.H. (1999). The future of research on electroreception and electrocommunication. J. Exp. Biol. 202, 1455-8.
Bullock T.H., Hopkins, C.D., Popper, A.N., Fay, R.R. (2005). Electroreception. Springer, 467p.
Capurro, A., Malta, C.P. (2004). Noise autocorrelation and jamming avoidance performance in pulse type electric fish. Bull Math Biol. 66, 885-905.
Caputi, A., Budelli, R. (1995). The electric image in weakly electric fish: I. A data-based model of waveform generation in Gymnotus carapo. J Comp Neurosci. 2, 131-47.
Caputi, A.A., Castelló, M.E., Aguilera, P,, Trujillo-Cenóz O. (2002). Electrolocation and electrocommunication in pulse gymnotids: signal carriers, pre-receptor mechanisms and the electrosensory mosaic. J Physiol Paris. 96, 493-505.
Caputi, A.A. (2004). Contributions of electric fish to the understanding of sensory processing by reafferent systems. J Physiol. Paris 98, 81-97.
Caputi, A. A. and Nogueira, J. (2012). Identifying Self- and Nonself-Generated Signals: Lessons from Electrosensory Systems. In: López-Larrea C, editor. Sensing in Nature, Springer, in press.
Castelló, M.E., Rodríguez-Cattáneo, A., Aguilera, P.A., Iribarne, L., Pereira, A.C., Caputi, A.A. (2009). Waveform generation in the weakly electric fish Gymnotus coropinae (Hoedeman): the electric organ and the electric organ discharge. J Exp Biol. 212, 1351-64.

Cuddy, M., Aubin-Horth, N., Krahe, R. (2011) Electrocommunication behaviour and non invasively-measured androgen changes following induced seasonal breeding in the weakly electric fish, Apteronotus leptorhynchus. Horm. Behav., in press [Epub ahead of print].
Doiron, B., Chacron, M.J., Maler, L., Longtin, A, Bastian, J. (2003). Inhibitory feedback required for network oscillatory responses to communication but not prey stimuli. Nature 421, 539-543.
von der Emde G., Schwarz S., Gomez, L., Budelli, R., Grant, K. (1998). Electric fish measure distance in the dark. Nature 395, 890-4.
von der Emde G. (1999). Active electrolocation of objects in weakly electric fish. J Exp Biol. 202, 1205-15.
von der Emde, G., Fetz, S. (2007). Distance, shape and more: recognition of object features during active electrolocation in a weakly electric fish. J. Exp. Biol. 210, 3082-95.
von der Emde, G., Amey, M., Engelman, J., Fetz, S., Folde, C., Hollmann, M., Metzen, M., Pusch, R.J. (2008) Active electrolocation in Gnathonemus petersii: behaviour, sensory performance, and receptor systems. J. Phisiol. Paris 102, 279-90.
von der Emde, G., Behr, K,, Bouton, B., Engelmann, J., Fetz, S., Folde, C. (2010). 3-Dimensional Scene Perception during Active Electrolocation in a Weakly Electric Pulse Fish.Front Behav Neurosci. 28, 4:26.
Engelmann, J., Bacelo, J., Metzen, M., Pusch, R., Bouton, B., Migliaro, A., Caputi, A.A., Budelli, R., Grant, K., von der Emde, G. (2008). Electric imaging through active electrolocation:implication for the analysis of complex scenes. Biol Cybern 98, 519–539.
Engelmann, J., Gertz, S., Goulet, J., Schuh, A., von der Emde, G. (2010). Coding of stimuli by ampullary afferents in Gnathonemus petersii. J Neurophysiol. 104, 1955-68.
Forlim, C. G. (2008). Estudo experimental da eletrocomunicação em peixes de campo elétrico fraco da espécie Gymnotus carapo - uma aplicação da Teoria da Informação (Experimental study of electrocommunication in weakly electric fish from the Gymnotus carapo species - an application of Information Theory), Master's thesis, Institute of Physics, University of São Paulo, 44 pages, available at: http://www.teses.usp.br/teses/disponiveis/43/43134/tde-23102008-193008/en.php
Forlim, C. G., Rodrigues, L.B., Pinto, R.D. (2011). Neural coding tools, based on Information Theory, applied to discrete time series: from electrophysiology to neuroethology. BMC Neuroscience 12(Supl 1), P253.
Fortune, E. S., Rose, G. J., Kawasaki, M. (2006): Encoding and processing biologically relevant temporal information in electrosensory systems. J Comp Physiol A Neuroethol Sens Neural Behav Physiol. 192, 625-35.

Heiligenberg, W (1991). Recent Advances in the Study of Electroreception, Curr Opin Neurobiol, 1, 187–191.
Heiligenberg, W., Baker, C., Bastian, J. (1978). The jamming avoidance response in gymnotoid pulse-species: A mechanism to minimize the probability of pulse-train coincidence. J Comp Physiol. 124, 211-224.
Hitschfeld, E.M., Stamper, S.A., Vonderschen, K., Fortune, E.S., Chacron, M.J. (2009). Effects of Restraint and Immobilization on Electrosensory Behaviors of Weakly Electric Fish- Ilar J. 50, 361-72.
Ho,W.W., Fernandes, C.C., Alves-Gomes, J.A., Smith, G.T. (2010). Sex differences in the electrocommunication signals of the electric fish Apteronotus bonapartii. Ethology 116,1050–1064.
Kramer, B. (1994). Communication Behavior and Sensory Mechanisms in Weakly Electric Fishes. Advances in the Study of Behavior 23, 233-270.
Lissman, H.W. (1958). On the function and evolution of electric organs in fish. J.Exp.Biol. 35,156-191
Nogueira, J., Caputi, A.A. (2011). Timing actions to avoid refractoriness: a simple solution for streaming sensory signals. PLoS One 6, e22159.
Nowotny, T., Szücs, A., Pinto, R.D., Selverston, A.I. (2006). StdpC: A modern Dynamic Clamp. J Neurosci Methods 158, 287-99.
Perrone, R., Macadar, O., Silva, A. (2009). Social electric signals in freely moving dyads of Brachyhypopomus pinnicaudatus. J Comp Physiol. A 195, 501-14.
Pinto RD, Elson RC, Szücs A, Rabinovich, M.I., Selverston, A.I., Abarbanel, H.D. (2001). Extended Dynamic Clamp: controlling up to four neurons using a single desktop computer and interface. J Neurosci Methods. 108, 39-48.
Pinto, R.D., Forlim, C.G., Carelli, P.V. (2007). A nonlinear approach to the information processing using intervals between electric organ discharges of the weakly electric fish Gymnotus carapo. In: 37th Annual meeting Society for Neuroscience. Program No. 211.20/JJJ7. 2007 Neuroscience Meeting Planner. San Diego, CA: Society for Neuroscience, Online.
Post, N., von der Emde, G. (1999). The “novelty response” in an electric fish: response properties and habituation. Physiol Behav. 68, 115-28.
de Ruyter van Steveninck, R.R., Lewen, G.D., Strong, S.P., Koberle, R., Bialek, W. (1998). Reproducibility and variability in neural spike trains. Science 275, 1805-8.
Shannon, C. E. (1948). A mathematical theory of communication. Bell Systems Tech J 27, 379-423.

Szabo, T. Sakata,H., Ravaille,M. (1975). An electrotonically coupled pathway in the central nervous system of some teleost fish, gymnotidae and mormyridae. Brain Research 95, 459-474.
Westby, G. W. (1975). Comparative studies of the aggressive behaviour of two gymnotid electric fish (Gymnotus carapo and Hypopomus artedi). Animal behaviour 23, 192-213.
Westby, G. W. (1979). Electrical Communication and Jamming Avoidance Between Resting Gymnotus carapo. Behav. Ecol. Sociobiol. 4, 381-393.
Wong, R.Y,, Hopkins, C.D. (2007). Electrical and behavioral courtship displays in the mormyrid fish Brienomyrus brachyistius. J Exp Biol. 210, 2244-52.