Embed Size (px)
Citation preview

Nonlinear Dynamics of Group Dynamics: Models from Mathematical Sociology
Barbara F. MeekerProfessor Emerita
Sociology DepartmentUniversity of Maryland
College Park, MD
SCTPLS Baltimore July 2012

Outline
• I: Leik and Meeker’s adaptation of the Lotka-Volterra model of species competition
• II: Discussion groups and inequality• III: Application of model to data from 4-person
discussion groups

Part I: Lotka-Volterra Model and Leik-Meeker Adaptation
• Each of two species must compete for resources within an ecological niche, and also must reproduce. The larger the population, the more it can reproduce but also the more it uses up food. Using up food reduces the resources available for the species itself and also for the other species.
Source: Lotka, 1932

Parameters and variables
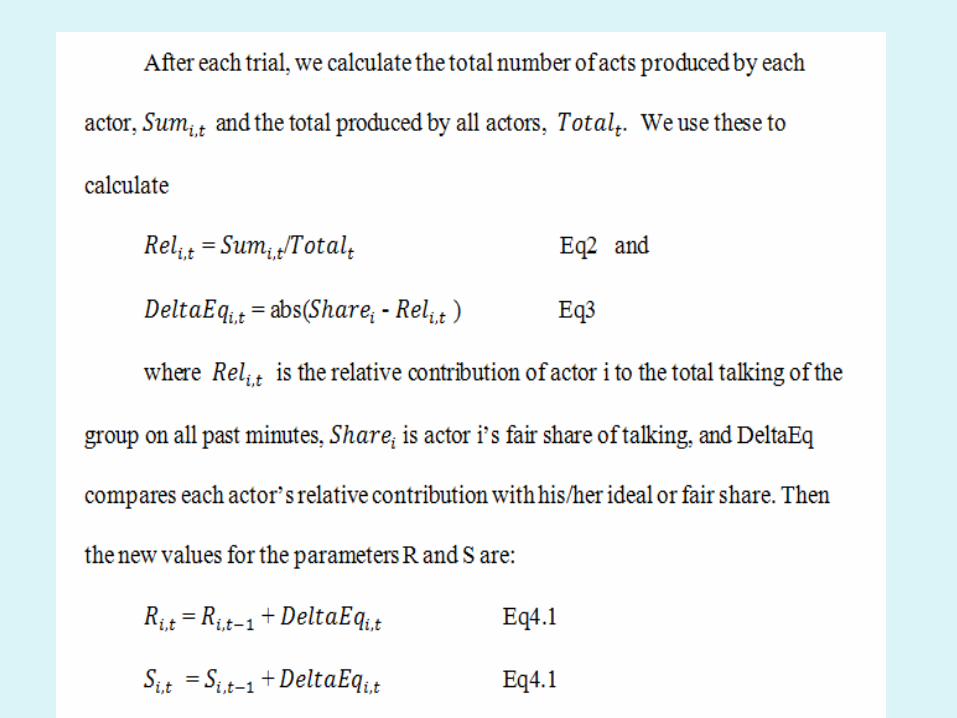
• O (output) by #1 or #2, at time t• R (Reactivity) output limited by Other’s acts• S (Self-limitation) output limited by own acts• C (Constant) stable rate of growth
)C+O*S-O*R(-O+O=O 11-t1,11-t2,11-t1,1-t1,t1, ( 1 ))C+O*S-O*R(-O+O=O 21-t2,21-t1,21-t2,1-t2,t2, ( 2 )
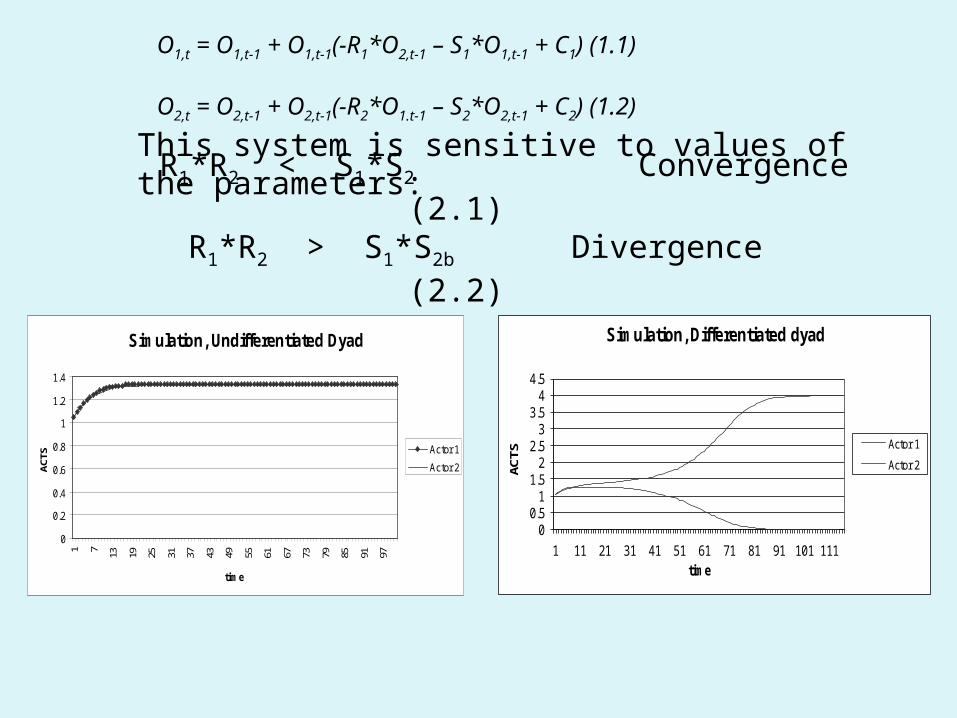
R1*R2 < S1*S2 Convergence (2.1)R1*R2 > S1*S2b Divergence (2.2)
This system is sensitive to values of the parameters:
O1,t = O1,t-1 + O1,t-1(-R1*O2,t-1 – S1*O1,t-1 + C1) (1.1)
O2,t = O2,t-1 + O2,t-1(-R2*O1.t-1 – S2*O2,t-1 + C2) (1.2)
Simulation, Undifferentiated Dyad
0
0.2
0.4
0.6
0.8
1
1.2
1.4
1 7 13 19 25 31 37 43 49 55 61 67 73 79 85 91 97
time
AC
TS
Actor 1
Actor 2
00.5
11.5
22.5
33.5
44.5
1 11 21 31 41 51 61 71 81 91 101 111
ACTS
time
Simulation, Differentiated dyad
Actor 1
Actor 2

Leik and Meeker’s use of Lotka-Volterra
• Actors are participants in a group• Output is amount of task behavior (e.g., talking)
per time unit• Limits are time (only one person can talk at once)
and task saturation (the overflowing in-box)• Constant is stable individual trait (e.g.
talkativeness)• In Addition: Assumes
– All actors must contribute something– actors seek to maintain a ‘fair’ ratio of ‘output’

Leik-Meeker Model References "Computer Simulation for Exploring Theories: Models of Interpersonal Cooperation and Competition" R. K. Leik and B. F. Meeker Sociological Perspectives. 1995, 38:463-482. "Exploring Nonlinear Path Models via Computer Simulation" R. K. Leik and B. F. Meeker Social Science Computer Review 1996, 14:253-268. "Uses of Computer Simulation for Theory Construction: An Evolving Component of Sociological Research Programs" B. F. Meeker and R. K. Leik, Pp 47-70 in Status, Network and Structure: Theory Construction and Theory Development., edited by Jacek Szmatka, John Skvoretz and Joseph Berger; Stanford Univ. Press. 1997 "Some Philosophy of Science Problems in the Development of Complex Computer Simulations" chapter in The Growth of Social Knowledge: Theory, Simulation, and Empirical Research in Group Processes edited by Jacek Szmatka, Michael J. Lovaglia, and Kinga Wysienska, Praeger, Westport, CT 2002.

II: Discussion groups and Inequality
• Discussion groups are ubiquitous• They are important• They have been studied for decades• They show regular patterns of inequality of
participation• Which are related to influence within the
group

Supreme Court
Upholds Obamacare
U Va Board of Regents Fires President
Two Drug Makers Near Agreement on
Merger
U.N. Team Reports on Attack
on Syrian Village
Collusion Among Bankers
Alleged
Guilty Verdict in Hit-and-Run Case
Are Discussion Groups Important?

Photos: B. Meeker
Pictures of two discussion groups
Group 15 2H2L M
0.00
1.00
2.00
3.00
4.00
5.00
6.00
7.00
1 3 5 7 9 11 13 15 17 19 21 23 25 27 29 31 33 35 37 39 41 43 45 47
time
top
2nd
3rd
4th
Group 8 2H2L F
0
1
2
3
4
5
6
1 3 5 7 9 11 13 15 17 19 21 23 25 27 29 31 33 35 37 39 41 43 45 47
Minutes
top
2nd
3rd
4th
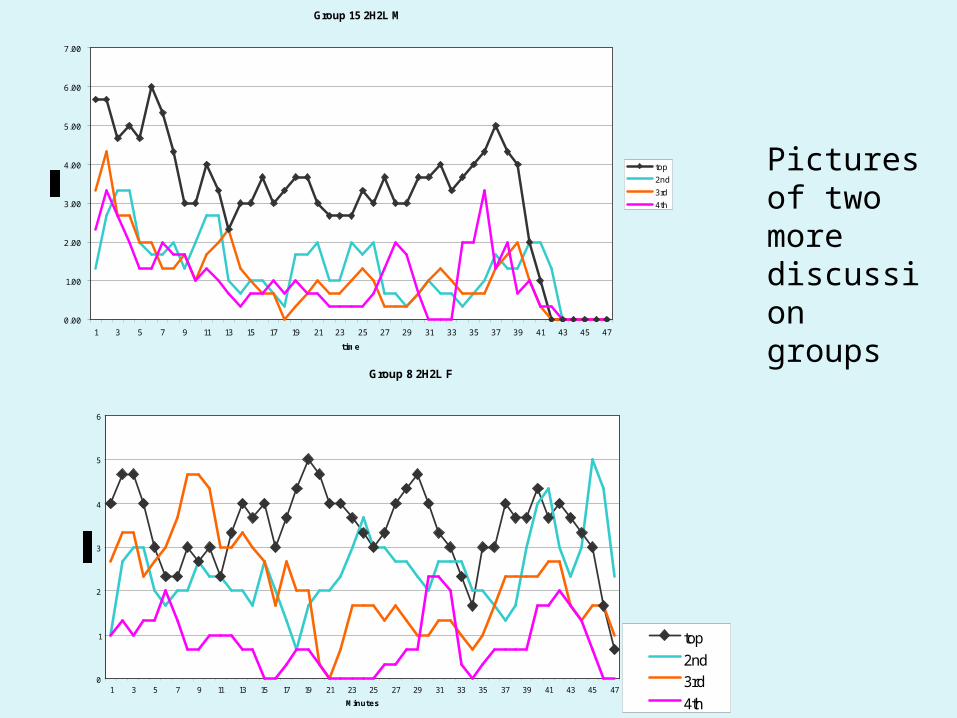
Pictures of two more discussion groups
Bales, Robert F. . 1952 "The Equilibrium Problem in Small Groups" in T. Parsons, T., R. F. Bales and E. A. Shils, eds, Working Papers in the Theory of Action, , Glencoe, Ill: The Free Press. Also, Pp. 444-476 in Small Groups, rev ed., 1965,edited by A. P. Hare, E. F. Borgatta and R. F. Bales. N. Y.: Alfred A. Knopf. Chase, Ivan D. 1980. "Social Process and Hierarchy Formation in Small Groups: A Comparative Perspective" American Sociological Review 45:905-924. Fararo, Thomas J. and John Skvoretz. 1988. "Dynamics of the Formation of Stable Dominance Structures" Pp. 327-350 in Status Generalization: New Theory and Research edited by M. Webster and M. Foschi, Palo Alto, CA: Stanford Univ. Press. Fisek, M. Hamit. 1974. "A Model for the Evolution of Status Structures in Task-oriented Discussion Groups." Pp. 53-83 in Expectation States Theory: A Theoretical Research Program. edited by J. Berger, T. L. Conner, and M. H. Fisek. Cambridge, MA: Winthrop. Fisek, M. Hamit, Joseph Berger, and Robert Z. Norman. 1991. "Participation in Homogeneous and Heterogeneous Groups: A Theoretical Integration." American Journal of Sociology. 97:114-142. Goetsch, G. G. and David D. McFarland. 1980. "Models of the Distribution of Acts in Small Discussion Groups." Social Psychology Quarterly. 43:173-83. Horvath, W. J. 1964. "A Mathematical Model of Participation in Small Groups." Behavioral Science. 10:164-166. Kadane, J. B. and Gordon Lewis. 1969. "The Distribution of Participation in Group Discussions: An Empirical and Theoretical Reappraisal" American Sociological Review 34: 710-722. Leik, Robert K. 1967. "The Distribution of Acts in Small Groups." Sociometry. 30:280-299. Leik, Robert K. and Barbara F. Meeker. 1975. Mathematical Sociology. Englewood Cliffs, N. J.: Prentice-Hall.
Leik, R. K. and B. F.Meeker (1995) "Computer Simulation for Exploring Theories: Models of Interpersonal Cooperation and Competition" Sociological Perspectives. 38:463-482.
Lotka, A. J. 1932. "The Growth of Mixed Populations: Two Species Competing for the Common Food Supply".Journal of the Washington Academy of Sciences. 21:461-469. Meeker, Barbara, 2002,“Getting In Each Other’s Way? Some Mathematical Aspects of Interaction In Small Groups” Presented at Group Processes Session, American Sociological Association Annual Meetings 2002
Skvoretz, John V. 1988. "Models of Participation in Status Differentiated Groups." Social Psychology Quarterly 51:43-57. Skvoretz, John and Thomas J. Fararo. 1996. "Status and Participation in Task Groups: A Dynamic Network Model" American Journal of Sociology 101: 1366-1414.
Skvoretz, J., M. Webster, and J. Whitmeyer. 1999. Status Orders in Task Discussion Groups. Advances in Group Processes 16: 199-218.
Smith-Lovin, Lynn and Charles Brody. 1989. "Interruptions in Group discussions: The Effects of Gender and Group Composition" American Sociological Review. 54: 424-435. Smith-Lovin, Lynn, John V. Skvoretz, and Charlotte Hudson. 1986. "Status and Participation in Six-Person Groups: a Test of Skvoretz's Comparative Status Model." Social Forces 64:992-1005. Stephan, F. and E. G. Mishler. 1952. "The Distribution of Participation in Small Groups: An Exponential Approximation." American Sociological Review. 17:598-608.
Strodtbeck, Fred L. and Richard D. Mann 1956 “Sex Role Differentiation in Jury Deliberations” Sociometry, 19,: 3-11
40 Years of mathematical models
IIIa. Data from 4-person discussion groups• Data from John Skvoretz, Murray Webster,
and Joseph Whitmeyer (supported by NSF)• videotapes and coded data from 50 4-member
groups• univ undergraduates, previously
unacquainted, same gender (80% of groups are female)
• task: a ‘survival’ problem: rank order 15 items according to usefulness in a fallout shelter. Talk until consensus, up to 45 minutes

Variables• Indep: 3 conditions of ‘status
differentiation’, operationalized by class standing (1st year vs 4th year)– 4 equal (all ‘low’) n=17– 2 High, 2 Low n=16– 1 High, 3 Low n=17
• Dependent: Number of acts per minute

Group 15 2H2L M
0.00
1.00
2.00
3.00
4.00
5.00
6.00
7.00
1 3 5 7 9 11 13 15 17 19 21 23 25 27 29 31 33 35 37 39 41 43 45 47
time
top
2nd
3rd
4th
Group 8 2H2L F
0
1
2
3
4
5
6
1 3 5 7 9 11 13 15 17 19 21 23 25 27 29 31 33 35 37 39 41 43 45 47
Minutes
top
2nd
3rd
4th
Pictures of two more discussion groups


IIIb: Extension of Model to four actors


TopHi C=.5 .4 .3 .2Share .40 .20 .20 .20:add 1 1 1 1
Equal .C=5 .4 .3 .2 share .25 .25 .25 .25 Add 1 1 1 1
TopLo C=.5 1.0 .3 .2 r share .4 .2 .2 .2 Add 1 3 1 1

Actual Data

X1= 3.0000 R1=0.0500 S1=0.0700 C1=0.5000X2= 3.0000 R2=0.0500 S2=0.0700 C2=0.4000X3= 3.0000 R3=0.0500 S3=0.0700 C3=0.3000X4= 3.0000 R4=0.0500 s4=0.0700 C4=0.2000 R1Eq S1Eq C1Fix|R2Eq S2Eq C2Fix|R3Eq S3Eq C3Fix|R4Eq S4Eq C4FixModel is Interactive/OthersOutput is Current/No Delay/N= 4/Up,Dn halffair share is 0.40 0.20 0.20 0.20Add to Output #1 #2 #3 #4 1.00 3.00 1.00 1.00

In words
• For each minute, we predict that on that minute, each actor will talk as many times as he/she did the previous minute, plus or minus that amount times a factor based on how much others have already talked that minute, how much the actor talked the previous minute and a constant representing talkativeness.
• The effect of own and others’ previous minute’s talking increases if the actor’s total share for all minutes departs from the standard of fairness

What have we learned?
• Model reproduces differences between group types in the pattern and amount of differentiation
• Very sensitive to group members’ relative talkativeness and expectation for fair share of talking
• Need better theories of ‘contributive justice’


Average total number of acts for each actor in the first 27 minutes of groupdiscussion by type of group.
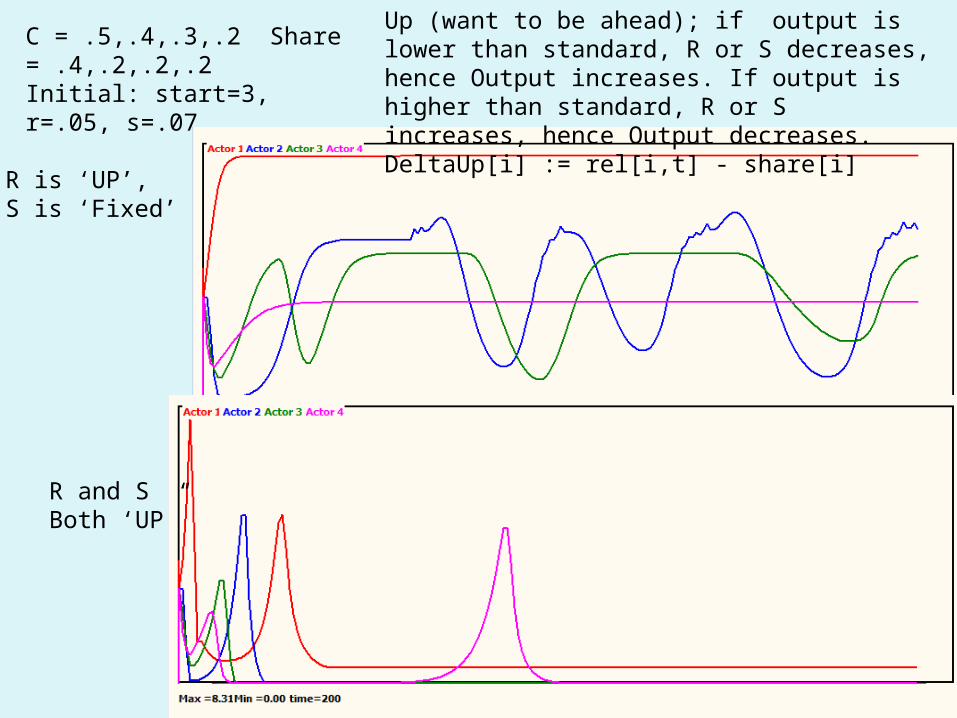
C = .5,.4,.3,.2 Share = .4,.2,.2,.2Initial: start=3, r=.05, s=.07
R is ‘UP’, S is ‘Fixed’
R and SBoth ‘UP”
Up (want to be ahead); if output is lower than standard, R or S decreases, hence Output increases. If output is higher than standard, R or S increases, hence Output decreases. DeltaUp[i] := rel[i,t] - share[i]


![Meeker Genealogy - · PDF fileMeeker Genealogy 4 FEB 2000 1 ... Timothy stated in his pension application that "he ... Anna (Annie) Meeker[17], daughter of Jonas Meeker Jr. and Charity](https://img.pdfslide.net/doc/110x75/5a76a0367f8b9aea3e8d6600/meeker-genealogy-a-meeker-genealogy-4-feb-2000-1-timothy-stated-in-his.jpg)


![Mary meeker preso[1]](https://img.pdfslide.net/doc/110x75/553899da550346bf308b47e6/mary-meeker-preso1.jpg)