Embed Size (px)
Citation preview
1 American Institute of Aeronautics and Astronautics
Nonlinear Finite Element Analysis of a Composite Non-Cylindrical Pressurized Aircraft Fuselage Structure
Adam Przekop1
Analytical Mechanics Associates, Inc., Hampton, VA 23666
and
Hsi-Yung T. Wu2 and Peter Shaw3 Boeing Research & Technology, The Boeing Company, Huntington Beach, CA 92647
The Environmentally Responsible Aviation Project aims to develop aircraft technologies enabling significant fuel burn and community noise reductions. Small incremental changes to the conventional metallic alloy-based ‘tube and wing’ configuration are not sufficient to achieve the desired metrics. One of the airframe concepts that might dramatically improve aircraft performance is a composite-based hybrid wing body configuration. Such a concept, however, presents inherent challenges stemming from, among other factors, the necessity to transfer wing loads through the entire center fuselage section which accommodates a pressurized cabin confined by flat or nearly flat panels. This paper discusses a nonlinear finite element analysis of a large-scale test article being developed to demonstrate that the Pultruded Rod Stitched Efficient Unitized Structure concept can meet these challenging demands of the next generation airframes. There are specific reasons why geometrically nonlinear analysis may be warranted for the hybrid wing body flat panel structure. In general, for sufficiently high internal pressure and/or mechanical loading, energy related to the in-plane strain may become significant relative to the bending strain energy, particularly in thin-walled areas such as the minimum gage skin extensively used in the structure under analysis. To account for this effect, a geometrically nonlinear strain-displacement relationship is needed to properly couple large out-of-plane and in-plane deformations. Depending on the loading, this nonlinear coupling mechanism manifests itself in a distinct manner in compression- and tension-dominated sections of the structure. Under significant compression, nonlinear analysis is needed to accurately predict loss of stability and post-buckled deformation. Under significant tension, the nonlinear effects account for suppression of the out-of-plane deformation due to in-plane stretching. By comparing the present results with the previously published preliminary linear analysis, it is demonstrated in the present paper that neglecting nonlinear effects for the structure and loads of interest can lead to appreciable loss in analysis fidelity.
1 Engineer 5, c/o NASA Langley Research Center, Mail Stop 190, 8 West Taylor Street, Hampton, VA 23681, Senior Member
AIAA. 2 Associate Technical Fellow, The Boeing Company, MC H017-D601, 5301 Bolsa Avenue, Huntington Beach, CA 92647. 3 Senior Analysis Engineer, The Boeing Company, MC H017-D601, 5301 Bolsa Avenue, Huntington Beach, CA 92647.
https://ntrs.nasa.gov/search.jsp?R=20140007303 2018-06-28T08:58:59+00:00Z
2 American Institute of Aeronautics and Astronautics
I. Introduction he primary structural concept being pursued as an important component of next generation airframe technology under the Environmentally Responsible Aviation (ERA) Project at NASA is the Pultruded Rod Stitched
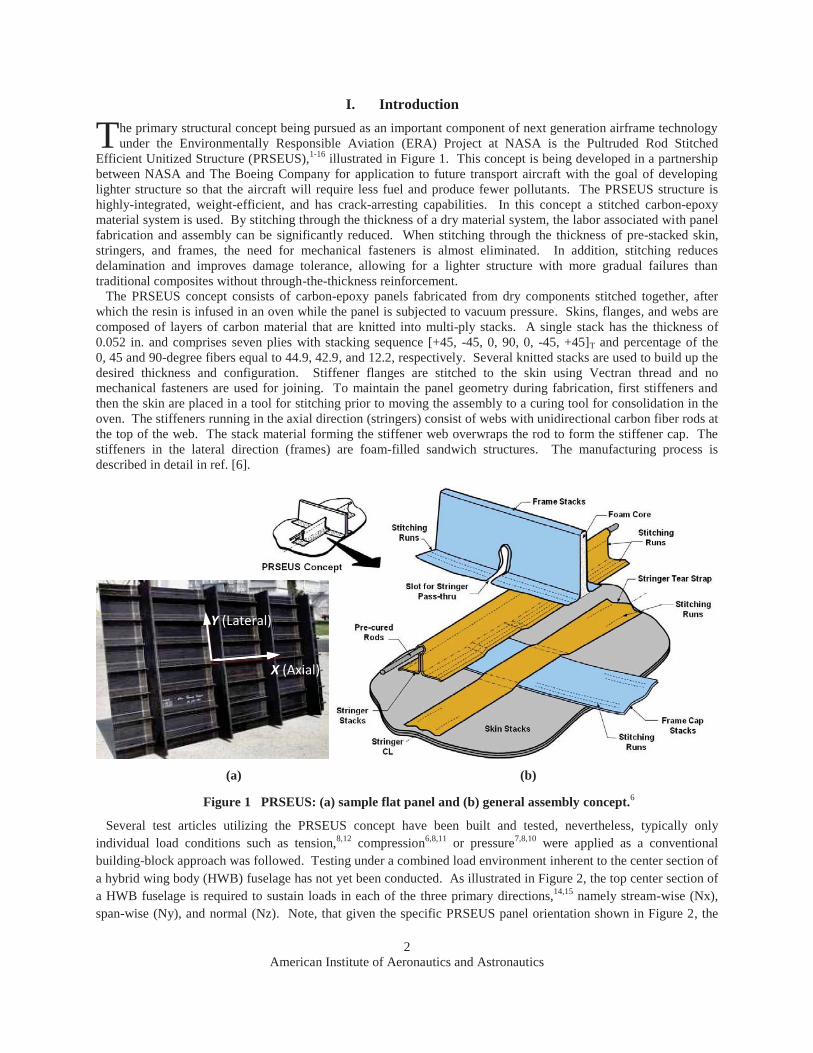
Efficient Unitized Structure (PRSEUS),1-16 illustrated in Figure 1. This concept is being developed in a partnership between NASA and The Boeing Company for application to future transport aircraft with the goal of developing lighter structure so that the aircraft will require less fuel and produce fewer pollutants. The PRSEUS structure is highly-integrated, weight-efficient, and has crack-arresting capabilities. In this concept a stitched carbon-epoxy material system is used. By stitching through the thickness of a dry material system, the labor associated with panel fabrication and assembly can be significantly reduced. When stitching through the thickness of pre-stacked skin, stringers, and frames, the need for mechanical fasteners is almost eliminated. In addition, stitching reduces delamination and improves damage tolerance, allowing for a lighter structure with more gradual failures than traditional composites without through-the-thickness reinforcement. The PRSEUS concept consists of carbon-epoxy panels fabricated from dry components stitched together, after which the resin is infused in an oven while the panel is subjected to vacuum pressure. Skins, flanges, and webs are composed of layers of carbon material that are knitted into multi-ply stacks. A single stack has the thickness of 0.052 in. and comprises seven plies with stacking sequence [+45, -45, 0, 90, 0, -45, +45]T and percentage of the 0, 45 and 90-degree fibers equal to 44.9, 42.9, and 12.2, respectively. Several knitted stacks are used to build up the desired thickness and configuration. Stiffener flanges are stitched to the skin using Vectran thread and no mechanical fasteners are used for joining. To maintain the panel geometry during fabrication, first stiffeners and then the skin are placed in a tool for stitching prior to moving the assembly to a curing tool for consolidation in the oven. The stiffeners running in the axial direction (stringers) consist of webs with unidirectional carbon fiber rods at the top of the web. The stack material forming the stiffener web overwraps the rod to form the stiffener cap. The stiffeners in the lateral direction (frames) are foam-filled sandwich structures. The manufacturing process is described in detail in ref. [6].
(a) (b)
Figure 1 PRSEUS: (a) sample flat panel and (b) general assembly concept.6
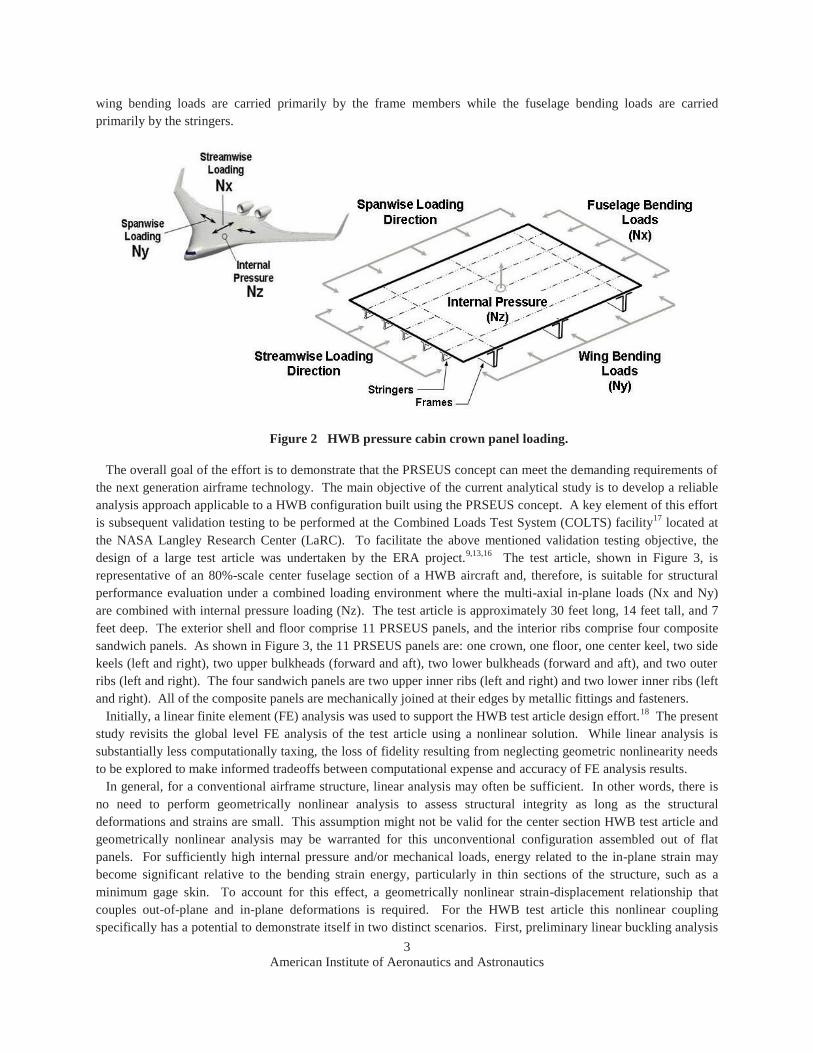
Several test articles utilizing the PRSEUS concept have been built and tested, nevertheless, typically only individual load conditions such as tension,8,12 compression6,8,11 or pressure7,8,10 were applied as a conventional building-block approach was followed. Testing under a combined load environment inherent to the center section of a hybrid wing body (HWB) fuselage has not yet been conducted. As illustrated in Figure 2, the top center section of a HWB fuselage is required to sustain loads in each of the three primary directions,14,15 namely stream-wise (Nx), span-wise (Ny), and normal (Nz). Note, that given the specific PRSEUS panel orientation shown in Figure 2, the
T
X (Axial)
Y (Lateral)
3 American Institute of Aeronautics and Astronautics
wing bending loads are carried primarily by the frame members while the fuselage bending loads are carried primarily by the stringers.
Figure 2 HWB pressure cabin crown panel loading.
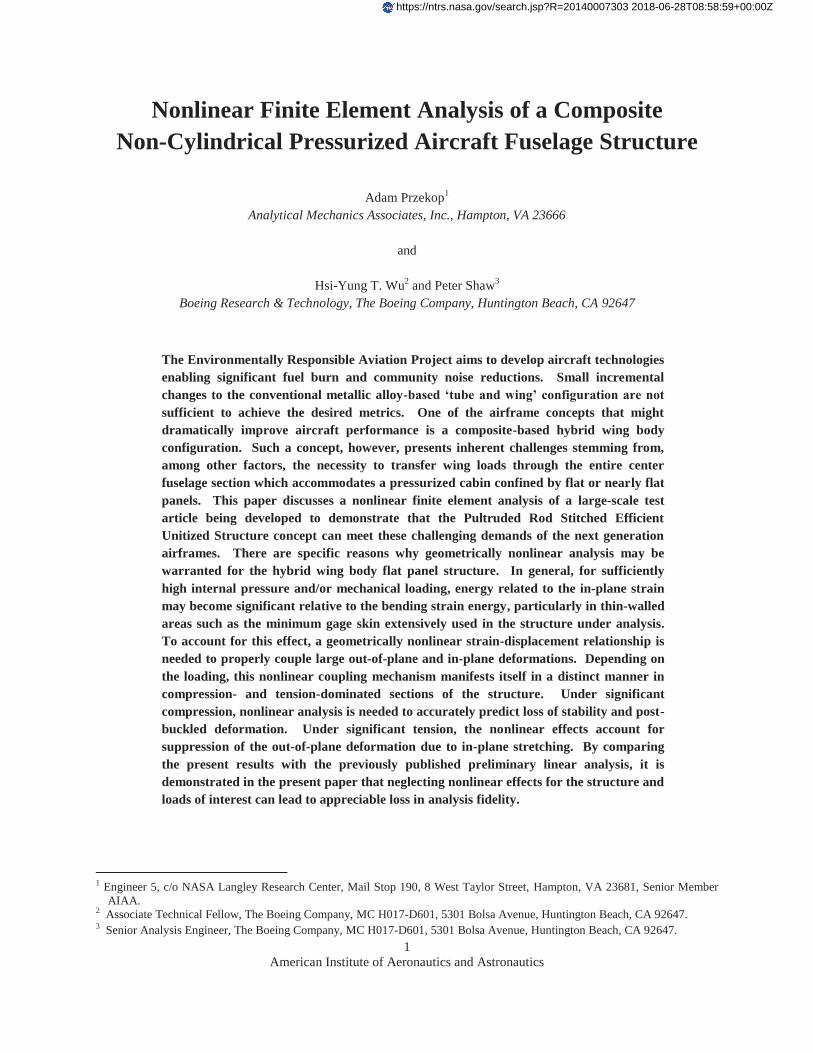
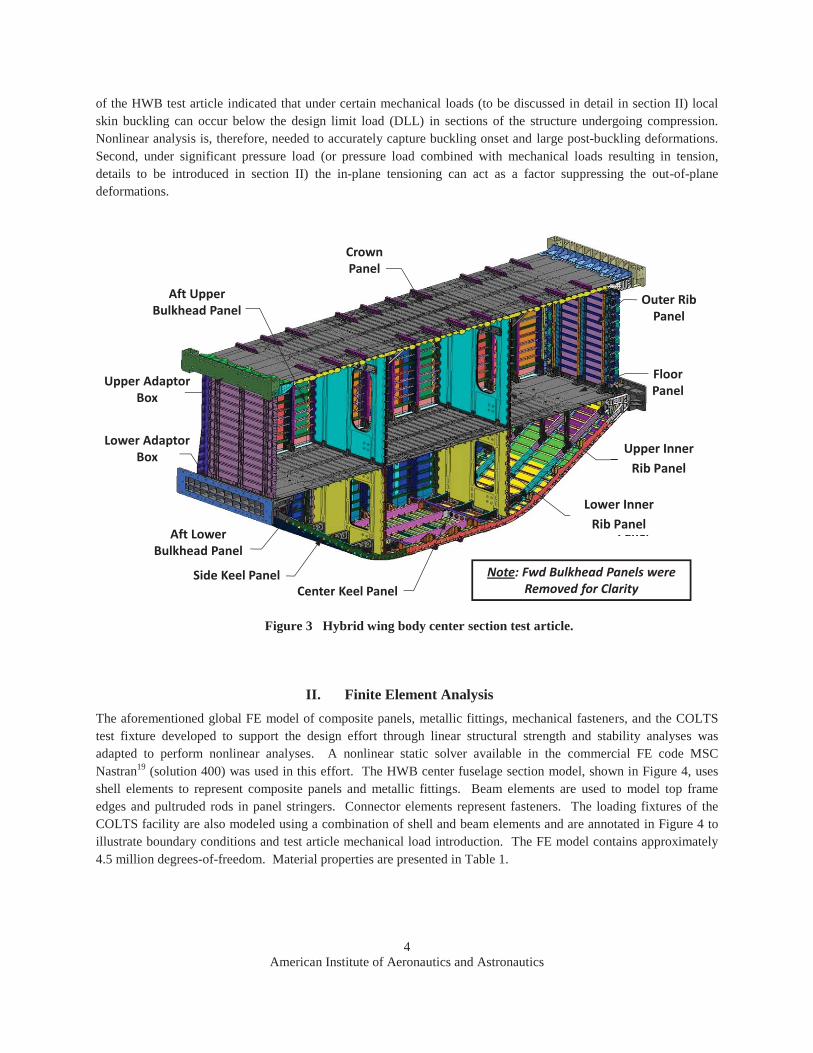
The overall goal of the effort is to demonstrate that the PRSEUS concept can meet the demanding requirements of the next generation airframe technology. The main objective of the current analytical study is to develop a reliable analysis approach applicable to a HWB configuration built using the PRSEUS concept. A key element of this effort is subsequent validation testing to be performed at the Combined Loads Test System (COLTS) facility17 located at the NASA Langley Research Center (LaRC). To facilitate the above mentioned validation testing objective, the design of a large test article was undertaken by the ERA project.9,13,16 The test article, shown in Figure 3, is representative of an 80%-scale center fuselage section of a HWB aircraft and, therefore, is suitable for structural performance evaluation under a combined loading environment where the multi-axial in-plane loads (Nx and Ny) are combined with internal pressure loading (Nz). The test article is approximately 30 feet long, 14 feet tall, and 7 feet deep. The exterior shell and floor comprise 11 PRSEUS panels, and the interior ribs comprise four composite sandwich panels. As shown in Figure 3, the 11 PRSEUS panels are: one crown, one floor, one center keel, two side keels (left and right), two upper bulkheads (forward and aft), two lower bulkheads (forward and aft), and two outer ribs (left and right). The four sandwich panels are two upper inner ribs (left and right) and two lower inner ribs (left and right). All of the composite panels are mechanically joined at their edges by metallic fittings and fasteners. Initially, a linear finite element (FE) analysis was used to support the HWB test article design effort.18 The present study revisits the global level FE analysis of the test article using a nonlinear solution. While linear analysis is substantially less computationally taxing, the loss of fidelity resulting from neglecting geometric nonlinearity needs to be explored to make informed tradeoffs between computational expense and accuracy of FE analysis results. In general, for a conventional airframe structure, linear analysis may often be sufficient. In other words, there is no need to perform geometrically nonlinear analysis to assess structural integrity as long as the structural deformations and strains are small. This assumption might not be valid for the center section HWB test article and geometrically nonlinear analysis may be warranted for this unconventional configuration assembled out of flat panels. For sufficiently high internal pressure and/or mechanical loads, energy related to the in-plane strain may become significant relative to the bending strain energy, particularly in thin sections of the structure, such as a minimum gage skin. To account for this effect, a geometrically nonlinear strain-displacement relationship that couples out-of-plane and in-plane deformations is required. For the HWB test article this nonlinear coupling specifically has a potential to demonstrate itself in two distinct scenarios. First, preliminary linear buckling analysis
4 American Institute of Aeronautics and Astronautics
of the HWB test article indicated that under certain mechanical loads (to be discussed in detail in section II) local skin buckling can occur below the design limit load (DLL) in sections of the structure undergoing compression. Nonlinear analysis is, therefore, needed to accurately capture buckling onset and large post-buckling deformations. Second, under significant pressure load (or pressure load combined with mechanical loads resulting in tension, details to be introduced in section II) the in-plane tensioning can act as a factor suppressing the out-of-plane deformations.
Figure 3 Hybrid wing body center section test article.
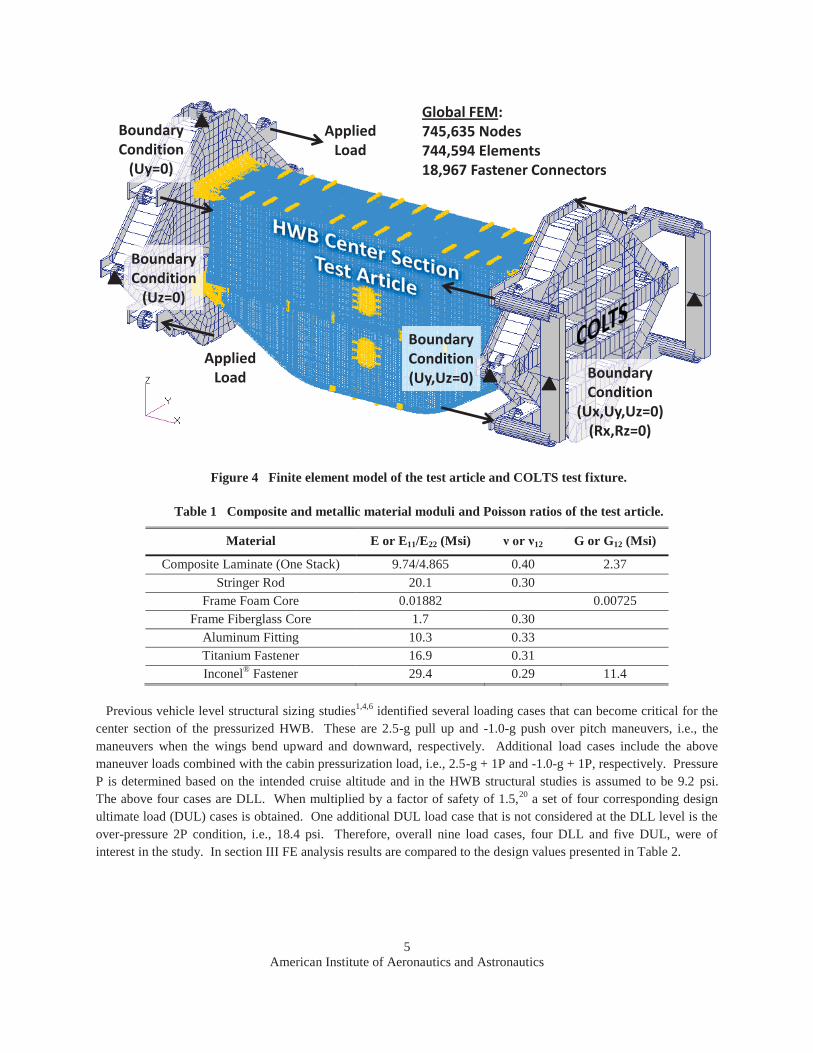
II. Finite Element Analysis The aforementioned global FE model of composite panels, metallic fittings, mechanical fasteners, and the COLTS test fixture developed to support the design effort through linear structural strength and stability analyses was adapted to perform nonlinear analyses. A nonlinear static solver available in the commercial FE code MSC Nastran19 (solution 400) was used in this effort. The HWB center fuselage section model, shown in Figure 4, uses shell elements to represent composite panels and metallic fittings. Beam elements are used to model top frame edges and pultruded rods in panel stringers. Connector elements represent fasteners. The loading fixtures of the COLTS facility are also modeled using a combination of shell and beam elements and are annotated in Figure 4 to illustrate boundary conditions and test article mechanical load introduction. The FE model contains approximately 4.5 million degrees-of-freedom. Material properties are presented in Table 1.
Center Keel Panel
Floor Panel
Upper Center Rib Panel
Crown Panel
Aft Lower Bulkhead Panel
Outer Rib Panel
Note: Fwd Bulkhead Panels were Removed for Clarity
Side Keel Panel
Lower Center Rib Panel
Aft Upper Bulkhead Panel
Lower Adaptor Box
Upper Adaptor Box
Upper Inner Rib Panel
Panel
Lower Inner Rib Panel
5 American Institute of Aeronautics and Astronautics
Figure 4 Finite element model of the test article and COLTS test fixture.
Table 1 Composite and metallic material moduli and Poisson ratios of the test article.
Material E or E11/E22 (Msi) ν or ν12 G or G12 (Msi)
Composite Laminate (One Stack) 9.74/4.865 0.40 2.37 Stringer Rod 20.1 0.30
Frame Foam Core 0.01882 0.00725 Frame Fiberglass Core 1.7 0.30
Aluminum Fitting 10.3 0.33 Titanium Fastener 16.9 0.31 Inconel® Fastener 29.4 0.29 11.4
Previous vehicle level structural sizing studies1,4,6 identified several loading cases that can become critical for the center section of the pressurized HWB. These are 2.5-g pull up and -1.0-g push over pitch maneuvers, i.e., the maneuvers when the wings bend upward and downward, respectively. Additional load cases include the above maneuver loads combined with the cabin pressurization load, i.e., 2.5-g + 1P and -1.0-g + 1P, respectively. Pressure P is determined based on the intended cruise altitude and in the HWB structural studies is assumed to be 9.2 psi. The above four cases are DLL. When multiplied by a factor of safety of 1.5,20 a set of four corresponding design ultimate load (DUL) cases is obtained. One additional DUL load case that is not considered at the DLL level is the over-pressure 2P condition, i.e., 18.4 psi. Therefore, overall nine load cases, four DLL and five DUL, were of interest in the study. In section III FE analysis results are compared to the design values presented in Table 2.
Global FEM:745,635 Nodes744,594 Elements18,967 Fastener Connectors744,594 Ele18,967 Fast
BoundaryCondition
(Uz=0)
AppliedLoad
BoundaryCondition(Uy,Uz=0)
AppliedLoad Boundary
Condition(Ux,Uy,Uz=0)
(Rx,Rz=0)
BoundaryCondition
(Uy=0)
6 American Institute of Aeronautics and Astronautics
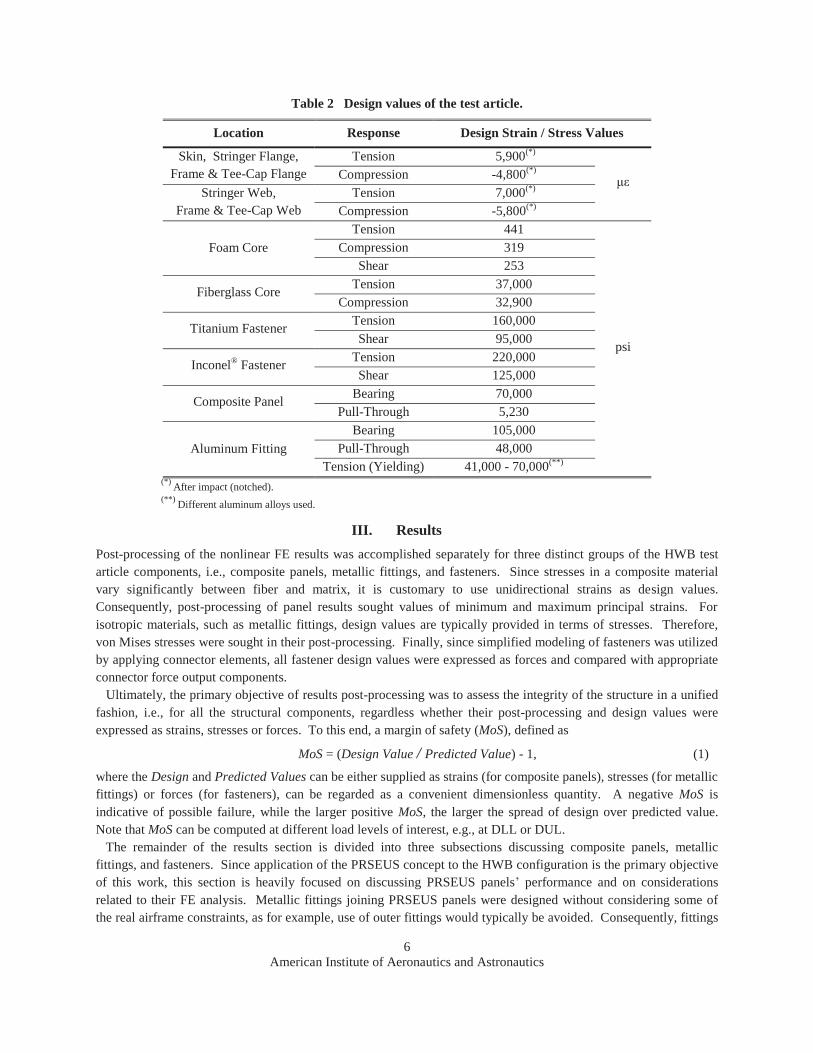
Table 2 Design values of the test article.
Location Response Design Strain / Stress Values
Skin, Stringer Flange, Frame & Tee-Cap Flange
Tension 5,900(*)
με Compression -4,800(*) Stringer Web,
Frame & Tee-Cap Web Tension 7,000(*)
Compression -5,800(*)
Foam Core Tension 441
psi
Compression 319 Shear 253
Fiberglass Core Tension 37,000 Compression 32,900
Titanium Fastener Tension 160,000 Shear 95,000
Inconel® Fastener Tension 220,000 Shear 125,000
Composite Panel Bearing 70,000 Pull-Through 5,230
Aluminum Fitting Bearing 105,000
Pull-Through 48,000 Tension (Yielding) 41,000 - 70,000(**)
(*) After impact (notched). (**) Different aluminum alloys used.
III. Results Post-processing of the nonlinear FE results was accomplished separately for three distinct groups of the HWB test article components, i.e., composite panels, metallic fittings, and fasteners. Since stresses in a composite material vary significantly between fiber and matrix, it is customary to use unidirectional strains as design values. Consequently, post-processing of panel results sought values of minimum and maximum principal strains. For isotropic materials, such as metallic fittings, design values are typically provided in terms of stresses. Therefore, von Mises stresses were sought in their post-processing. Finally, since simplified modeling of fasteners was utilized by applying connector elements, all fastener design values were expressed as forces and compared with appropriate connector force output components. Ultimately, the primary objective of results post-processing was to assess the integrity of the structure in a unified fashion, i.e., for all the structural components, regardless whether their post-processing and design values were expressed as strains, stresses or forces. To this end, a margin of safety (MoS), defined as
MoS = (Design Value / Predicted Value) - 1, (1)
where the Design and Predicted Values can be either supplied as strains (for composite panels), stresses (for metallic fittings) or forces (for fasteners), can be regarded as a convenient dimensionless quantity. A negative MoS is indicative of possible failure, while the larger positive MoS, the larger the spread of design over predicted value. Note that MoS can be computed at different load levels of interest, e.g., at DLL or DUL. The remainder of the results section is divided into three subsections discussing composite panels, metallic fittings, and fasteners. Since application of the PRSEUS concept to the HWB configuration is the primary objective of this work, this section is heavily focused on discussing PRSEUS panels’ performance and on considerations related to their FE analysis. Metallic fittings joining PRSEUS panels were designed without considering some of the real airframe constraints, as for example, use of outer fittings would typically be avoided. Consequently, fittings
7 American Institute of Aeronautics and Astronautics
receive less attention in this section. Finally, results pertaining to standard bolted joints are described very briefly as the most routine part of the analysis.
A. Composite panels
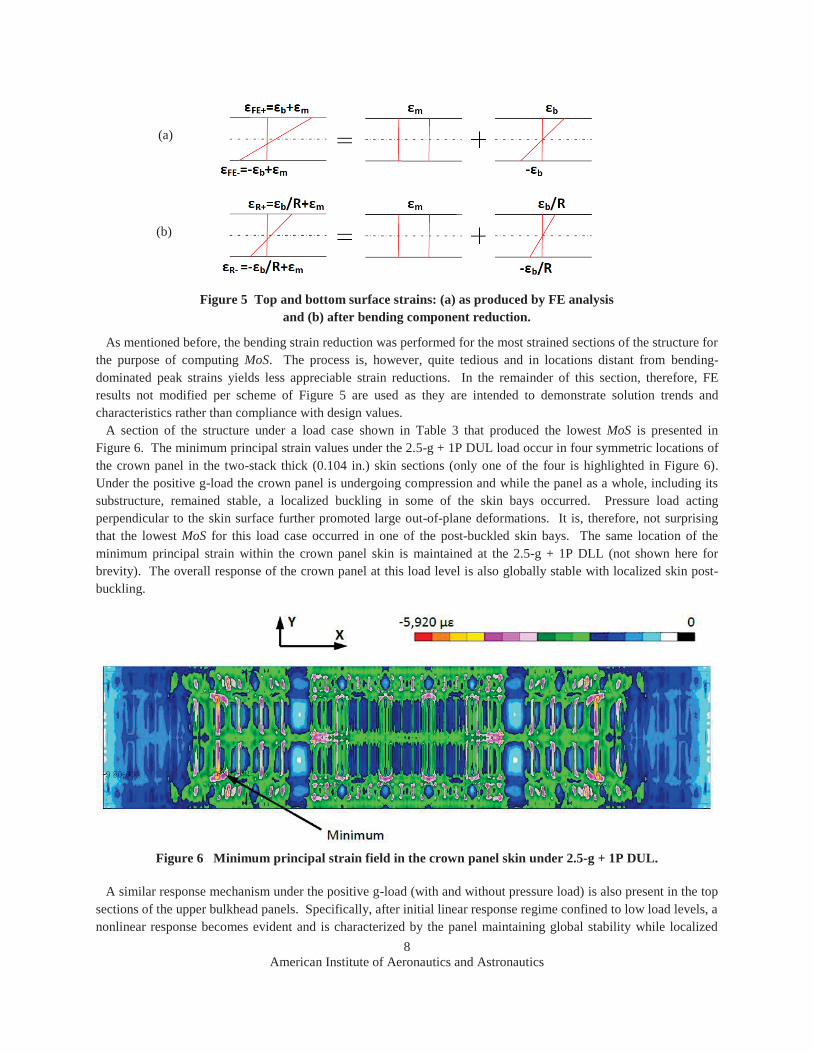
The lowest MoS values obtained based on the maximum and minimum principal strains for DUL and DLL cases are presented in Table 3 along with a section of the structure where they were identified. Numbers in bold fonts in Table 3 indicate the lower of the two, tension or compression, MoS values for a given load case. Notched design values, per Table 2, are used for all the load cases. For all sections of the structure, excluding selected skin bays, the maximum and minimum principal strains obtained from the FE analysis were referenced against the design values per Eq. (1). For a few selected thin skin bays (one- or two-stacks thick) experiencing high strains due to local post-buckling (to be discussed in detail later in this section) strains used in MoS calculations were adjusted. Note that the design values in Table 2 are obtained from tension and compression tests, i.e., with a uniform strain through the thickness distribution. Bending-dominated sections of the structure significantly depart from this behavior with extreme strain values occurring only on the surface. Based on empirical data acquired from bending-dominated tests, a reduction factor, R, for bending strain components was applied. The bending strain component reduction method is illustrated in Figure 5. Figure 5a shows decomposition of the original top and bottom surface strains obtained from FE analysis, εFE±, into bending, ±εb, and in-plane, εm, components. Next, the bending component is reduced by the reduction factor R (its value is proprietary and, therefore, not provided herein) to produce the reduced bending strains, ±εb/R. Once the bending component is reduced, it is added back to the unchanged in-plane component, εm, to produce new reduced strains, εR±, as shown in Figure 5b. The latter value is then used in Eq. (1). The bending strain reduction scheme was only applied to the two cases where the maximum strain exceeded the notched impact design values. Therefore, the results shown in Table 3 reflect application of the bending strain reduction scheme only in the compression MoS values for the 2.5-g + 1P and 2.5-g DUL load cases. Note also that all except the -1-g load case produced the lower MoS in compression rather than in tension.
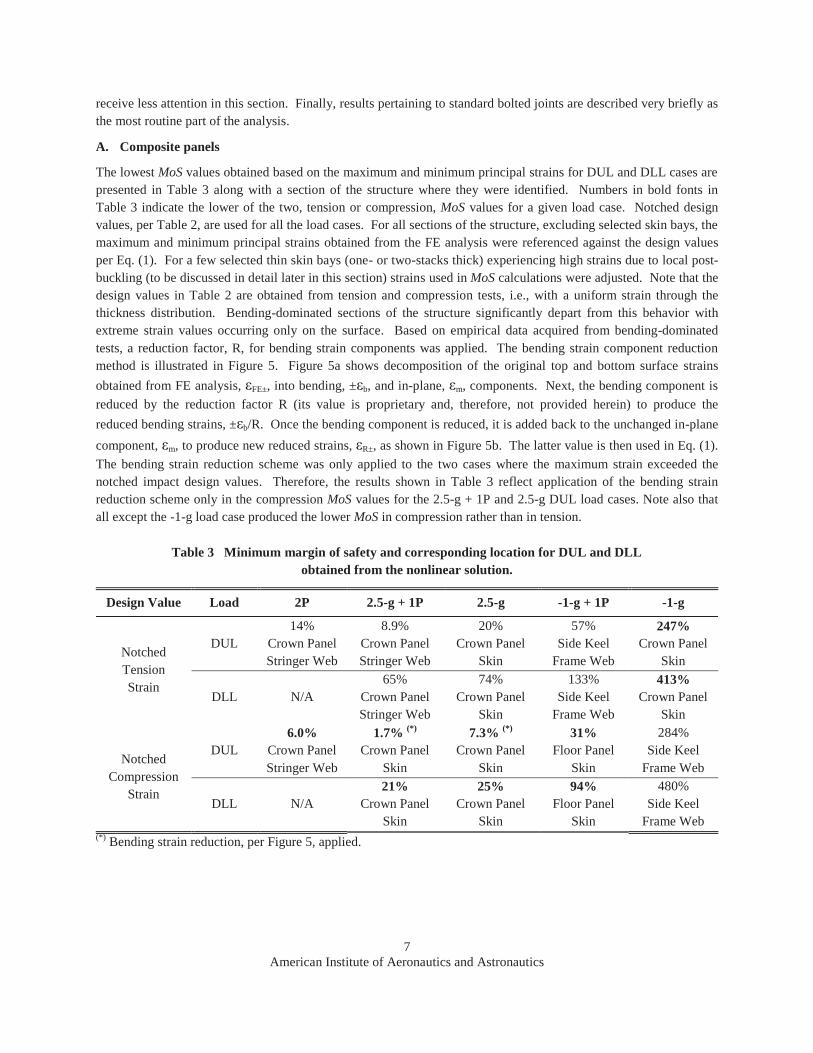
Table 3 Minimum margin of safety and corresponding location for DUL and DLL obtained from the nonlinear solution.
Design Value Load 2P 2.5-g + 1P 2.5-g -1-g + 1P -1-g
Notched Tension Strain
DUL
14% Crown Panel Stringer Web
8.9% Crown Panel Stringer Web
20% Crown Panel
Skin
57% Side Keel
Frame Web
247% Crown Panel
Skin
DLL
N/A 65%
Crown Panel Stringer Web
74% Crown Panel
Skin
133% Side Keel
Frame Web
413% Crown Panel
Skin
Notched
Compression Strain
DUL
6.0% Crown Panel Stringer Web
1.7% (*) Crown Panel
Skin
7.3% (*) Crown Panel
Skin
31% Floor Panel
Skin
284% Side Keel
Frame Web
DLL
N/A 21%
Crown Panel Skin
25% Crown Panel
Skin
94% Floor Panel
Skin
480% Side Keel
Frame Web (*) Bending strain reduction, per Figure 5, applied.
8 American Institute of Aeronautics and Astronautics
Figure 5 Top and bottom surface strains: (a) as produced by FE analysis and (b) after bending component reduction.
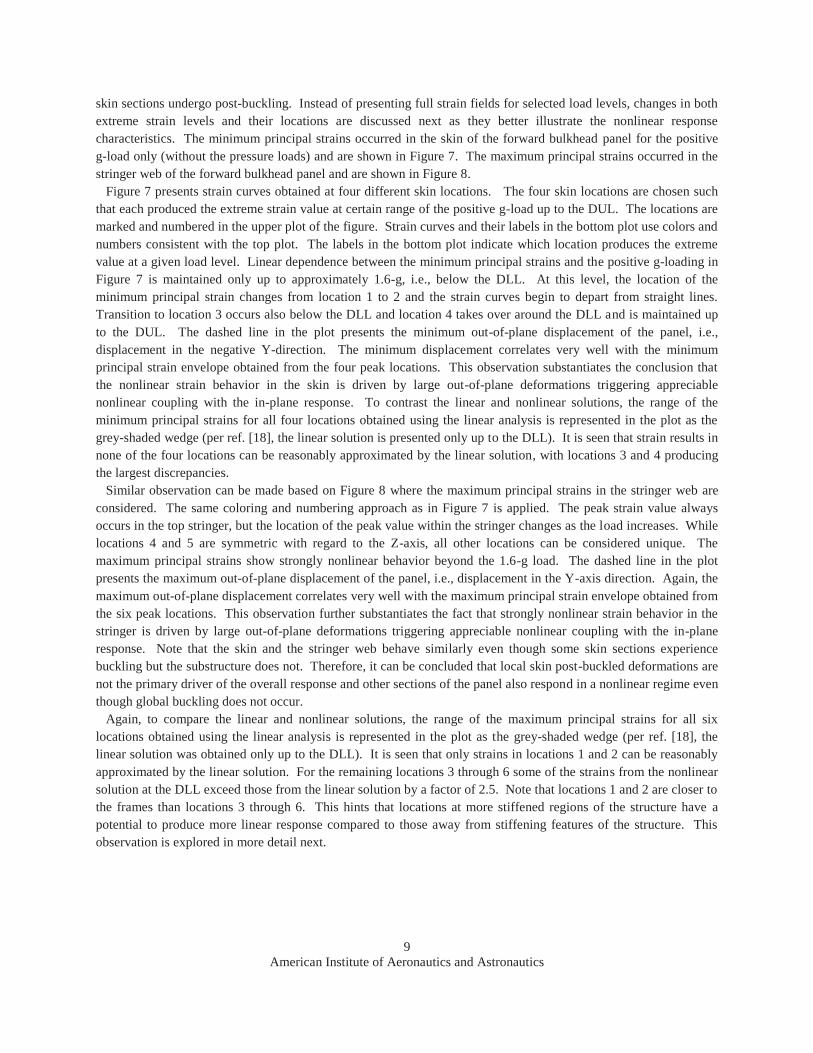
As mentioned before, the bending strain reduction was performed for the most strained sections of the structure for the purpose of computing MoS. The process is, however, quite tedious and in locations distant from bending-dominated peak strains yields less appreciable strain reductions. In the remainder of this section, therefore, FE results not modified per scheme of Figure 5 are used as they are intended to demonstrate solution trends and characteristics rather than compliance with design values. A section of the structure under a load case shown in Table 3 that produced the lowest MoS is presented in Figure 6. The minimum principal strain values under the 2.5-g + 1P DUL load occur in four symmetric locations of the crown panel in the two-stack thick (0.104 in.) skin sections (only one of the four is highlighted in Figure 6). Under the positive g-load the crown panel is undergoing compression and while the panel as a whole, including its substructure, remained stable, a localized buckling in some of the skin bays occurred. Pressure load acting perpendicular to the skin surface further promoted large out-of-plane deformations. It is, therefore, not surprising that the lowest MoS for this load case occurred in one of the post-buckled skin bays. The same location of the minimum principal strain within the crown panel skin is maintained at the 2.5-g + 1P DLL (not shown here for brevity). The overall response of the crown panel at this load level is also globally stable with localized skin post-buckling.
Figure 6 Minimum principal strain field in the crown panel skin under 2.5-g + 1P DUL.
A similar response mechanism under the positive g-load (with and without pressure load) is also present in the top sections of the upper bulkhead panels. Specifically, after initial linear response regime confined to low load levels, a nonlinear response becomes evident and is characterized by the panel maintaining global stability while localized
(a)
(b)
9 American Institute of Aeronautics and Astronautics
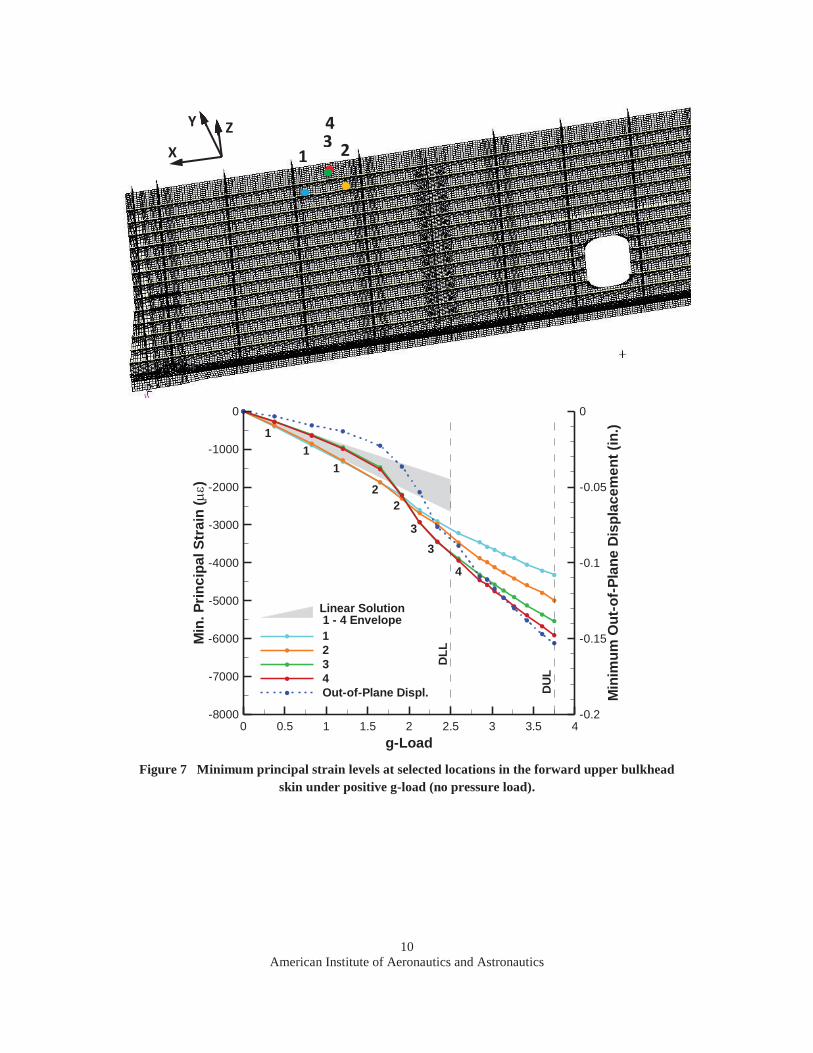
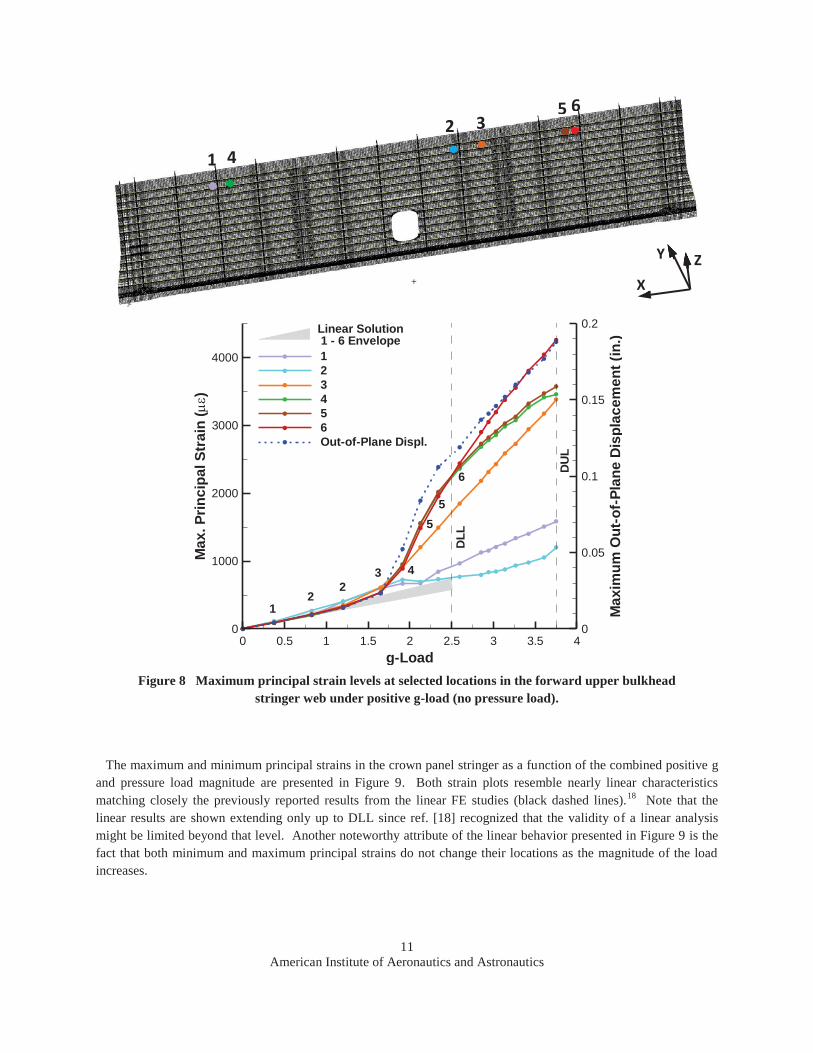
skin sections undergo post-buckling. Instead of presenting full strain fields for selected load levels, changes in both extreme strain levels and their locations are discussed next as they better illustrate the nonlinear response characteristics. The minimum principal strains occurred in the skin of the forward bulkhead panel for the positive g-load only (without the pressure loads) and are shown in Figure 7. The maximum principal strains occurred in the stringer web of the forward bulkhead panel and are shown in Figure 8. Figure 7 presents strain curves obtained at four different skin locations. The four skin locations are chosen such that each produced the extreme strain value at certain range of the positive g-load up to the DUL. The locations are marked and numbered in the upper plot of the figure. Strain curves and their labels in the bottom plot use colors and numbers consistent with the top plot. The labels in the bottom plot indicate which location produces the extreme value at a given load level. Linear dependence between the minimum principal strains and the positive g-loading in Figure 7 is maintained only up to approximately 1.6-g, i.e., below the DLL. At this level, the location of the minimum principal strain changes from location 1 to 2 and the strain curves begin to depart from straight lines. Transition to location 3 occurs also below the DLL and location 4 takes over around the DLL and is maintained up to the DUL. The dashed line in the plot presents the minimum out-of-plane displacement of the panel, i.e., displacement in the negative Y-direction. The minimum displacement correlates very well with the minimum principal strain envelope obtained from the four peak locations. This observation substantiates the conclusion that the nonlinear strain behavior in the skin is driven by large out-of-plane deformations triggering appreciable nonlinear coupling with the in-plane response. To contrast the linear and nonlinear solutions, the range of the minimum principal strains for all four locations obtained using the linear analysis is represented in the plot as the grey-shaded wedge (per ref. [18], the linear solution is presented only up to the DLL). It is seen that strain results in none of the four locations can be reasonably approximated by the linear solution, with locations 3 and 4 producing the largest discrepancies. Similar observation can be made based on Figure 8 where the maximum principal strains in the stringer web are considered. The same coloring and numbering approach as in Figure 7 is applied. The peak strain value always occurs in the top stringer, but the location of the peak value within the stringer changes as the load increases. While locations 4 and 5 are symmetric with regard to the Z-axis, all other locations can be considered unique. The maximum principal strains show strongly nonlinear behavior beyond the 1.6-g load. The dashed line in the plot presents the maximum out-of-plane displacement of the panel, i.e., displacement in the Y-axis direction. Again, the maximum out-of-plane displacement correlates very well with the maximum principal strain envelope obtained from the six peak locations. This observation further substantiates the fact that strongly nonlinear strain behavior in the stringer is driven by large out-of-plane deformations triggering appreciable nonlinear coupling with the in-plane response. Note that the skin and the stringer web behave similarly even though some skin sections experience buckling but the substructure does not. Therefore, it can be concluded that local skin post-buckled deformations are not the primary driver of the overall response and other sections of the panel also respond in a nonlinear regime even though global buckling does not occur. Again, to compare the linear and nonlinear solutions, the range of the maximum principal strains for all six locations obtained using the linear analysis is represented in the plot as the grey-shaded wedge (per ref. [18], the linear solution was obtained only up to the DLL). It is seen that only strains in locations 1 and 2 can be reasonably approximated by the linear solution. For the remaining locations 3 through 6 some of the strains from the nonlinear solution at the DLL exceed those from the linear solution by a factor of 2.5. Note that locations 1 and 2 are closer to the frames than locations 3 through 6. This hints that locations at more stiffened regions of the structure have a potential to produce more linear response compared to those away from stiffening features of the structure. This observation is explored in more detail next.
10 American Institute of Aeronautics and Astronautics
Figure 7 Minimum principal strain levels at selected locations in the forward upper bulkhead skin under positive g-load (no pressure load).
g-Load
Min
.Prin
cipa
lStr
ain
()
Min
imum
Out
-of-
Plan
eD
ispl
acem
ent(
in.)
0 0.5 1 1.5 2 2.5 3 3.5 4-8000
-7000
-6000
-5000
-4000
-3000
-2000
-1000
0
-0.2
-0.15
-0.1
-0.05
0
1234Out-of-Plane Displ.
DLL
DU
L
1
22
3
4
Linear Solution1 - 4 Envelope
11
3
Z Y
X 3 2 4
1
11 American Institute of Aeronautics and Astronautics
Figure 8 Maximum principal strain levels at selected locations in the forward upper bulkhead
stringer web under positive g-load (no pressure load).
The maximum and minimum principal strains in the crown panel stringer as a function of the combined positive g and pressure load magnitude are presented in Figure 9. Both strain plots resemble nearly linear characteristics matching closely the previously reported results from the linear FE studies (black dashed lines).18 Note that the linear results are shown extending only up to DLL since ref. [18] recognized that the validity of a linear analysis might be limited beyond that level. Another noteworthy attribute of the linear behavior presented in Figure 9 is the fact that both minimum and maximum principal strains do not change their locations as the magnitude of the load increases.
g-Load
Max
.Prin
cipa
lStr
ain
()
Max
imum
Out
-of-
Plan
eD
ispl
acem
ent(
in.)
0 0.5 1 1.5 2 2.5 3 3.5 40
1000
2000
3000
4000
0
0.05
0.1
0.15
0.2
123456Out-of-Plane Displ.
DLL
DU
L
12
23 4
55
6
Linear Solution1 - 6 Envelope
6 5 3 2
4 1
Z Y
X
12 American Institute of Aeronautics and Astronautics
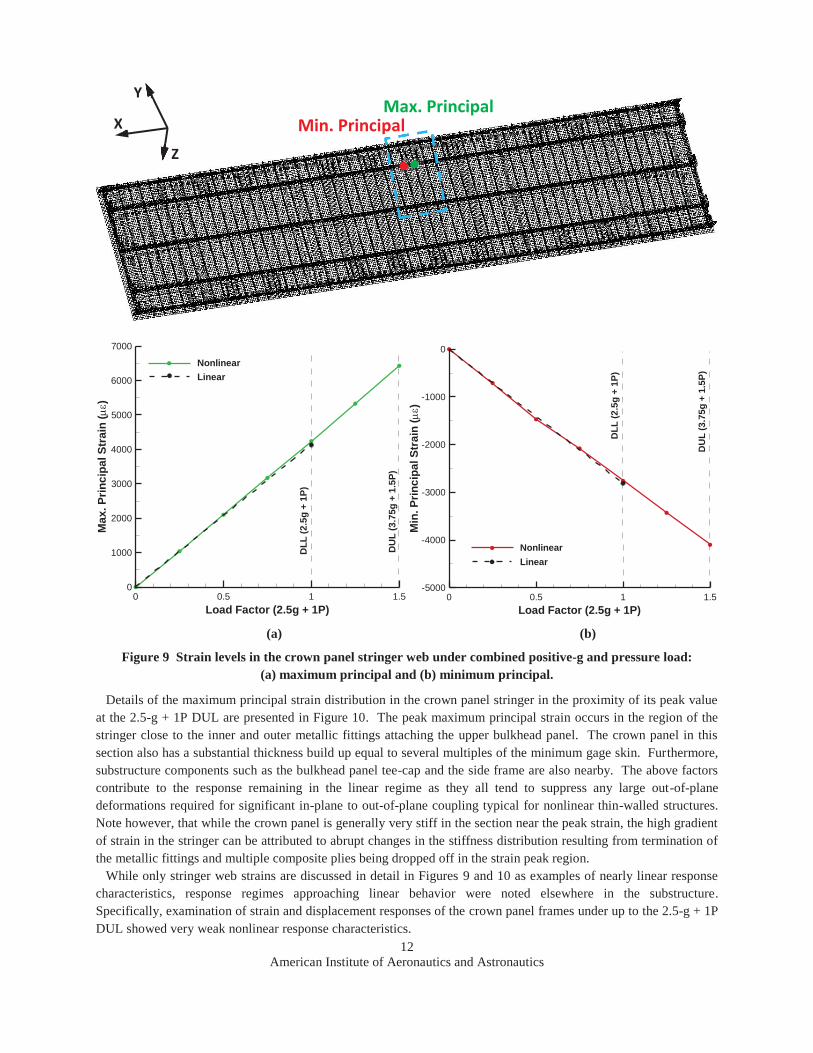
(a) (b)
Figure 9 Strain levels in the crown panel stringer web under combined positive-g and pressure load: (a) maximum principal and (b) minimum principal.
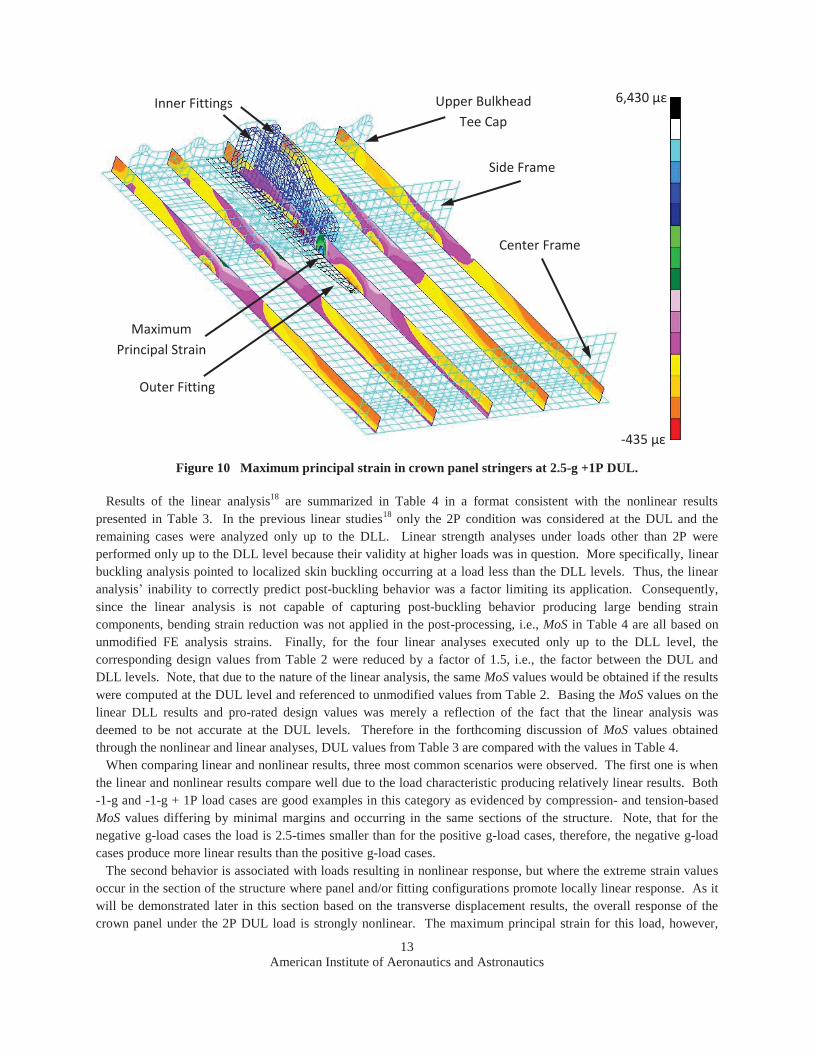
Details of the maximum principal strain distribution in the crown panel stringer in the proximity of its peak value at the 2.5-g + 1P DUL are presented in Figure 10. The peak maximum principal strain occurs in the region of the stringer close to the inner and outer metallic fittings attaching the upper bulkhead panel. The crown panel in this section also has a substantial thickness build up equal to several multiples of the minimum gage skin. Furthermore, substructure components such as the bulkhead panel tee-cap and the side frame are also nearby. The above factors contribute to the response remaining in the linear regime as they all tend to suppress any large out-of-plane deformations required for significant in-plane to out-of-plane coupling typical for nonlinear thin-walled structures. Note however, that while the crown panel is generally very stiff in the section near the peak strain, the high gradient of strain in the stringer can be attributed to abrupt changes in the stiffness distribution resulting from termination of the metallic fittings and multiple composite plies being dropped off in the strain peak region. While only stringer web strains are discussed in detail in Figures 9 and 10 as examples of nearly linear response characteristics, response regimes approaching linear behavior were noted elsewhere in the substructure. Specifically, examination of strain and displacement responses of the crown panel frames under up to the 2.5-g + 1P DUL showed very weak nonlinear response characteristics.
Load Factor (2.5g + 1P)
Max
.Prin
cipa
lStr
ain
()
0 0.5 1 1.50
1000
2000
3000
4000
5000
6000
7000
Nonlinear
DU
L(3
.75g
+1.
5P)
Linear
DLL
(2.5
g+
1P)
Load Factor (2.5g + 1P)
Min
.Prin
cipa
lStr
ain
()
0 0.5 1 1.5-5000
-4000
-3000
-2000
-1000
0
Nonlinear
DU
L(3
.75g
+1.
5P)
Linear
DLL
(2.5
g+
1P)
Max. Principal Min. Principal
Z
Y
X pal
13 American Institute of Aeronautics and Astronautics
Figure 10 Maximum principal strain in crown panel stringers at 2.5-g +1P DUL.
Results of the linear analysis18 are summarized in Table 4 in a format consistent with the nonlinear results presented in Table 3. In the previous linear studies18 only the 2P condition was considered at the DUL and the remaining cases were analyzed only up to the DLL. Linear strength analyses under loads other than 2P were performed only up to the DLL level because their validity at higher loads was in question. More specifically, linear buckling analysis pointed to localized skin buckling occurring at a load less than the DLL levels. Thus, the linear analysis’ inability to correctly predict post-buckling behavior was a factor limiting its application. Consequently, since the linear analysis is not capable of capturing post-buckling behavior producing large bending strain components, bending strain reduction was not applied in the post-processing, i.e., MoS in Table 4 are all based on unmodified FE analysis strains. Finally, for the four linear analyses executed only up to the DLL level, the corresponding design values from Table 2 were reduced by a factor of 1.5, i.e., the factor between the DUL and DLL levels. Note, that due to the nature of the linear analysis, the same MoS values would be obtained if the results were computed at the DUL level and referenced to unmodified values from Table 2. Basing the MoS values on the linear DLL results and pro-rated design values was merely a reflection of the fact that the linear analysis was deemed to be not accurate at the DUL levels. Therefore in the forthcoming discussion of MoS values obtained through the nonlinear and linear analyses, DUL values from Table 3 are compared with the values in Table 4. When comparing linear and nonlinear results, three most common scenarios were observed. The first one is when the linear and nonlinear results compare well due to the load characteristic producing relatively linear results. Both -1-g and -1-g + 1P load cases are good examples in this category as evidenced by compression- and tension-based MoS values differing by minimal margins and occurring in the same sections of the structure. Note, that for the negative g-load cases the load is 2.5-times smaller than for the positive g-load cases, therefore, the negative g-load cases produce more linear results than the positive g-load cases. The second behavior is associated with loads resulting in nonlinear response, but where the extreme strain values occur in the section of the structure where panel and/or fitting configurations promote locally linear response. As it will be demonstrated later in this section based on the transverse displacement results, the overall response of the crown panel under the 2P DUL load is strongly nonlinear. The maximum principal strain for this load, however,
Center Frame
Side Frame
Upper Bulkhead Tee Cap
Outer Fitting
Inner Fittings
Maximum Principal Strain
-435 με
6,430 με
14 American Institute of Aeronautics and Astronautics
occurs in a stiffened section of the structure where the behavior is locally linear, and extreme linear and nonlinear tension MoS values occur in the same stringer web and are equal to 10% and 14%, respectively. So is the case for the 2.5-g + 1P load, as shown in Figure 10. For this load case the extreme tension MoS are also in the web stringer and are equal to 13% and 8.9% for linear and nonlinear solutions, respectively. The third group of cases can be classified as a “good MoS comparison for wrong reasons.” Compression MoS values for the 2.5-g + 1P and 2.5-g load cases are best examples in this category. While the corresponding MoS and their locations are similar, the underlying mechanisms leading to them are different. Note that in the linear buckling studies18 localized skin buckling was identified in some load cases below the DLL. In the most severe case in terms of an early loss of stability, linear buckling was identified in the crown panel skin at the 0.347-g load, i.e., only 13.9% of the 2.5-g DLL. Consequently, the linear strength analysis was unable to accurately account for the localized loss of stability, while the nonlinear solution captured local skin buckling and large post-buckled deflections, as well as associated redistribution of the loads into surrounding substructure. Crown panel skin post-buckling not captured in the linear analysis results in under-predicted strain levels. On the other hand, in the nonlinear analysis such large strains resulting from post-buckling are captured but due to the large bending strain contribution, strain levels are modified per the procedure illustrated in Figure 5. Under-predicted crown panel skin strains from the linear analysis happen to produce similar MoS values as the correct strains from the nonlinear analysis reduced due to large bending strain component participation. The largest difference in terms of MoS between linear and nonlinear solution is more than four-fold (86% linear and 20% nonlinear) and occurs for the tension MoS for the 2.5-g load case. Note that the location of the extreme MoS value is also different and this example does not fit into any of the above-outlined three most common categories.
Table 4 Minimum margin of safety and corresponding location for DLL (except as noted) obtained from the linear solution.
Design Value 2P (DUL) 2.5-g + 1P 2.5-g -1-g + 1P -1-g
Notched Tension Strain
10% Crown Panel Stringer Web
13% Crown Panel Stringer Web
86% Side Keel
Frame Web
52% Side Keel
Frame Web
236% Crown Panel
Skin Notched
Compression Strain
2.3% Center Keel
Stringer Web
5.6% Crown Panel
Skin
9.2% Crown Panel
Skin
29% Floor Panel
Skin
287% Side Keel
Frame Web
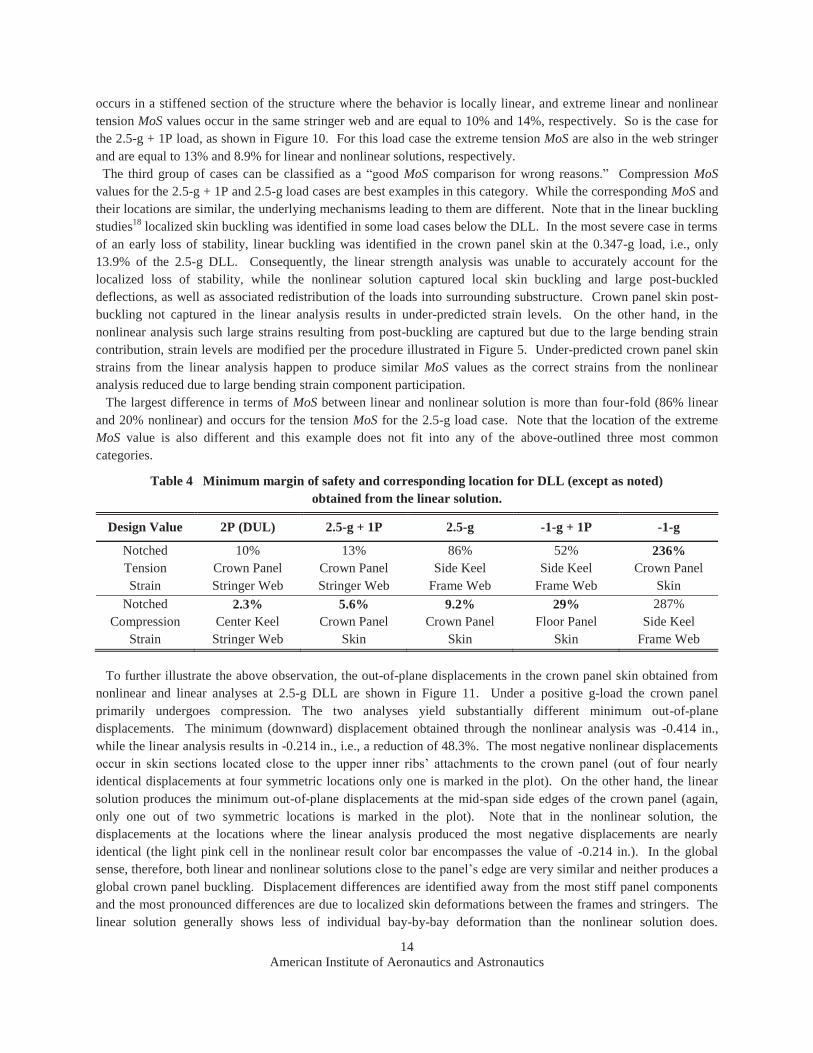
To further illustrate the above observation, the out-of-plane displacements in the crown panel skin obtained from nonlinear and linear analyses at 2.5-g DLL are shown in Figure 11. Under a positive g-load the crown panel primarily undergoes compression. The two analyses yield substantially different minimum out-of-plane displacements. The minimum (downward) displacement obtained through the nonlinear analysis was -0.414 in., while the linear analysis results in -0.214 in., i.e., a reduction of 48.3%. The most negative nonlinear displacements occur in skin sections located close to the upper inner ribs’ attachments to the crown panel (out of four nearly identical displacements at four symmetric locations only one is marked in the plot). On the other hand, the linear solution produces the minimum out-of-plane displacements at the mid-span side edges of the crown panel (again, only one out of two symmetric locations is marked in the plot). Note that in the nonlinear solution, the displacements at the locations where the linear analysis produced the most negative displacements are nearly identical (the light pink cell in the nonlinear result color bar encompasses the value of -0.214 in.). In the global sense, therefore, both linear and nonlinear solutions close to the panel’s edge are very similar and neither produces a global crown panel buckling. Displacement differences are identified away from the most stiff panel components and the most pronounced differences are due to localized skin deformations between the frames and stringers. The linear solution generally shows less of individual bay-by-bay deformation than the nonlinear solution does.
15 American Institute of Aeronautics and Astronautics
Furthermore, in the linear solution, such localized displacements typically produce less negative displacements than the surrounding sections with substructure, meaning that the local skin deformation occurs in the direction opposite to the global panel deformation. In the nonlinear solution, local bay-by-bay displacements are larger and their directions are alternating such that some bay deformations coincide with the overall global deformation direction, i.e., downwards. As indicated before, the latter is consistent with thin skin sections undergoing local buckling.
Figure 11 Crown panel nonlinear (top) and linear (bottom) out-of-plane displacement under 2.5-g DLL.
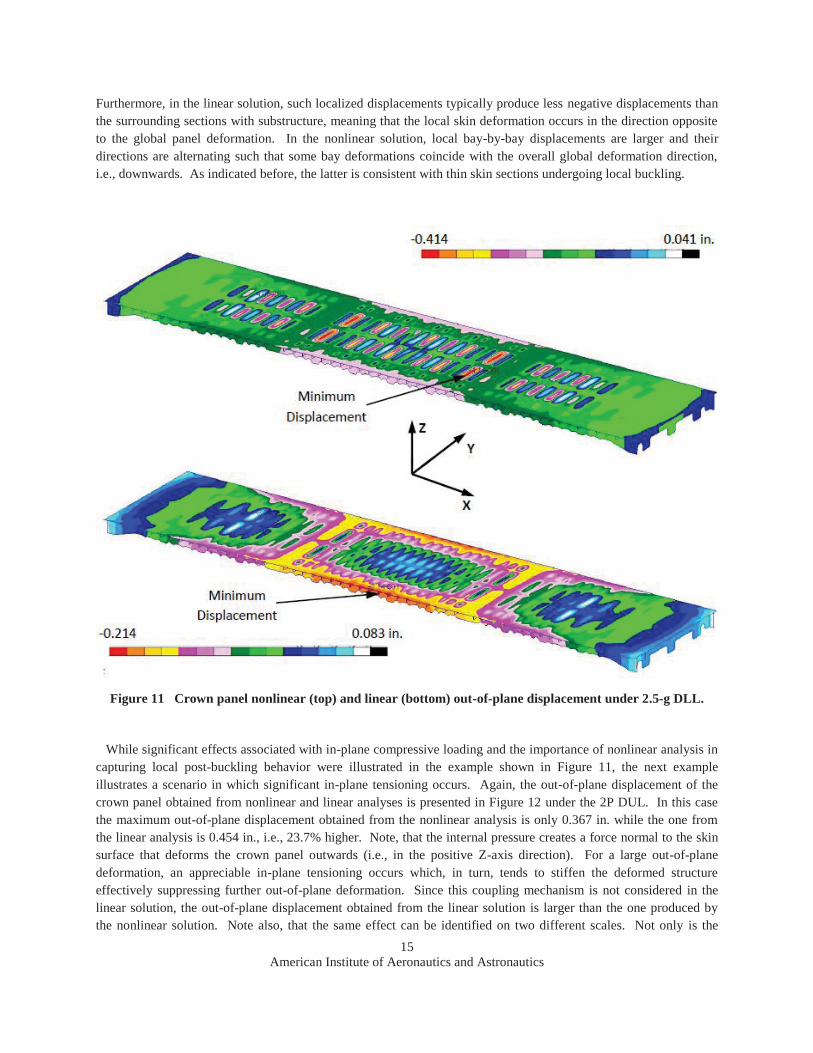
While significant effects associated with in-plane compressive loading and the importance of nonlinear analysis in capturing local post-buckling behavior were illustrated in the example shown in Figure 11, the next example illustrates a scenario in which significant in-plane tensioning occurs. Again, the out-of-plane displacement of the crown panel obtained from nonlinear and linear analyses is presented in Figure 12 under the 2P DUL. In this case the maximum out-of-plane displacement obtained from the nonlinear analysis is only 0.367 in. while the one from the linear analysis is 0.454 in., i.e., 23.7% higher. Note, that the internal pressure creates a force normal to the skin surface that deforms the crown panel outwards (i.e., in the positive Z-axis direction). For a large out-of-plane deformation, an appreciable in-plane tensioning occurs which, in turn, tends to stiffen the deformed structure effectively suppressing further out-of-plane deformation. Since this coupling mechanism is not considered in the linear solution, the out-of-plane displacement obtained from the linear solution is larger than the one produced by the nonlinear solution. Note also, that the same effect can be identified on two different scales. Not only is the
16 American Institute of Aeronautics and Astronautics
global nonlinear deformation smaller but individual skin sections tend to show smaller amplitudes when their deformations are compared to the surrounding substructure. Note, for example, that in the nonlinear solution there is a two-bay area at the center of the panel with a displacement range confined within a single white color bar. Similar area in the linear solution shows not only white but also two shades of blue from the result color bar spanning over a larger displacement range.
Figure 12 Crown panel nonlinear (top) and linear (bottom) out-of-plane displacement under 2P DUL.
As illustrated with the crown panel displacements, nonlinear solutions can produce either larger or smaller deformations when compared to the linear analysis. The same finding pertains to the strain or stress levels. Smaller deformations, however, do not necessarily imply smaller strains and larger deformations do not imply larger strains. All analyses should be conducted on case-by-case basis while keeping in mind that the same nonlinear coupling mechanism can manifest itself in either conservative or non-conservative solutions when compared to a simplified linear analysis.
B. Metallic fittings
Nonlinear solution results for all the metallic fittings used in the test article assembly were post-processed by obtaining von Mises stresses and comparing them to stress design values per Table 2. All design values for aluminum alloys used in the assembly were selected in a conservative fashion such that the yielding stress was used as a DUL design value. Consequently, positive MoS values signified that the metallic fittings did not experience plastic response regime and, therefore, accounting for the nonlinear elastic-plastic material properties was not

17 American Institute of Aeronautics and Astronautics
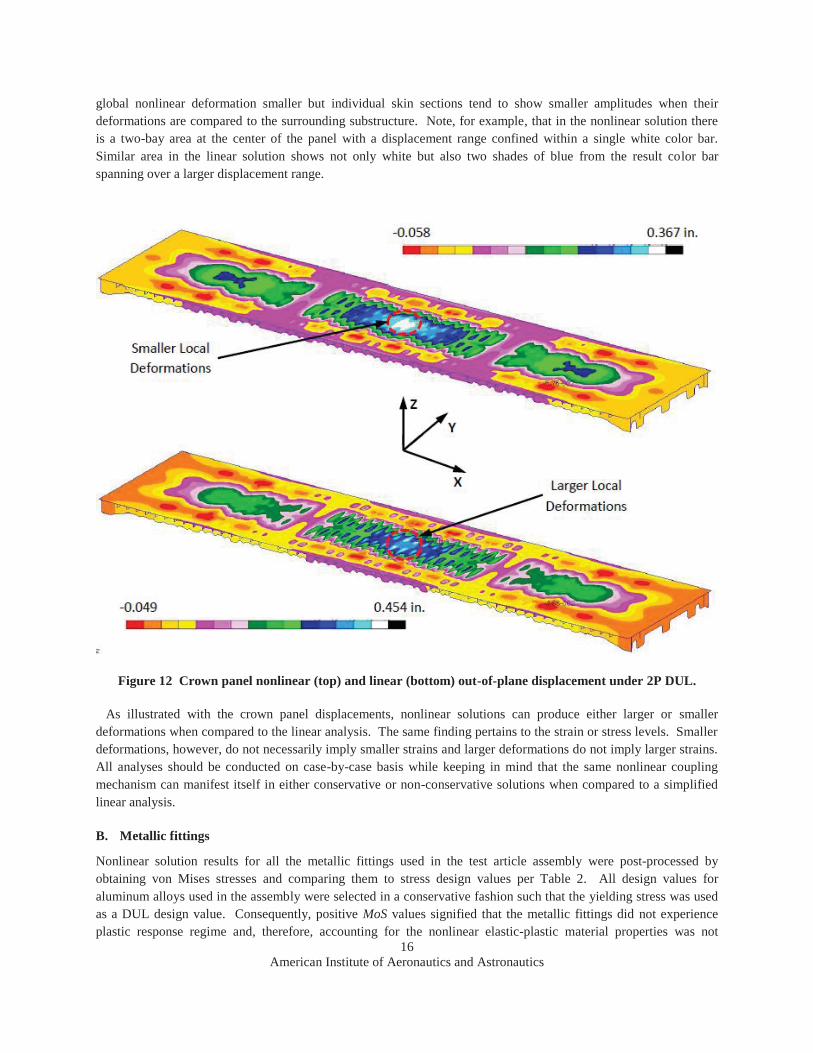
warranted in the analysis. In general, it is possible to adopt a more aggressive sizing strategy by using the yielding stress as the DLL design value and ultimate stress as the DUL design value.12,20 The minimum MoS values for the metallic fittings are presented in Table 5 for the DUL levels. The lowest MoS of 2.5% was obtained for the 2P load case. Overall, three unique fittings (i.e., each of the three does have its symmetric companions) with MoS values of less than 10% were identified, all under the 2P DUL. They attach the lower bulkhead panels to the three distinct panels mated to them. Apart from the outer fitting attaching the center keel panel listed in Table 5, the remaining two fittings provide joints with the floor panel (MoS of 6.3%) and with the side keel panel (MoS of 7.3%). Von Mises stresses for all three fittings are illustrated in Figure 13 (lower bulkhead panels are not shown for clarity in the schematic plot). It is seen that in all three fittings the maximum von Mises stresses are confined to small areas at the free ends of the fittings. As evidenced in Figure 13, general volumes of the fittings are stressed at levels much lower than the design values. Nevertheless note, that the metallic fittings in the 2P, -1-g, and -1-g + 1P load cases produced lower MoS when compared to the composite panels MoS per Table 3.
Table 5 Minimum margin of safety and corresponding location for metallic fittings at DUL.
Design Value 2P 2.5-g + 1P 2.5-g -1-g + 1P -1-g
DUL Stress
(No Yield Criterion)
2.5% Lower
Bulkhead to Center Keel
12% Upper Load Introduction Assembly
15% Upper Load Introduction Assembly
16% Lower
Bulkhead to Side Keel
185% Floor
to Side Keel
C. Fasteners Approximately 13,000 fasteners were used in the HWB test article assembly. The vast majority of fasteners were titanium bolts with few Inconel® super-alloy bolts used in a limited number of highly stressed attachments. Since bolted joints are standard components and their analysis is quite routine, this section provides only a brief summary of the results. Several conditions, including (i) axial tension combined with bending (the latter factoring in bolt length increases due to thicknesses of shims required in the assembly process), (ii) pull-through, (iii) shearing, and (iv) bearing forces were examined for all the bolts in the model and positive MoS were obtained. Design fastener forces were computed based on ref. [21]. Original selection of fasteners was made based on the linear FE analysis and without considering shims required in the assembly process due to manufacturing imperfections. Using the bolt load results from the nonlinear analysis and considering 0.05 in. thick shims, previously selected bolts were re-checked against the conditions specified in the previous paragraph. Shearing and bearing force design values did not identify any bolts with MoS values below 10%. However, checks against the combined axial tension and bending loads identified around 200 fasteners with negative MoS. Design modifications, such as bolt diameter increase and material change were implemented to these bolts to restore positive MoS. Finally, since a typical fastener used in the HWB test article had its axial tension design value significantly higher than the pull-through design value for composites and metallic fittings, many bolted joints required appropriately sized washers on composite panel and metallic fitting surfaces to prevent the pull-through from occurring. Application of washers permitted efficient use of bolt tension load carrying capability while avoiding a situation when a small bolt cap size would result in pull-through failure of a metallic fitting or a composite panel.
18 American Institute of Aeronautics and Astronautics
Figure 13 Von Mises stresses in metallic fittings under 2P DUL producing MoS below 10%.
19 American Institute of Aeronautics and Astronautics
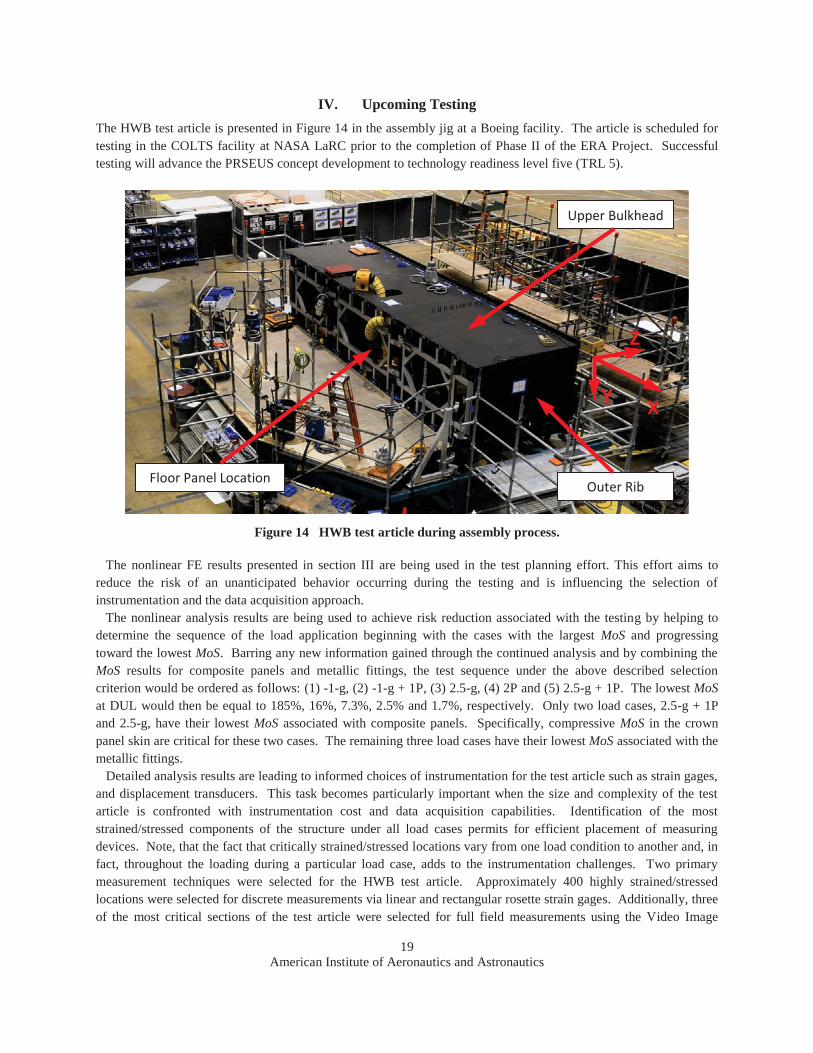
IV. Upcoming Testing The HWB test article is presented in Figure 14 in the assembly jig at a Boeing facility. The article is scheduled for testing in the COLTS facility at NASA LaRC prior to the completion of Phase II of the ERA Project. Successful testing will advance the PRSEUS concept development to technology readiness level five (TRL 5).
Figure 14 HWB test article during assembly process. The nonlinear FE results presented in section III are being used in the test planning effort. This effort aims to reduce the risk of an unanticipated behavior occurring during the testing and is influencing the selection of instrumentation and the data acquisition approach. The nonlinear analysis results are being used to achieve risk reduction associated with the testing by helping to determine the sequence of the load application beginning with the cases with the largest MoS and progressing toward the lowest MoS. Barring any new information gained through the continued analysis and by combining the MoS results for composite panels and metallic fittings, the test sequence under the above described selection criterion would be ordered as follows: (1) -1-g, (2) -1-g + 1P, (3) 2.5-g, (4) 2P and (5) 2.5-g + 1P. The lowest MoS at DUL would then be equal to 185%, 16%, 7.3%, 2.5% and 1.7%, respectively. Only two load cases, 2.5-g + 1P and 2.5-g, have their lowest MoS associated with composite panels. Specifically, compressive MoS in the crown panel skin are critical for these two cases. The remaining three load cases have their lowest MoS associated with the metallic fittings. Detailed analysis results are leading to informed choices of instrumentation for the test article such as strain gages, and displacement transducers. This task becomes particularly important when the size and complexity of the test article is confronted with instrumentation cost and data acquisition capabilities. Identification of the most strained/stressed components of the structure under all load cases permits for efficient placement of measuring devices. Note, that the fact that critically strained/stressed locations vary from one load condition to another and, in fact, throughout the loading during a particular load case, adds to the instrumentation challenges. Two primary measurement techniques were selected for the HWB test article. Approximately 400 highly strained/stressed locations were selected for discrete measurements via linear and rectangular rosette strain gages. Additionally, three of the most critical sections of the test article were selected for full field measurements using the Video Image
Upper Bulkhead
Outer Rib Floor Panel Location
Z
X Y
20 American Institute of Aeronautics and Astronautics
Correlation in Three Dimensions (VIC-3D) technique.22 Supportive data acquisition includes 19 displacement measurements using linear variable differential transformers (LVDT), primarily to verify symmetry of both load application and overall deformation. Several normal speed video recordings including audio channels will also be used. Video recordings will be acquired both outside and inside the test article.
V. Concluding Remarks A geometrically nonlinear FE analysis of a non-cylindrical composite structure carrying significant mechanical and pressure loadings was performed. The structure assembled from several PRSEUS panels was representative of an 80%-scale center section HWB airframe. For each load case the lowest MoS and the structural component where the lowest MoS occurred were identified. For all load cases considered positive MoS were obtained up to the DUL levels. The nonlinear results were compared with previously obtained linear solutions. Appreciable differences between the two were identified and the underlying reasons explained. For the composite PRSEUS panels, which are the primary focus of this study, the differences manifested themselves not only in terms of different extreme strain values, but often times also in extreme values occurring at different locations. Furthermore, in the nonlinear analyses it was noted that the extreme strain locations can change significantly as the load magnitude is increased. The differences between the nonlinear and linear solutions, however, did not demonstrate themselves throughout the entire structure. Certain less compliant sections of the test article, e.g., sandwich frames, sections close to metallic fittings or in proximity of thickness build ups, remained in what can be considered a linear response regime. Most appreciable differences between the nonlinear and linear solutions were identified under load cases producing significant compressive response resulting in local post-buckling in the thin-walled sections of the HWB test article. Note that in the unique HWB configuration compressed (or simultaneously compressed and pressurized) flat panel sections are common. Furthermore, the presence of the through-the-thickness panel reinforcement (stitching) provides an enhanced damage tolerance allowing PRSEUS to operate under locally post-buckled regime. The two afore-mentioned attributes of the HWB configuration are distinct from those typical for a conventional metallic fuselage structure with a cylindrical cross-section and panels that are not allowed to buckle. Consequently, while the linear analysis can often times suffice for the conventional airframe analysis, the HWB configuration requires the geometrically nonlinear analysis to accurately predict the post-buckling behavior. This observation substantiates the conclusion that a nonlinear analysis is warranted for all comparable PRSEUS designs as the simplified linear analysis, while providing reduced computational effort, cannot guarantee the conservativeness of the solution. Finally, initial test planning was advanced based on the nonlinear analysis results. This effort focused primarily on selecting the test loading sequence in the context of risk mitigation, and on selection of instrumentation for the test article. Successful testing of the HWB test article will not only serve as a proof of the PRSEUS concept but will also provide valuable data for validation of the predictive analysis presented in this paper.
Acknowledgements The authors wish to thank Dawn Jegley of the NASA Langley Research Center, Structural Mechanics and Concepts Branch, Hampton, VA and Alex Velicki, Kim Linton and Benson Black of The Boeing Company, Boeing Research and Technology, Huntington Beach, CA for their helpful discussions during the course of this work. A Langley Research Summer Scholar (LaRSS) program participant, R. Travis Kerr, is also acknowledged for his contribution to post-processing of the finite element analysis results.
References 1Li, V. and Velicki, A., “Advanced PRSEUS Structural Concept Design and Optimization,” Proceedings of the
12th AIAA/ISSMO Multidisciplinary Analysis and Optimization Conference, AIAA-2008-5840, Victoria, BC, Canada, 2008.
21 American Institute of Aeronautics and Astronautics
2Jegley, D. C., Velicki, A., and Hansen, D. A., “Structural Efficiency of Stitched Rod-Stiffened Composite Panels with Stiffener Crippling,” Proceedings of the 49th AIAA/ASME/ASCE/AHS/ASC Structures, Structural Dynamics and Materials Conference, AIAA-2008-2170, Schaumburg, IL, 2008.
3Velicki, A., Thrash, P., and Jegley, D. C., “Airframe Development for the Hybrid Wing Body Aircraft,” Proceedings of the 47th AIAA Aerospace Sciences Meeting Including The New Horizons Forum and Aerospace Exposition, AIAA-2009-932, Orlando, FL, 2009.
4Yovanof, N. P., Velicki A., and Li, V., “Advanced Structural Stability Analysis of a Nonlinear BWB-Shaped Vehicle,” Proceedings of the 50th AIAA/ASME/ASCE/AHS/ASC Structures, Structural Dynamics and Materials Conference, AIAA-2009-2452, Palm Springs, CA, 2009.
5Velicki, A. and Thrash, P., “Advanced Structural Concept Development Using Stitched Composites,” Proceedings of the 49th AIAA/ASME/ASCE/AHS/ASC Structures, Structural Dynamics and Materials Conference, AIAA-2008-2329, Schaumburg, IL, 2008.
6Velicki, A., “Damage Arresting Composites for Shaped Vehicles, Phase I Final Report,” NASA CR-2009-215932, NASA Langley Research Center, Hampton, VA, September 2009.
7Lovejoy, A. E., Rouse, M., Linton, K. A., and Li, V.P., “Pressure Testing of a Minimum Gauge PRSEUS Panel,” Proceedings of the 52nd AIAA/ASME/ASCE/AHS/ASC Structures, Structural Dynamics and Materials Conference, AIAA-2011-1813, Denver, CO, 2011.
8Velicki, A., Yovanof, N. P., Baraja, J., Linton, K., Li, V., Hawley, A., Thrash, P., DeCoux, S., and Pickell, R., “Damage Arresting Composites for Shaped Vehicles – Phase II Final Report,” NASA CR-2011-216880, NASA Langley Research Center, Hampton, VA, January 2011.
9 Velicki, A. and Jegley, D. C., “PRSEUS Development for the Hybrid Wing Body Aircraft,” Proceedings of the AIAA Centennial of Naval Aviation Forum “100 Years of Achievement and Progress,” AIAA-2011-7025, Virginia Beach, VA, 2011.
10Yovanof, N., Baraja, J, Lovejoy, A., Gould, K., “Design, Analysis, and Testing of a PRSEUS Pressure Cube to Investigate Assembly Joints,” Proceedings of the 2012 Aircraft Airworthiness and Sustainment Conference, TP5431, Baltimore, MD, April 2012.
11Yovanof, N., and Jegley, D. C., “Compressive Behavior of Frame-Stiffened Composite Panels,” 52th AIAA Structures Dynamics and Materials Conference, AIAA-2011-1913, Denver, CO, April 2011.
12Przekop, A., Jegley, D. C., “Testing and Analysis Validation of a Metallic Repair Applied to a PRSEUS Tension Panel,” Proceedings of the 54th AIAA/ASME/ASCE/AHS/ASC Structures, Structural Dynamics and Materials Conference, AIAA-2013-1735, Boston, MA, April 2013.
13Jegley, D. C., and Velicki, A., "Status of Advanced Stitched Unitized Composite Aircraft Structure," Proceedings of the 51st AIAA Aerospace Sciences Meeting, AIAA 2013-0410, Grapevine, TX, 7-10 Jan. 2013.
14Velicki, A., and Thrash, P. J., “Damage Arrest Design Approach Using Stitched Composites”, The Aeronautical Journal, Vol. 115, No. 1174, pp. 789-795, Royal Aeronautical Society, London, UK, December 2011.
15Bergen, A., Bakuckas, J., Lovejoy, A., Jegley, D., Linton, K., Korkosz, G., Awerbuch, J., Tan, T., “Full-Scale Test and Analysis of a PRSEUS Fuselage Panel to Assess Damage-Containment Features,” Proceedings of the 2011 Aircraft Airworthiness and Sustainment Conference, TP4558, San Diego, CA, 20 April 2011.
16Velicki, A., Thrash P. J., "Blended Wing Body Structural Concept Development," Proceedings of Aircraft Structural Design Conference, Liverpool, UK, 14-16 October 2008.
17Ambur, D. A., Rouse, M., Starnes, J. H., Stuart, M. J., “Facilities for Combined Loads Testing of Aircraft Structures to Satisfy Structural Technology Development Requirements,” Proceedings of the 5th Annual Advanced Composites Technology Conference, Seattle, WA, August 1994.
18Wu, H. T., Shaw, P., Przekop, A., “Analysis of a Hybrid Wing Body Center Section Test Article,” Proceedings of the 54th AIAA/ASME/ASCE/AHS/ASC Structures, Structural Dynamics and Materials Conference, AIAA-2013-1734, Boston, MA, April 2013.
19MSC Nastran 2012.2 Quick Reference Guide, MSC Software Corporation, Santa Ana, CA, 2012. 20Title 14 Code of Federal Regulation, Part 25 “Airworthiness Standards: Transport Category Airplanes,”
Subpart C “Structure,” Electronic Code of Federal Regulations, http://www.ecfr.gov/cgi-bin/text-idx?c=ecfr&tpl =/ecfrbrowse/Title14/14cfr25_main_02.tpl
22 American Institute of Aeronautics and Astronautics
21Mirsamadi, S., “Advanced Subsonic Technology (AST) Composite Wing Material Stiffness and Allowable Strength Properties for Stitched Composite Laminates,” Report Number 98K0318, The Boeing Company, Advanced Transport Aircraft Development, Long Beach, CA, September 1998.
22McGowan, D. M., Ambur, D. R., and McNeil, S. R., “Full-field Structural Response of Composite Structures: Analysis and Experiment,” Proceedings of the 44th AIAA/ASME/ASCE/AHS/ASC Structures, Structural Dynamics and Materials Conference, AIAA 2003-1623, Norfolk, VA, 2003.