Embed Size (px)
Citation preview
PHYSICAL REVIEW B 96, 195420 (2017)
Nonperturbative harmonic generation in graphene from intense midinfrared pulsed light
M. Taucer,* T. J. Hammond, P. B. Corkum, and G. VampaJoint Attosecond Science Laboratory, National Research Council of Canada and University of Ottawa, Ottawa, Ontario K1N 6N5, Canada
C. Couture, N. Thiré, B. E. Schmidt, and F. LégaréINRS-EMT, 1650 Boulevard Lionel-Boulet, CP 1020, Varennes, Qubec J3X 1S2, Canada
H. Selvi, N. Unsuree, B. Hamilton, T. J. Echtermeyer, and M. A. DeneckePhoton Science Institute, University of Manchester, Manchester M13 9PL, United Kingdom
(Received 17 December 2016; revised manuscript received 26 September 2017; published 13 November 2017)
In solids, high harmonic radiation arises from the subcycle dynamics of electrons and holes under the action ofan intense laser field. The strong-field regime opens new opportunities to understand and control carrier dynamicson ultrafast time scales, including the coherent dynamics of quasiparticles such as massless Dirac fermions. Here,we irradiate monolayer and few-layer graphene with intense infrared light to produce nonperturbative harmonicsof the fundamental up to the seventh order. We find that the polarization dependence shows surprising agreementwith gas-phase harmonics. Using a two-band model, we explore the nonlinear current due to electrons nearthe Dirac points, and we discuss the interplay between intraband and interband contributions to the harmonicspectrum. This interplay opens new opportunities to access ultrafast and strong-field physics of graphene.
DOI: 10.1103/PhysRevB.96.195420
I. INTRODUCTION
The interaction of intense light with atoms and molecules,mainly in the gas phase, produces high harmonics. Thisnonperturbative process occurs when electrons are pulled awayfrom their host atoms or molecules in the laser field andaccelerated back toward the host ion as the field reverses. If theelectron and ion recombine, they emit coherent high-energyphotons [1]. The success of strong-field physics for gas-phaseatoms and molecules has motivated a search for similar effectsin the solid state. Recently, high harmonic emission has beenobserved from a range of solids [2–4], including ZnO [5,6],silicon [7], and recently transition-metal dichalcogenides [8,9].The observations are important because the high harmonics arenot only a unique source of radiation, they are also a new wayof studying material. Important for this paper, high harmonicgeneration in the solid state opens the possibility of studyingthe high-field response of novel materials and confined systemsof low dimensionality. Two-dimensional materials, in partic-ular, exhibit unique electronic properties and quasiparticles,including massless Dirac fermions in graphene.
Nonlinear optical properties of graphene have been anactive area of research recently, with demonstrations of pertur-bative processes including four-wave mixing [10] and third-harmonic generation [11]. Beyond this, the nonperturbative,strong-field regime has also been the focus of theoretical andexperimental work. Early studies predicted highly efficienthigh harmonic generation due to the motion of carriers in theunusual band structure of graphene [12,13], and subsequenttheoretical work has revealed the importance of the subtleinterplay between interband and intraband processes [14–17].Meanwhile, there have been predictions of new effects in thestrong-field regime for wavelengths from the terahertz (THz)to the optical part of the electromagnetic spectrum, including
ultrafast interferometry and signatures of Berry phase [18], aswell as a recent prediction of plasmonic enhancement of highharmonic generation [19]. Experimentally, the strong-fieldregime has been studied in the THz regime, showing evidenceof odd harmonics up to the fifth order [20,21], in agreementwith theory [14,15,22].
Here, we measure the intensity and polarization dependenceof nonperturbative harmonics generated in monlayer andfew-layer graphene. We compare the polarization dependencewith predictions of the gas-phase re-collision model, showingstriking agreement. Using a two-band model, we consider thecontributions of interband and intraband currents. While the in-traband contribution is greater, we discuss the possibility of ob-serving their coherent interplay due to an intensity-dependentphase difference. This opens a new route to experimentallyaccessing strong-field and ultrafast processes in graphene.
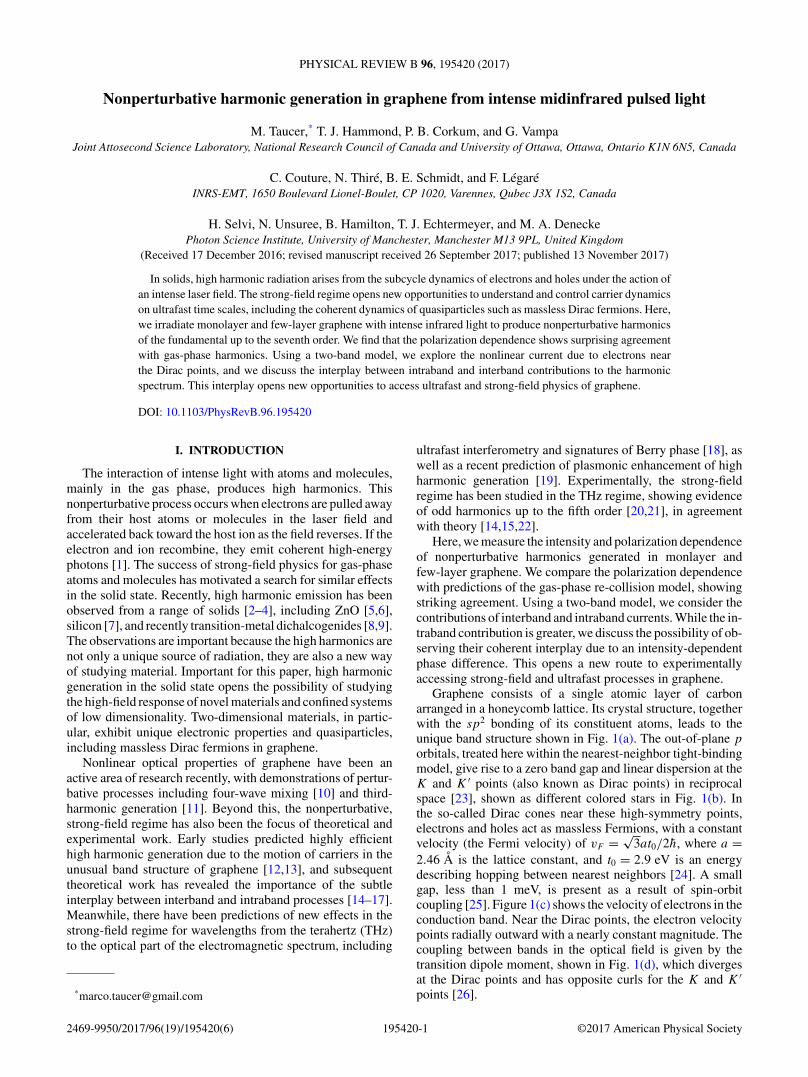
Graphene consists of a single atomic layer of carbonarranged in a honeycomb lattice. Its crystal structure, togetherwith the sp2 bonding of its constituent atoms, leads to theunique band structure shown in Fig. 1(a). The out-of-plane p
orbitals, treated here within the nearest-neighbor tight-bindingmodel, give rise to a zero band gap and linear dispersion at theK and K ′ points (also known as Dirac points) in reciprocalspace [23], shown as different colored stars in Fig. 1(b). Inthe so-called Dirac cones near these high-symmetry points,electrons and holes act as massless Fermions, with a constantvelocity (the Fermi velocity) of vF = √
3at0/2h, where a =2.46 A is the lattice constant, and t0 = 2.9 eV is an energydescribing hopping between nearest neighbors [24]. A smallgap, less than 1 meV, is present as a result of spin-orbitcoupling [25]. Figure 1(c) shows the velocity of electrons in theconduction band. Near the Dirac points, the electron velocitypoints radially outward with a nearly constant magnitude. Thecoupling between bands in the optical field is given by thetransition dipole moment, shown in Fig. 1(d), which divergesat the Dirac points and has opposite curls for the K and K ′points [26].
2469-9950/2017/96(19)/195420(6) 195420-1 ©2017 American Physical Society
M. TAUCER et al. PHYSICAL REVIEW B 96, 195420 (2017)
FIG. 1. (a) Band structure of graphene within the nearest-neighbor tight-binding approximation. Conduction and valence bandsare shown in blue and red, respectively. (b) Reciprocal space, withreciprocal lattice sites shown as circular dots, including the � pointat the origin. Dirac points are indicated by stars, with differentcolors for the inequivalent K and K ′ points. The dotted line showsthe boundary of the first Brillouin zone. (c) Electron velocity inthe conduction band, as a function of reciprocal space coordinate.Color represents the magnitude of velocity, and arrows indicate itsdirection. (d) Transition dipole moment as a function of reciprocalspace coordinate. Color shows the magnitude on a logarithmic scale,and the direction is indicated by arrows. Unless otherwise indicated,we use atomic units.
II. EXPERIMENTAL DETAILS
Two sets of samples were prepared for the measurements:multi- and single-layer graphene. For the multilayer samples,graphene was mechanically exfoliated from bulk graphite ontoa layer of polymethyl methacrylate (PMMA) and characterizedby atomic-force microscopy yielding thicknesses in the rangeof 5–15 nm. Subsequently, the graphene flakes including thePMMA support were transferred onto the sapphire targetsubstrate [Al2O3, c plane (0001) with a thickness of 500 μm]and the PMMA removed with acetone. Single-layer graphenesamples were prepared from commercially sourced chemicalvapor deposition–grown graphene on copper foil. UsingPMMA as a support, the copper foil was etched away andthe PMMA graphene stack transferred to the 500-μm-thicksapphire target substrate. The PMMA supporting layer wasthen removed with acetone.
Our measurements were performed on the 100-Hz rep-etition rate laser at the Advanced Laser Light Source. Wegenerated harmonics using femtosecond pulses with centralwavelengths between 3.1 and 3.9 μm. The pulse durationwas 70 fs, and pulse energies were between 3 and 16 μJ.The Rayleigh length was 8–10 mm. In order to avoiddamage and to increase signal during the experiments, we
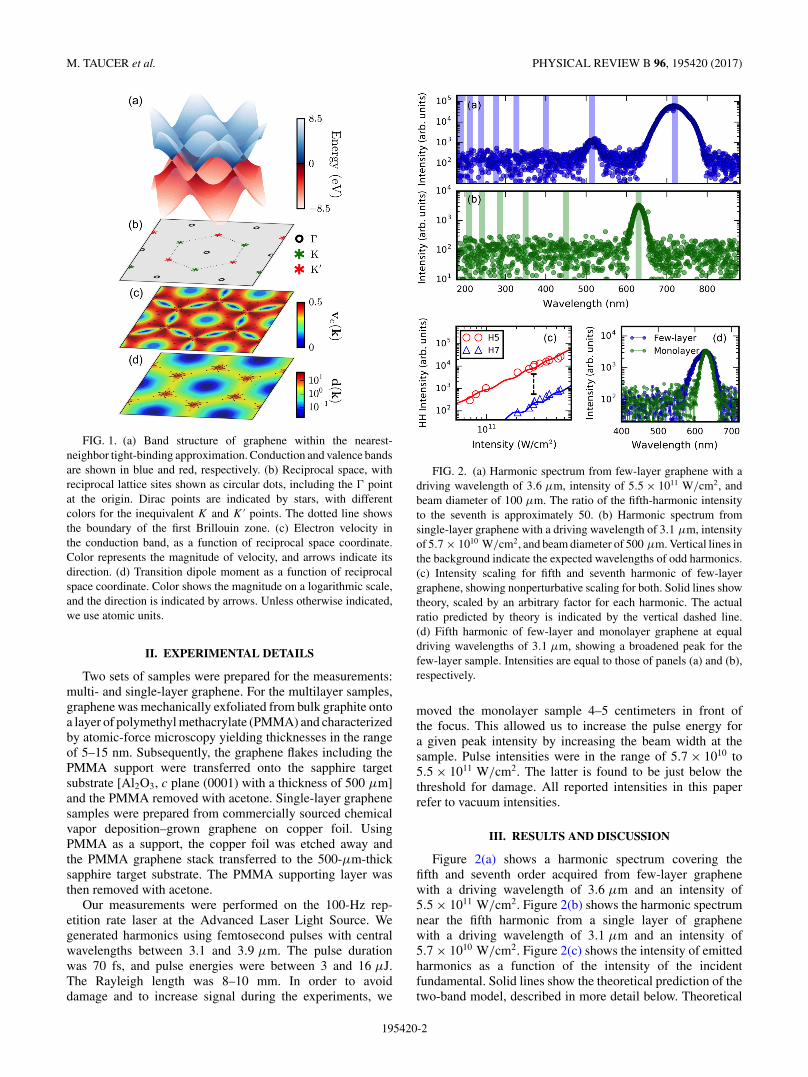
FIG. 2. (a) Harmonic spectrum from few-layer graphene with adriving wavelength of 3.6 μm, intensity of 5.5 × 10¹¹ W/cm2, andbeam diameter of 100 μm. The ratio of the fifth-harmonic intensityto the seventh is approximately 50. (b) Harmonic spectrum fromsingle-layer graphene with a driving wavelength of 3.1 μm, intensityof 5.7 × 10¹⁰ W/cm2, and beam diameter of 500 μm. Vertical lines inthe background indicate the expected wavelengths of odd harmonics.(c) Intensity scaling for fifth and seventh harmonic of few-layergraphene, showing nonperturbative scaling for both. Solid lines showtheory, scaled by an arbitrary factor for each harmonic. The actualratio predicted by theory is indicated by the vertical dashed line.(d) Fifth harmonic of few-layer and monolayer graphene at equaldriving wavelengths of 3.1 μm, showing a broadened peak for thefew-layer sample. Intensities are equal to those of panels (a) and (b),respectively.
moved the monolayer sample 4–5 centimeters in front ofthe focus. This allowed us to increase the pulse energy fora given peak intensity by increasing the beam width at thesample. Pulse intensities were in the range of 5.7 × 10¹⁰ to5.5 × 1011 W/cm2. The latter is found to be just below thethreshold for damage. All reported intensities in this paperrefer to vacuum intensities.
III. RESULTS AND DISCUSSION
Figure 2(a) shows a harmonic spectrum covering thefifth and seventh order acquired from few-layer graphenewith a driving wavelength of 3.6 μm and an intensity of5.5 × 1011 W/cm2. Figure 2(b) shows the harmonic spectrumnear the fifth harmonic from a single layer of graphenewith a driving wavelength of 3.1 μm and an intensity of5.7 × 1010 W/cm2. Figure 2(c) shows the intensity of emittedharmonics as a function of the intensity of the incidentfundamental. Solid lines show the theoretical prediction of thetwo-band model, described in more detail below. Theoretical
195420-2
NONPERTURBATIVE HARMONIC GENERATION IN . . . PHYSICAL REVIEW B 96, 195420 (2017)
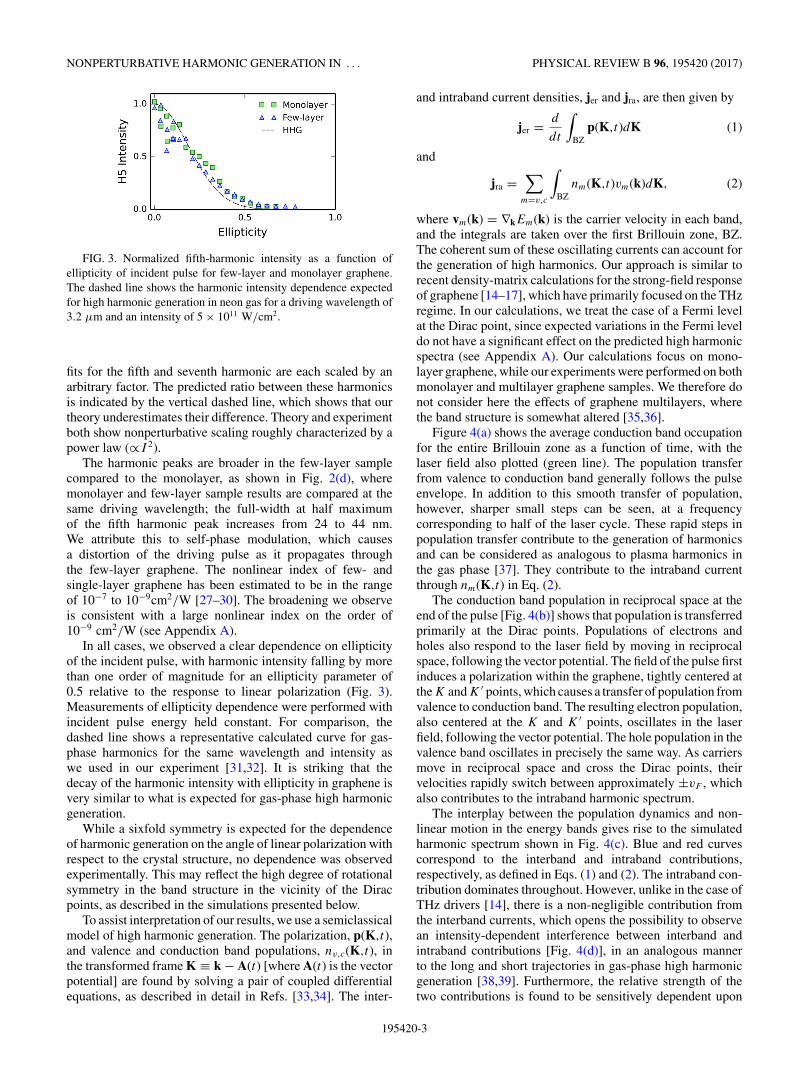
FIG. 3. Normalized fifth-harmonic intensity as a function ofellipticity of incident pulse for few-layer and monolayer graphene.The dashed line shows the harmonic intensity dependence expectedfor high harmonic generation in neon gas for a driving wavelength of3.2 μm and an intensity of 5 × 10¹¹ W/cm2.
fits for the fifth and seventh harmonic are each scaled by anarbitrary factor. The predicted ratio between these harmonicsis indicated by the vertical dashed line, which shows that ourtheory underestimates their difference. Theory and experimentboth show nonperturbative scaling roughly characterized by apower law (∝I 2).
The harmonic peaks are broader in the few-layer samplecompared to the monolayer, as shown in Fig. 2(d), wheremonolayer and few-layer sample results are compared at thesame driving wavelength; the full-width at half maximumof the fifth harmonic peak increases from 24 to 44 nm.We attribute this to self-phase modulation, which causesa distortion of the driving pulse as it propagates throughthe few-layer graphene. The nonlinear index of few- andsingle-layer graphene has been estimated to be in the rangeof 10−7 to 10−9cm2/W [27–30]. The broadening we observeis consistent with a large nonlinear index on the order of10−9 cm2/W (see Appendix A).
In all cases, we observed a clear dependence on ellipticityof the incident pulse, with harmonic intensity falling by morethan one order of magnitude for an ellipticity parameter of0.5 relative to the response to linear polarization (Fig. 3).Measurements of ellipticity dependence were performed withincident pulse energy held constant. For comparison, thedashed line shows a representative calculated curve for gas-phase harmonics for the same wavelength and intensity aswe used in our experiment [31,32]. It is striking that thedecay of the harmonic intensity with ellipticity in graphene isvery similar to what is expected for gas-phase high harmonicgeneration.
While a sixfold symmetry is expected for the dependenceof harmonic generation on the angle of linear polarization withrespect to the crystal structure, no dependence was observedexperimentally. This may reflect the high degree of rotationalsymmetry in the band structure in the vicinity of the Diracpoints, as described in the simulations presented below.
To assist interpretation of our results, we use a semiclassicalmodel of high harmonic generation. The polarization, p(K,t),and valence and conduction band populations, nv,c(K,t), inthe transformed frame K ≡ k − A(t) [where A(t) is the vectorpotential] are found by solving a pair of coupled differentialequations, as described in detail in Refs. [33,34]. The inter-
and intraband current densities, jer and jra, are then given by
jer = d
dt
∫BZ
p(K,t)dK (1)
and
jra =∑
m=v,c
∫BZ
nm(K,t)vm(k)dK, (2)
where vm(k) = ∇kEm(k) is the carrier velocity in each band,and the integrals are taken over the first Brillouin zone, BZ.The coherent sum of these oscillating currents can account forthe generation of high harmonics. Our approach is similar torecent density-matrix calculations for the strong-field responseof graphene [14–17], which have primarily focused on the THzregime. In our calculations, we treat the case of a Fermi levelat the Dirac point, since expected variations in the Fermi leveldo not have a significant effect on the predicted high harmonicspectra (see Appendix A). Our calculations focus on mono-layer graphene, while our experiments were performed on bothmonolayer and multilayer graphene samples. We therefore donot consider here the effects of graphene multilayers, wherethe band structure is somewhat altered [35,36].
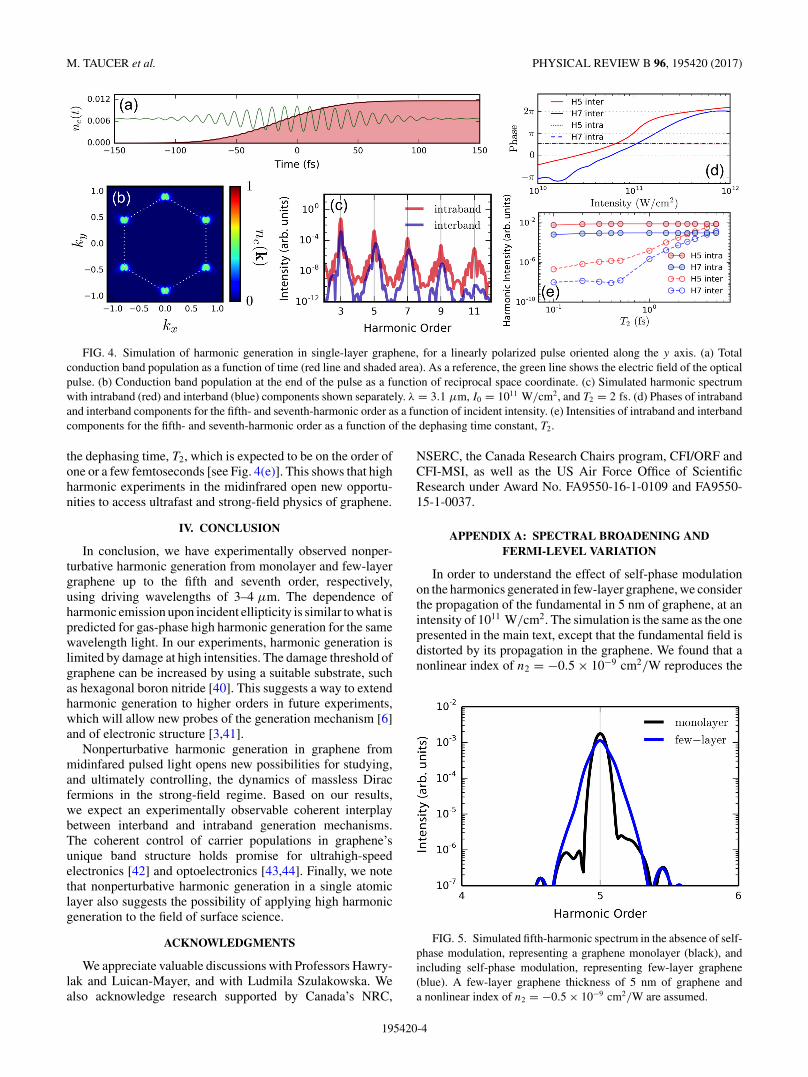
Figure 4(a) shows the average conduction band occupationfor the entire Brillouin zone as a function of time, with thelaser field also plotted (green line). The population transferfrom valence to conduction band generally follows the pulseenvelope. In addition to this smooth transfer of population,however, sharper small steps can be seen, at a frequencycorresponding to half of the laser cycle. These rapid steps inpopulation transfer contribute to the generation of harmonicsand can be considered as analogous to plasma harmonics inthe gas phase [37]. They contribute to the intraband currentthrough nm(K,t) in Eq. (2).
The conduction band population in reciprocal space at theend of the pulse [Fig. 4(b)] shows that population is transferredprimarily at the Dirac points. Populations of electrons andholes also respond to the laser field by moving in reciprocalspace, following the vector potential. The field of the pulse firstinduces a polarization within the graphene, tightly centered atthe K and K ′ points, which causes a transfer of population fromvalence to conduction band. The resulting electron population,also centered at the K and K ′ points, oscillates in the laserfield, following the vector potential. The hole population in thevalence band oscillates in precisely the same way. As carriersmove in reciprocal space and cross the Dirac points, theirvelocities rapidly switch between approximately ±vF , whichalso contributes to the intraband harmonic spectrum.
The interplay between the population dynamics and non-linear motion in the energy bands gives rise to the simulatedharmonic spectrum shown in Fig. 4(c). Blue and red curvescorrespond to the interband and intraband contributions,respectively, as defined in Eqs. (1) and (2). The intraband con-tribution dominates throughout. However, unlike in the case ofTHz drivers [14], there is a non-negligible contribution fromthe interband currents, which opens the possibility to observean intensity-dependent interference between interband andintraband contributions [Fig. 4(d)], in an analogous mannerto the long and short trajectories in gas-phase high harmonicgeneration [38,39]. Furthermore, the relative strength of thetwo contributions is found to be sensitively dependent upon
195420-3
M. TAUCER et al. PHYSICAL REVIEW B 96, 195420 (2017)
FIG. 4. Simulation of harmonic generation in single-layer graphene, for a linearly polarized pulse oriented along the y axis. (a) Totalconduction band population as a function of time (red line and shaded area). As a reference, the green line shows the electric field of the opticalpulse. (b) Conduction band population at the end of the pulse as a function of reciprocal space coordinate. (c) Simulated harmonic spectrumwith intraband (red) and interband (blue) components shown separately. λ = 3.1 μm, I0 = 1011 W/cm2, and T2 = 2 fs. (d) Phases of intrabandand interband components for the fifth- and seventh-harmonic order as a function of incident intensity. (e) Intensities of intraband and interbandcomponents for the fifth- and seventh-harmonic order as a function of the dephasing time constant, T2.
the dephasing time, T2, which is expected to be on the order ofone or a few femtoseconds [see Fig. 4(e)]. This shows that highharmonic experiments in the midinfrared open new opportu-nities to access ultrafast and strong-field physics of graphene.
IV. CONCLUSION
In conclusion, we have experimentally observed nonper-turbative harmonic generation from monolayer and few-layergraphene up to the fifth and seventh order, respectively,using driving wavelengths of 3–4 μm. The dependence ofharmonic emission upon incident ellipticity is similar to what ispredicted for gas-phase high harmonic generation for the samewavelength light. In our experiments, harmonic generation islimited by damage at high intensities. The damage threshold ofgraphene can be increased by using a suitable substrate, suchas hexagonal boron nitride [40]. This suggests a way to extendharmonic generation to higher orders in future experiments,which will allow new probes of the generation mechanism [6]and of electronic structure [3,41].
Nonperturbative harmonic generation in graphene frommidinfared pulsed light opens new possibilities for studying,and ultimately controlling, the dynamics of massless Diracfermions in the strong-field regime. Based on our results,we expect an experimentally observable coherent interplaybetween interband and intraband generation mechanisms.The coherent control of carrier populations in graphene’sunique band structure holds promise for ultrahigh-speedelectronics [42] and optoelectronics [43,44]. Finally, we notethat nonperturbative harmonic generation in a single atomiclayer also suggests the possibility of applying high harmonicgeneration to the field of surface science.
ACKNOWLEDGMENTS
We appreciate valuable discussions with Professors Hawry-lak and Luican-Mayer, and with Ludmila Szulakowska. Wealso acknowledge research supported by Canada’s NRC,
NSERC, the Canada Research Chairs program, CFI/ORF andCFI-MSI, as well as the US Air Force Office of ScientificResearch under Award No. FA9550-16-1-0109 and FA9550-15-1-0037.
APPENDIX A: SPECTRAL BROADENING ANDFERMI-LEVEL VARIATION
In order to understand the effect of self-phase modulationon the harmonics generated in few-layer graphene, we considerthe propagation of the fundamental in 5 nm of graphene, at anintensity of 1011 W/cm2. The simulation is the same as the onepresented in the main text, except that the fundamental field isdistorted by its propagation in the graphene. We found that anonlinear index of n2 = −0.5 × 10⁻⁹ cm2/W reproduces the
FIG. 5. Simulated fifth-harmonic spectrum in the absence of self-phase modulation, representing a graphene monolayer (black), andincluding self-phase modulation, representing few-layer graphene(blue). A few-layer graphene thickness of 5 nm of graphene anda nonlinear index of n2 = −0.5 × 10⁻⁹ cm2/W are assumed.
195420-4
NONPERTURBATIVE HARMONIC GENERATION IN . . . PHYSICAL REVIEW B 96, 195420 (2017)
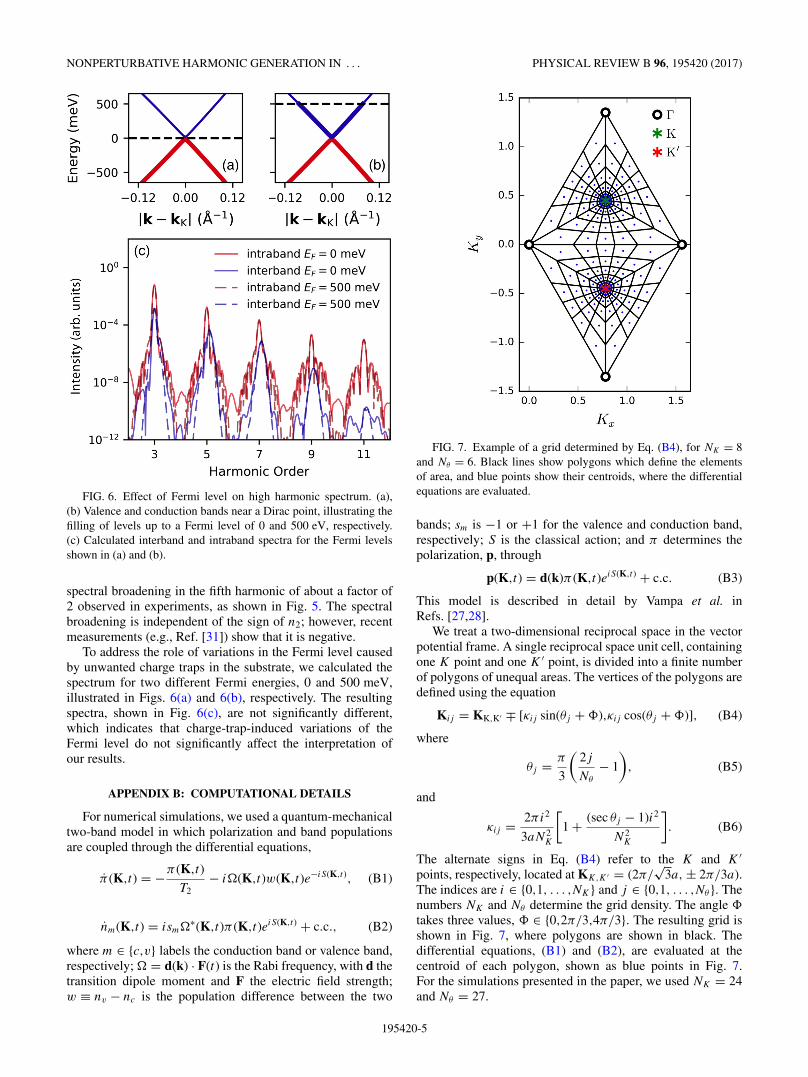
FIG. 6. Effect of Fermi level on high harmonic spectrum. (a),(b) Valence and conduction bands near a Dirac point, illustrating thefilling of levels up to a Fermi level of 0 and 500 eV, respectively.(c) Calculated interband and intraband spectra for the Fermi levelsshown in (a) and (b).
spectral broadening in the fifth harmonic of about a factor of2 observed in experiments, as shown in Fig. 5. The spectralbroadening is independent of the sign of n2; however, recentmeasurements (e.g., Ref. [31]) show that it is negative.
To address the role of variations in the Fermi level causedby unwanted charge traps in the substrate, we calculated thespectrum for two different Fermi energies, 0 and 500 meV,illustrated in Figs. 6(a) and 6(b), respectively. The resultingspectra, shown in Fig. 6(c), are not significantly different,which indicates that charge-trap-induced variations of theFermi level do not significantly affect the interpretation ofour results.
APPENDIX B: COMPUTATIONAL DETAILS
For numerical simulations, we used a quantum-mechanicaltwo-band model in which polarization and band populationsare coupled through the differential equations,
π (K,t) = −π (K,t)
T2− i�(K,t)w(K,t)e−iS(K,t), (B1)
nm(K,t) = ism�∗(K,t)π (K,t)eiS(K,t) + c.c., (B2)
where m ∈ {c,v} labels the conduction band or valence band,respectively; � = d(k) · F(t) is the Rabi frequency, with d thetransition dipole moment and F the electric field strength;w ≡ nv − nc is the population difference between the two
FIG. 7. Example of a grid determined by Eq. (B4), for NK = 8and Nθ = 6. Black lines show polygons which define the elementsof area, and blue points show their centroids, where the differentialequations are evaluated.
bands; sm is −1 or +1 for the valence and conduction band,respectively; S is the classical action; and π determines thepolarization, p, through
p(K,t) = d(k)π (K,t)eiS(K,t) + c.c. (B3)
This model is described in detail by Vampa et al. inRefs. [27,28].
We treat a two-dimensional reciprocal space in the vectorpotential frame. A single reciprocal space unit cell, containingone K point and one K ′ point, is divided into a finite numberof polygons of unequal areas. The vertices of the polygons aredefined using the equation
Kij = KK,K′ ∓ [κij sin(θj + �),κij cos(θj + �)], (B4)
where
θj = π
3
(2j
Nθ
− 1
), (B5)
and
κij = 2πi2
3aN2K
[1 + (sec θj − 1)i2
N2K
]. (B6)
The alternate signs in Eq. (B4) refer to the K and K ′points, respectively, located at KK,K ′ = (2π/
√3a, ± 2π/3a).
The indices are i ∈ {0,1, . . . ,NK} and j ∈ {0,1, . . . ,Nθ }. Thenumbers NK and Nθ determine the grid density. The angle �
takes three values, � ∈ {0,2π/3,4π/3}. The resulting grid isshown in Fig. 7, where polygons are shown in black. Thedifferential equations, (B1) and (B2), are evaluated at thecentroid of each polygon, shown as blue points in Fig. 7.For the simulations presented in the paper, we used NK = 24and Nθ = 27.
195420-5
M. TAUCER et al. PHYSICAL REVIEW B 96, 195420 (2017)
Because of its vanishing band gap, graphene exhibits adivergent transition dipole moment at the K and K ′ points,as shown in Fig. 1(d). In order to address the computationaldifficulties that this divergence poses, we artificially limit thetransition dipole moment by opening a fictitious gap of 10 meV,which creates an upper limit of approximately 60 atomic units.
Since this gap is smaller than the important energy scales, itdoes not have a significant effect on our results. We establishthis by checking for convergence of our simulation with respectto a shrinking gap. A smaller gap can be used, at the cost oflonger computation time. We also check for convergence withrespect to grid dimensions and density of time steps.
[1] P. B. Corkum, Phys. Rev. Lett. 71, 1994 (1993).[2] O. Schubert, M. Hohenleutner, F. Langer, B. Urbanek, C. Lange,
U. Huttner, D. Golde, T. Meier, M. Kira, S. W. Koch, and R.Huber, Nat. Photonics 8, 119 (2014).
[3] T. T. Luu, M. Garg, S. Y. Kruchinin, A. Moulet, M. T. Hassan,and E. Goulielmakis, Nature (London) 521, 498 (2015).
[4] Y. S. You, D. A. Reis, and S. Ghimire, Nat. Phys. 13, 345(2017).
[5] S. Ghimire, A. D. DiChiara, E. Sistrunk, P. Agostini, L. F.DiMauro, and D. A. Reis, Nat. Phys. 7, 138 (2011).
[6] G. Vampa, T. J. Hammond, N. Thire, B. E. Schmidt, F. Legare,C. R. McDonald, T. Brabec, and P. B. Corkum, Nature (London)522, 462 (2015).
[7] G. Vampa, T. J. Hammond, N. Thiré, B. E. Schmidt, F. Légaré,D. D. Klug, and P. B. Corkum, arXiv:1605.06345.
[8] F. Langer, M. Hohenleutner, C. P. Schmid, C. Poellmann, P.Nagler, T. Korn, C. Schüller, M. S. Sherwin, U. Huttner, J. T.Steiner, S. W. Koch, M. Kira, and R. Huber, Nature (London)533, 225 (2016).
[9] H. Liu, Y. Li, Y. S. You, S. Ghimire, T. F. Heinz, and D. A. Reis,Nat. Phys. 13, 262 (2017).
[10] E. Hendry, P. J. Hale, J. Moger, A. K. Savchenko, and S. A.Mikhailov, Phys. Rev. Lett. 105, 097401 (2010).
[11] N. Kumar, J. Kumar, C. Gerstenkorn, R. Wang, H. Y.Chiu, A. L. Smirl, and H. Zhao, Phys. Rev. B 87, 121406(2013).
[12] A. K. Gupta, O. E. Alon, and N. Moiseyev, Phys. Rev. B 68,205101 (2003).
[13] S. A. Mikhailov, Europhys. Lett. 79, 27002 (2007).[14] K. L. Ishikawa, Phys. Rev. B 82, 201402 (2010).[15] K. L. Ishikawa, New J. Phys. 15, 055021 (2013).[16] I. Al-Naib, J. E. Sipe, and M. M. Dignam, Phys. Rev. B 90,
245423 (2014).[17] I. Al-Naib, J. E. Sipe, and M. M. Dignam, New J. Phys. 17,
113018 (2015).[18] H. K. Kelardeh, V. Apalkov, and M. I. Stockman, Phys. Rev. B
93, 155434 (2016).[19] J. D. Cox, A. Marini, and F. J. G. de Abajo, Nat. Commun. 8,
14380 (2017).[20] P. Bowlan, E. Martinez-Moreno, K. Reimann, T. Elsaesser, and
M. Woerner, Phys. Rev. B 89, 041408 (2014).[21] P. Bowlan, E. Martinez-Moreno, K. Reimann, M. Woerner, and
T. Elsaesser, New J. Phys. 16, 013027 (2014).[22] L. A. Chizhova, F. Libisch, and J. Burgdörfer, Phys. Rev. B 94,
075412 (2016).
[23] A. H. Castro Neto, F. Guinea, N. M. R. Peres, K. S. Novoselov,and A. K. Geim, Rev. Mod. Phys. 81, 109 (2009).
[24] M. L. Sadowski, G. Martinez, M. Potemski, C. Berger, andW. A. de Heer, Phys. Rev. Lett. 97, 266405 (2006).
[25] S. Konschuh, M. Gmitra, and J. Fabian, Phys. Rev. B 82, 245412(2010).
[26] H. K. Kelardeh, V. Apalkov, and M. I. Stockman, Phys. Rev. B91, 045439 (2015).
[27] H. Zhang, S. Virally, Q. Bao, L. Ping, S. Massar, N. Godbout,and P. Kockaert, Opt. Lett. 37, 1856 (2012).
[28] W. Chen, G. Wang, S. Qin, C. Wang, J. Fang, J. Qi, X. Zhang,L. Wang, H. Jia, and S. Chang, AIP Adv. 3, 042123 (2013).
[29] L. Miao, Y. Jiang, S. Lu, B. Shi, C. Zhao, H. Zhang, and S. Wen,Photonics Res. 3, 214 (2015).
[30] E. Dremetsika, B. Dlubak, S.-P. Gorza, C. Ciret, M.-B. Martin,S. Hofmann, P. Seneor, D. Dolfi, S. Massar, P. Emplit, and P.Kockaert, Opt. Lett. 41, 3281 (2016).
[31] H. Xu, H. Xiong, B. Zeng, W. Chu, Y. Fu, J. Yao, J. Chen, X.Liu, Y. Cheng, and Z. Xu, Opt. Lett. 35, 472 (2010).
[32] M. Möller, Y. Cheng, S. D. Khan, B. Zhao, K. Zhao, M. Chini,G. G. Paulus, and Z. Chang, Phys. Rev. A 86, 011401 (2012).
[33] G. Vampa, C. R. McDonald, G. Orlando, D. D. Klug, P. B.Corkum, and T. Brabec, Phys. Rev. Lett. 113, 073901 (2014).
[34] G. Vampa, C. R. McDonald, G. Orlando, P. B. Corkum, and T.Brabec, Phys. Rev. B 91, 064302 (2015).
[35] B. Partoens and F. M. Peeters, Phys. Rev. B 74, 075404 (2006).[36] B. Partoens and F. M. Peeters, Phys. Rev. B 75, 193402 (2007).[37] F. Brunel, J. Opt. Soc. Am. B 7, 521 (1990).[38] A. Zaïr, M. Holler, A. Guandalini, F. Schapper, J. Biegert,
L. Gallmann, U. Keller, A. S. Wyatt, A. Monmayrant, I. A.Walmsley, E. Cormier, T. Auguste, J. P. Caumes, and P. Salières,Phys. Rev. Lett. 100, 143902 (2008).
[39] D. C. Yost, T. R. Schibli, J. Ye, J. L. Tate, J. Hostetter, K. J.Schafer, and M. B. Gaarde, Nat. Phys. 5, 815 (2009).
[40] C. R. Dean, A. F. Young, I. Meric, C. Lee, L. Wang, S. Sorgenfrei,K. Watanabe, T. Taniguchi, P. Kim, K. L. Shepard, and J. Hone,Nat. Nanotechnol. 5, 722 (2010).
[41] G. Vampa, T. J. Hammond, N. Thire, B. E. Schmidt, F. Legare,C. R. McDonald, T. Brabec, D. D. Klug, and P. B. Corkum,Phys. Rev. Lett. 115, 193603 (2015).
[42] F. Schwierz, Nat. Nanotechnol. 5, 487 (2010).[43] F. Bonaccorso, Z. Sun, T. Hasan, and A. C. Ferrari,
Nat. Photonics 4, 611 (2010).[44] M. Liu, X. Yin, E. Ulin-Avila, B. Geng, T. Zentgraf, L. Ju, F.
Wang, and X. Zhang, Nature (London) 474, 64 (2011).
195420-6