Embed Size (px)
Citation preview

Nonprofit Success Pack ReportsWorkbook
@salesforcedocsLast updated: February 17, 2017

© Copyright 2000–2017 salesforce.com, inc. All rights reserved. Salesforce is a registered trademark of salesforce.com, inc.,as are other names and marks. Other marks appearing herein may be trademarks of their respective owners.

CONTENTS
PART 1: THE BASICS . . . . . . . . . . . . . . . . . . . . . . . . . . . . . . . . . . . . . . . . . . . . . . . . 1Prerequisites . . . . . . . . . . . . . . . . . . . . . . . . . . . . . . . . . . . . . . . . . . . . . . . . . . . . . . . . . 2Nonprofit Success Pack Reports . . . . . . . . . . . . . . . . . . . . . . . . . . . . . . . . . . . . . . . . . . . . 2Where to Find the NPSP Reports and Dashboards . . . . . . . . . . . . . . . . . . . . . . . . . . . . . . . . 6
PART 2: TUTORIALS . . . . . . . . . . . . . . . . . . . . . . . . . . . . . . . . . . . . . . . . . . . . . . . 10TUTORIAL: Customize the 10% Projection Report . . . . . . . . . . . . . . . . . . . . . . . . . . . . . . . . . 10TUTORIAL: Customize the Memberships Over Time Report . . . . . . . . . . . . . . . . . . . . . . . . . . 13TUTORIAL: Customize the Contact LYBUNT Report . . . . . . . . . . . . . . . . . . . . . . . . . . . . . . . . 16TUTORIAL: Customize the Closed/Won Opps by Type and Fiscal Year Report . . . . . . . . . . . . . 20
APPENDIX . . . . . . . . . . . . . . . . . . . . . . . . . . . . . . . . . . . . . . . . . . . . . . . . . . . . . . . 23Install the Reports Package . . . . . . . . . . . . . . . . . . . . . . . . . . . . . . . . . . . . . . . . . . . . . . 23What To Do with Old NPSP Reports and Folders . . . . . . . . . . . . . . . . . . . . . . . . . . . . . . . . . 23Update Report Folder Access . . . . . . . . . . . . . . . . . . . . . . . . . . . . . . . . . . . . . . . . . . . . . 23


PART 1: THE BASICS
Nonprofit Salesforce Admins and Development personnel are being asked to provide more and more data about their organizations,but seem to have less and less time to prepare reports. Nonprofit Success Pack harnesses the power of Salesforce reports and dashboardsto deliver data to you—right out of the box.
In the extensive list of NPSP reports, you’ll find reports that track Donors and giving, Grants, Memberships, Campaign ROI, and more.You can use these reports just as they are, or customize them to meet your specific needs. Of course if you can’t find what you’re lookingfor, you can always create new reports using the Report Builder, but we recommend customizing the out-of-box reports before you gothat route…
And with great reports, come great dashboards! We provide four NPSP dashboards out of the box. These dashboards pull data fromdedicated NPSP Dashboard Reports so that you can view trends and data all in one place. Use the dashboards to monitor giving trends,forecast based on open Opportunities, analyze Campaign ROI stats, and more!
If you’ve been using NPSP for a while, you’ve probably used the older reports in the NPSP 3.0 report folders. We strongly recommendthat you take advantage of the shiny new reports available in NPSP version 3.90 (February 2017). Why, you may ask? Because a team ofnonprofit experts from our community, led by Kristina Winters, spent long hours thinking through nonprofit scenarios and identifyingthe most common reporting use cases. Kristina and the community members then collated them into new reports and dashboards. Allin all, we offer 67 new reports and 4 new dashboards.
This workbook wouldn’t have been possible without the expert leadership and vision of Kristina Winters, and the great work of a groupof Nonprofit community members at two NPSP Sprints (San Francisco and Boston!).
• Justin Barss
• Peter Bender
• Sonny Cloward
• Kayleigh Collins
• Sarah Gill
• Dale Gish
• Theresa Hall
• Ted Hazard
• Adam Kramer
• Jon LaRosa
• Kestryl Lowery
• Jodi Nemser-Abrahams
• Melissa May
• Caitlyn Monaghan
• Mary Pustejovsky
• Ryan Shanahan
• Judi Sohn
• Justin Thich
• Robert Weller
1

Prerequisites
Before you get started customizing NPSP reports, we highly recommend that you complete these Trails (if you haven’t already).
• Lightning Experience Reports & Dashboards (Module)
• Manage Fundraising for Nonprofits (Trail)
While the following articles aren’t required reading, they may help you along the way. Note that these articles will teach you aboutSalesforce reporting in general; they aren’t specific to nonprofit reports.
• Learn About Reports
• Customizing Reports
• Organize Reports
Nonprofit Success Pack Reports
Now that we’ve piqued your interest, let us introduce you to the new reports and dashboards. The sections below provide a completelist of the reports and dashboards available with NPSP.
These reports come with new Trials and installations of NPSP starting at version 3.90 (February 2017). If you started a Trial or installedNPSP before this version and date, you can install the reports.
NPSP Constituent Reports
DescriptionReport Title
All Contacts in your organization.All Contacts
Accounts that are not One-to-One, Individual Bucket, or HouseholdAccounts.
All Organizations
All Relationships in your org, with only one record from a ReciprocalRelationship.
All Relationships
Current members grouped by Membership End Month.Current Members (Contacts)
Open tasks and their assigned users that are related to EngagementPlans.
Engagement Plan Tasks
Contacts whose memberships have lapsed, grouped byMembership End Date.
Lapsed Members (Contacts)
New memberships over the lifetime of your org, grouped byMembership Join Date.
Memberships Over Time
Members who joined in the last 60 days.New Members
Members who have renewed in the last 60 days.New Renewals
2
PrerequisitesPart 1: The Basics

NPSP Fundraising Reports
DescriptionReport Title
Provides 10% increase projection figures over Last Gift and LastYear Total Gifts.
10% Increase Projection
Accounts that donated last year but unfortunately not this year(LYBUNT).
Account LYBUNT
Accounts that donated some year, but unfortunately not this year(SYBUNT).
Account SYBUNT
All Accounts grouped by their highest giving year.Accounts by Best Gift Year
Provides return on investment figures for Campaigns with ActualCost.
Campaign ROI Analysis
All Closed/Won Opportunities grouped by giving HouseholdAccount.
Closed/Won Opps by Household
Matrix report of Closed/Won Opportunities by Record Type andFiscal Year.
Closed/Won Opps by Type and Fiscal Year
Matrix report of Closed/Won Opportunities by Record Type andPayment information.
Closed/Won Opps by Type and Payment
Matrix report of Closed/Won Opportunities by Record Type, GAUAllocation, and Fiscal Year.
Closed/Won Opps by Type, GAU, and FY
Contacts who donated last year, but unfortunately not this year(LYBUNT).
Contact LYBUNT
Contacts who donated some year, but unfortunately not this year(SYBUNT).
Contact SYBUNT
All Contacts grouped by their highest giving year.Contacts by Best Gift Year
Provides summary calculations for Total Gifts, Best Gift Year, LargestGifts, and more.
Contacts with Giving Totals
Provides summary calculations for Soft Credit Totals, Soft CreditThis Year, Soft Credit Last Year, and Two Years Ago.
Contacts with Soft Credits
Provides donation percentage change calculation between thisyear and the previous year, grouped by Account.
Donation % Change This Year vs Last Year
Comprehensive list of Opportunities, grouped by Account RecordType, Opportunity Record Type, and Stage.
Expected Opportunities
Comprehensive list of overdue Payments.Expected Overdue Payments
Comprehensive list of unpaid Payments, grouped by PaymentScheduled Date.
Expected Payments
Joined report (Classic Only) that provides GAU Allocation andPayment information in a single view, grouped by Opportunity.
GAU Allocations and Payments
3
Nonprofit Success Pack ReportsPart 1: The Basics

DescriptionReport Title
Provides various summary calculation figures for individual GeneralAccounting Units. Click Show Details to see a breakdown ofAllocations by Opportunity.
General Accounting Units
A list of all Grant Opportunities this year.Grants This Year
Provides summary calculations for Total Gifts, Best Gift Year, LargestGifts, and more.
Households with Giving Totals
Provides a breakdown of Total Gifts for all Accounts, grouped byLevel.
Lifetime Account by Level
Provides a breakdown of Total Gifts for all Accounts, grouped bygift range bucket.
Lifetime Account Gift Ranges
Provides multi-year donation calculation figures, demonstratingcumulative trends for revenue grouped by calendar month overtime.
Month by Month Donation Comparison
A list of open Opportunities, grouped by Stage.Open Opportunities
A list of all Opportunities, grouped by Campaign and Stage.Opportunities by Campaign Source
A list of Opportunities, grouped by General Accounting Unit andFiscal Year. Excludes lost Opportunities.
Opportunities by GAU Allocation
Payments grouped by Opportunities with details.Opportunities with Payments
Opportunities eligible for matching, where the donor's PrimaryAffiliation matches gifts, but matching fields have not been set onthe Opportunity.
Opportunities with Unclaimed Matching
List of paid Recurring Donation Opportunities, grouped by AccountRecord Type.
Paid Recurring Donations
List of Total Gift amounts with Household address information.Prior Year Giving with Mailing Address
List of 25 top Account donors, based on Total Gifts.Top 25 Account Donors Lifetime
List of top 25 Opportunity donations, based on individualOpportunity Amount.
Top 25 Opportunities Lifetime
A list of donations given in honor or in memoriam, grouped byTribute Type.
Tribute Opportunities
4
Nonprofit Success Pack ReportsPart 1: The Basics

NPSP Dashboards
DescriptionDashboard Title
Compare giving this year to the previous three years and get aquick overview of your recent and top donors. Includes chartsshowing:
Development Analysis
• Giving by Account Record Type this Year
• Giving by Opportunity Record Type this Year
• Giving by GAU this Year
• Giving by Account Record Type Last 3 Years
• Giving by Opportunity Record Type Last 3 Years
• Giving by GAU Last 3 Years
• 25 Most Recent Gifts this Year
• Top 25 Household Gifts this Year
• Top 25 Organization Gifts this Year
Review giving in your pipeline, and find and cultivate new potentialdonors. Includes charts showing:
Development Forecasting
• Open Opportunities by Stage
• Open Opportunities by Record Type
• Open Opportunities by Campaign
• Overdue Payments
• Expected Payments Next 90 Days
• Top Delinquent Accounts
• Pipeline by Month and Stage
• Top 25 LYBUNT Households
• Top 25 LYBUNT Organizations
• Top 25 SYBUNT Households
• Top 25 SYBUNT Organizations
Break your donors into groups and review each individually forpatterns year over year. Includes charts showing:
Giving Range Analysis
• Amount by Range 2yrs Ago
• Amount by Range Last Year
• Amount by Range This Year
• Donors by Range 2yrs Ago
• Donors by Range Last Year
• Donors by Range This Year
5
Nonprofit Success Pack ReportsPart 1: The Basics

DescriptionDashboard Title
Compare your fundraising campaigns and analyze their success.Includes charts showing:
NPSP Campaign ROI Analysis
• Total Donations by Campaign
• Total Donations vs Actual Cost
• Return on Investment (ROI)
• Cost Per Donor (CPD)
• Cost Per Dollar Raised
• Return on Initial Investment (ROII)
• Net Per Donor Average Donation
• Number of Donations
Where to Find the NPSP Reports and Dashboards
Now that you have background information on what reports we offer, you need to know where to find them! We conveniently groupedour reports into easy-to-locate folders.
Note: The screenshots and accompanying steps in this document might look different than what you see in your Salesforce org.That's because, as of November 2016, Nonprofit Success Pack defaults to the Lightning Experience user interface for new trials. Tofind out more about Lightning Experience, check out this doc.
To find the reports folders:
1. Click Reports in the navigation bar. If you don’t see reports, you may need to click the App Launcher ( ), then scroll down to AllItems.
2. In the left navigation, click All Folders.
6
Where to Find the NPSP Reports and DashboardsPart 1: The Basics

The NPSP reports are located in three conveniently named folders.
• NPSP Constituent Reports
• NPSP Fundraising Reports
• NPSP Dashboard Reports—Reserved for use as source material for the NPSP dashboards. Editing them will cause issues with theNPSP dashboards.
7
Where to Find the NPSP Reports and DashboardsPart 1: The Basics

Important: We recommend that you change the folder sharing access for all non-Administrators to Viewer, so that theseusers are unable to edit the reports directly. That way you’re preserving the out-of-box reports, but users will still be able toeasily customize them and save as copies.
Note: You may notice the other NPSP report folders (NPSP 3.0 Donor Management Reports, NPSP 3.0 Grants ManagementReports, NPSP 3.0 Membership Management Reports). These are the old NPSP reports that we’re replacing. For more informationon hiding these reports, see What To Do With the Old Reports.
3. Click a report name to view it.
4. To view the NPSP dashboards, click the App Launcher ( ), then scroll down to All Items.
5. Click Dashboards.
6. Click All Folders, then click NPSP Dashboards.
8
Where to Find the NPSP Reports and DashboardsPart 1: The Basics

7. Click a dashboard name to view it. For example, clicking on Development Forecasting brings up this handy dashboard.
9
Where to Find the NPSP Reports and DashboardsPart 1: The Basics
PART 2: TUTORIALS
Salesforce reports are highly customizable using the Report Builder, and the NPSP reports are no exception.
While we provide many varied reports out of the box, we know that they may not exactly meet your needs and you may need tocustomize them to be an exact fit for your org. In the following sections, we’ll provide you with detailed steps for how to customizesome of the NPSP reports. Keep in mind that the tutorials aren’t so much about the specific reports we’re showing you how tocustomize—they’re more about learning how to customize specific aspects of different kinds of reports. Each tutorial has a key learningobjective that we’ll walk through. There are four tutorials, and they start off with an easy customization and get harder as you go along.
Important: When customizing reports, we recommend that you Save As with a new name so as not to overwrite the originalreport. We also recommend that you create a new report folder just for these reports, so that it’s easy to tell the difference betweenthe NPSP reports and your customized reports. Keep in mind that if you save them in your Personal reports folder, no one else inyour org will see them. For the tutorials below, we’ll be saving the customized reports in a folder we created called “CustomizedNPSP Reports.” Your report folder name may differ.
TUTORIAL: Customize the 10% Projection Report
Key Learning Objective: Edit summary formula fields
The 10% Increase Projection report is a very useful fundraising tool. It includes a formula that calculates percentage-based increasesbased on report data. Reports can include formulas like this, that act like custom fields, but that only look at summary data in the report.For more information on summary formulas, see Work with Formulas in Reports in the Salesforce Help & Training.
Perhaps you want to project a 15% or 20% increase instead of 10%. This is a quick and easy customization that is achieved by changingthe formula associated with the report. Let’s walk through it.
1. Click Reports in the navigation bar.
2. In the list of folders, click NPSP Fundraising Reports.
3. Click 10% Increase Projection.
4. Click Edit.
5. In the left pane, hover over the 10% Increase Over Last Year formula and click the pencil icon.
10

6. In the formula field, change the 1.10 to 1.15 (15 % increase) or 1.2 (20% increase) or whatever percentage you’d like to use. Also,change the Column Name and Description to match your new percentage.
7. Click OK.
8. Repeat these steps for the 10% Increase Over Last Gift formula.
11
TUTORIAL: Customize the 10% Projection ReportPart 2: Tutorials

9. Click Save As.
10. Give the report a unique name, such as 15% Increase Projection, and select a Report Folder. As mentioned earlier, we recommendcreating a new folder just for your customized NPSP reports.
11. Click Save or Save and Run Report.
And there it is. Your report now shows a 15% projection over last year’s total gifts (1) and a 15% projection over last gift amount (2),organized by Account. And it was so quick, you could easily create another version of this report with a 20% projection!
12
TUTORIAL: Customize the 10% Projection ReportPart 2: Tutorials

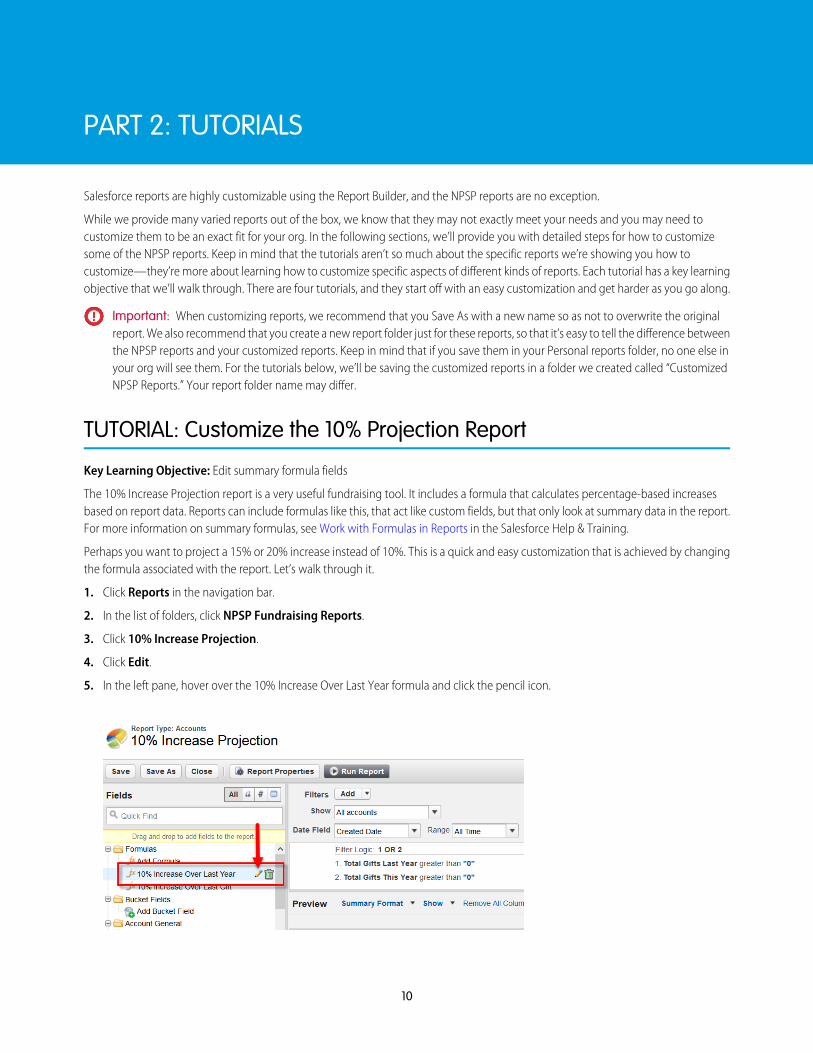
TUTORIAL: Customize the Memberships Over Time Report
Key Learning Objective: Customize the report chart
The Memberships Over Time report provides you with a line chart that shows all of the Memberships over the life of your organizationand groups them by Membership Join Date. There are many ways you could customize this report, but perhaps the most common isto change the chart type. For example, you prefer a funnel chart and you’d like to see the Total Membership Amount listed for eachmonth. The report details are grouped by when members joined (Membership Join Date), but you’d also like to see members groupedby Membership Level. Let’s walk through how to customize this report.
1. Click Reports in the navigation bar.
2. In the list of folders, click NPSP Constituent Reports.
3. Click Memberships Over Time.
4. To edit the chart, click the gear icon on the upper right side.
13
TUTORIAL: Customize the Memberships Over Time ReportPart 2: Tutorials
From here you can change the chart type, edit the value, change chart colors, and give the chart a title.
5. You want to use a funnel chart, so click the funnel icon. Then choose Sum of Total Membership Amount as the Value.
6. Click outside the Chart details, then click Edit.
7. To group by membership level, drag the Last Membership Level column to the drop zone underneath the Membership Join Date.
14
TUTORIAL: Customize the Memberships Over Time ReportPart 2: Tutorials

8. Click Save As.
9. Save the report with a unique name, such as Memberships Over Time Funnel, and choose the folder where to save it. As mentionedearlier, we recommend creating a new folder just for your customized NPSP reports.
10. Click Save or Save and Run Report.
And there you have it. Your new report shows the funnel chart (1). When you hover over the funnel, you see the Sum Total MembershipAmount for that month (2). In the report details, you also see that within each month grouping, the rows are then grouped byMembership Level (3).
15
TUTORIAL: Customize the Memberships Over Time ReportPart 2: Tutorials

TUTORIAL: Customize the Contact LYBUNT Report
Key Learning Objective: Refine the report by applying cross filters
The Contact LYBUNT report shows Contacts who gave last year, but haven’t given this year. It’s a useful report for viewing Contacts thatnever responded to a certain Campaign. Let’s say you want to generate a mailing list of everyone who gave last year, but not yet thisyear. But, you just did a mailing for your Annual Giving Campaign last week and you don’t want to reach out to anyone who you alreadysent that Campaign to. Let’s customize the report to create this mailing list.
1. Click Reports in the navigation bar.
2. In the list of folders, click NPSP Fundraising Reports.
3. Click Contact LYBUNT.
4. Click Edit.
5. Since this report will be exported for use as a mailing list, we’ll need to add the Mailing Street. Drag the Mailing Street from the leftside to just before the Mailing City column.
16
TUTORIAL: Customize the Contact LYBUNT ReportPart 2: Tutorials

6. Add the Contact ID field by dragging it from the left side to the far left side of the report (it becomes the first column).
Note: It’s best practice to include the Contact ID field as a column in your report. After the mailing, you may find that someof the addresses are incorrect or out of date, and the ID column will help you easily match up the errors with the originalContact records.
7. Click Run Report to see your new fields.
What a great start! Your two new fields are helping to shape this mailing list. Before we add any filters to this report, check out thefirst entry, Richard Addison. Richard meets the criteria for the Contact LYBUNT report, so you see his name listed in the results. Let’ssee what happens to Richard when we filter out Contacts to whom we sent the Annual Giving Campaign last week. (We’ll let youin on a little secret: we sent it to Richard.)
8. Click Edit in the upper right corner of the report.
9. In the Filter field, click the drop-down next to Add (don’t click Add), then click Cross Filter.
17
TUTORIAL: Customize the Contact LYBUNT ReportPart 2: Tutorials

10. Enter Contacts without Campaign History, then click Add Campaign History Filter.
Note: You’re adding this filter not to exclude all Contacts who don’t have an associated Campaign, but specifically to filterout all Contacts who DO NOT meet the criteria you’re going to specify in the subsequent Campaign History filters.
11. Enter Campaign Name equals Annual Giving (replace the example Annual Giving Campaign with your own Campaignname), then click OK.
Your customized filters should look like this:
18
TUTORIAL: Customize the Contact LYBUNT ReportPart 2: Tutorials

12. Click Save As and save your report with a unique name (you don’t want to overwrite the original report!). Also, select a folder whereyou want to save the report.
13. Click Save and Run Report.
On the report, you’ll notice that Richard Addison no longer appears. Since Richard was sent the Annual Giving Campaign, he wasexcluded from this report so that we don’t reach out to him twice in a period of weeks.
19
TUTORIAL: Customize the Contact LYBUNT ReportPart 2: Tutorials

TUTORIAL: Customize the Closed/Won Opps by Type and Fiscal YearReport
Key Learning Objective: Edit a matrix report
The Closed/Won Opps by Type and Fiscal Year report is a great tool for viewing giving at a high-level year over year. The information ispresented in a useful matrix, and is organized by Opportunity Type and Fiscal Year. But, let’s say you want the data organized first by thetype of Account and you want to see giving organized by calendar year instead of fiscal year. Since there is no field for calendar year(like there is for fiscal year), we’ll also need to add the Close Date field so we can group by calendar year. You also want to see a recordcount. Let’s try it out!
1. Click Reports in the navigation bar.
2. In the list of folders, click NPSP Fundraising Reports.
3. Click Closed/Won Opps by Type and Fiscal Year.
4. Click Edit.
5. To change the report to sort first by type of Account, drag the Account Record Type column to before the Opportunity Record Type.
6. To show a record count, click Show, then click Record Count.
You’ll see the Record Count appear under the Fiscal Year column.
20
TUTORIAL: Customize the Closed/Won Opps by Type andFiscal Year Report
Part 2: Tutorials

7. To use the Calendar Year instead of the Fiscal Year, first drag the Close Date field from the left side to under the Fiscal Year column.
8. Remove the Fiscal Year column by dragging it back to the panel on the left side.
9. Click the down arrow in the Close Date column, click Group Dates By, then click Calendar Year.
10. Click Save As and save your report with a unique name (you don’t want to overwrite the original report!). Also, select a folder whereyou want to save the report.
21
TUTORIAL: Customize the Closed/Won Opps by Type andFiscal Year Report
Part 2: Tutorials

11. Either click Save or Save and Run Report.
Tada! Your final report should look something like this. You see Account Record Type as the top level of organization (1) and CalendarYear instead of Fiscal Year (2). You also see a record count (3) and the Opportunities organized by Close Date. Much different thanthe original, right? And all it took was a few simple customizations.
Now that you’ve seen how quickly and easily you can customize NPSP reports, we encourage you to go ahead and try it out on someof the other out-of-the-box reports. And if you come up with some cool and useful customizations that you think other NonprofitCommunity members might benefit from, be sure to let us know!
22
TUTORIAL: Customize the Closed/Won Opps by Type andFiscal Year Report
Part 2: Tutorials

APPENDIX
This Appendix provides instructions on installing the newer NPSP reports, hiding the old reports, and changing report folder access.
Install the Reports Package
If you started a Trial or installed NPSP prior to version 3.90 (February 2017), you will need to install the NPSP reports in your organization.
What To Do with Old NPSP Reports and Folders
If your org has the old report folders, we recommend that you phase them out by hiding the folders from your users.
Update Report Folder Access
You may want to hide the old report folders. Or you may want to change sharing access on the new report folders so that users canonly view (not modify) them.
Install the Reports Package
If you started a Trial or installed NPSP prior to version 3.90 (February 2017), you will need to install the NPSP reports in your organization.
To install the NPSP reports:
1. Go to the NPSP Reports & Dashboards Installer.
2. Log in using the credentials for your Salesforce organization.
3. Click Install.
What To Do with Old NPSP Reports and Folders
If your org has the old report folders, we recommend that you phase them out by hiding the folders from your users.
Administrators will still see the old folders. That way, if a user asks for a specific old report, you’ll still have access to it. If users don’t askabout the old reports for a particular amount of time (defined by you, of course), you can decide if you want to delete the folders andreports.
Update Report Folder Access
You may want to hide the old report folders. Or you may want to change sharing access on the new report folders so that users can onlyview (not modify) them.
To hide the old reports folders from users:
1. Switch to Salesforce Classic. You can’t currently set sharing permissions on folders in Lightning Experience.
2. Click the Reports tab.
3. Hover over the name of the folder you want to hide, click the Pin icon, then click Share.
23

4.To hide this folder from the user, click next to the user’s name.
We recommend you hide the old NPSP 3.0 folders from all non-Admin users.
5. To change folder access so that users can only view reports, but not edit them, make sure Access is set to Viewer.
We recommend you give Viewer access on the new NPSP report folders to all non-Admin users.
24
Update Report Folder AccessAppendix

6. Click Close.
25
Update Report Folder AccessAppendix