Embed Size (px)
Citation preview
1Norcros plcInterim Results
Six months to 30 September 2016

1
2
IntroductionMartin Towers
Chairman

1
3
Highlights
1 On a constant currency basis
3
Dividend
2.4p
Underlying diluted EPS
12.9p
Revenue1
£128.8mUnderlying operating profit
£11.0m
Underlying operating cash
£16.0m
Underlying profit before tax
£10.5mProfit before tax
£7.7m
Robust first half performance
Revenue increased by 9.2% on a constant currency basis
Underlying operating profit increased by 11.1% to £11.0m
Underlying profit before tax increased by 11.7% to £10.5m
Strong underlying operating cash generation: 113% of underlying EBITDA
Diluted underlying earnings per share 9.3% higher at 12.9p
Interim dividend increased by 9.1% to 2.4p per share
+9.2%
+11.1%
+11.7%
+10.0%
+20.3%
+9.3%
+9.1%

1
4
Financial ReviewShaun Smith
Group Finance Director

1
5
Income Statement
1 Underlying means before exceptional operating items, IAS19R admin costs, acquisition related costs and where relevant, non-cash finance costs2 Includes £1.0m reduction in charges relating to “mark to market” on FX forward contracts3 See Page 32 for details 5
H1 Sept 2016
£m
H1Sept 2015
£m
+/-Reported
+/-ConstantCurrency
FY Mar 2016
£m
Revenue 128.8 118.7 +8.5% +9.2% 235.9
Underlying1 operating profit 11.0 9.9 +11.1% 21.3
Return on Sales 8.5% 8.3% 9.0%
Finance charges – cash (0.5) (0.5) (0.9)
Underlying1 PBT 10.5 9.4 +11.7% 20.4
Exceptional operating items3 - 2.3 2.3
IAS19R admin expenses (0.9) (0.8) (1.7)
Acquisition related costs3 (1.3) (2.6) (5.2)
Finance charges – non cash2 (0.6) (1.3) (0.4)
PBT as reported 7.7 7.0 +10.0% 15.4

1
6
Income Statement – key bridges
6
21.3
1 Constant currency basis
8.0
1.9
9.9
8.0
3.0
11.0
UK SA GroupSept '15 Sept '16
£m
10.0%
4.9%7.2%
8.5%8.3%
9.2%
0.7
7.0
3.8
118.7
128.8
Sept '15 Currency UK SA Sept '16
£m
Revenue Underlying operating profit
79.9
38.1
118.0
86.9
41.9
128.8
UK SA GroupSept '15 Sept '16
£m
1.1
9.9
11.0
Sept '15 SA Sept '16
Revenue1 Underlying operating profit / ROS%
£m
+8.8%
+10.0%
+9.2%

1
Tax, Earnings and Dividends
1 Underlying means before exceptional operating items, IAS19R admin costs, acquisition related costs and where relevant, non-cash finance costs, and where relevant after attributable tax7
Underlying1 Reported
2.40 2.20
6.60
Sep-16 Sep-15 Mar-16 FY
Dividend per share (pence)
12.9 11.8
27.8
Sep-16 Sep-15 Mar-16 FY
Diluted underlying EPS (pence)
Effective underlying tax rate of 22.9%
Diluted underlying1 EPS up 9.3% at 12.9p (2015: 11.8p)
Interim dividend up 9.1% to 2.4p (2015: 2.2p)
H1Sept 2016£m
H1Sept 2015£m
FYMar 2016£m
H1Sept 2016£m
H1Sept 2015£m
FYMar 2016£m
Profit before Tax 10.5 9.4 20.4 7.7 7.0 15.4
Tax charge (2.4) (2.1) (3.1) (1.6) (1.6) (2.4)
Earnings 8.1 7.3 17.3 6.1 5.4 13.0
Effective Tax rate
22.9% 22.3% 15.1% 20.8% 23.1% 15.5%

1
Cash Flow
113% 104%
76%
Sep-16 Sep-15 Mar-16 FY
Underlying Operating Cash Flow / Underlying EBITDA
1.31.1 1.2
Sep-16 Sep-15 Mar-16 FY
Capex / Depreciation (times)
8
H1Sept 2016
£m
H1Sept 2015
£m
FY Mar 2016
£m
Underlying EBITDA 14.1 12.8 26.8
Working Capital 1.2 (0.2) (7.7)
Other 0.7 0.7 1.3
Underlying operating cash 16.0 13.3 20.4
Capital Expenditure (4.0) (3.2) (6.6)
Pension deficit recovery (1.2) (1.1) (2.1)
Tax 0.4 (0.6) (1.0)
Underlying free cash flow pre financing and dividends
11.2 8.4 10.7
Exceptional & acquisition related costs (1.0) 0.7 0.2
Interest (0.8) (0.5) (0.9)
Dividends (2.7) (2.2) (3.6)
Net proceeds from sale of business - - -
Acquisition of subsidiaries (2.7) (20.5) (23.6)
Other items - - 0.1
Net Cash Flow 4.0 (14.1) (17.1)
1
Balance Sheet
9
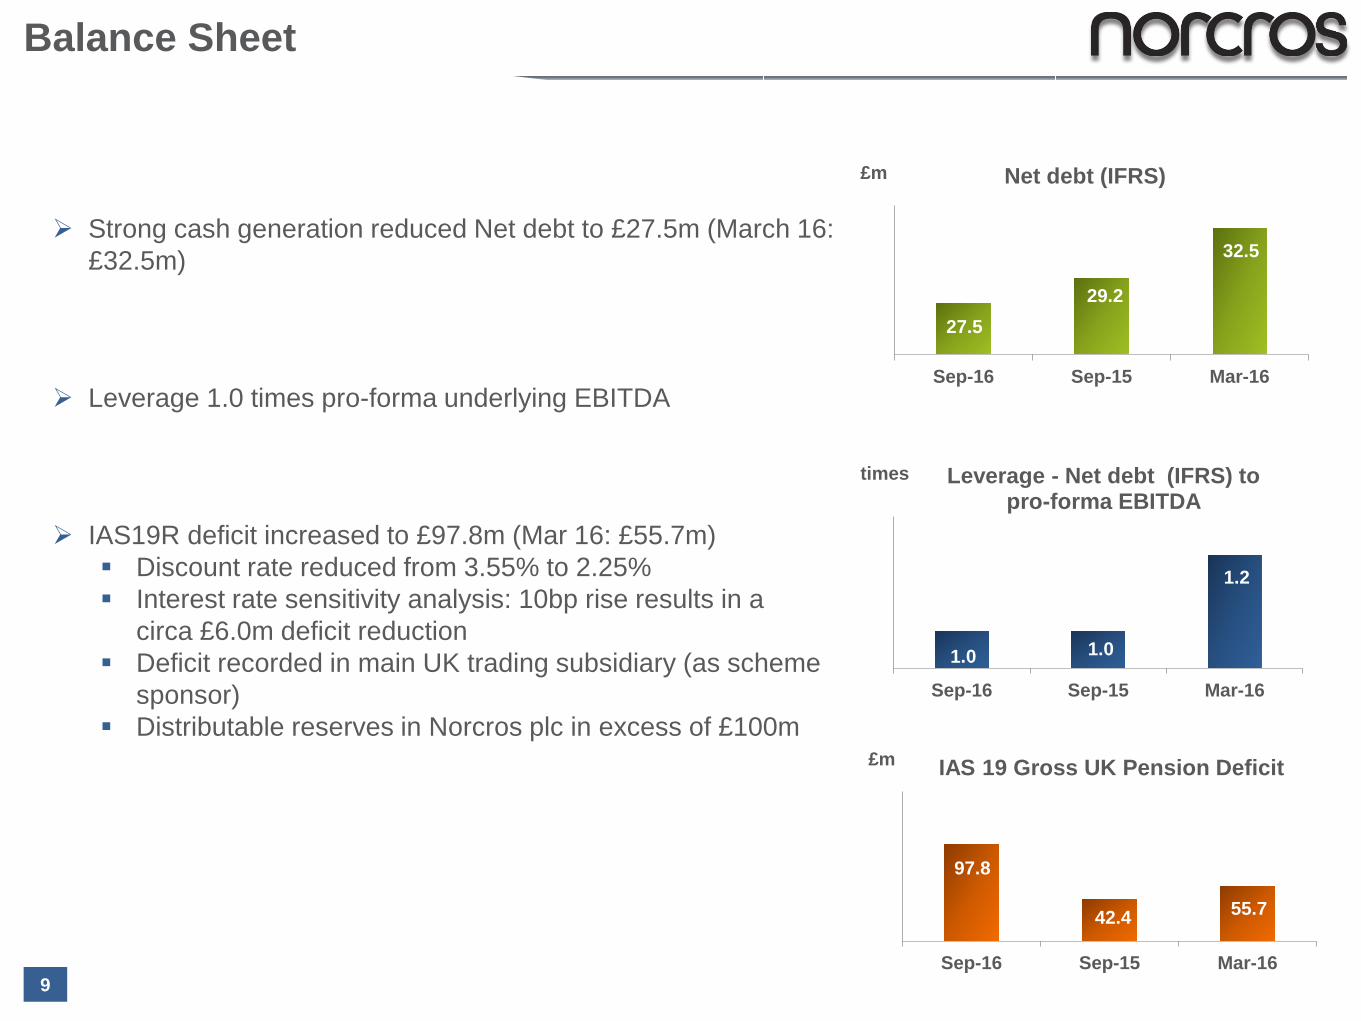
Strong cash generation reduced Net debt to £27.5m (March 16: £32.5m)
Leverage 1.0 times pro-forma underlying EBITDA
IAS19R deficit increased to £97.8m (Mar 16: £55.7m) Discount rate reduced from 3.55% to 2.25% Interest rate sensitivity analysis: 10bp rise results in a
circa £6.0m deficit reduction Deficit recorded in main UK trading subsidiary (as scheme
sponsor) Distributable reserves in Norcros plc in excess of £100m
27.529.2
32.5
Sep-16 Sep-15 Mar-16
£m Net debt (IFRS)
1.0 1.0
1.2
Sep-16 Sep-15 Mar-16
times Leverage - Net debt (IFRS) to pro-forma EBITDA
97.8
42.4 55.7
Sep-16 Sep-15 Mar-16
£m IAS 19 Gross UK Pension Deficit

1
Liabilities 420 406 441 422 502Assets 390 384 397 366 404Deficit 30 22 44 56 98Disc Rate 4.20% 4.30% 3.30% 3.55% 2.25%RPI 3.2% 3.2% 2.9% 2.9% 3.0%
UK Pension Scheme
IAS 19R deficit £97.8m (March 2016: £55.7m) Assets increased by £37.8m to £403.7m Liabilities increased by £79.9m to £501.5m mainly as a
result of lower discount rate of 2.25% (March 2016: 3.55%) Interest rate sensitivity analysis: 10bp rise = £6.0m deficit
reduction
Super-mature scheme 7,922 members (March 2016: 7,973). 66% pensioners with
average age 77 Annual pensioner payroll near peak at £20m pa
Scheme closed to new entrants and future accrual in April 2013
Current recovery plan in place since April 2016 10 years at £2.5m per annum + CPI
Company focused on covenant improvement Beneficial to all stakeholders
10
UK Pension IAS 19R Assets & Liabilities
Mar-13 Mar-14 Mar-15 Mar-16 Sept-160
100
200
300
400
500
600

1
UK Pension Scheme Cashflows
11
Payroll in payment almost at peak
Cashflow significantly less volatile than balance sheet liability (measured on a mark to market basis)
Cashflows
Annual progression commencing 27 October
Deferreds Actives Pensioners
Paym
ents
Payments

1
Operating ReviewNick Kelsall
Group Chief Executive

1
Business Overview
Triton
Vado
Group Revenue (6 months to September 2016)
Johnson Tiles
TAL
Tile Africa
£86.9mUK
£22.9m
£16.6m
£12.2m
£4.2m
+8.8%
SA£41.9m
£5.3m
£10.1m
£26.5m
+10.0%
Croydex
Johnson Tiles
Group£128.8m
+9.2%
Norcros Adhesives
£25.4m
13
Abode £5.6m
Revenue Growth (constant currency):

1
Destocking in H1
Overall Revenue - 12.6% UK - 14.2% Exports - 4.5%
Significant destocking; more recently in trade channels
Maintained market leading position in the UK and Ireland Increased market share in electric and mixers
Ireland impacted by destocking prior to T90SR launch
Growing momentum in South America: Q3 Brazil launch – largest global electric shower market
Additional investment in New Product Development (NPD): H2 digital mixer launch – joint development with VADO Silent T90SR – positive feedback South America low pressure model – strong feedback
post market testing
Margins strong though profits lower: confident of progress in H2
14

1
UK growth sustained
Overall Revenue + 4.4% UK + 14.3% Exports - 19.1%
Strong performance in the UK sustained: Specification – progress with housebuilders and hotel
groups Retail – growth into independent merchants and boutiques
Revised Middle East + Africa export strategy: New ME distributor – Al Shaya Rationalised product offering to enhance customer service Jebel Ali warehouse facility being established
Further traction in South American export markets
Increased sales of VADO & Evox brands through Tile Africa
Further focus on NPD – 3 significant ranges to launch in H2
Continued strong profits and cash generation
15

1
Unique offering driving strong growth
16
Overall Revenue + 11.9% (versus 6m to September 2015*)
UK + 10.7% Exports + 33.3%
Continued strong growth across UK retail
Strong growth in Croydex branded ranges
Good growth in export markets e.g. Germany and USA
Hang ‘n’ Lock cabinets & mirrors extended into export markets
Ongoing NPD focus across all ranges
Group sales momentum with VADO and Tile Africa
Good profitability and cash generation
* Acquired June 2015

1
Excellent performance post acquisition
17
Overall Revenue £5.6m (6 months contribution*); + 2.2% LfL
Business seamlessly integrated
Strong growth in branded sales – new customer wins
OEM sales robust despite short-term destocking
Long term supply agreement signed with key account
‘PRONTEAU’ hot water tap well received
Group supply chain synergies progressing
Profit and cash generation in line with expectations
* Acquired March 2016

1
Robust performance in a challenging environment
Overall Revenue - 9.0% UK - 10.0% Exports - in line with last year
UK trade market more resilient than retail
UK trade - 3.9% – robust house builder & specification channel offset by weaker social housing
UK retail -16.4% – weak DIY channel; importing directly
Robust export performance: Middle East performing well – strong specification pipeline New Dubai distributor – encouraging start Offset by de-stocking in France
Manufacturing performance sustained and stable
Good operational performance though profits lower
CristalGrip – new innovative tile fixing system; launch in Q4
18
1
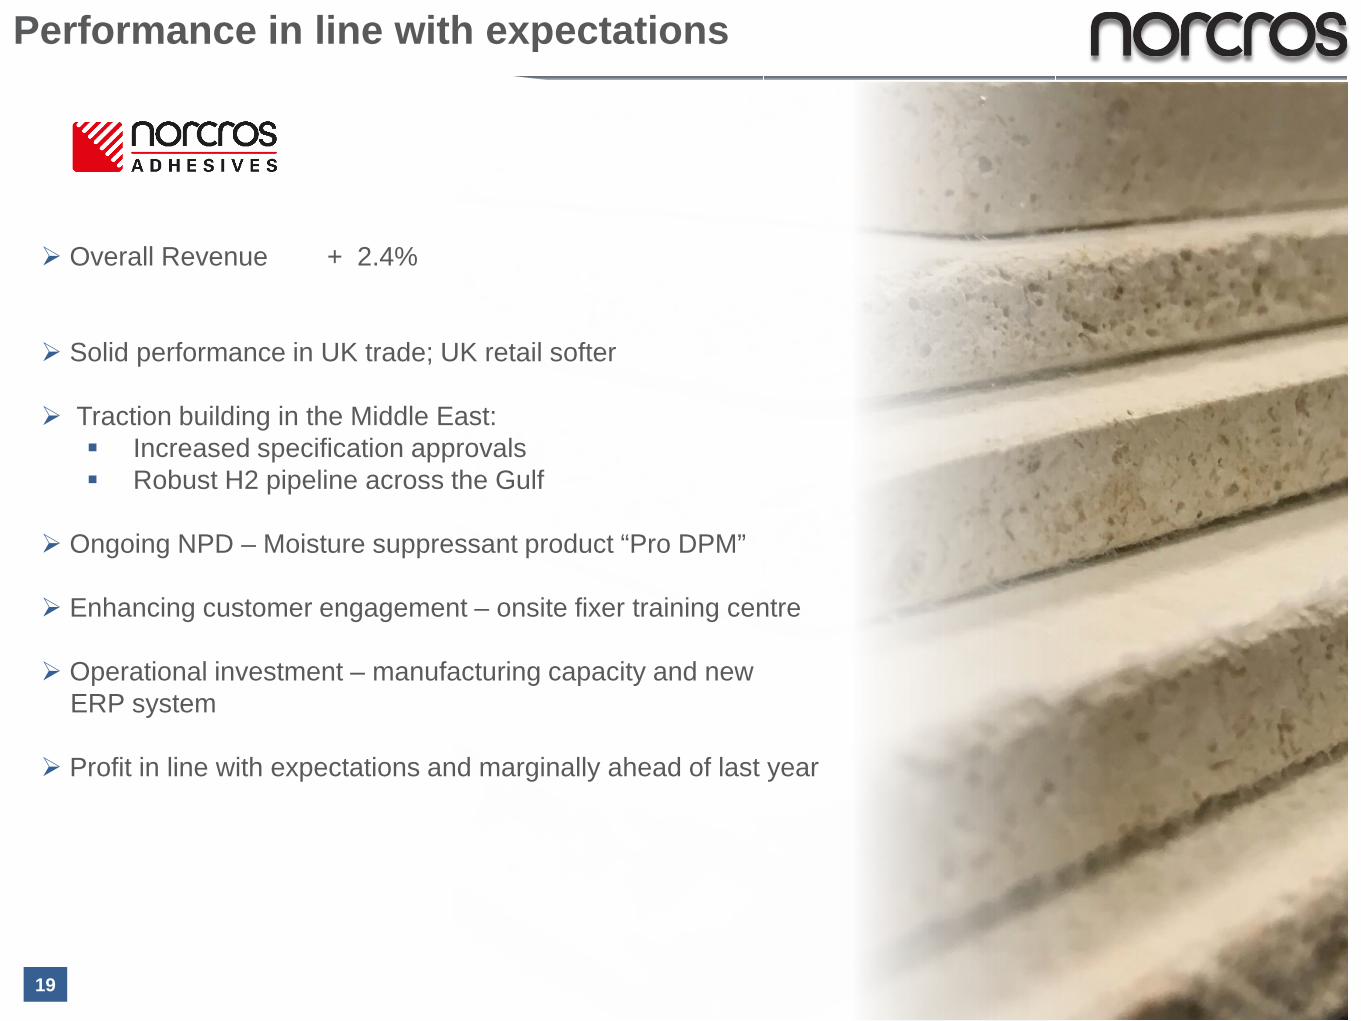
Performance in line with expectations
Overall Revenue + 2.4%
Solid performance in UK trade; UK retail softer
Traction building in the Middle East: Increased specification approvals Robust H2 pipeline across the Gulf
Ongoing NPD – Moisture suppressant product “Pro DPM”
Enhancing customer engagement – onsite fixer training centre
Operational investment – manufacturing capacity and newERP system
Profit in line with expectations and marginally ahead of last year
19

1
20
UK Operations – H1 solid performance
20
1
22.9 26.2
50.625.4
27.9
54.1
4.24.1
8.0
16.615.9
33.1
12.2 5.8
17.2
5.6 0
0
H1 Sept 16 H1 Sept 15 FY Mar 16
Triton Johnson Tiles AdhesivesVado Croydex Abode
£79.9m
£163.0m
£86.9m
Revenue
1
1 9 months Full Year March 16; 3 months Interim September 15
Underlying Operating Profit
£8.0m £8.0m
£17.2m
9.2%10.0% 10.6%
H1 Sept 16 H1 Sept 15 FY Mar 16
Profit ROS%

1
Solid performance and improved profitability
NE
Overall revenue - in line with last year at constant currency
Sustained improvement in operating performance andprofitability
Focus on value added products e.g. large format
Solid manufacturing performance sustained; efficiencyimproved
Selling 100% of manufacturing capacity – capacity increaseoptions being considered
NPD momentum maintained – 49 new designs in H1
Profits and margins ahead of prior year; in line withexpectations
21
1
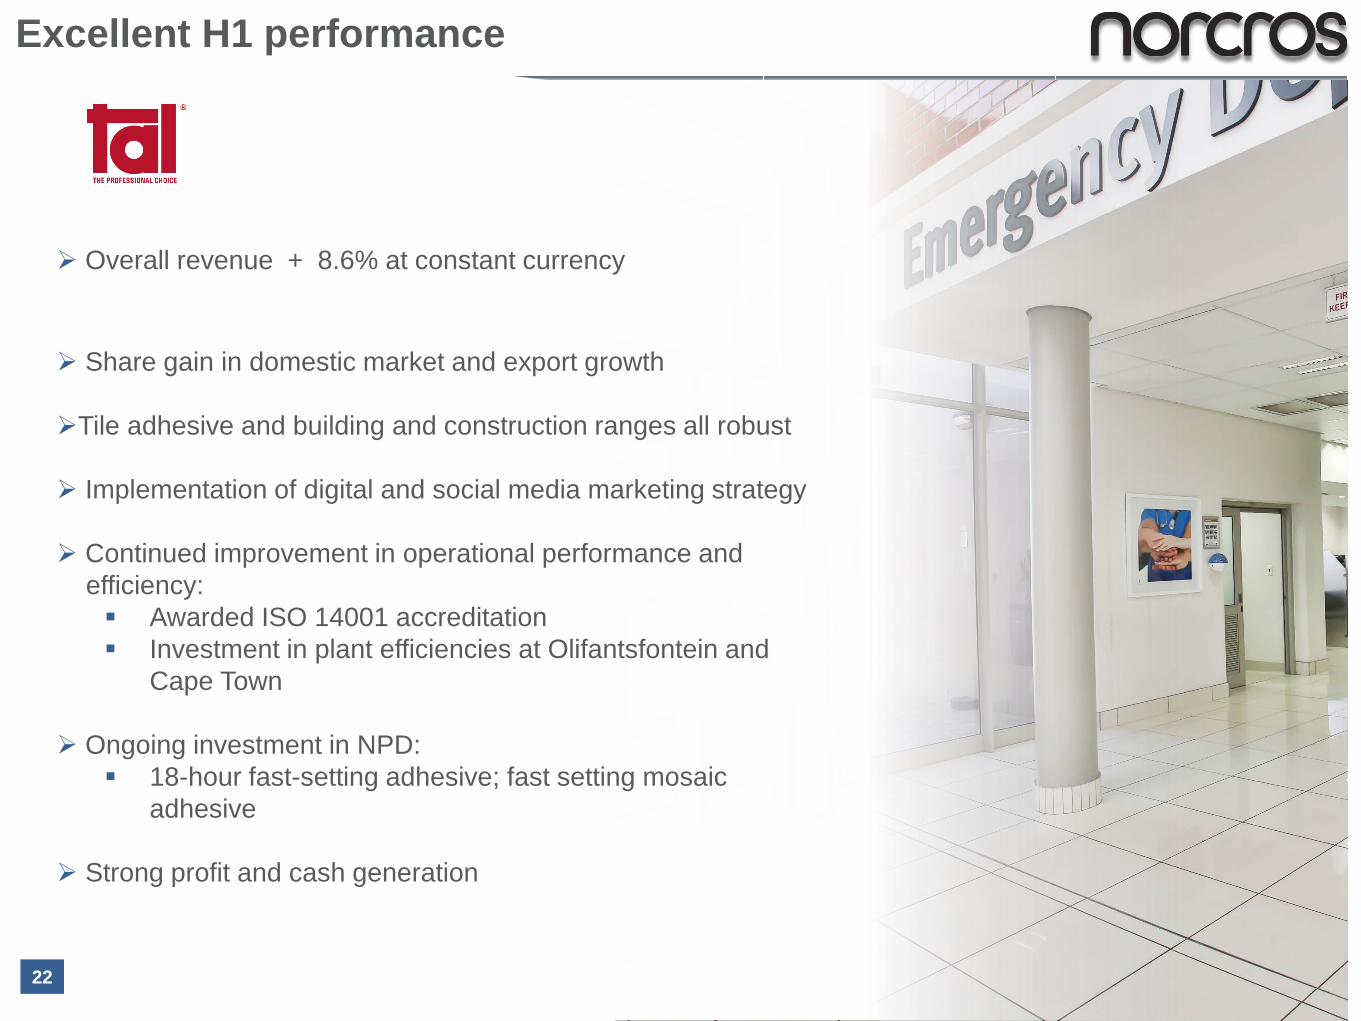
Excellent H1 performance
22
Overall revenue + 8.6% at constant currency
Share gain in domestic market and export growth
Tile adhesive and building and construction ranges all robust
Implementation of digital and social media marketing strategy
Continued improvement in operational performance andefficiency: Awarded ISO 14001 accreditation Investment in plant efficiencies at Olifantsfontein and
Cape Town
Ongoing investment in NPD: 18-hour fast-setting adhesive; fast setting mosaic
adhesive
Strong profit and cash generation

1
Strong retail performance via improved store offering
Overall revenue + 12.8% at constant currency
CX format performing strongly in new and upgraded stores
Boksberg (opened March 2016) performing ahead ofexpectations
Bathroom store-within-a-store format performing strongly
Group synergies: VADO and Evox – further ranges introduced Croydex ranges launched – initial feedback positive Leveraging Group supply chain capabilities
Store estate; 30 stores 2 franchise with further potential: Southgate new store – H2 launch New store pipeline – up to 5 over next 36 months 10 stores to be refurbished 2 underperforming franchise stores closed in H1
Strong profit and cash generation ahead of last year
23
1
24
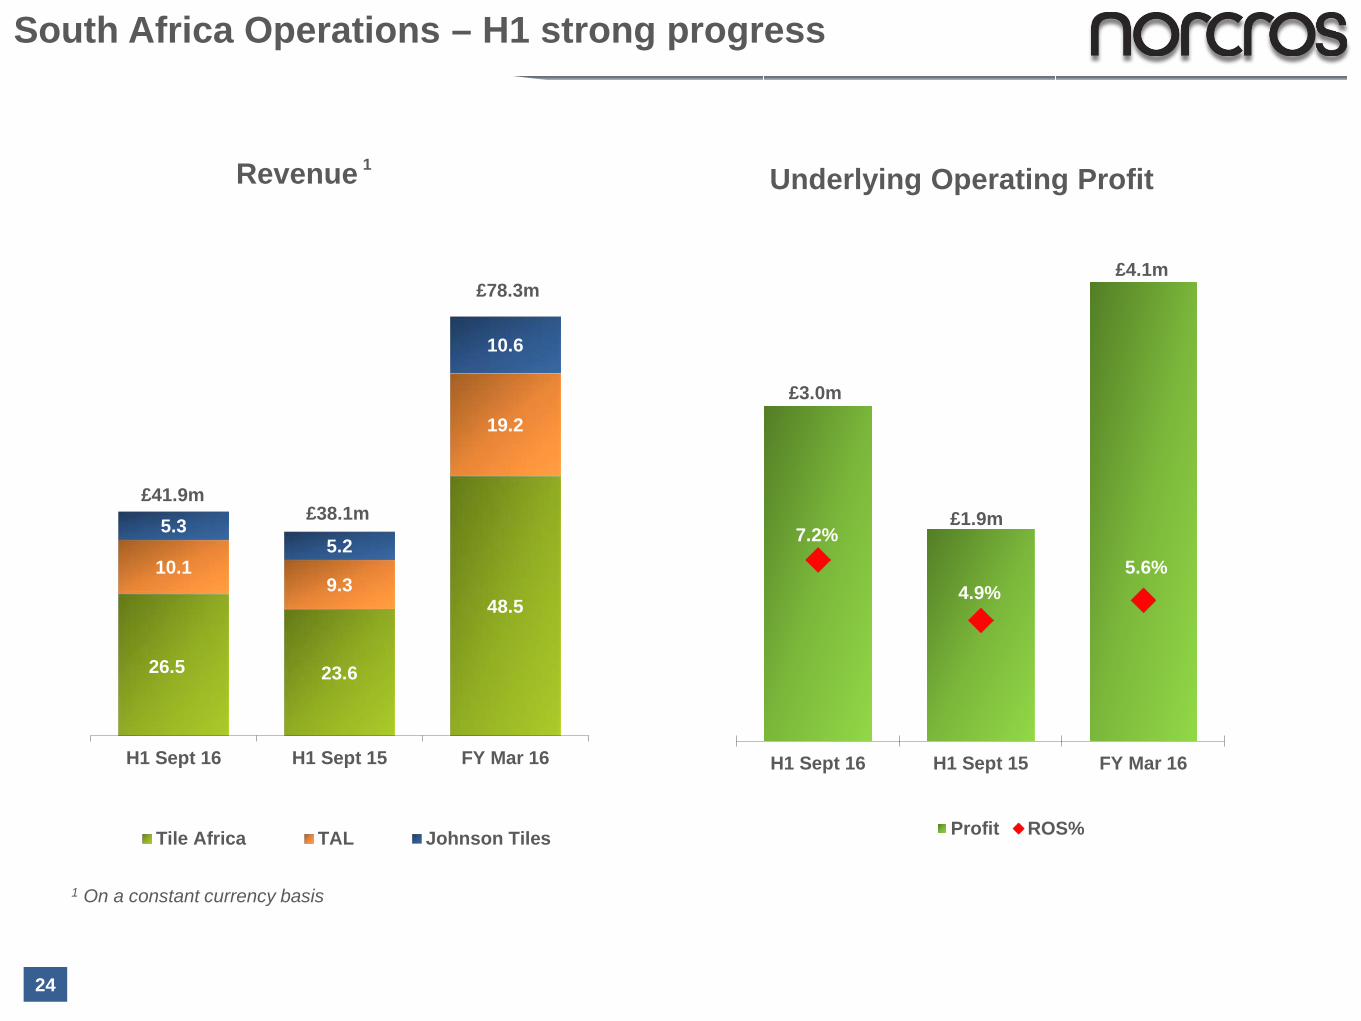
South Africa Operations – H1 strong progress
24
1 On a constant currency basis
26.5 23.6
48.5
10.19.3
19.2
5.35.2
10.6
H1 Sept 16 H1 Sept 15 FY Mar 16
Tile Africa TAL Johnson Tiles
£38.1m£41.9m
£78.3m
£3.0m
£1.9m
£4.1m
7.2%
4.9%5.6%
H1 Sept 16 H1 Sept 15 FY Mar 16
Profit ROS%
Revenue Underlying Operating Profit 1

1
Group Outlook & StrategyNick Kelsall
Group Chief Executive
1
26
26
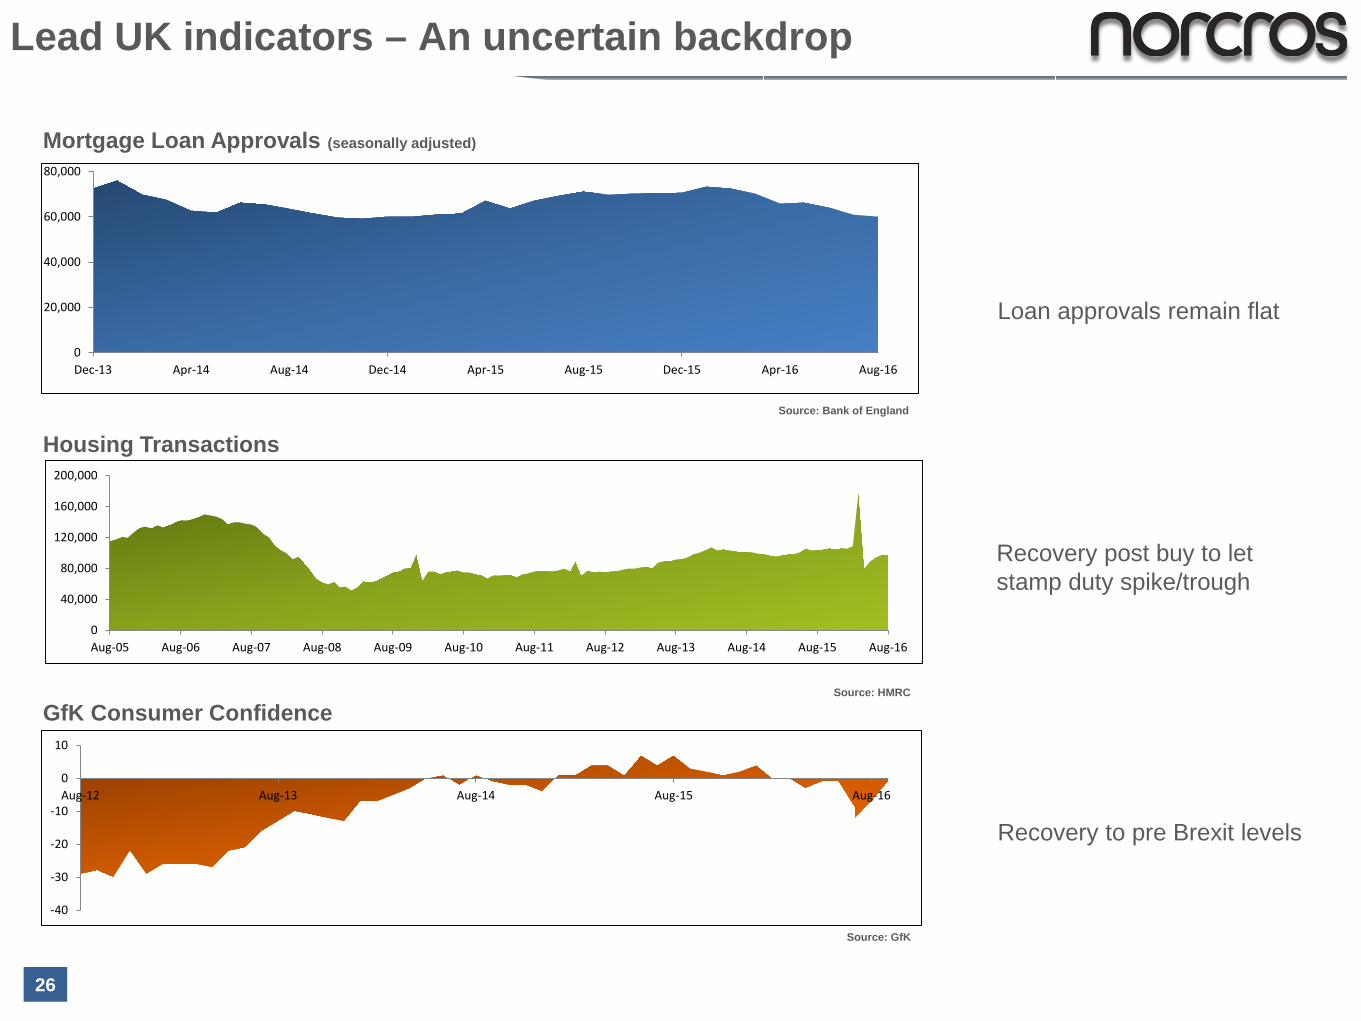
Recovery post buy to let stamp duty spike/trough
Recovery to pre Brexit levels
Loan approvals remain flat
Mortgage Loan Approvals (seasonally adjusted)
Housing Transactions
GfK Consumer ConfidenceSource: HMRC
Source: Bank of England
Source: GfK
Lead UK indicators – An uncertain backdrop
26
0
20,000
40,000
60,000
80,000
Dec-13 Apr-14 Aug-14 Dec-14 Apr-15 Aug-15 Dec-15 Apr-16 Aug-16
0
40,000
80,000
120,000
160,000
200,000
Aug-05 Aug-06 Aug-07 Aug-08 Aug-09 Aug-10 Aug-11 Aug-12 Aug-13 Aug-14 Aug-15 Aug-16
-40
-30
-20
-10
0
10
Aug-12 Aug-13 Aug-14 Aug-15 Aug-16

1
Lead SA indicators – Moderate medium term outlook
Source: Forex Forum
GDP growth remains low with an improving medium term outlook
GDP (% change)
Key indicator for RMI. Index remains ahead of other macro economic indicators
Hardware/Paint/Glass Retail Sales (% change)
£ : Rand Exchange Rate
Stronger Rand v £ should benefit H2
Source: Stats SA
Source: Investec0
0.5
1
1.5
2
2.5
2014 2015 2016 2017 2018 2019 2020
27
0
1
2
3
4
5
6
7
2013 2014 2015 2016
91113151719212325

1
Group Strategy – Sustained progress
P
2008
2007
Clear, consistent, and focused growth strategy
All divisions profitable – significant South Africa contribution
Resilient financial performance despite economic volatility Benefits of geographical and product
diversification
Successful acquisition track record – Vado, Croydex, Abode: Selection, execution and integration Growing revenues and profitability Driving Group synergies
Well developed acquisition pipeline – “go to” acquirer
Confident of further progress
28
• Vado Acquisition• DB Scheme Closed to Future Accrual
• Disposal of Beaumont Tiles Australia
• Disposal of H&R Johnson India
• Relisting of the Group on LSE
• Abode Acquisition
• Croydex Acquisition• Disposal of Legacy Property Portfolio
• Disposal of Johnson Tiles Australia• Exit of Onerous Lease - Sheffield
• Disposal of Onerous Lease - Springwood
2016
2015
2014
2013
2010
2008
2007
2011

1
Group Strategy – Key targets retained
Growth Target
Double revenues to £420m by 2018 Organic and
acquisition Maintain 50%
revenue derived from overseas
Focus on sectors with highest returns
Market leading positions
Strong trade and consumer brands
Breadth of distribution
5 - 10% pa potential
Complementary industry segments/ geographical
Bathroom controls and associated products
Building/construction adhesives
UK, SA, sub-Saharan Africa and Middle East
Sustainable pre-tax ROCE 12-15%
Improve returns from under-performing segments
Invest in sectors with highest shareholder value return
OrganicAcquisition
Returns Target
29

1
Solid Half Year Results
Organic Growth
Opportunities
Well DevelopedAcquisition
Pipeline
Medium Term Indicators
Favourable
Clear & Focused Growth Strategy
Summary
R
1
Appendix
R

1
Exceptional items and acquisition related costs
32
Acquisition related costs
Acquisition related deferred remuneration (earn out) (0.2) (1.2) (2.5)
Intangible amortisation (0.6) (0.3) (0.9)
Acquisition related costs - other (0.5) (1.1) (1.8)
(1.3) (2.6) (5.2)
H1 Sept 2016 £m
H1 Sept2015£m
FY Mar 2016 £m
Exceptional operating items
Pension settlement gain - 0.4 0.4
Highgate Park – legal costs - (0.1) (0.1)
Highgate Settlement - 2.0 2.0
2.3 2.3

1
Net debt reconciliation
33
H1 Sept 2016 £m
H1 Sept2015£m
FY Mar 2016 £m
Net debt (IFRS) – opening (32.5) (14.2) (14.2)
Net cash flow 4.0 (14.1) (17.1)
Other non cash movements (0.1) (0.1) (0.2)
Foreign exchange 1.1 (0.8) (1.0)
Net debt (IFRS) - closing (27.5) (29.2) (32.5)