Embed Size (px)
Citation preview
Norges Bank
1
Executive Board meeting26 September 2007
Norges Bank
0
1
2
3
4
5
6
7
8
9
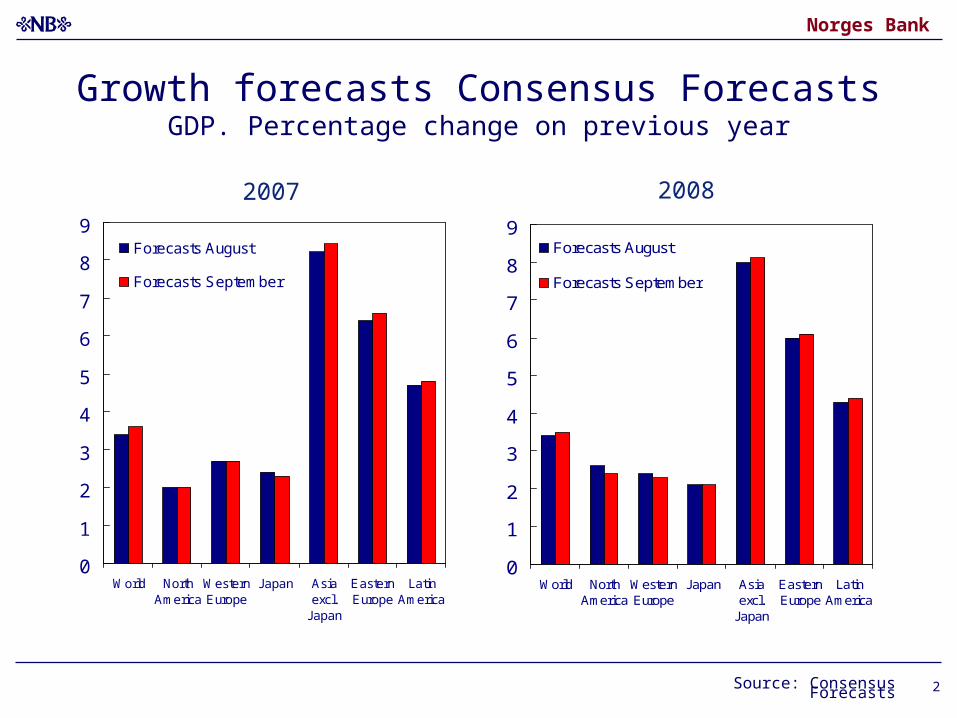
World NorthAmerica
WesternEurope
Japan Asiaexcl.
Japan
EasternEurope
LatinAmerica
Forecasts August
Forecasts September
0
1
2
3
4
5
6
7
8
9
World NorthAmerica
WesternEurope
Japan Asiaexcl.
Japan
EasternEurope
LatinAmerica
Forecasts August
Forecasts September
Source: Consensus Forecasts
2007 2008
Growth forecasts Consensus ForecastsGDP. Percentage change on previous year
2
Norges Bank
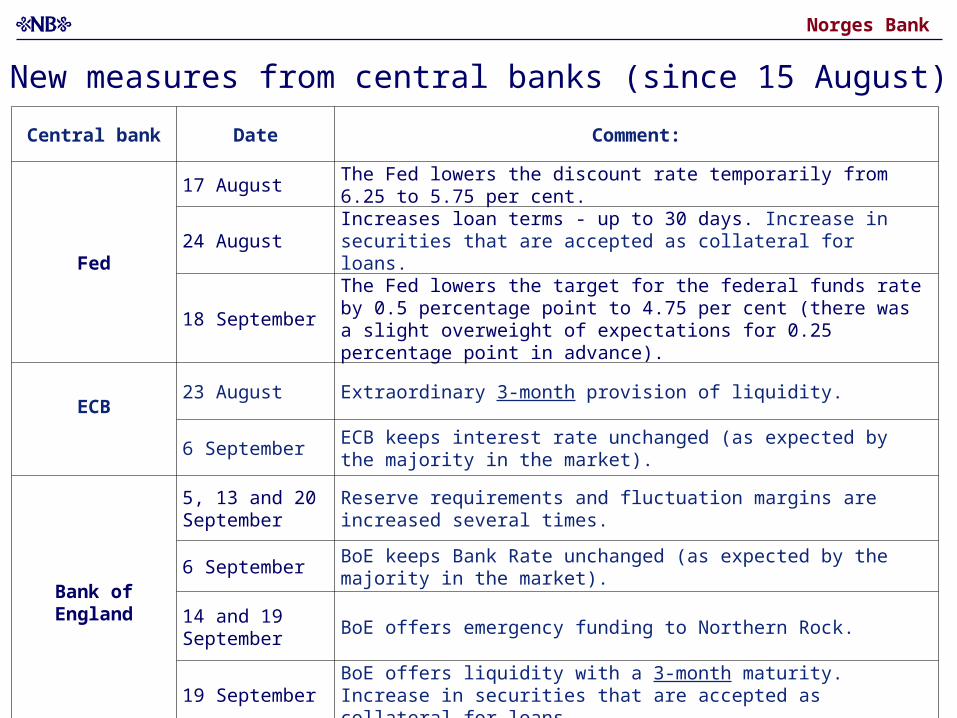
Central bank Date Comment:
Fed
17 AugustThe Fed lowers the discount rate temporarily from 6.25 to 5.75 per cent.
24 AugustIncreases loan terms - up to 30 days. Increase in securities that are accepted as collateral for loans.
18 SeptemberThe Fed lowers the target for the federal funds rate by 0.5 percentage point to 4.75 per cent (there was a slight overweight of expectations for 0.25 percentage point in advance).
ECB23 August Extraordinary 3-month provision of liquidity.
6 SeptemberECB keeps interest rate unchanged (as expected by the majority in the market).
Bank of England
5, 13 and 20 September
Reserve requirements and fluctuation margins are increased several times.
6 SeptemberBoE keeps Bank Rate unchanged (as expected by the majority in the market).
14 and 19 September
BoE offers emergency funding to Northern Rock.
19 SeptemberBoE offers liquidity with a 3-month maturity. Increase in securities that are accepted as collateral for loans.
New measures from central banks (since 15 August)
Norges Bank
4
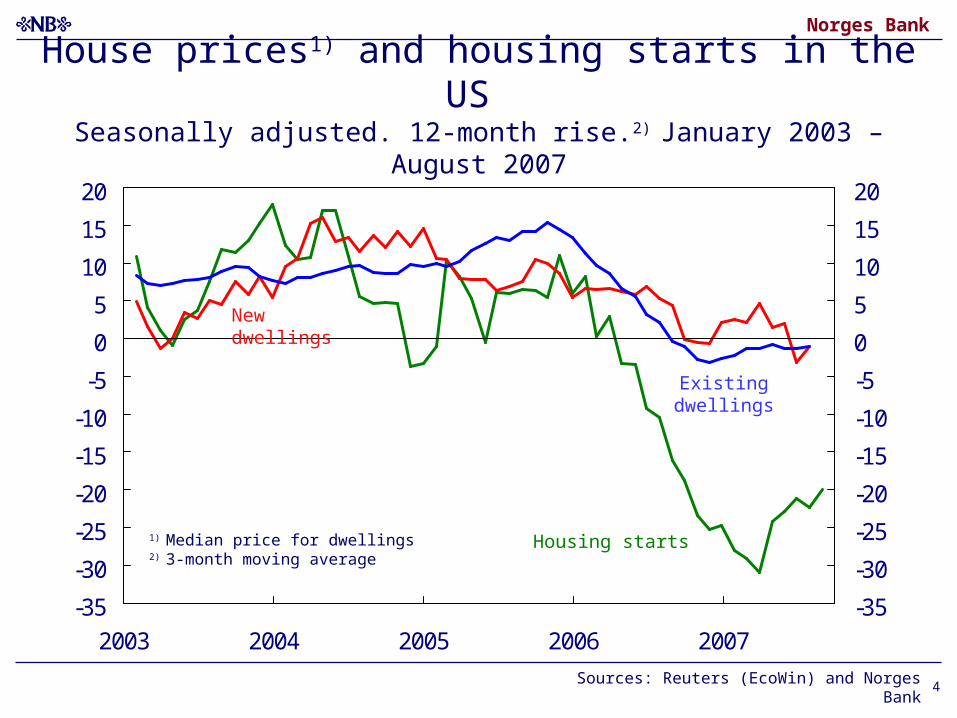
House prices1) and housing starts in the US Seasonally adjusted. 12-month rise.2) January 2003 – August 2007
-35
-30
-25
-20
-15
-10
-5
0
5
10
15
20
2003 2004 2005 2006 2007
-35
-30
-25
-20
-15
-10
-5
0
5
10
15
20
1) Median price for dwellings2) 3-month moving average
Housing starts
Existing dwellings
New dwellings
Sources: Reuters (EcoWin) and Norges Bank
Norges Bank
90
100
110
120
130
140
Nov 06 Jan 07 Mar 07 May 07 Jul 07 Sep 07
90
100
110
120
130
140
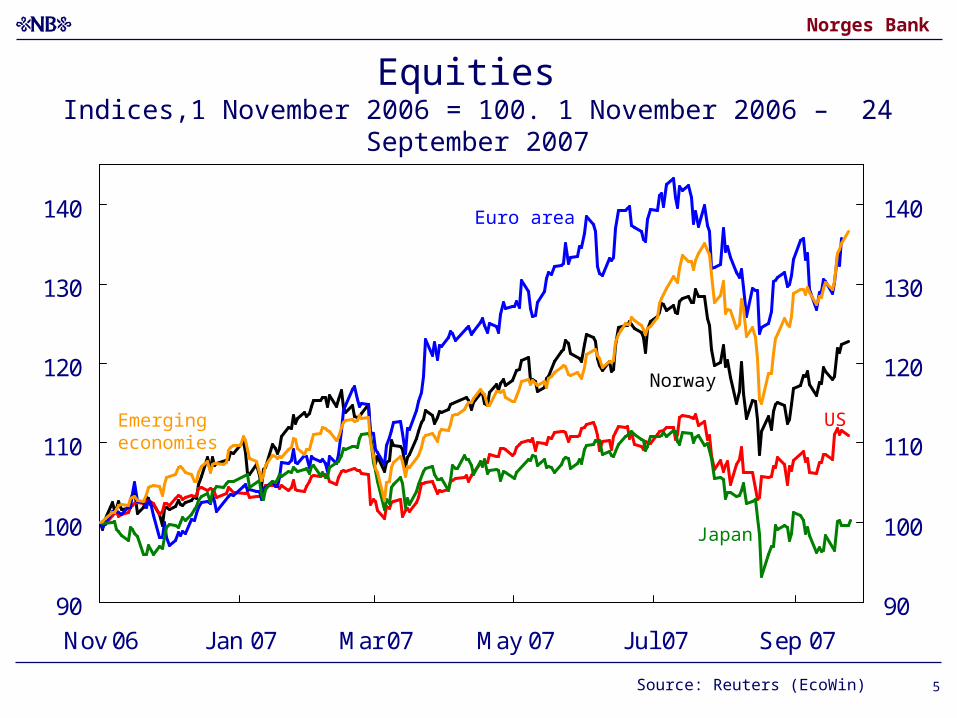
Source: Reuters (EcoWin)
US
Japan
Emerging economies
Norway
Euro area
Equities Indices,1 November 2006 = 100. 1 November 2006 – 24 September 2007
5
Norges Bank
0
1
2
3
4
5
6
Jan 04 Jul 04 Jan 05 Jul 05 Jan 06 Jul 06 Jan 07 Jul 07
0
1
2
3
4
5
6
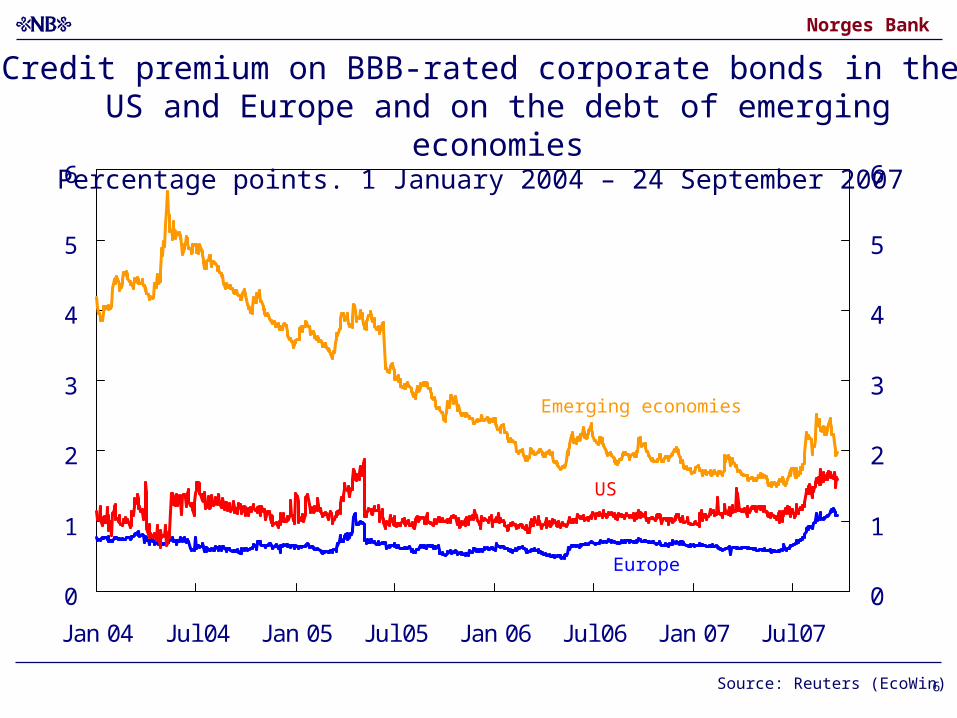
Credit premium on BBB-rated corporate bonds in the US and Europe and on the debt of emerging economies
Percentage points. 1 January 2004 – 24 September 2007
Source: Reuters (EcoWin)
US
Europe
6
Emerging economies
Norges Bank
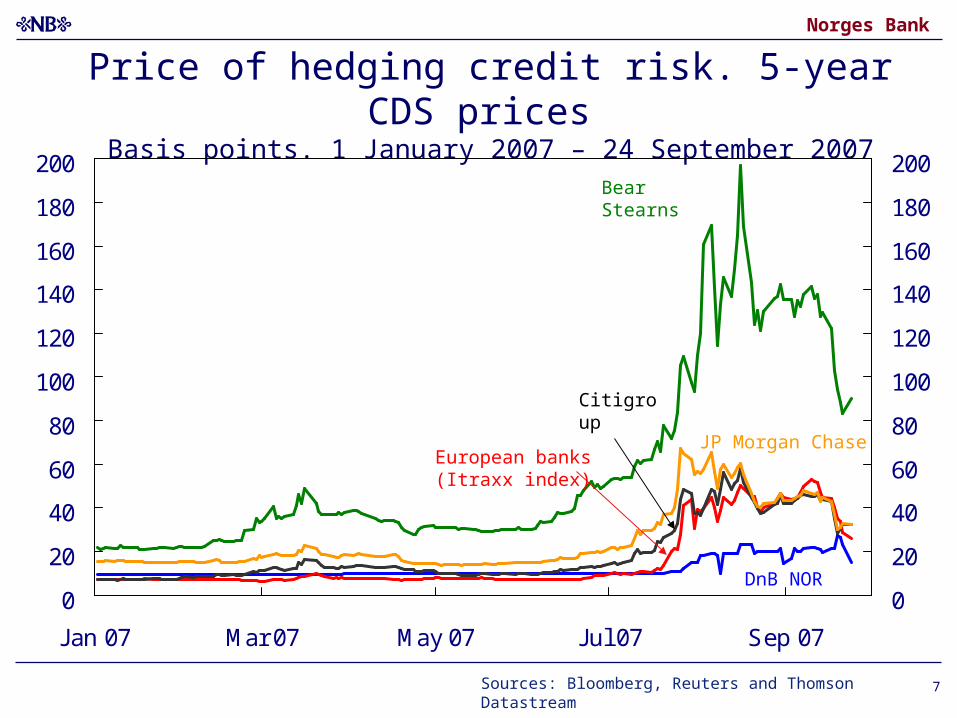
Price of hedging credit risk. 5-year CDS prices Basis points. 1 January 2007 – 24 September 2007
Sources: Bloomberg, Reuters and Thomson Datastream 7
0
20
40
60
80
100
120
140
160
180
200
Jan 07 Mar 07 May 07 Jul 07 Sep 07
0
20
40
60
80
100
120
140
160
180
200
DnB NOR
JP Morgan ChaseEuropean banks(Itraxx index)
Citigroup
Bear Stearns
Norges Bank
-0.2
0.0
0.2
0.4
0.6
0.8
1.0
1.2
1.4
1.6
Apr 07 May 07 Jun 07 Jul 07 Aug 07 Sep 07
-0.2
0.0
0.2
0.4
0.6
0.8
1.0
1.2
1.4
1.6
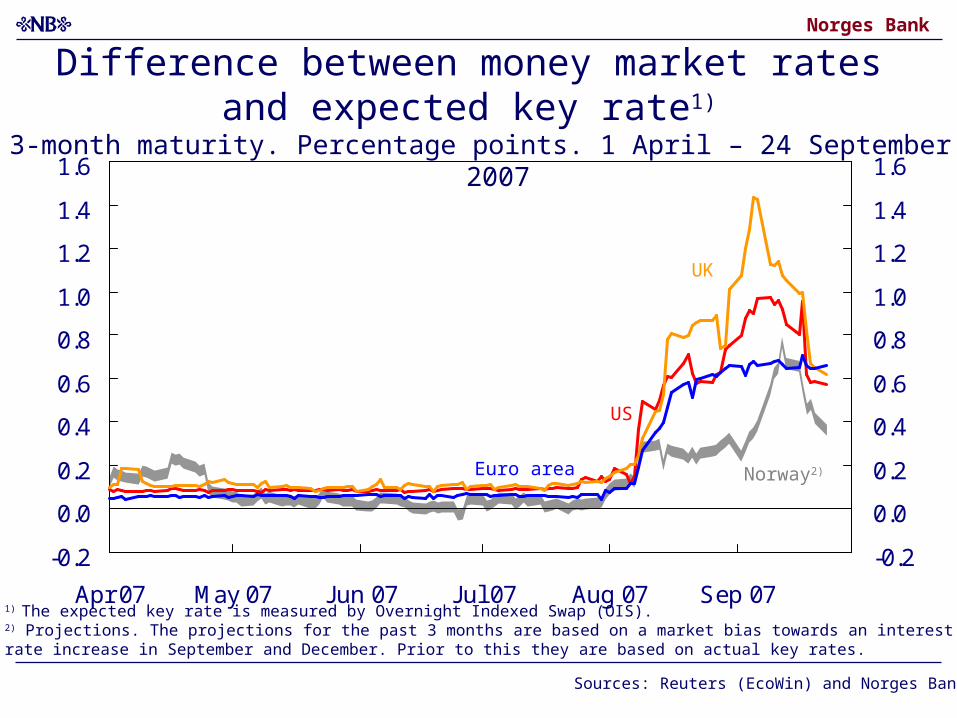
Difference between money market rates and expected key rate1)
3-month maturity. Percentage points. 1 April – 24 September 2007
Sources: Reuters (EcoWin) and Norges Bank
1) The expected key rate is measured by Overnight Indexed Swap (OIS). 2) Projections. The projections for the past 3 months are based on a market bias towards an interest rate increase in September and December. Prior to this they are based on actual key rates.
US
Euro area
UK
Norway2)
Norges Bank
0
2
4
6
8
Apr 07 May 07 Jun 07 Jul 07 Aug 07 Sep 07
0
2
4
6
8
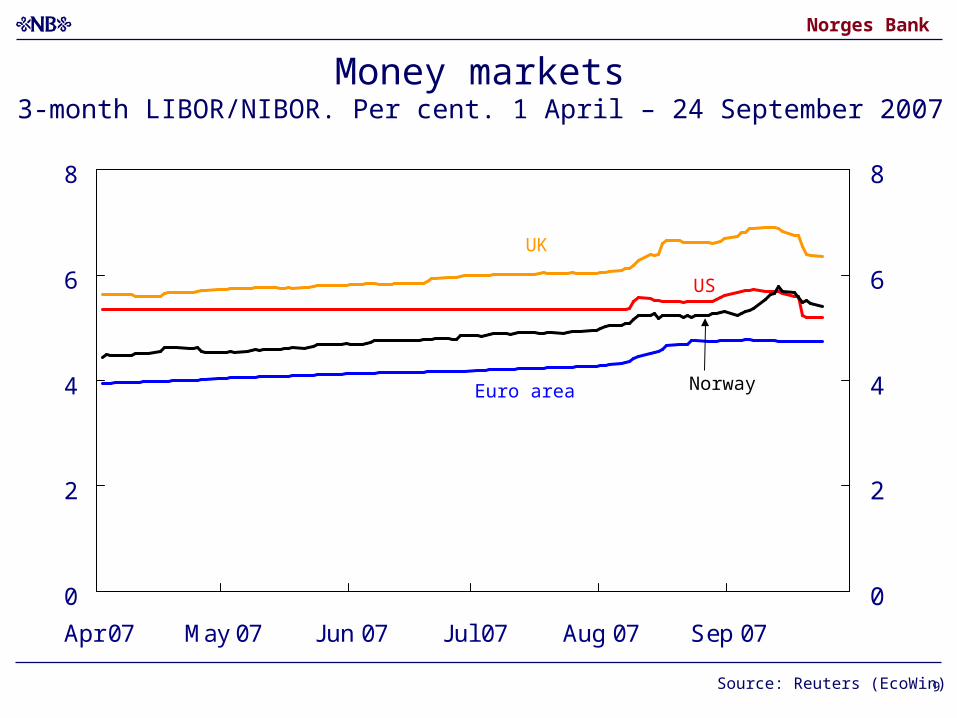
Money markets3-month LIBOR/NIBOR. Per cent. 1 April – 24 September 2007
Source: Reuters (EcoWin) 9
US
NorwayEuro area
UK
Norges Bank
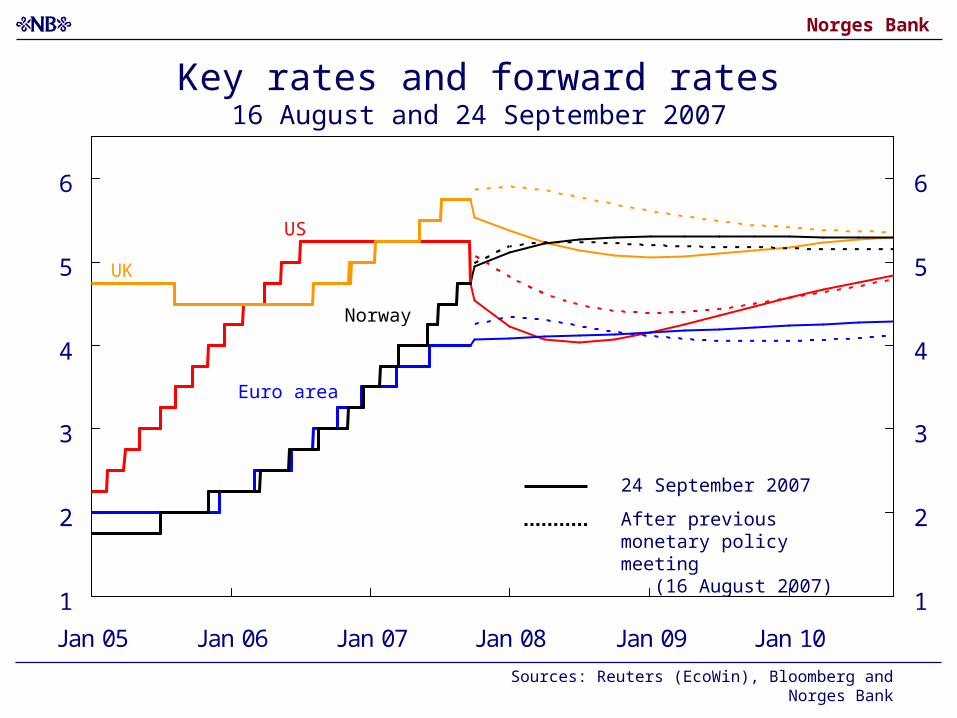
1
2
3
4
5
6
Jan 05 Jan 06 Jan 07 Jan 08 Jan 09 Jan 10
1
2
3
4
5
6
Norway
US
Euro area
24 September 2007
After previous monetary policy meeting (16 August 2007)
UK
Key rates and forward rates16 August and 24 September 2007
Sources: Reuters (EcoWin), Bloomberg and Norges Bank
Norges Bank
4.0
4.5
5.0
5.5
6.0
6.5
07 Q4 08 Q2 08 Q4 09 Q2 09 Q4 10 Q2 10 Q4
4.0
4.5
5.0
5.5
6.0
6.5
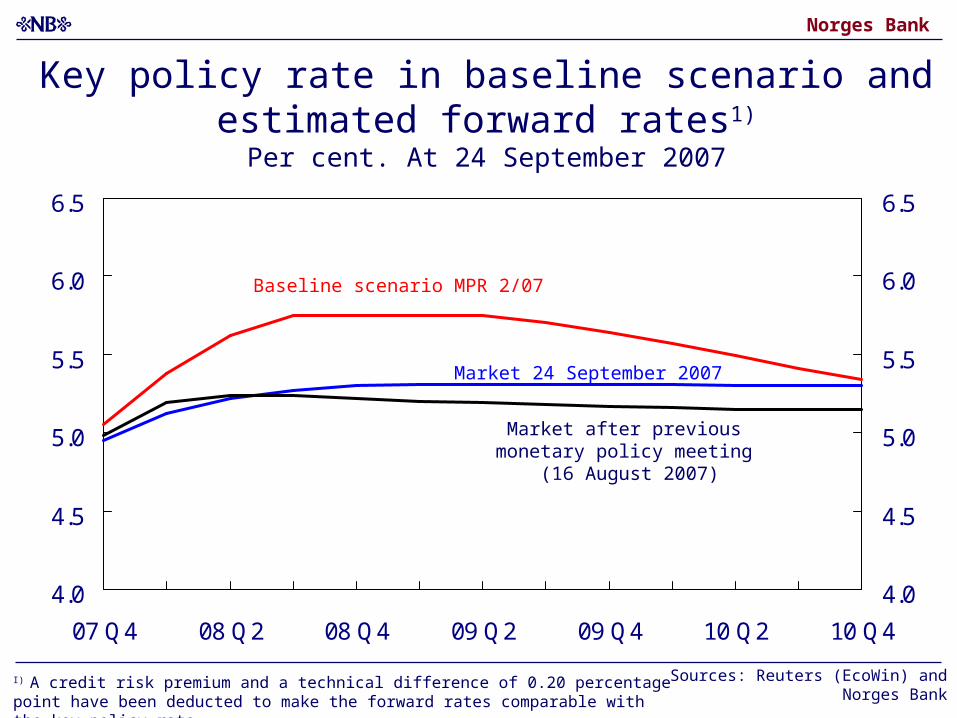
Market 24 September 2007
Market after previous monetary policy meeting
(16 August 2007)
Baseline scenario MPR 2/07
Sources: Reuters (EcoWin) and Norges Bank
Key policy rate in baseline scenario and estimated forward rates1)
Per cent. At 24 September 2007
I) A credit risk premium and a technical difference of 0.20 percentage point have been deducted to make the forward rates comparable with the key policy rate.
Norges Bank
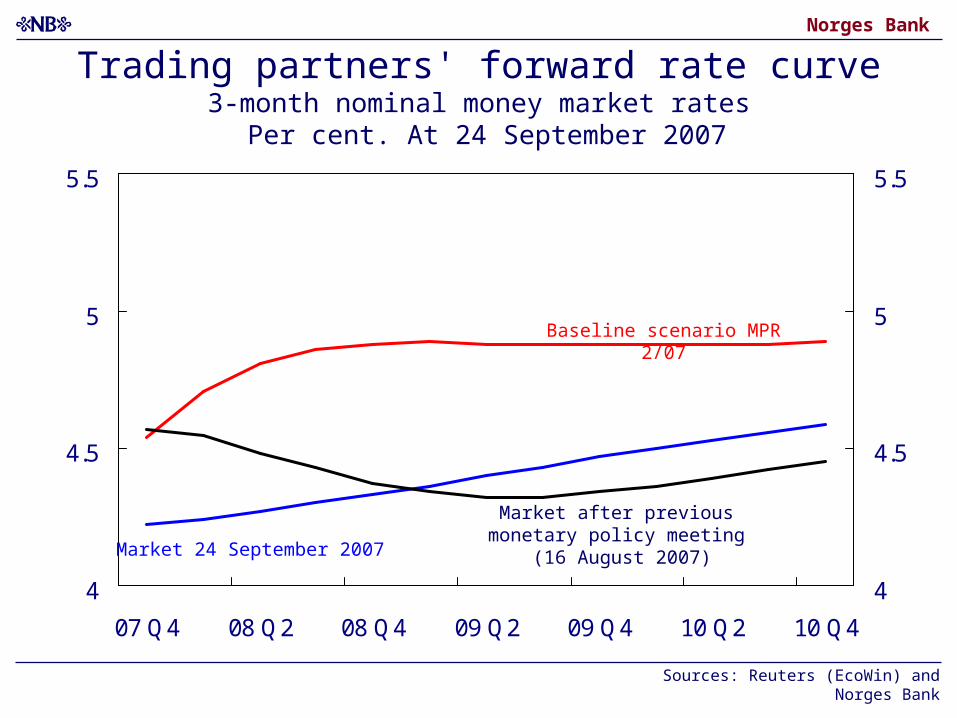
Trading partners' forward rate curve3-month nominal money market rates
Per cent. At 24 September 2007
4
4.5
5
5.5
07 Q4 08 Q2 08 Q4 09 Q2 09 Q4 10 Q2 10 Q4
4
4.5
5
5.5
Baseline scenario MPR 2/07
Market 24 September 2007
Market after previous monetary policy meeting
(16 August 2007)
Sources: Reuters (EcoWin) and Norges Bank
Norges Bank
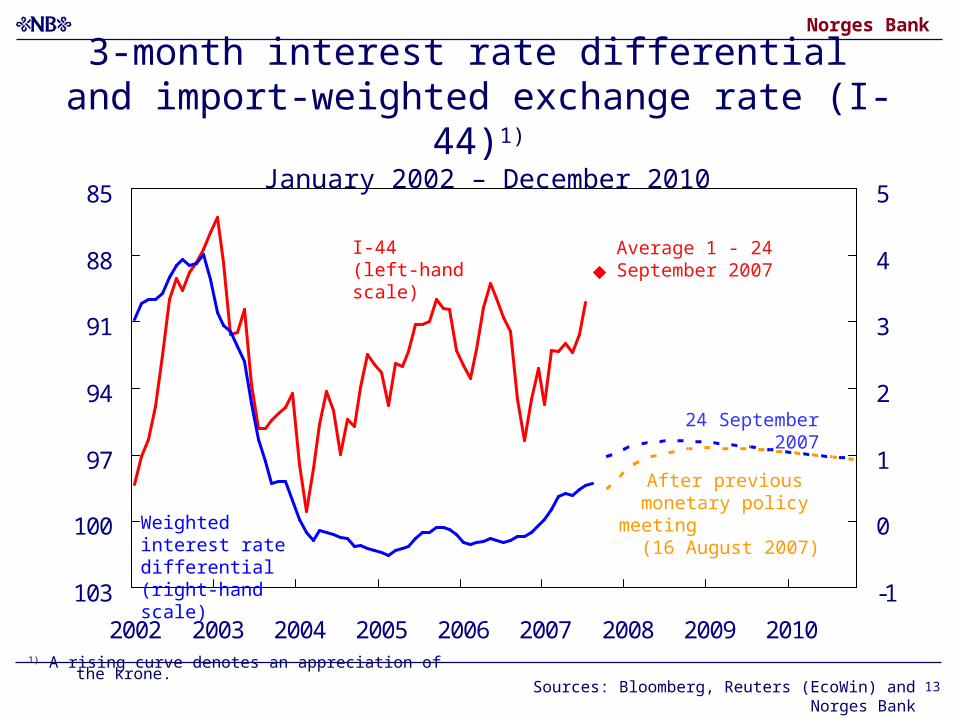
85
88
91
94
97
100
103
2002 2003 2004 2005 2006 2007 2008 2009 2010
-1
0
1
2
3
4
5
Sources: Bloomberg, Reuters (EcoWin) and Norges Bank
I-44 (left-hand scale)
Weighted interest rate differential (right-hand scale)
24 September 2007
1) A rising curve denotes an appreciation of the krone.
3-month interest rate differential and import-weighted exchange rate (I-44)1)
January 2002 – December 2010
Average 1 - 24 September 2007
After previous monetary policy meeting
(16 August 2007)
13
Norges Bank
14
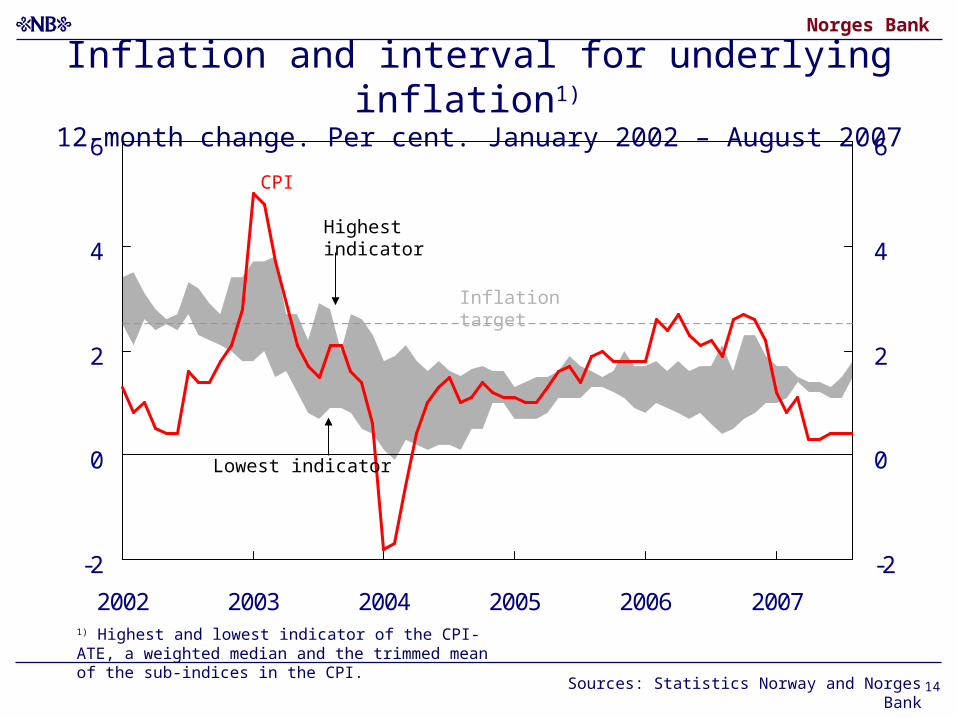
Inflation and interval for underlying inflation1) 12-month change. Per cent. January 2002 – August 2007
-2
0
2
4
6
2002 2003 2004 2005 2006 2007
-2
0
2
4
6
Highest indicator
Lowest indicator
CPI
Sources: Statistics Norway and Norges Bank
1) Highest and lowest indicator of the CPI-ATE, a weighted median and the trimmed mean of the sub-indices in the CPI.
Inflation target

Norges Bank
-5
-4
-3
-2
-1
0
1
2
3
4
Jul 03 Jan 04 Jul 04 Jan 05 Jul 05 Jan 06 Jul 06 Jan 07 Jul 07
-5
-4
-3
-2
-1
0
1
2
3
4
CPI-ATE1)
Total and broken down into imported and domestically produced goods and services2). Projections from MPR 2/07 (broken line).
12-month change. Per cent
Sources: Statistics Norway and Norges Bank
Goods and services produced in Norway (0.7)
Imported consumer goods (0.3)
CPI-ATE
1) CPI adjusted for tax changes and excluding energy products. A further adjustment is made for estimated effect of reduced maximum day-care prices in 2006.2) Norges Bank's projections.
Norges Bank
16
2200
2250
2300
2350
2400
2450
2500
2550
1999 2001 2003 2005 2007 1999 2001 2003 2005 2007
0
2
4
6
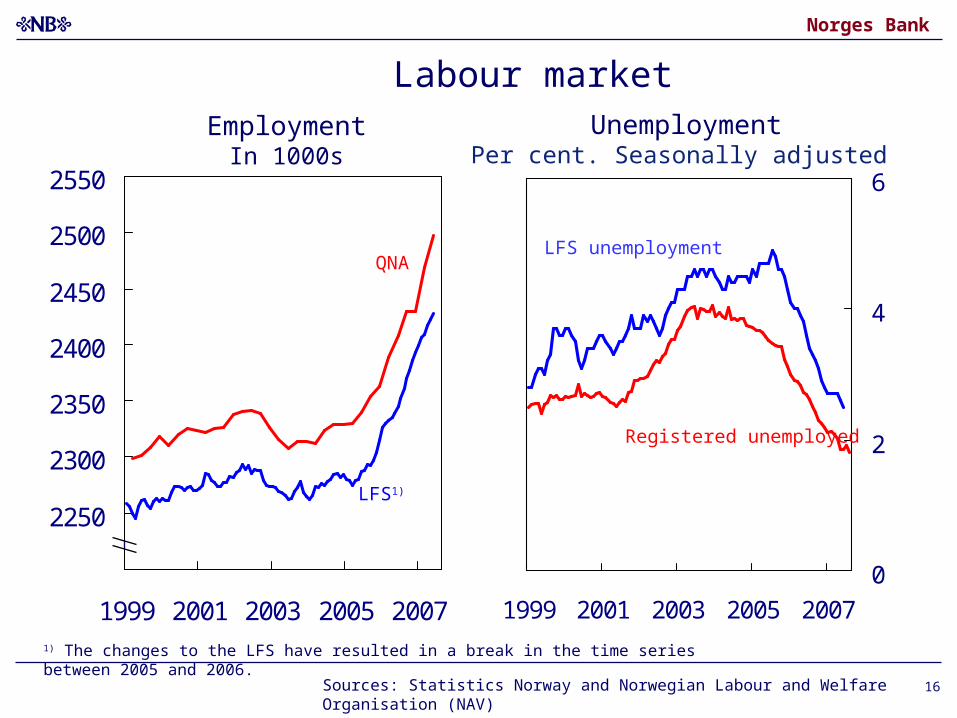
Sources: Statistics Norway and Norwegian Labour and Welfare Organisation (NAV)
Labour market
1) The changes to the LFS have resulted in a break in the time series between 2005 and 2006.
LFS unemployment
Registered unemployed
EmploymentIn 1000s
UnemploymentPer cent. Seasonally adjusted
LFS1)
QNA
Norges Bank
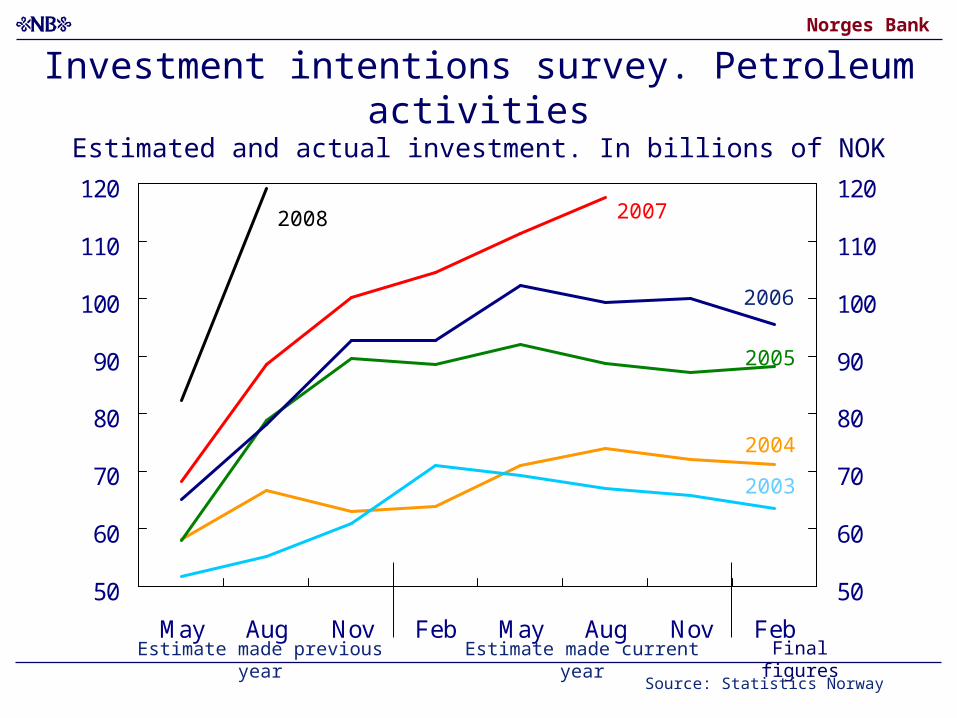
Investment intentions survey. Petroleum activitiesEstimated and actual investment. In billions of NOK
2007
2003
2004
2005
2006
Estimate made previous year Final figuresEstimate made current year
Source: Statistics Norway
2008
50
60
70
80
90
100
110
120
May Aug Nov Feb May Aug Nov Feb
50
60
70
80
90
100
110
120

Norges Bank
Investment intentions survey. ManufacturingEstimated and actual investment. In billions of NOK
Source: Statistics Norway
2007
2003
2004
2005
2006
Estimate made previous year Final figuresEstimate made current year
2008
10
15
20
25
30
May Aug Nov Feb May Aug Nov Feb
10
15
20
25
30
Norges Bank
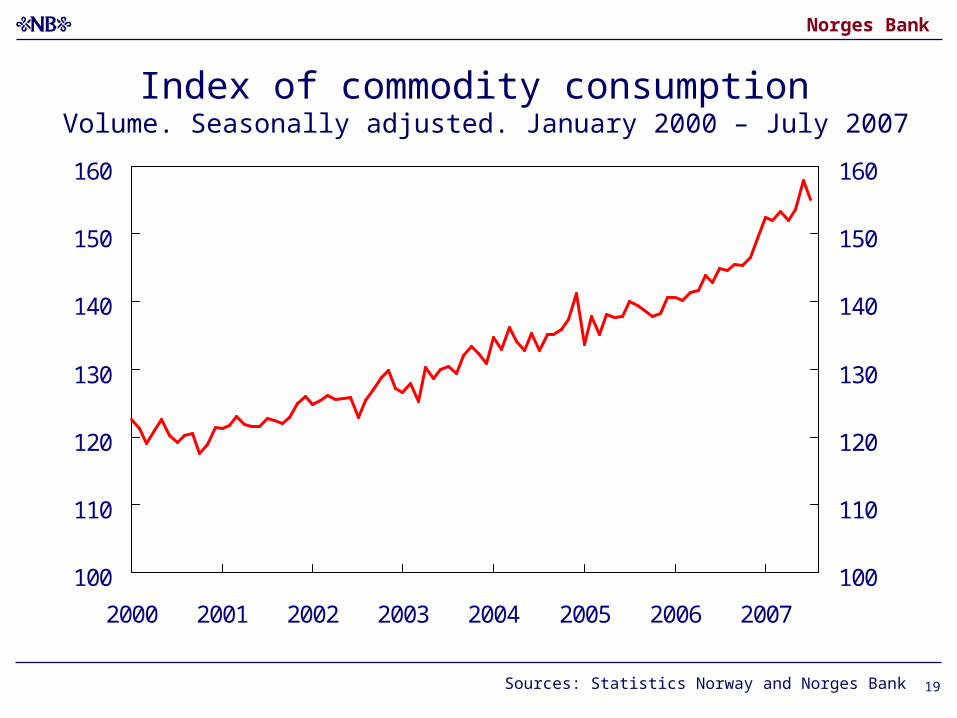
Index of commodity consumption Volume. Seasonally adjusted. January 2000 – July 2007
100
110
120
130
140
150
160
2000 2001 2002 2003 2004 2005 2006 2007
100
110
120
130
140
150
160
Sources: Statistics Norway and Norges Bank 19
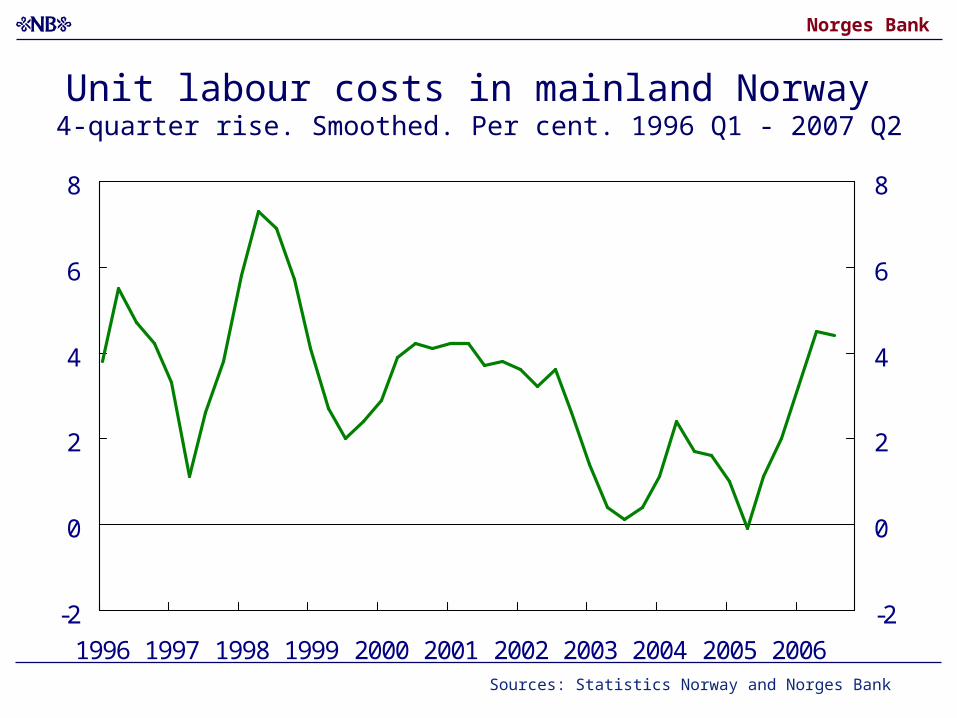
Norges Bank
Unit labour costs in mainland Norway 4-quarter rise. Smoothed. Per cent. 1996 Q1 - 2007 Q2
-2
0
2
4
6
8
1996 1997 1998 1999 2000 2001 2002 2003 2004 2005 2006
-2
0
2
4
6
8
Sources: Statistics Norway and Norges Bank
Norges Bank
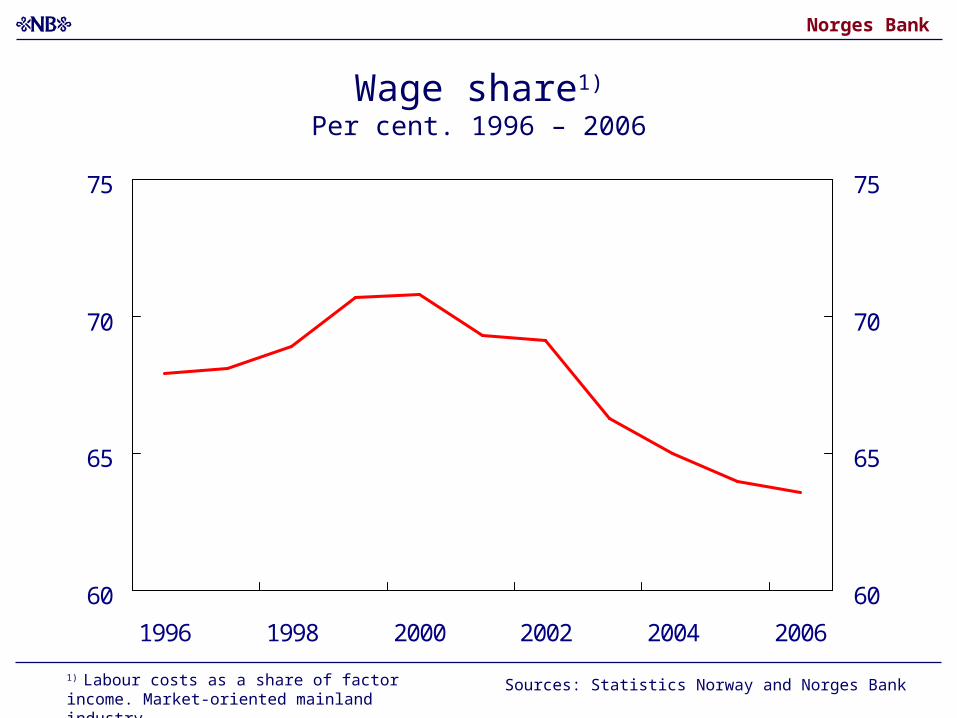
Wage share1)
Per cent. 1996 – 2006
60
65
70
75
1996 1998 2000 2002 2004 2006
60
65
70
75
Sources: Statistics Norway and Norges Bank1) Labour costs as a share of factor income. Market-oriented mainland industry.
Norges Bank
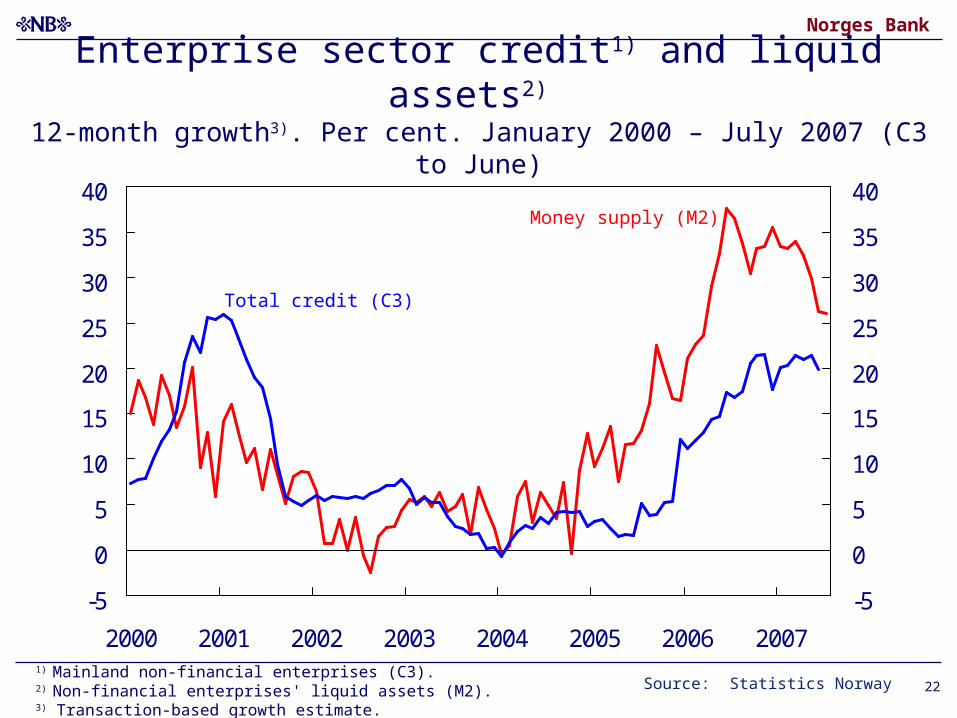
Enterprise sector credit1) and liquid assets2) 12-month growth3). Per cent. January 2000 – July 2007 (C3 to June)
-5
0
5
10
15
20
25
30
35
40
2000 2001 2002 2003 2004 2005 2006 2007
-5
0
5
10
15
20
25
30
35
40
Source: Statistics Norway
Total credit (C3)
Money supply (M2)
1) Mainland non-financial enterprises (C3).2) Non-financial enterprises' liquid assets (M2).3) Transaction-based growth estimate.
22
Norges Bank
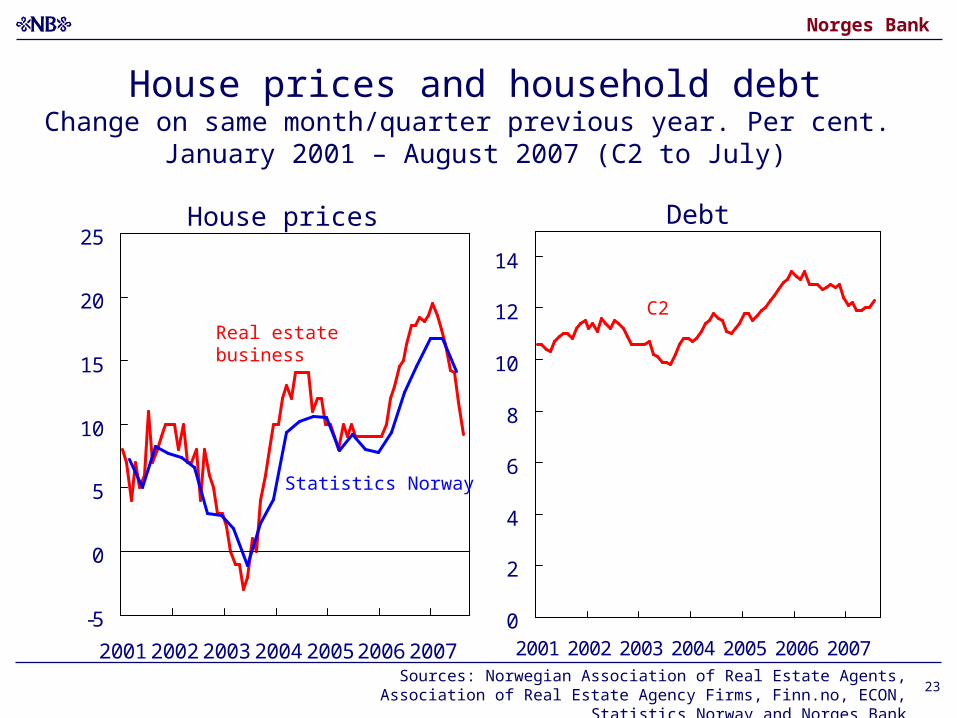
23
House prices and household debtChange on same month/quarter previous year. Per cent.
January 2001 – August 2007 (C2 to July)
-5
0
5
10
15
20
25
2001 2002 2003 2004 2005 2006 2007
0
2
4
6
8
10
12
14
2001 2002 2003 2004 2005 2006 2007
House prices Debt
Sources: Norwegian Association of Real Estate Agents, Association of Real Estate Agency Firms, Finn.no, ECON, Statistics Norway and Norges Bank
Real estate business
Statistics Norway
C2
Norges Bank
0
1
2
3
4
5
6
7
8
9
2005 2006 2007 2008 2009 2010
0
1
2
3
4
5
6
7
8
9
1/053/04
2/053/05
1/062/06
3/06
2/07
1/07
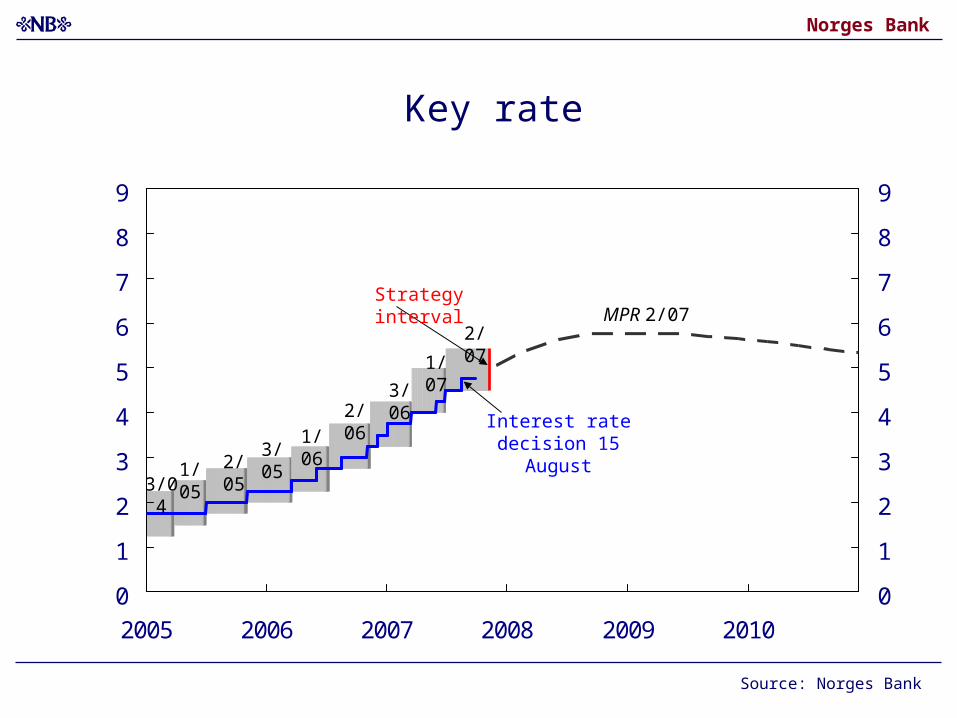
Key rate
Source: Norges Bank
MPR 2/07Strategy interval
Interest rate decision 15 August
Norges Bank
25
Monetary policy strategy
• The interest rate path presented in MPR 2/07 reflects the Executive
Board's trade-off between bringing inflation up to target and stabilising
developments in output and employment.
• In the light of this trade-off, the interest rate will be increased
gradually so that we can assess the effects of interest rate changes
and other new information on economic developments. Given the
inflation target, we will be mindful of the effects of higher interest rates
on the krone exchange rate when inflation is low.
• The key policy rate should lie in the interval 4½ – 5½% in the period
to the publication of the next Report on 31 October 2007, conditional
on economic developments that are broadly in line with the
projections.
Monetary Policy Report 2/07