Embed Size (px)
Citation preview
ORIGINAL PAPER
Normal and dusty days comparison of culturable indoorairborne bacteria in Ahvaz, Iran
Zahra Soleimani • Najmeh Parhizgari • Hassan Dehdari Rad •
Mohammad Reza Akhoond • Majid Kermani • Mohammad Bagherian Marzouni •
Hamed Goudarzi • Gholamreza Goudarzi
Received: 24 October 2013 / Accepted: 15 October 2014 / Published online: 24 October 2014
� Springer Science+Business Media Dordrecht 2014
Abstract Important sources of chemical and bio-
logical indoor pollutants include outdoor air, the
human body and human activities, emission from
materials, furnishings, appliances and use of com-
modities. The main purpose of this study was to
identify culturable indoor airborne bacteria in normal
and dust event days in indoor environments of a
school, a hospital and a university in Ahvaz city,
which individuals such as children, teenagers, adoles-
cences and old people had activity there. Samples
were collected using the biostage sampler, an
Andersen-based method, with a flow rate of 28.3 l/
min, from July 2010 to March 2011. Temperature and
humidity were measured and registered in each time of
sampling. The identification of bacteria was per-
formed to genus level by using appropriate methods
and standard biochemical tests. Gram-positive bacte-
ria in both normal and dust event days with more than
90 % had the highest concentration and frequency.
Predominant bacteria in normal and dust event days
were Staphylococcus spp. (72.9, 87.9 %), Streptomy-
ces spp. (60.9, 62.1 %), Bacillus spp. (94, 89 %) and
Z. Soleimani
Department of Environmental Health Engineering, School
of Public Health and Paramedical, Semnan University of
Medical Sciences, Aradan, Semnan, Iran
N. Parhizgari
Cellular and Molecular Research Center, Yasuj University
of Medical Sciences, Yasuj, Iran
H. Dehdari Rad
Department of Environmental Health Engineering, Health
Faculty, Ahvaz Jundishapur University of Medical
Sciences, Ahvaz, Iran
M. R. Akhoond
Department of Statistics, Mathematical Science and
Computer Faculty, Shahid Chamran University, Ahvaz,
Iran
M. Kermani
Department of Environmental Health Engineering, Health
Faculty, Iran University of Medical Sciences, Tehran, Iran
M. B. Marzouni
Expert of Environmental Research Institute, Academic
Center for Education, Culture and Research (ACECR),
Rasht, Iran
H. Goudarzi
Department of Microbiology, School of Medicine, Ahvaz
Jundishapur University of Medical Sciences, Ahvaz, Iran
G. Goudarzi (&)
Department of Environmental Health Engineering, Health
Faculty and Environmental Technologies Research Center
(ETRC), Ahvaz Jundishapur University of Medical
Sciences, Ahvaz, Iran
e-mail: [email protected]
123
Aerobiologia (2015) 31:127–141
DOI 10.1007/s10453-014-9352-4
Micrococcus spp. (65.4, 71.2 %), respectively. The
highest concentrations of bacteria in normal and dust
event days were in winter. The range of bacteria in
normal and dust event days were 0–4,800 and
210–10,000 cfu/m3, respectively. There was a signif-
icant difference between the concentration of bacteria
in normal and dust event days (p = 0.001) and also a
significant association was found between the con-
centration of total bacteria with temperature and
humidity (p\ 0.05). The concentration of bacteria
in dust event days was 1.8 times higher than normal
days. Consequently, the concentrations of bacteria in
all three sampling sites were higher in dust event days
than normal days indicating the impact of dust storms
on increased bacterial concentration in indoor
environment.
Keywords Biostage sampler � Backward trajectory �Khuzestan province � Indoor air � HYSPLIT
1 Introduction
Indoor air pollutants can be classified in different ways.
One approach is to divide them into chemical, physical
and biological agents. Another approach is to classify
them on the basis of origin. The origin of a particle has
an important impact on its composition, which may
include chemical and biological agents besides the
physical nature of the particle itself. Indoor air quality
has been influenced by numerous factors such as type of
sources, ambient conditions, building structure and
materials, occupant behavior and activities, ventilation
and air exchange speed. For indoor environments
where there are no apparent indoor sources, occupant-
related activities may become a major source of
particles (Tippayawong et al. 2009). It is mostly
believed one of the major factors influencing indoor
particulate levels is the outdoor source (Abt et al. 2000).
Many factors have effect on the concentration of
bacteria in indoor environment such as ventilation,
concentration of particulate matter, activities in envi-
ronments, population and air quality of outdoor envi-
ronment (Jo and Seo 2005; Fang et al. 2007).
Therefore, indoor to outdoor relationships in view of
bioaerosol can be investigated to enable authorities to
act against biological sources, especially when indoor
environment is not properly maintained. Biological
activities in the atmosphere are complicated which are
related to climate and weather changes, local biological
sources, and artificial and natural pollutant sources such
as dust storms (Ho et al. 2005). Dust storm cause
increasing in the level of particulate matter concentra-
tion as well as fraction size such as PM10, PM2.5 and
PM1 in indoor and outdoor environments.
Some clinical and model studies have shown that
airborne particle and gaseous pollutants have become
a growing concern for the public after proofing a
relationship between exposure and adverse health
effects (Oberdorster et al. 1995; Pope et al. 1995;
Goudarzi et al. 2012, 2013).
It is identified that man inhales nearly 10 m3 of air
every day (Adhikari et al. 2004). Youngsters of school
ages are more liable to some environmental contam-
inants than adults because they inhale greater volumes
of air to their body weights, and their tissues and
organs are growing (Tippayawong et al. 2009; Men-
dell and Health. 2005).
Bacteria are in all places of our existing environment,
and they have natural and anthropogenic sources. Dust
storm whether it is originated from natural or anthro-
pogenic sources plays an important role in carrying
pathogens or increasing the biogeographically range of
various bacteria by helping long-distance spreading
events (Kellogg and Griffin 2006; Soleimani et al.
2013). Dustborne microbes in particular can directly
affect human health by pathogenesis, contact of those
sensitive to cellular components, pollen and fungal
allergens, lipopolysaccharide, etc., and the increase of
sensitivities (i.e., asthma through long exposure) (Grif-
fin 2007). Epidemiological studies have shown that
diseases attributed to indoor environments such as
humidifier fever, asthma and Sick building syndrome
(SBS) are related to presence of pollutants particularly
bioaerosol in those places. Bacteria are commonly
identified as causes of infectious diseases (Pastuszka
et al. 2000; ACGIH 1989; Hwang et al. 2010).
In the last decade, dust storm has added to other
environmental problems particularly in the Middle
East region. Since 2002, the Middle Eastern dust storm
frequencies and intensities have increased signifi-
cantly in Khuzestan province in which dust storm
frequencies in Ahvaz as the capital city of this
province were 29, 33 and 55 in 2005, 2006 and
2007, respectively. In some periods, the residence time
was 48–72 h. Hospital admission rate increasing,
cancellation of flights, governmental and private
128 Aerobiologia (2015) 31:127–141
123
sectors closure, crops loss and migration (brain drain)
can be detrimental effects and social outcomes of this
phenomenon (Derakhshandeh et al. 2014; Goudarzi
et al. 2014; Soleimani et al. 2013; Shahsavani et al.
2012a, 2012b).
A large number of studies have conducted to
examine microorganisms in ambient air during dust
events in the world (Griffin et al. 2006; Kellogg et al.
2004; Kwaasi et al. 1998; Lyles et al. 2005; Prospero
et al. 2005; Christina et al. 2006; Schlesinger et al.
2006; Soleimani et al. 2013). Many investigations
related to ambient air quality in Ahvaz city have been
conducted recently (Goudarzi et al. 2014; Heidari-
Farsani et al. 2014; Dehdari Rad et al. 2014), but
microbial quality especially bacteria have not inves-
tigated at indoor air environments during dust event
days in Ahvaz yet. Therefore, the aim of this study was
to investigate the bacteriological aspect of incoming
dust storm at indoor environments of educational and
therapeutic places in Ahvaz city.
2 Material and method
2.1 Sampling approach
Samples were collected from indoor air of school,
university and hospital, where individuals had activity
there, with the biostage sampler (SKC Inc., PA, USA),
an Andersen-based method (Andersen 1958). Samplings
were performed in school and university classrooms, but
in hospital, internal wards were selected. The flow rate of
biostage sampler was 28.3 l/min and sampling times
were 2 and 5 min. Based on preliminary experiments,
the sampling time in normal days was 5 min, and it was
2 min for dust event days. Sampling devices were put in
1.5–2 m above the ground and with more than a meter
from any walls and other obstacles (Kim et al. 2009;
Fang et al. 2007; Jo and Seo 2005). Sampling was
performed once every 6 days in three seasons and in
different places of three stations, 266 times during
normal days and 66 times in dust event days. In each
place, sampling was done twice a day in the morning
(10–12 am) and in the afternoon (4–5 pm). The average
of temperature and relative humidity was measured by
using humidity and thermometer devices (Barometer
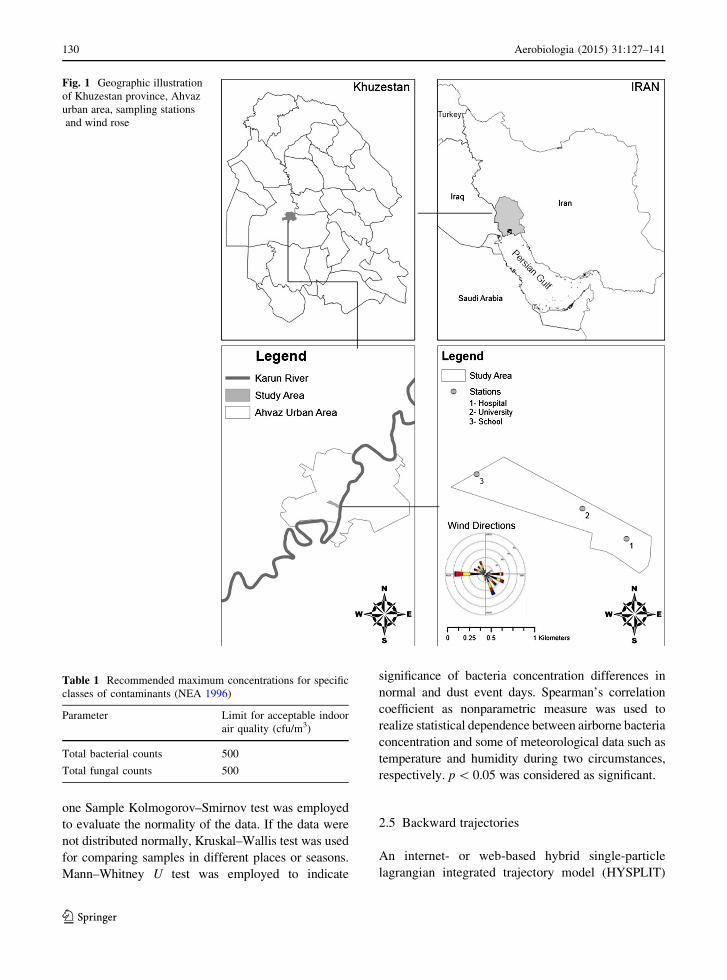
Model: PHB-318) at each point of sampling. Geographic
view of Khuzestan province, Ahvaz urban area, sam-
pling stations and wind rose are shown in Fig. 1.
Before starting, the device was calibrated and the
biostage part was sterilized with 70 % alcohol.
Trypticase Soy Agar (TSA, Merck, Germany) was
used as a culture media to isolate bacteria. Cyclohex-
imide (500 lg/l) as a fungal growth inhibitor was
added to TSA (Kim et al. 2009; Fang et al. 2005; Jo
and Seo 2005). After autoclaving, these culture
mediums were distributed on the plates, in the sterile
condition beside of flame. Then, the culture medium
was placed inside biostage, and sampling was done for
5 and 2 min during normal and dust event days,
respectively.
2.2 Experimental procedures
Bacteria-containing medium was placed for 48–72 h
into incubator with a temperature of 35–37 �C (Kim
et al. 2009; Fang et al. 2007). The numbers of colonies
were reported as colony-forming units per air volume
(cfu/m3). Colony-forming units per cubic meter of air
was calculated as follows:
Number of colony of bacteria cfuð Þ½ �=sampling time minð Þ � velocity of air flow l=minð Þ½�0:001 m3=l
� ��
Bacterial genus identification was conducted using
macroscopic and microscopic examinations of Gram-
stained prepared smears and standard biochemical
tests (Augustowska and Dutkiewicz 2006). Besides,
the spore staining and partial acid-fast staining were
used to identify Bacillus and Nocardia genera,
respectively. Enterobacteriaceae was identified using
API kit (Fang et al. 2007).
2.3 Indoor air quality guideline
Many criteria and guidelines associated with indoor
and outdoor air quality have been reported in the world
to enable researchers and scientists to provide a better
judgment about their findings. A guideline for com-
paring our result with good indoor air quality is
presented in Table 1.
2.4 Statistical analysis
Statistical analysis was conducted by using SPSS
version 17. Analysis of variance was used to compare
means at different places, conditions and seasons. The
Aerobiologia (2015) 31:127–141 129
123
one Sample Kolmogorov–Smirnov test was employed
to evaluate the normality of the data. If the data were
not distributed normally, Kruskal–Wallis test was used
for comparing samples in different places or seasons.
Mann–Whitney U test was employed to indicate
significance of bacteria concentration differences in
normal and dust event days. Spearman’s correlation
coefficient as nonparametric measure was used to
realize statistical dependence between airborne bacteria
concentration and some of meteorological data such as
temperature and humidity during two circumstances,
respectively. p\ 0.05 was considered as significant.
2.5 Backward trajectories
An internet- or web-based hybrid single-particle
lagrangian integrated trajectory model (HYSPLIT)
Fig. 1 Geographic illustration
of Khuzestan province, Ahvaz
urban area, sampling stations
and wind rose
Table 1 Recommended maximum concentrations for specific
classes of contaminants (NEA 1996)
Parameter Limit for acceptable indoor
air quality (cfu/m3)
Total bacterial counts 500
Total fungal counts 500
130 Aerobiologia (2015) 31:127–141
123
was used to realize backward air mass trajectory of
incoming dust storm. Coordination of 48�0.680 and
31�0.320 was introduced to the model as longitude and
latitude of Ahvaz city, respectively. It was used to
investigate the origin, route and direction of dust
storms.
3 Results
3.1 Concentrations of bacteria in different sites
Mean, median, minimum and maximum of bacteria
concentration as cfu/m3, temperature and humidity in
three sampling points in normal and dust event days
from July 2010 to March 2011 are shown in Table 2.
The concentrations of extracted bacteria in sampling
points in normal and dust event days were between
8–4,800 and 210–10,000 cfu/m3, respectively.
Mean concentration of bacteria in normal and dust
event days in school was higher than two other points.
Also mean concentration of bacteria at school
(600.8 cfu/m3) was higher than two other points
during normal days. Although total concentration of
bacteria at school was significantly different from
university and hospital (p\ 0.001), there was signif-
icant difference for total concentration of bacteria
between university and hospital (p = 0.041) during
normal days.
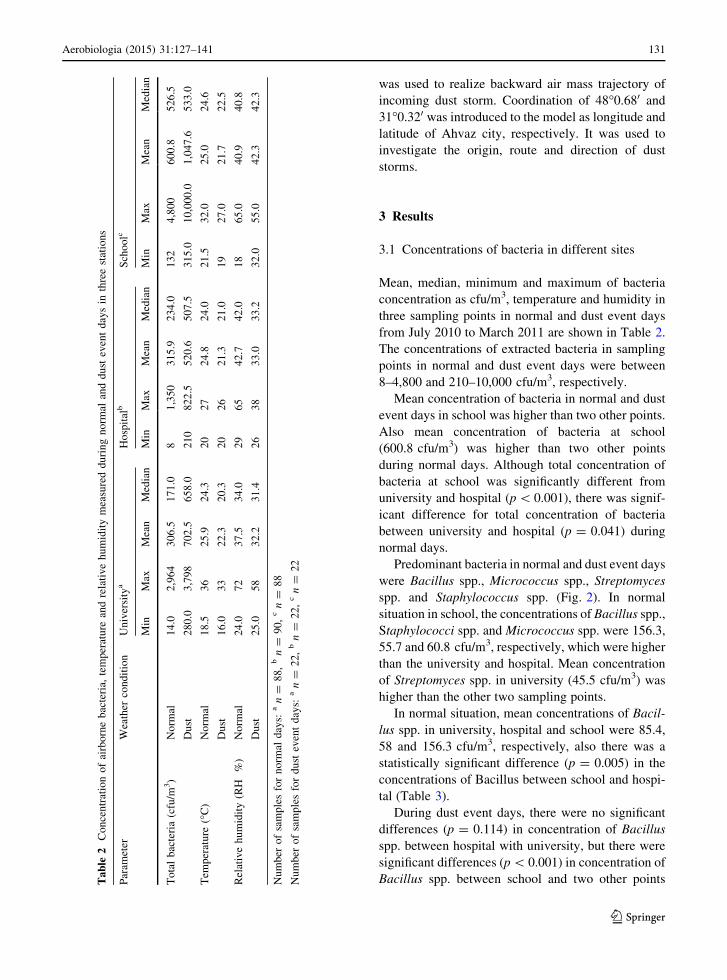
Predominant bacteria in normal and dust event days
were Bacillus spp., Micrococcus spp., Streptomyces
spp. and Staphylococcus spp. (Fig. 2). In normal
situation in school, the concentrations of Bacillus spp.,
Staphylococci spp. and Micrococcus spp. were 156.3,
55.7 and 60.8 cfu/m3, respectively, which were higher
than the university and hospital. Mean concentration
of Streptomyces spp. in university (45.5 cfu/m3) was
higher than the other two sampling points.
In normal situation, mean concentrations of Bacil-
lus spp. in university, hospital and school were 85.4,
58 and 156.3 cfu/m3, respectively, also there was a
statistically significant difference (p = 0.005) in the
concentrations of Bacillus between school and hospi-
tal (Table 3).
During dust event days, there were no significant
differences (p = 0.114) in concentration of Bacillus
spp. between hospital with university, but there were
significant differences (p\ 0.001) in concentration of
Bacillus spp. between school and two other pointsTable
2C
on
cen
trat
ion
of
airb
orn
eb
acte
ria,
tem
per
atu
rean
dre
lati
ve
hu
mid
ity
mea
sure
dd
uri
ng
no
rmal
and
du
stev
ent
day
sin
thre
est
atio
ns
Par
amet
erW
eath
erco
nd
itio
nU
niv
ersi
tya
Ho
spit
alb
Sch
oo
lc
Min
Max
Mea
nM
edia
nM
inM
axM
ean
Med
ian
Min
Max
Mea
nM
edia
n
To
tal
bac
teri
a(c
fu/m
3)
No
rmal
14
.02
,96
43
06
.51
71
.08
1,3
50
31
5.9
23
4.0
13
24
,80
06
00
.85
26
.5
Du
st2
80
.03
,79
87
02
.56
58
.02
10
82
2.5
52
0.6
50
7.5
31
5.0
10
,00
0.0
1,0
47
.65
33
.0
Tem
per
atu
re(�
C)
No
rmal
18
.53
62
5.9
24
.32
02
72
4.8
24
.02
1.5
32
.02
5.0
24
.6
Du
st1
6.0
33
22
.32
0.3
20
26
21
.32
1.0
19
27
.02
1.7
22
.5
Rel
ativ
eh
um
idit
y(R
H%
)N
orm
al2
4.0
72
37
.53
4.0
29
65
42
.74
2.0
18
65
.04
0.9
40
.8
Du
st2
5.0
58
32
.23
1.4
26
38
33
.03
3.2
32
.05
5.0
42
.34
2.3
Nu
mb
ero
fsa
mp
les
for
no
rmal
day
s:an=
88
,bn=
90
,cn=
88
Nu
mb
ero
fsa
mp
les
for
du
stev
ent
day
s:an=
22
,bn=
22
,cn=
22
Aerobiologia (2015) 31:127–141 131
123
(Table 3). There was no significant difference in the
total concentrations of bacteria between hospital with
school and university (p[ 0.05), also concentrations
of Bacillus spp., Staphylococcus spp. and Streptomy-
ces spp. in school were 378.3, 100 and 114.2 cfu/m3,
respectively, which were higher than other places.
3.2 Bacteria concentrations in different seasons
Mean, median, minimum and maximum of the total
bacteria concentration, temperature and humidity in
normal and dust event days of three seasons (summer,
autumnandwinter)arepresented inTable 4.Thehighest
mean concentrations of bacteria genera during normal
and dust event days were 537.7 and 1,353.8 cfu/m3,
respectively, which occurred in winter. In normal and
dust event days, there was a significant difference in total
concentrations of bacteria in summer with these concen-
trations in autumn as well in winter (p\ 0.05).
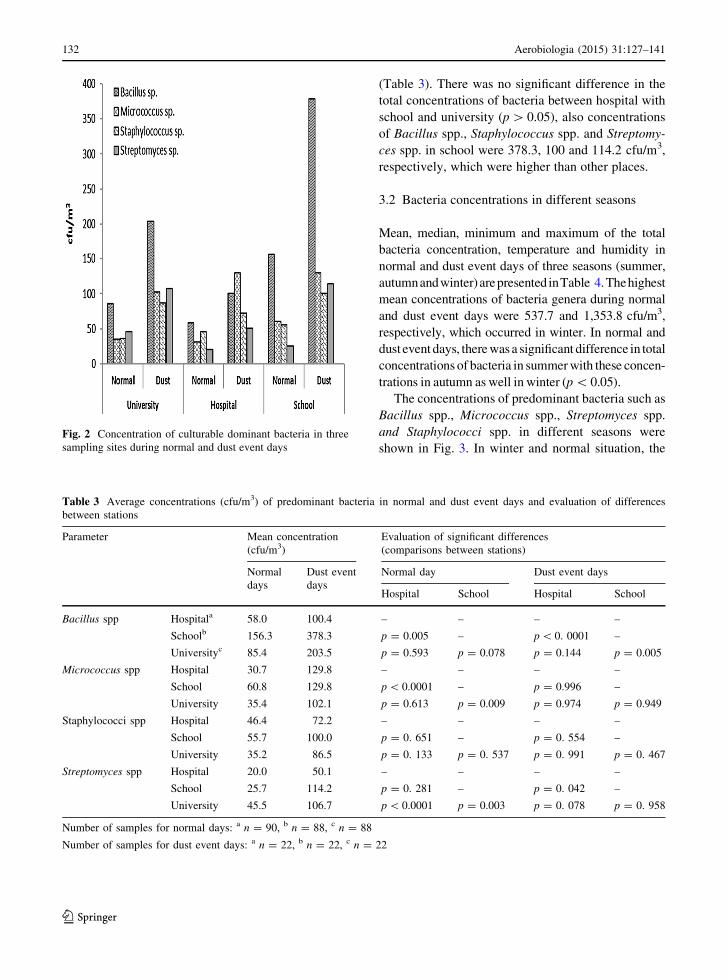
The concentrations of predominant bacteria such as
Bacillus spp., Micrococcus spp., Streptomyces spp.
and Staphylococci spp. in different seasons were
shown in Fig. 3. In winter and normal situation, the
Table 3 Average concentrations (cfu/m3) of predominant bacteria in normal and dust event days and evaluation of differences
between stations
Parameter Mean concentration
(cfu/m3)
Evaluation of significant differences
(comparisons between stations)
Normal
days
Dust event
days
Normal day Dust event days
Hospital School Hospital School
Bacillus spp Hospitala 58.0 100.4 – – – –
Schoolb 156.3 378.3 p = 0.005 – p\ 0. 0001 –
Universityc 85.4 203.5 p = 0.593 p = 0.078 p = 0.144 p = 0.005
Micrococcus spp Hospital 30.7 129.8 – – – –
School 60.8 129.8 p\ 0.0001 – p = 0.996 –
University 35.4 102.1 p = 0.613 p = 0.009 p = 0.974 p = 0.949
Staphylococci spp Hospital 46.4 72.2 – – – –
School 55.7 100.0 p = 0. 651 – p = 0. 554 –
University 35.2 86.5 p = 0. 133 p = 0. 537 p = 0. 991 p = 0. 467
Streptomyces spp Hospital 20.0 50.1 – – – –
School 25.7 114.2 p = 0. 281 – p = 0. 042 –
University 45.5 106.7 p\ 0.0001 p = 0.003 p = 0. 078 p = 0. 958
Number of samples for normal days: a n = 90, b n = 88, c n = 88
Number of samples for dust event days: a n = 22, b n = 22, c n = 22
Fig. 2 Concentration of culturable dominant bacteria in three
sampling sites during normal and dust event days
132 Aerobiologia (2015) 31:127–141
123
mean concentrations of Bacillus spp. and Micrococcus
spp. were 138.4 and 61.5 cfu/m3, respectively, which
were higher than other seasons. The mean concentra-
tions of Staphylococcus spp. and Streptomyces spp. in
autumn were 58.3 and 52 cfu/m3, respectively, which
were higher than summer and winter. In normal and
dust event days, there was a significant difference in
concentration of Staphylococcus spp. between sum-
mer with winter and autumn (p\ 0.05).
During dust event days, the mean concentrations of
Bacillus spp., Micrococcus spp. and Streptomyces spp.
in winter were 365.4, 160.4 and 166.2 cfu/m3,
respectively, which were higher than summer and
autumn, whereas the mean concentration of staphylo-
cocci in autumn (115.6 cfu/m3) was higher than the
other seasons.
3.3 Comparison of bacteria concentration
in normal and dust event days
Table 5 shows the frequencies of identified bacteria in
three sampling points. As it is shown in this table, 19
genera of bacteria and two species were identified. In
normal situation, frequencies of Bacillus spp., Micro-
coccus spp., Staphylococcus spp. and Streptomyces spp.
in university, hospital and school were 67.0–94.3,
52.2–91.1 and 61.4–96.6 %, respectively. In dust event
days, they were 68.2–86.4, 54.5–100 and 63.6–100 %,
respectively. The frequencies of other Gram-positive
bacteria in normal situation at university, hospital and
school were 0–50.0, 0–44.4 and 0–46.6 %, whereas
they were 0–45.5, 0–45.4 and 0–54.5 % during dust
event days, respectively (Table 5). The frequencies of
Gram-negative bacteria in normal and dust event days
were 0–33 and 0–36.4 %, respectively.
According to Fig. 4, concentrations of bacteria in
dust event days were 1.2–17 times more than normal
days in which the most increasing ratio was related to
Bacillus cereus (17) and the least was associated with
Enterobacter spp. (1.2). This ratio for total bacteria
was 1.8. There was a significant difference in mean
concentration of total bacteria between normal and
dust event days (p = 0.001).
Table 4 Concentration of airborne bacteria, temperature and relative humidity measured during normal and dust event days
Parameter Weather
condition
Summera Autumnb Winterc
Min Max Mean Median Min Max Mean Median Min Max Mean Median
Total bacteria
(cfu/m3)
Normal 46.0 295.0 180 120.5 10.0 4,800.0 500.2 439.5 8.0 1,872.0 537.7 428.6
Dust 210.0 998.0 484.9 455.0 420.0 998.0 581.3 525.0 472.5 10,000 1,353.8 673.5
Temperature (�C) Normal 28.0 36.0 29.0 32.0 18.5 33.0 24.2 24.2 20.0 27.0 23.1 23.7
Dust 25.0 33.0 28.2 29.4 17.0 25.6 18.5 22.0 16.0 24.0 17.5 19.4
Relative
humidity
(RH %)
Normal 24.0 52.0 33.5 33.0 29.0 72.0 42.5 40.4 18.0 65.0 44.9 42.5
Dust 32.0 43.0 36.2 36.5 25.0 58.0 39.6 38.0 26.0 48.0 30.4 29.0
Number of sample for normal days: a n = 88, b n = 90, c n = 88
Number of sample for dust event days: a n = 24, b n = 24, c n = 18
Fig. 3 Concentration of culturable dominant bacteria in three
sampling seasons during normal and dust event days
Aerobiologia (2015) 31:127–141 133
123
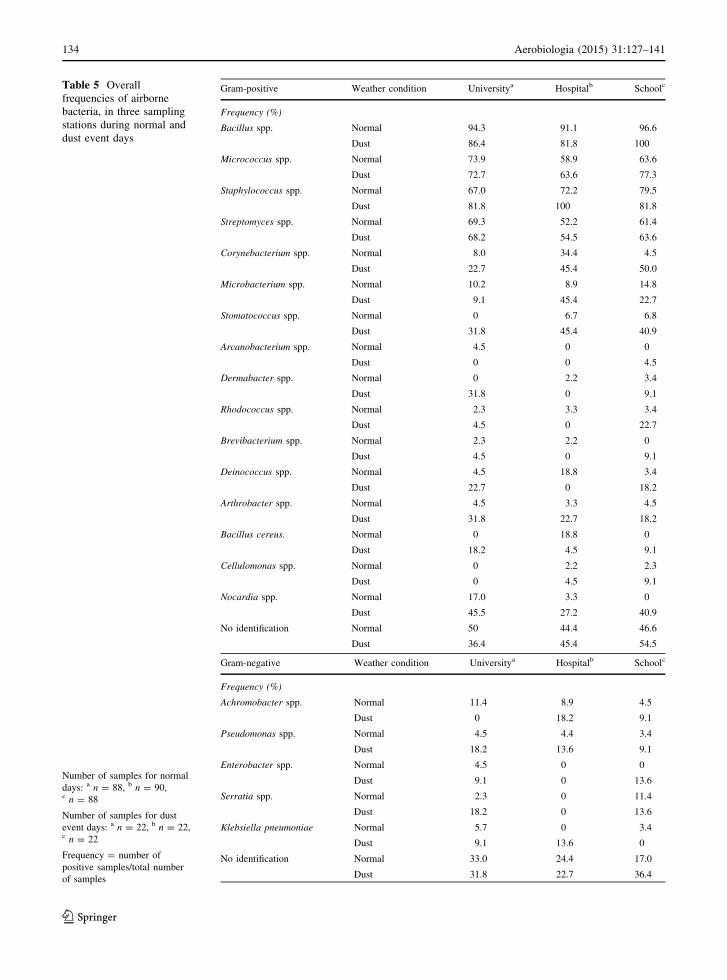
Table 5 Overall
frequencies of airborne
bacteria, in three sampling
stations during normal and
dust event days
Number of samples for normal
days: a n = 88, b n = 90,c n = 88
Number of samples for dust
event days: a n = 22, b n = 22,c n = 22
Frequency = number of
positive samples/total number
of samples
Gram-positive Weather condition Universitya Hospitalb Schoolc
Frequency (%)
Bacillus spp. Normal 94.3 91.1 96.6
Dust 86.4 81.8 100
Micrococcus spp. Normal 73.9 58.9 63.6
Dust 72.7 63.6 77.3
Staphylococcus spp. Normal 67.0 72.2 79.5
Dust 81.8 100 81.8
Streptomyces spp. Normal 69.3 52.2 61.4
Dust 68.2 54.5 63.6
Corynebacterium spp. Normal 8.0 34.4 4.5
Dust 22.7 45.4 50.0
Microbacterium spp. Normal 10.2 8.9 14.8
Dust 9.1 45.4 22.7
Stomatococcus spp. Normal 0 6.7 6.8
Dust 31.8 45.4 40.9
Arcanobacterium spp. Normal 4.5 0 0
Dust 0 0 4.5
Dermabacter spp. Normal 0 2.2 3.4
Dust 31.8 0 9.1
Rhodococcus spp. Normal 2.3 3.3 3.4
Dust 4.5 0 22.7
Brevibacterium spp. Normal 2.3 2.2 0
Dust 4.5 0 9.1
Deinococcus spp. Normal 4.5 18.8 3.4
Dust 22.7 0 18.2
Arthrobacter spp. Normal 4.5 3.3 4.5
Dust 31.8 22.7 18.2
Bacillus cereus. Normal 0 18.8 0
Dust 18.2 4.5 9.1
Cellulomonas spp. Normal 0 2.2 2.3
Dust 0 4.5 9.1
Nocardia spp. Normal 17.0 3.3 0
Dust 45.5 27.2 40.9
No identification Normal 50 44.4 46.6
Dust 36.4 45.4 54.5
Gram-negative Weather condition Universitya Hospitalb Schoolc
Frequency (%)
Achromobacter spp. Normal 11.4 8.9 4.5
Dust 0 18.2 9.1
Pseudomonas spp. Normal 4.5 4.4 3.4
Dust 18.2 13.6 9.1
Enterobacter spp. Normal 4.5 0 0
Dust 9.1 0 13.6
Serratia spp. Normal 2.3 0 11.4
Dust 18.2 0 13.6
Klebsiella pneumoniae Normal 5.7 0 3.4
Dust 9.1 13.6 0
No identification Normal 33.0 24.4 17.0
Dust 31.8 22.7 36.4
134 Aerobiologia (2015) 31:127–141
123
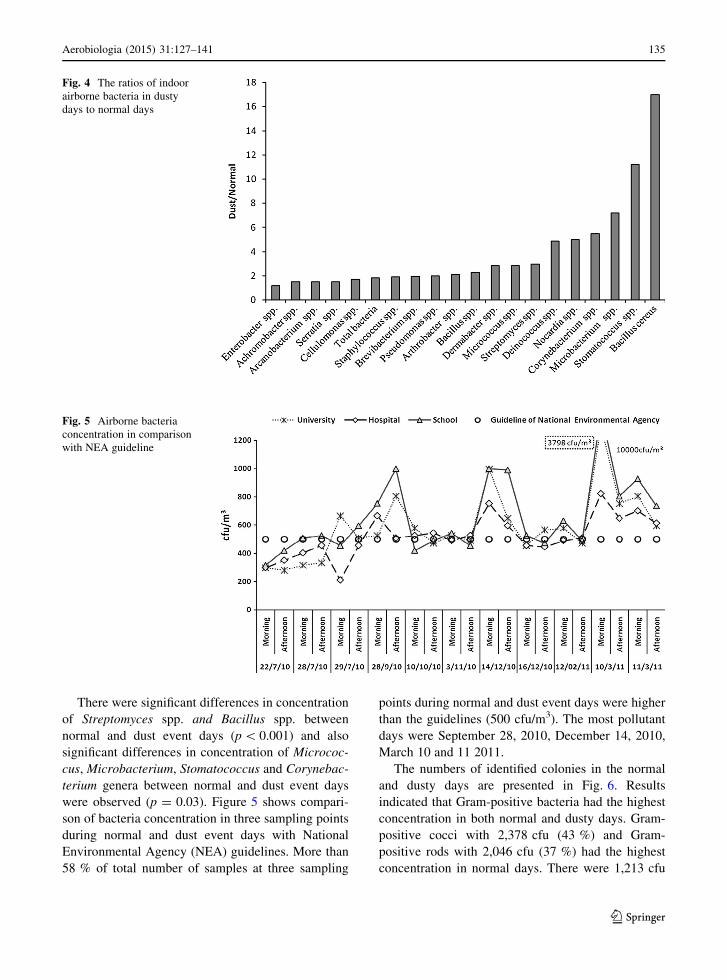
There were significant differences in concentration
of Streptomyces spp. and Bacillus spp. between
normal and dust event days (p\ 0.001) and also
significant differences in concentration of Micrococ-
cus, Microbacterium, Stomatococcus and Corynebac-
terium genera between normal and dust event days
were observed (p = 0.03). Figure 5 shows compari-
son of bacteria concentration in three sampling points
during normal and dust event days with National
Environmental Agency (NEA) guidelines. More than
58 % of total number of samples at three sampling
points during normal and dust event days were higher
than the guidelines (500 cfu/m3). The most pollutant
days were September 28, 2010, December 14, 2010,
March 10 and 11 2011.
The numbers of identified colonies in the normal
and dusty days are presented in Fig. 6. Results
indicated that Gram-positive bacteria had the highest
concentration in both normal and dusty days. Gram-
positive cocci with 2,378 cfu (43 %) and Gram-
positive rods with 2,046 cfu (37 %) had the highest
concentration in normal days. There were 1,213 cfu
Fig. 4 The ratios of indoor
airborne bacteria in dusty
days to normal days
Fig. 5 Airborne bacteria
concentration in comparison
with NEA guideline
Aerobiologia (2015) 31:127–141 135
123
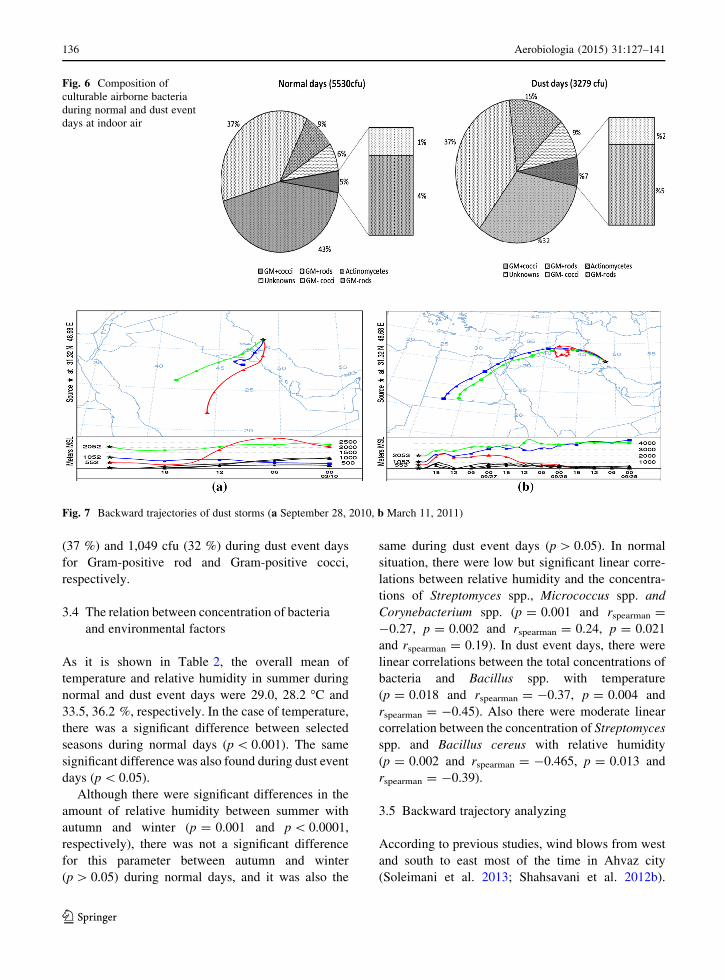
(37 %) and 1,049 cfu (32 %) during dust event days
for Gram-positive rod and Gram-positive cocci,
respectively.
3.4 The relation between concentration of bacteria
and environmental factors
As it is shown in Table 2, the overall mean of
temperature and relative humidity in summer during
normal and dust event days were 29.0, 28.2 �C and
33.5, 36.2 %, respectively. In the case of temperature,
there was a significant difference between selected
seasons during normal days (p\ 0.001). The same
significant difference was also found during dust event
days (p\ 0.05).
Although there were significant differences in the
amount of relative humidity between summer with
autumn and winter (p = 0.001 and p\ 0.0001,
respectively), there was not a significant difference
for this parameter between autumn and winter
(p[ 0.05) during normal days, and it was also the
same during dust event days (p[ 0.05). In normal
situation, there were low but significant linear corre-
lations between relative humidity and the concentra-
tions of Streptomyces spp., Micrococcus spp. and
Corynebacterium spp. (p = 0.001 and rspearman =
-0.27, p = 0.002 and rspearman = 0.24, p = 0.021
and rspearman = 0.19). In dust event days, there were
linear correlations between the total concentrations of
bacteria and Bacillus spp. with temperature
(p = 0.018 and rspearman = -0.37, p = 0.004 and
rspearman = -0.45). Also there were moderate linear
correlation between the concentration of Streptomyces
spp. and Bacillus cereus with relative humidity
(p = 0.002 and rspearman = -0.465, p = 0.013 and
rspearman = -0.39).
3.5 Backward trajectory analyzing
According to previous studies, wind blows from west
and south to east most of the time in Ahvaz city
(Soleimani et al. 2013; Shahsavani et al. 2012b).
Fig. 6 Composition of
culturable airborne bacteria
during normal and dust event
days at indoor air
Fig. 7 Backward trajectories of dust storms (a September 28, 2010, b March 11, 2011)
136 Aerobiologia (2015) 31:127–141
123
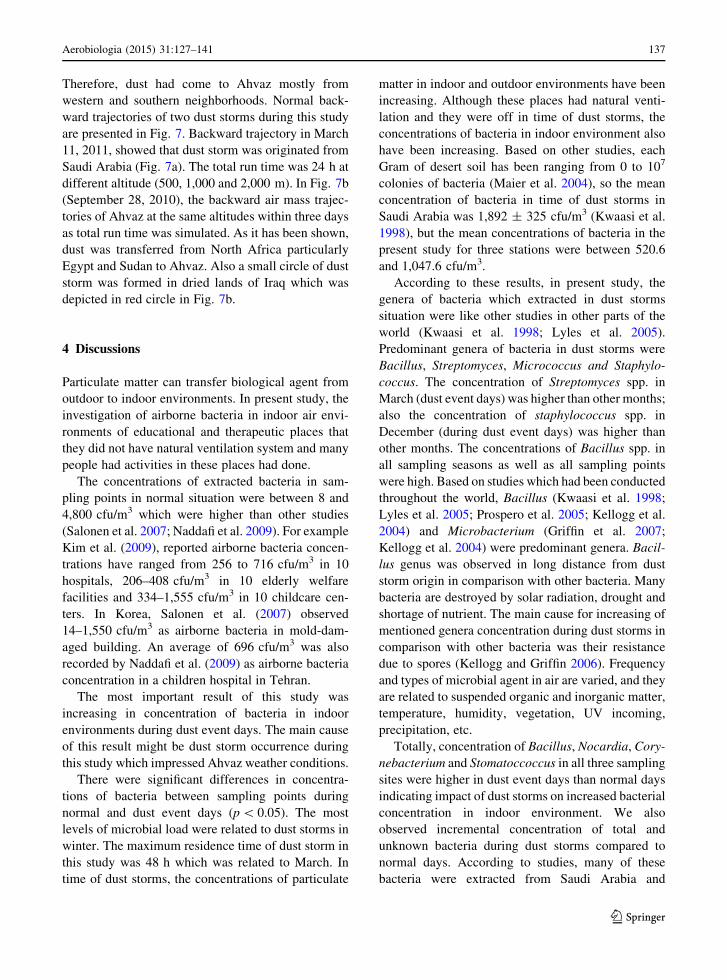
Therefore, dust had come to Ahvaz mostly from
western and southern neighborhoods. Normal back-
ward trajectories of two dust storms during this study
are presented in Fig. 7. Backward trajectory in March
11, 2011, showed that dust storm was originated from
Saudi Arabia (Fig. 7a). The total run time was 24 h at
different altitude (500, 1,000 and 2,000 m). In Fig. 7b
(September 28, 2010), the backward air mass trajec-
tories of Ahvaz at the same altitudes within three days
as total run time was simulated. As it has been shown,
dust was transferred from North Africa particularly
Egypt and Sudan to Ahvaz. Also a small circle of dust
storm was formed in dried lands of Iraq which was
depicted in red circle in Fig. 7b.
4 Discussions
Particulate matter can transfer biological agent from
outdoor to indoor environments. In present study, the
investigation of airborne bacteria in indoor air envi-
ronments of educational and therapeutic places that
they did not have natural ventilation system and many
people had activities in these places had done.
The concentrations of extracted bacteria in sam-
pling points in normal situation were between 8 and
4,800 cfu/m3 which were higher than other studies
(Salonen et al. 2007; Naddafi et al. 2009). For example
Kim et al. (2009), reported airborne bacteria concen-
trations have ranged from 256 to 716 cfu/m3 in 10
hospitals, 206–408 cfu/m3 in 10 elderly welfare
facilities and 334–1,555 cfu/m3 in 10 childcare cen-
ters. In Korea, Salonen et al. (2007) observed
14–1,550 cfu/m3 as airborne bacteria in mold-dam-
aged building. An average of 696 cfu/m3 was also
recorded by Naddafi et al. (2009) as airborne bacteria
concentration in a children hospital in Tehran.
The most important result of this study was
increasing in concentration of bacteria in indoor
environments during dust event days. The main cause
of this result might be dust storm occurrence during
this study which impressed Ahvaz weather conditions.
There were significant differences in concentra-
tions of bacteria between sampling points during
normal and dust event days (p\ 0.05). The most
levels of microbial load were related to dust storms in
winter. The maximum residence time of dust storm in
this study was 48 h which was related to March. In
time of dust storms, the concentrations of particulate
matter in indoor and outdoor environments have been
increasing. Although these places had natural venti-
lation and they were off in time of dust storms, the
concentrations of bacteria in indoor environment also
have been increasing. Based on other studies, each
Gram of desert soil has been ranging from 0 to 107
colonies of bacteria (Maier et al. 2004), so the mean
concentration of bacteria in time of dust storms in
Saudi Arabia was 1,892 ± 325 cfu/m3 (Kwaasi et al.
1998), but the mean concentrations of bacteria in the
present study for three stations were between 520.6
and 1,047.6 cfu/m3.
According to these results, in present study, the
genera of bacteria which extracted in dust storms
situation were like other studies in other parts of the
world (Kwaasi et al. 1998; Lyles et al. 2005).
Predominant genera of bacteria in dust storms were
Bacillus, Streptomyces, Micrococcus and Staphylo-
coccus. The concentration of Streptomyces spp. in
March (dust event days) was higher than other months;
also the concentration of staphylococcus spp. in
December (during dust event days) was higher than
other months. The concentrations of Bacillus spp. in
all sampling seasons as well as all sampling points
were high. Based on studies which had been conducted
throughout the world, Bacillus (Kwaasi et al. 1998;
Lyles et al. 2005; Prospero et al. 2005; Kellogg et al.
2004) and Microbacterium (Griffin et al. 2007;
Kellogg et al. 2004) were predominant genera. Bacil-
lus genus was observed in long distance from dust
storm origin in comparison with other bacteria. Many
bacteria are destroyed by solar radiation, drought and
shortage of nutrient. The main cause for increasing of
mentioned genera concentration during dust storms in
comparison with other bacteria was their resistance
due to spores (Kellogg and Griffin 2006). Frequency
and types of microbial agent in air are varied, and they
are related to suspended organic and inorganic matter,
temperature, humidity, vegetation, UV incoming,
precipitation, etc.
Totally, concentration of Bacillus, Nocardia, Cory-
nebacterium and Stomatoccoccus in all three sampling
sites were higher in dust event days than normal days
indicating impact of dust storms on increased bacterial
concentration in indoor environment. We also
observed incremental concentration of total and
unknown bacteria during dust storms compared to
normal days. According to studies, many of these
bacteria were extracted from Saudi Arabia and
Aerobiologia (2015) 31:127–141 137
123
Turkey’s dust storms (Kwaasi et al. 1998; Griffin et al.
2007).
There is no doubt that temperature and humidity
play an important role in good indoor air quality.
Moon et al. (2014) reported that concentration of
culturable indoor airborne bacteria was significantly
higher in summer than in winter. Statistically, they
reported a significant association between higher
culturable indoor airborne bacteria with increases in
both relative humidity and temperature. In terms of
temperature or season and its relation to bacteria
concentration, our findings did not comply with
results of other researcher and scientists around the
world. We found that concentration of bacteria were
higher in autumn and winter than in summer. It was
supposed that the fluctuation of bacteria concentra-
tion and its relationships with humidity and temper-
ature in the present study should be similar to other
investigations. Apparently, dust was a confounding
agent, in which the balance of indoor air quality was
disrupted especially during two peaks in winter time
(Fig. 5), so that a high load of bacterial population
was injected into the indoor by such peaks. There was
another peak in autumn (Fig. 5) and that was why
bacteria concentration in autumn was higher than
summer. In some studies (Jo and Seo 2005; Chan
et al. 2009), the concentration of bacteria were higher
in summer and autumn compared to the other
seasons. It should be noted that elevated relative
humidity particularly in winter can promote the
growth of mold, bacteria as well as fungi. Moon et al.
(2014) also found a correlation between total and
Gram-positive bacteria concentration with indoor
humidity. In present study, predominant extracted
bacteria in both normal and dust event days were
Gram positive. Based on a study which had been done
in Iran (Massoum et al. 1998) and also around the
world (Chan et al. 2009; Jo and Seo 2005; Hwang
et al. 2010), the concentrations of Gram-positive
bacteria were more than Gram-negative bacteria. Air
dryness is a cause of bacteria death. Bacterial active-
growing cells are sensitive to dryness and are dying
soon. Gram-negative bacteria are much more sensi-
tive than Gram-positive bacteria. Meantime Gram-
positive bacteria have thick peptidoglycan large cell
wall so that they are resistant to dryness or undesir-
able situation, and this is why their concentration is
high in extracted bacteria from air (Kellogg and
Griffin 2006; Chan et al. 2009).
Bioaerosols such as viruses, bacteria, fungi and
pollen can be pathogenic for human, animals and
plants (Schlesinger et al. 2006). Inhalable bioaerosols
with diameter equal or less than 10 lm can have
adverse effects on human health. With respect to the
results of this study, different genera of bacteria which
were extracted from air can have undesirable effects
on human health. The concentrations of Bacillus spp.
and Streptomyces spp. in time of dust storms were so
high. Bear in mind that in dominant infections caused
by different genuses of bacteria, the path that they
enter the body is through respiratory ways (Leger et al.
2009; Mehta et al. 2011; Mcneil and Brown 1994).
Therefore, hospital admissions for respiratory and
cardiovascular diseases attributed to particles were
increased during dust storm (Tam et al. 2012a, b).
Other extracted bacteria genera were Micrococcus,
Stomatoccus, Corynebacterium, Arthobacter, Staphy-
lococcus, Nocardia, Gram-positive cocci and Stoma-
toccus which may cause infection in patients with
immune deficiencies and patients with bronchiectasis
(Yuan et al. 2013).
Although Actinomycetes in normal situation hardly
cause disorders in human and animals, Streptomyces
and different species of Nocardia can cause large
types of diseases such as pulmonary, eye, skin and
wound infections. They may cause some fatal infec-
tious diseases such as acute pulmonary infections,
septicemia and brain abscess in patients suffering from
HIV and cancers (Hua et al. 2007; Leger et al. 2009;
Mcneil and Brown 1994). By increasing in prevalence
of immune system deficiencies in human societies, the
role of these bacteria becomes so important (Yildis
and Doganay 2006; Brust et al. 2004; Verma et al.
2006). Actinomycetes have large variety which
extracted are from east of Asia and in some cases
from South Korea (Hua et al. 2007).
In HYSPLIT model, the dispersion of dust storms
with a specified source may be calculated by consid-
ering either puff or particle dispersion. In the puff
module, dust plume extend in three directions (x–y–z),
in which the standard deviation for x and y directions is
the same, while the behavior of plume in z direction is
absolutely different from downwind and crosswind of
puff. In the particle module of HYSPLIT, that is very
convenient to simulate dust storm dispersion into the
atmosphere, a certain number of particulates are
advected about the model domain by the mean wind
field and spread by a turbulent component. In the
138 Aerobiologia (2015) 31:127–141
123
present study, based on westerly wind (Fig. 1), we
used particle dispersion in a three-dimensional partic-
ulate distribution (horizontal and vertical). Trajecto-
ries of model in Fig. 7 showed that dust storms are
originated mostly from Africa and southwestern
neighborhoods of Iran where Khuzestan province is
located. Longer run time of model revealed north of
Africa as the substantial source of dust storm due to
massive area of desert.
5 Conclusions
Present study showed that the concentrations of
bioaerosols particles and soil-originated bacteria in
indoor environments of educational centers particu-
larly school and university increased during dust
storms, although these places were off in time of this
phenomenon. Clearly, outdoor air has an impact on
indoor air quality. We can therefore conclude that
during dust storm occurrence, bacteria concentration
in indoor air was higher than normal days. Individual
activities and age of buildings can be added to
parameters which had impact on the concentration of
bacteria in these places. Our study showed that
culturable airborne bacteria concentrations in 58 %
of samples were higher than the standard (500 cfu/
m3). It means that indoor air quality in view of bacteria
was not acceptable so that preventive measures such as
artificial ventilation and indoor air cleaners particu-
larly for hospital were recommended.
The HYSPLIT model showed that there were
different locations as origin of dust during dust event
days. According to this model, dust can be mounted
from Africa, dried lands in Iraq as well as Saudi Arabia
desert. It can be transferred from Iraq, Saudi Arabia,
Syria, Turkey and Jordan and rarely from high
latitudes. Therefore, population of airborne bacteria
and its diversity can be changed from time to time.
Acknowledgments This paper is issued from an integrated
research of ETRC-9102 as a project number and M.Sc. thesis of
Zahra Soleimani. Financial support of both was provided by
Ahvaz Jundishapur University of Medical Sciences (AJUMS).
References
Abt, E., Suh, H. H., Catalano, P., & Koutrakis, P. (2000). Rel-
ative contribution of outdoor and indoor particle sources to
indoor concentrations. Environmental Science and Tech-
nology, 34, 3579–3587.
ACGIH. (1989), Guidelines for the assessment of bioaerosols in
the indoor environment. American Conference of Gov-
ernmental Industrial Hygienists Bioaerosol Committee.
Cincinnati; Contract No: Document Number.
Adhikari, A., Sen, M. M., Gupta-bhatta, S., & Chand, S. (2004).
Volumetric assessment of airborne fungi in two sections of
rural indoor dairy cattle shed. Environment International,
29, 1071–1078.
Andersen, A. A. (1958). New sampler for the collection, sizing,
and enumeration of viable airborne particles. Journal of
Bacteriology, 76(5), 471–484.
Augustowska, M., & Dutkiewicz, J. (2006). Variability of air-
borne microflora in a hospital ward within a period of one
year. Annals of Agricultural and Environmental Medicine,
13, 99–106.
Brust, J. C., Whittier, S., Scully, B. E., McGregor, C. C., & Yin,
M. T. (2004). Five cases of bacteraemia due to Gordonia
species. Journal of medical microbiology, 58, 1376–1378.
Chan, P. L., Yu, P. H. F., Cheng, Y. W., Chan, C. Y., & Wong, P.
K. (2009). Comprehensive characterization of indoor air-
borne bacterial profile. Journal of Environmental Sciences,
21, 1148–1152.
Christina, A., Kellogg, C. A., & Griffin, D. W. (2006). Aero-
biology and the global transport of desert dust. Trends in
Ecology and Evolution, 21(11), 638–644.
Dehdari Rad, H., Babaei, A., Goudarzi, G., Ahmadi-Angali, K.,
Ramezani, Z., & Mirmohammadi, M. (2014). Levels and
sources of BTEX in ambient air of Ahvaz metropolitan
city. Air Quality, Atmosphere and Health journal,. doi:10.
1007/s11869-014-0254-y.
Derakhshandeh, M., Rostami, M. H., Goudarzi, G., & Rostami,
M. Z. (2014). Evaluation of tendency to migration in the
case of Ahvaz dust storm occurrence: A public survey.
Advances in Civil and Environmental Engineering, 02(1),
55–69.
Fang, Z., Ouyaang, Z., Zheng, H., Wang, X., & Hu, L. (2007).
Culturable airborne bacteria in outdoor environments in
Beijing, China. Microbial Ecology, 54, 487–496.
Fang, Z., Ouyang, Z., Hu, L., Wang, X., Zheng, H., & Lin, X.
(2005). Culturable airborne fungi in outdoor environments
in Beijing, China. Science of the Total Environment, 350,
47–58.
Goudarzi, G., Mohammadi, M. J., Ahmadi-Angali, K., Neissi,
A., Babaei, A., Mohammadi, B., et al. (2012). Estimation
of health effects attributed to NO2 exposure using AirQ
model. Archives of Hygiene Sciences, 1(2), 59–66.
Goudarzi, G., Shirmardi, M., Khodarahmi, F., Hashemi-Sha-
kraki, A., Alavi, N., Ahmadi-Ankali, K., et al. (2014).
Particulate matter and bacteria characteristics of the Mid-
dle East dust (MED) storms over Ahvaz, Iran. Aerobiolo-
gia. DOI 10.1007/s10453-014-9333-7.
Goudarzi, G., Zallaghi, E., Neissi, A., Ankali, K. A., Saki, A.,
Babaei, A. A., et al. (2013). Cardiopulmonary mortalities
and chronic obstructive pulmonary disease attributed to
ozone air pollution. Archives of Hygiene sciences, 2(2),
62–72.
Griffin, D. W. (2007). Atmospheric movement of microorgan-
isms in clouds of desert dust and implications for human
health. Clinical Microbiology reviews, 20, 459–477.
Aerobiologia (2015) 31:127–141 139
123
Griffin, D. W., Kubilay, N., Kocak, M., Gray, M. A., Borden, T.
C., Kellogg, C. A., et al. (2007). Airborne desert dust and
aero microbiology over the Turkish Mediterranean coast-
line. Atmospheric Environment, 41, 4050–4062.
Griffin, D. W., Westphal, D. L., & Gray, M. A. (2006). Airborne
microorganisms in the African desert dust corridor over the
mid-Atlantic ridge, Ocean Drilling Program, leg 209.
Aerobiologia, 22, 211–226.
Heidari-Farsani, M., Shirmardi, M., Goudarzi, G., Alavi-
Bakhtiarvand, N., Ahmadi-Ankali, K., Zallaghi, E., et al.
(2014). The evaluation of heavy metals concentration
related to PM10 in ambient air of Ahvaz city, Iran. Journal
of Advances in Environmental Health Research, 1(2),
120–128.
Ho, H. M., Rao, C. Y., Hsu, H. H., Chiu, Y. H., Liu, C. M., &
Chao, H. J. (2005). Characteristics and determinants of
ambient fungal spores in Hualien, Taiwan. Atmospheric
Environment, 39, 5839–5850.
Hua, N. P., Kobayashi, F., Iwasaka, Y., Shi, G. Y., & Naganuma,
T. (2007). Detailed identification of desert-originated
bacteria carried by Asian dust storms to Japan. Aerobio-
logia, 23, 291–298.
Hwang, S. H., Yoon, C. S., Ryu, K. N., Paik, S. Y., & Cho, J. H.
(2010). Assessment of airborne environmental bacteria and
related factors in 25 underground railway stations in Seoul,
Korea. Atmospheric Environment, 44, 1658–1662.
Jo, W.-K., & Seo, Y.-J. (2005). Indoor and outdoor bioaerosol
levels at recreation facilities, elementary schools, and
homes. Chemosphere, 61, 1570–1579.
Kellogg, C. A., & Griffin, D. W. (2006). Aerobiology and the
global transport of desert dust-Review. Trends in Ecology
and Evolution, 21, 638–644.
Kellogg, C. A., Griffin, D. W., Garrison, V. H., Peak, K. K.,
Royall, N., Smith, R. R., et al. (2004). Characterization of
aerosolized bacteria and fungi from desert dust events in
Mali, West Africa. Aerobiologia, 20, 99–110.
Kim, K.-Y., Kim, H.-T., Kim, D., Nakajima, J., & Higuchi, T.
(2009). Distribution characteristics of airborne bacteria and
fungi in the feedstuff-manufacturing factories. Journal of
Hazardous Materials, 169, 1054–1060.
Kwaasi, A. A., Parhar, R. S., Al-Mohanna, F. A., Harfi, H. A.,
Collison, K. S., & Al-Sedairy, S. T. (1998). Aeroallergens
and viable microbes in sand storm dust. Potential triggers
of allergic and nonallergic respiratory ailments. Allergy,
53, 255–265.
Leger, J. S., Begeman, L., Fleetwood, M., Frasca, J. R. S.,
Garner, M. M., Lair, S., et al. (2009). Comparative
pathology of nocardiosis in marine mammals. Veterinary
Pathology, 46(2), 299–308.
Lyles, M. B., Fredrickson, H. L., Bednar, A. J., Fannin, H. B., &
Sobecki, T. M. (2005). The chemical, biological, and
mechanical characterization of airborne micro-particulates
from Kuwait. Abstr. 8th Ann. Force Health Protect. Conf.,
session 2586, Louisville, KY.
Maier, R. M., Drees, K. P., Neilson, J. W., Henderson, D. A.,
Quade, J., & Betancourt, J. L. (2004). Microbial life in the
Atacama Desert. Science, 306, 1289–1290.
Massoum, Beigi H., Ghiaseddin, M., Shariat, M., & Mirzaei, S.
A. (1998). Survey of the aerobic flora in the air central
district of Tehran. KowsarMedical Journal, 2(3), 104–197.
[In Persian].
Mcneil, M. M., & Brown, J. M. (1994). The medically important
aerobic actinomycetes: epidemiology and microbiology.
Clinical Microbiology Reviews, 7(3), 357–417.
Mehta, Y. B., Goswami, R., Bhanot, N., Mehta, Z., & Simonelli,
P. (2011). Tsukamurella infection: a rare cause of com-
munity-acquired pneumonia. The American journal of the
medical sciences, 341(6), 500–503.
Mendell, M. J., & Heath, G. A. (2005). Do indoor pollutants and
thermalconditions in schools influence student perfor-
mance? A critical review of the literature. Indoor Air, 15,
27–52.
Moon, K. W., Huh, E. H., & Jeong, H. C. (2014). Seasonal
evaluation of bioaerosols from indoor air of residential
apartments within the metropolitan area in South Korea.
Environmental Monitoring and Assessment, 186(4),
2111–2120.Naddafi, K., Rezaei, S., Nabizadeh, R., Yonesian, M., & Jabbari,
H. (2009). Density of airborne bacteria in a children’s
hospital in Tehran. Iranian Journal of Health and Envi-
ronment, 1(2), 75–80. In Persian.
National Environmental Agency, Institute of Environmental
Epidemiology, Ministry of the Environment. (1996).
Guidelines for good indoor air quality in office premises.
First edition, pp 44.http://www.bca.gov.sg/greenmark/
others/NEA_Office_IAQ_Guidelines.pdf (NEA).
Oberdorster, G., Ferin, J., Gelein, R., & Weiss, B. (1995).
Association of particulateair pollution and acute mortality:
involvement of ultrafine particles. Inhalation Toxicology,
7, 11–24.
Pastuszka, J. S., Kyaw Tha Paw, U., Lis, D. O., Wlazło, A., &
Ulfig, K. (2000). Bacterial and fungal aerosol in indoor
environment in Upper Silesia, Poland. Atmospheric Envi-
ronment, 34, 3833–3842.
Pope, C. A., Dockery, D. W., & Schwartz, J. (1995). Review of
epidemiological evidence of health effects of particulate air
pollution. Inhalation Toxicology, 7(1), 1–18.
Prospero, J. M., Blades, E., Mathison, G., & Naidu, R. (2005).
Interhemispheric transport of viable fungi and bacteria
from Africa to the Caribbean with soil dust. Aerobiologia,
21, 1–19.
Salonen, H., Lappalainen, S., Lindroos, O., Harju, R., & Reijula,
K. (2007). Fungi and bacteria in mould-damaged and non-
damaged office environments in a subarctic climate.
Atmospheric Environment, 41, 6797–6807.
Schlesinger, P., Mamane, Y., & Grishkan, I. (2006). Transport
of microorganisms to Israel during Saharan dust events.
Aerobiologia, 22(4), 259–273.
Shahsavani, A., Naddafi, K., Haghighifard, N. J., Mesdaghinia,
A., Yunesian, M., Nabizadeh, R., et al. (2012a). Charac-
terization of ionic composition of TSP and PM10 during
the Middle Eastern dust (MED) storms in Ahvaz, Iran.
Environmental monitoring and assessment, 184(11),
6683–6692.
Shahsavani, A., Naddafi, K., Jafarzade Haghighifard, N., Mes-
daghinia, A., Yunesian, M., Nabizadeh, R., et al. (2012b).
The evaluation of PM10, PM2.5 and PM1 concentrations
during the Middle Eastern Dust (MED) events in Ahvaz,
Iran from April through September 2010. Journal of Arid
Environments, 77, 72–83.
Soleimani, Z., Goudarzi, G., Naddafi, K., Sadeghinejad, B.,
Latifi, S. M., Parhizgari, N., et al. (2013). Determination of
140 Aerobiologia (2015) 31:127–141
123
culturable indoor airborne fungi during normal and dust
event days in Ahvaz, Iran. Aerobiologia, 29, 279–290.
Tam, W. W., Wong, T. W., & Wong, A. H. (2012a). Effect of
dust storm events on daily emergency admissions for car-
diovascular diseases. Circulation Journal, 76(3), 655–660.
Tam, W. W., Wong, T. W., Wong, A. H., & Hui, D. S. (2012b).
Effect of dust storm events on daily emergency admissions
for respiratory diseases. Respirology, 17(1), 143–148.
Tippayawong, N., Khuntong, P., Nitatwichit, C., Khunatorn, Y.,
& Tantakitti, C. (2009). Indoor/outdoor relationships of
size-resolved particle concentrations in naturally ventilated
school environments. Building and Environment, 44,
188–197.
Verma, P., Brown, J. M., Nunez, V. H., Morey, R. E., Stei-
gerwalt, A. G., & Pellegrini, H. A. (2006). Native valve
endocarditis due to Gordonia polyisoprenivorans:case
report and review of literature of bloodstream infection
caused by Gordonia species. Journal of clinical microbi-
ology, 44(5), 1905–1908.
Yildis, O., & Doganay, M. (2006). Actinomycoses and nocardia
pulmonary infections. Current opinion in pulmonary
medicine, 12(3), 224–234.
Yuan, Z., Panchal, D., Syed, M. A., Mehta, H., Joo, M., Hadid,
W., et al. (2013). Induction of cyclooxygenase signaling by
Stomatococcus mucilaginosus highlights the pathogenic
potential of an oral commensal. The Journal of Immunol-
ogy, 191(7), 3810–3817.
Aerobiologia (2015) 31:127–141 141
123