Embed Size (px)
Citation preview

Normal Cryogenic Fluid Behavior (emphasis on helium, but not superfluid,
which will be covered later)
Tom Peterson, SLAC
January 2017
Outline
• Cooling modes for superconducting devices
• Forced flow cooling
• Two-phase flow and pool boiling
• Fluid dynamics
• Saturated bath thermodynamics
January, 2017
USPAS
Cryogenic Fluids
Tom Peterson
2
Large-scale cooling of
superconducting devices
• Physicists and engineers designing a large-scale liquid helium system typically must design the cooled components (magnets or RF cavities, their containers, and the interfaces to them)
• Cooling mode, heat transfer, pressure drops, cool-down, warm-up and non-steady or upset system operations all must be considered as part of the component design
• The cooled devices must be viewed as part of the cryogenic system
January, 2017
USPAS
Cryogenic Fluids
Tom Peterson
3

Cooling modes in large-scale cryogenic
systems recently in operation • Pool boiling helium I used in superconducting RF for HERA (DESY),
LEP (CERN), KEKB (KEK, Japan), CESR (Cornell)
• Forced flow of subcooled or supercritical helium I for cooling superconducting magnets (Tevatron, HERA, SSC, RHIC, ITER)
• Stagnant, pressurized helium II (the Tore Supra tokamak in France demonstrated the technology, LHC magnets)
• Saturated helium II (CEBAF, TTF at DESY, SNS at Oak Ridge, and others, foreseen for FRIB, Project X, ILC, and more)
• This list also illustrates the extent to which superconductivity and cryogenics have become standard technology for accelerators
January, 2017
USPAS
Cryogenic Fluids
Tom Peterson
4
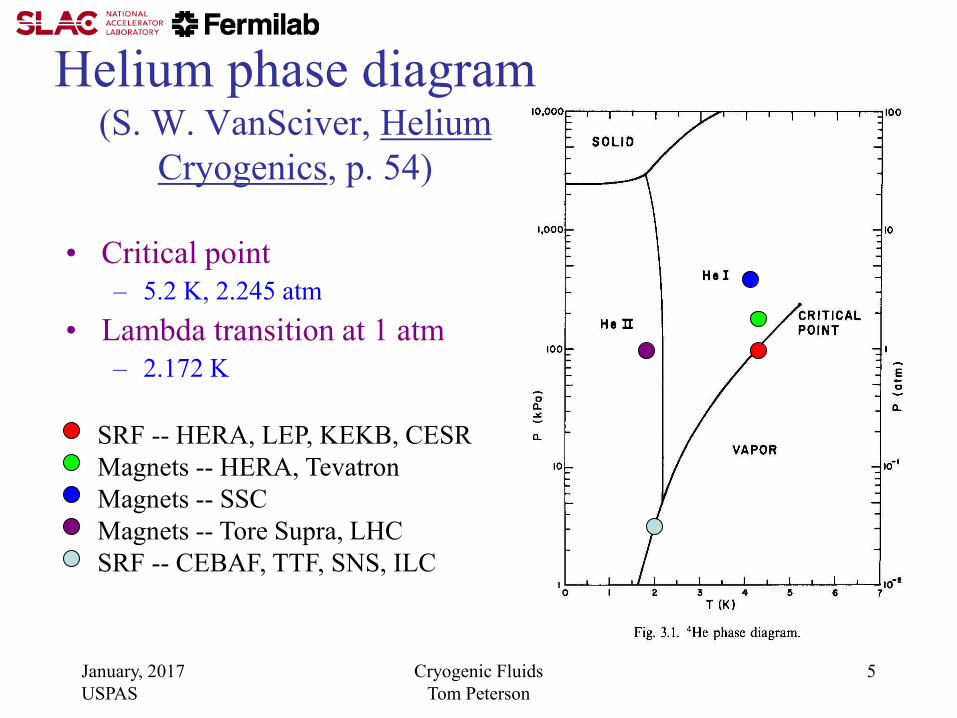
Helium phase diagram (S. W. VanSciver, Helium
Cryogenics, p. 54)
• Critical point
– 5.2 K, 2.245 atm
• Lambda transition at 1 atm
– 2.172 K
January, 2017
USPAS
Cryogenic Fluids
Tom Peterson
5
SRF -- HERA, LEP, KEKB, CESR
Magnets -- HERA, Tevatron
Magnets -- SSC
Magnets -- Tore Supra, LHC
SRF -- CEBAF, TTF, SNS, ILC

Cooling modes -- magnets vs RF
• Accelerator magnets are often cooled with subcooled liquid
– Typically working near the limit of the superconductor with large stored energy
– Ensure complete liquid coverage and penetration
• Superconducting RF cavities are generally cooled with a saturated bath
– Large surface heat transfer in pool boiling for local “hot spots”
– Very stable pressures, avoid impact of pressure variation on cavity tune
January, 2017
USPAS
Cryogenic Fluids
Tom Peterson
6

Cooling modes--surface heat flux
• Boiling helium I (normal helium)
– 1 W/cm2 in nucleate boiling with 0.5 K temperature rise
to the object surface so equivalent to 2 W/cm2K
• Forced convection helium I
– Convection coefficients on the order of 0.1 W/cm2K
• Saturated helium II (superfluid helium, SF)
– 1 W/cm2 heat transport to the surface without bubbles
• Pressurized helium II
– Kapitza conductance about 0.6 W/cm2K
January, 2017
USPAS
Cryogenic Fluids
Tom Peterson
7

Pressurized versus pool boiling
• Pressurized helium (normal or superfluid) gives maximum penetration of helium mass in magnet coils, which may be a factor in stability if not also heat transfer. But heat flow results in a temperature rise.
• Pool boiling gives pressure stability (important for superconducting RF), provides maximum local heat transfer, and provides nearly isothermal cooling.
January, 2017
USPAS
Cryogenic Fluids
Tom Peterson
8

Heat transport through channels--
pressurized normal helium in SSC
• SSC dipole nominal operating temperature was to
be 4.35 K, tightly constrained for magnet quench
performance
• Allowable temperature rise of only 0.050 K
allowed heat absorption of about 4 J/gK x 0.050 K
= 0.20 J/g and forced high flow rate (100 g/s) as
well as use of recoolers
• Forced flow of supercritical helium periodically
recooled by heat exchange with a saturated bath
January, 2017
USPAS
Cryogenic Fluids
Tom Peterson
9

Recooler flow scheme
January, 2017
USPAS
Cryogenic Fluids
Tom Peterson
10
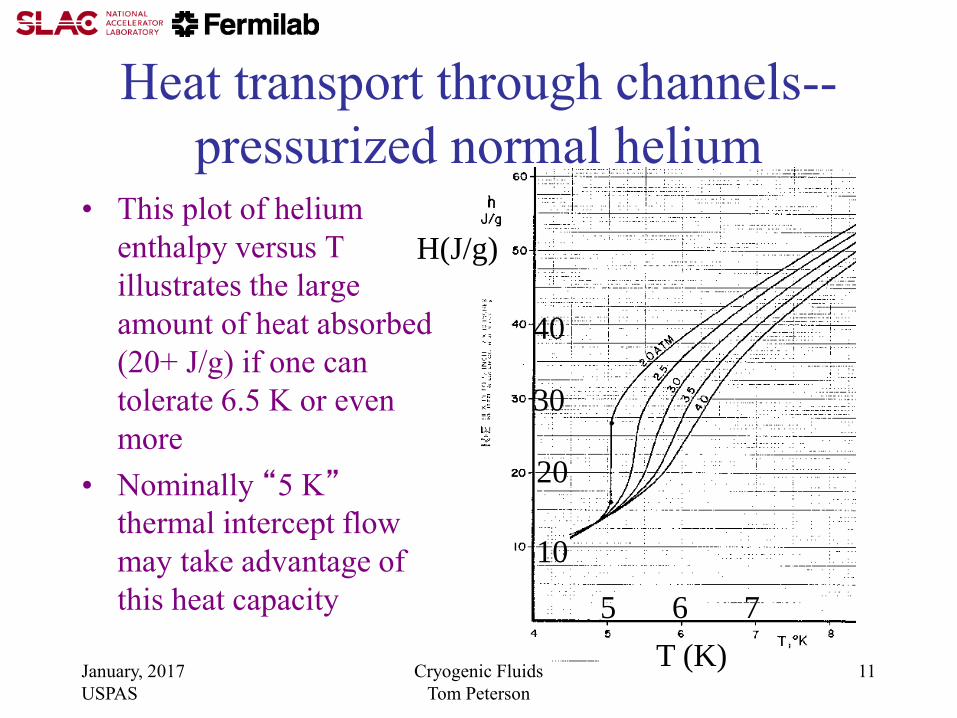
Heat transport through channels--
pressurized normal helium • This plot of helium
enthalpy versus T
illustrates the large
amount of heat absorbed
(20+ J/g) if one can
tolerate 6.5 K or even
more
• Nominally “5 K”
thermal intercept flow
may take advantage of
this heat capacity
January, 2017
USPAS
Cryogenic Fluids
Tom Peterson
11
5 6 7
T (K)
H(J/g)
40
20
30
10
Convective heat transfer
• Convective heat transfer – heat transfer
from a solid surface into a moving fluid
– A complex sequence of heat transfer from the
surface to a boundary layer and into the bulk
fluid, a combination of conduction and mass
transport
• We analyze convection with the equation
January, 2017
USPAS
Cryogenic Fluids
Tom Peterson
12
Evaluating hc
• This equation defines the convection coefficient,
hc
• Empirical and semi-empirical methods are used to
find approximate hc
• Formulations for liquids and gases work
reasonably well for normal helium
• Several dimensionless parameters are commonly
used
January, 2017
USPAS
Cryogenic Fluids
Tom Peterson
13
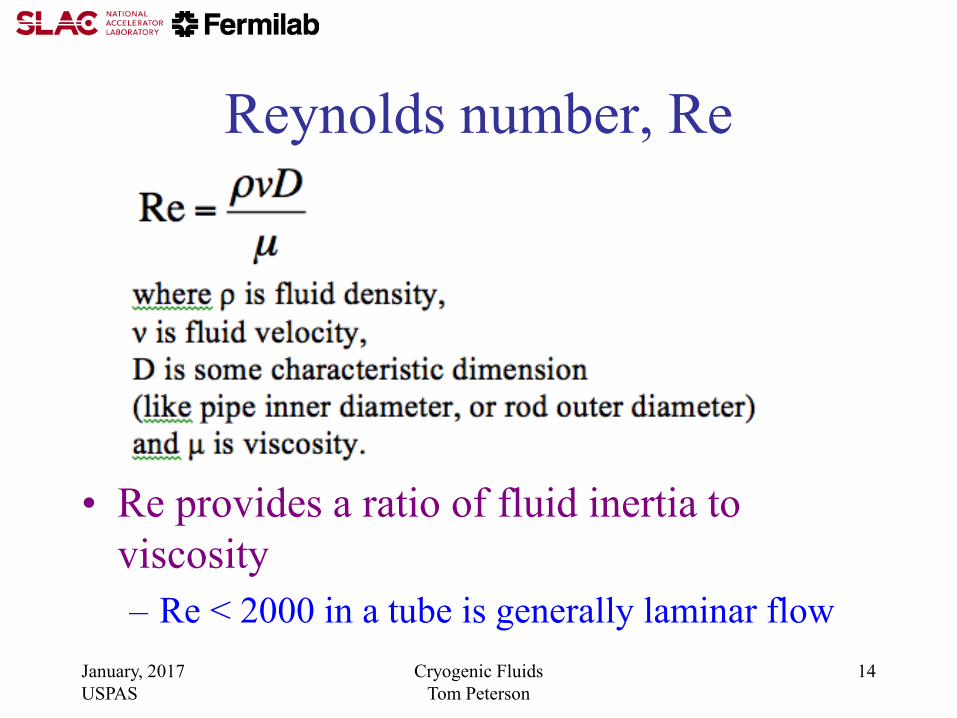
Reynolds number, Re
• Re provides a ratio of fluid inertia to
viscosity
– Re < 2000 in a tube is generally laminar flow
January, 2017
USPAS
Cryogenic Fluids
Tom Peterson
14
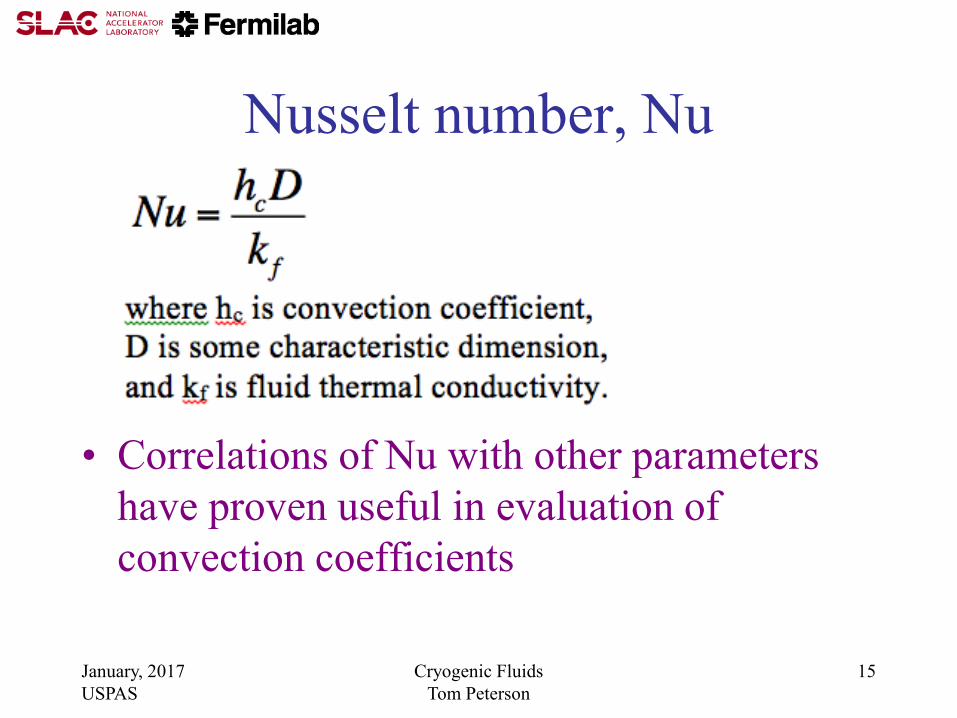
Nusselt number, Nu
• Correlations of Nu with other parameters
have proven useful in evaluation of
convection coefficients
January, 2017
USPAS
Cryogenic Fluids
Tom Peterson
15
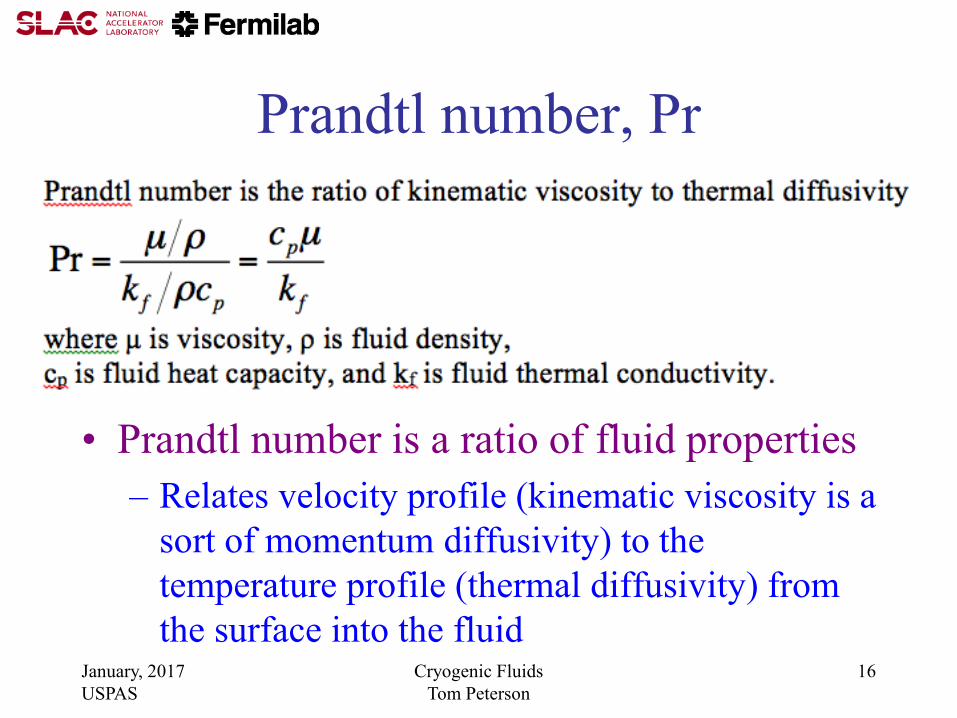
Prandtl number, Pr
• Prandtl number is a ratio of fluid properties
– Relates velocity profile (kinematic viscosity is a
sort of momentum diffusivity) to the
temperature profile (thermal diffusivity) from
the surface into the fluid January, 2017
USPAS
Cryogenic Fluids
Tom Peterson
16
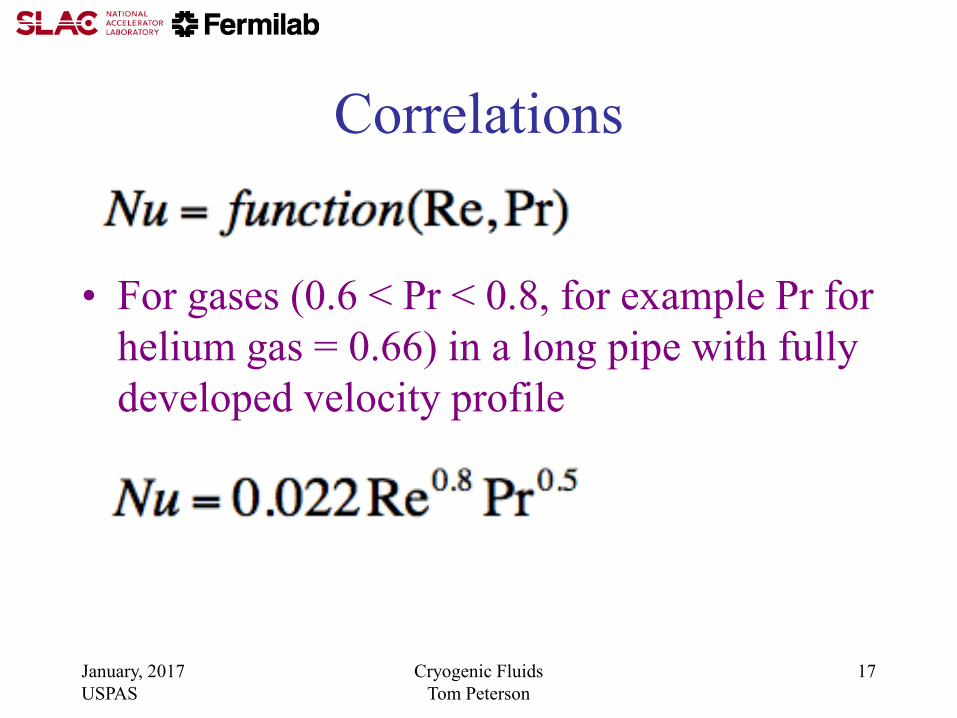
Correlations
• For gases (0.6 < Pr < 0.8, for example Pr for
helium gas = 0.66) in a long pipe with fully
developed velocity profile
January, 2017
USPAS
Cryogenic Fluids
Tom Peterson
17
Convection summary
• Far too large a topic to cover here
• Many correlations, depending on whether
free convection, laminar, or turbulent, fluid
properties, etc.
• Entrance effects, surface and boundary
layer effects
• Nevertheless, the classical correlations
generally work well for normal helium
January, 2017
USPAS
Cryogenic Fluids
Tom Peterson
18
More about 2-phase helium flow • “Baker plot” published in 1954 based on data for air and
water and applied to oil and gas in pipes
• In 1960 - 1961, work at Los Alamos suggested the diagram could be applied to 2-phase hydrogen
• Papers published in 1985 and 1987 at the CEC described experimental results showing that the Baker plot does not
apply to 2-phase helium flow
• For practical pressure drops and flow velocities with normal helium, one may assume that 2-phase helium flow is separated
• CEA Grenoble studies of 1.9 K 2-phase flow for CERN found that a vapor flow of about 5 m/sec begins to entrain liquid droplets
January, 2017
USPAS
Cryogenic Fluids
Tom Peterson
19
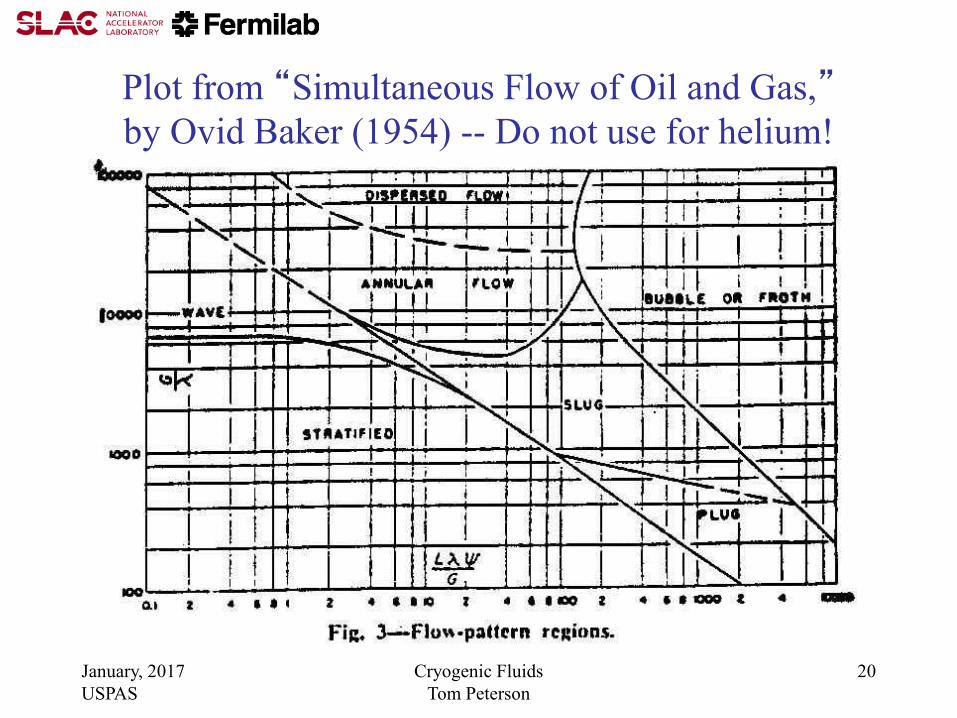
Plot from “Simultaneous Flow of Oil and Gas,”
by Ovid Baker (1954) -- Do not use for helium!
January, 2017
USPAS
Cryogenic Fluids
Tom Peterson
20
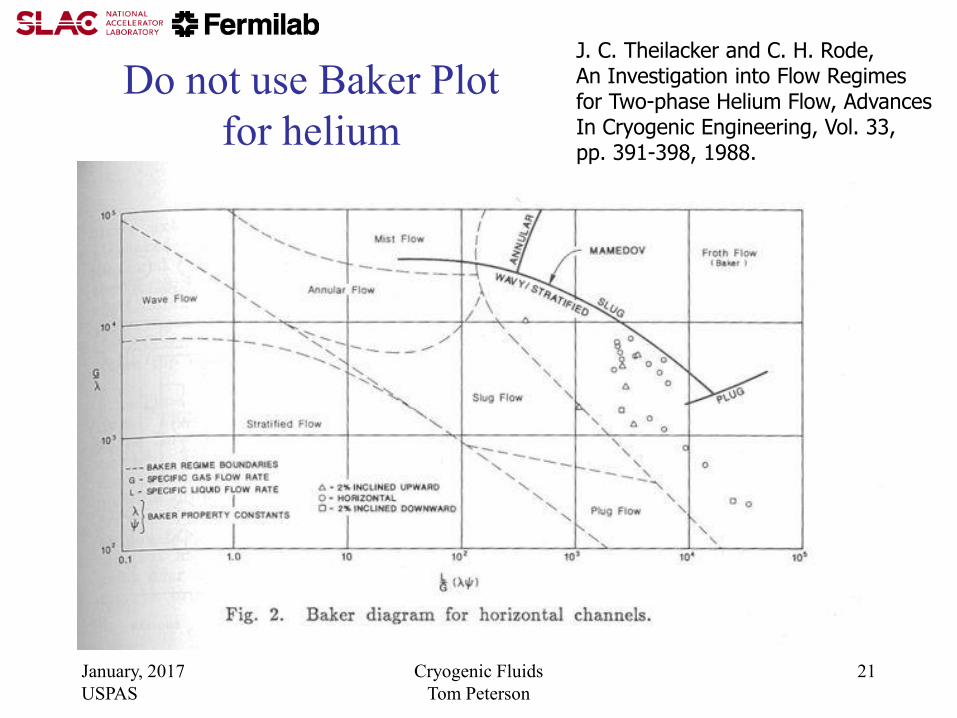
Do not use Baker Plot
for helium
January, 2017
USPAS
Cryogenic Fluids
Tom Peterson
21
J. C. Theilacker and C. H. Rode, An Investigation into Flow Regimes for Two-phase Helium Flow, Advances In Cryogenic Engineering, Vol. 33, pp. 391-398, 1988.

Pool boiling and 2-phase flow
• Considerations for pool boiling systems
– Control of liquid levels, long time constants,
inventory management
– Forced convection for warm-up and cool-down
• Two-phase flow
– Liquid and vapor phases separate with any
acceptably low pressure drop
– Baker Plot does not apply!
January, 2017
USPAS
Cryogenic Fluids
Tom Peterson
22

January, 2017
USPAS
Cryogenic Fluids
Tom Peterson
23
Boiling Heat Transfer for Oxygen, Nitrogen, Hydrogen, and Helium, by E.G. Brentari, et al, NBS Technical Note 317, Boulder, CO, 1965.

Helium boiling curves
• Note the transition from nucleate to film
boiling at about 1 K delta-T
• Working delta-T for nucleate boiling such
as in a helium subcooler (pressurized
helium cooled by boiling helium) is ~0.1 K.
January, 2017
USPAS
Cryogenic Fluids
Tom Peterson
24

January, 2017
USPAS
Cryogenic Fluids
Tom Peterson
25
More boiling curves
Boiling Heat Transfer for Oxygen, Nitrogen, Hydrogen, and Helium, by E.G. Brentari, et al, NBS Technical Note 317, Boulder, CO, 1965.
Some simple analytic formulas
for fluid flow • In designing cryogenic piping, we generally have
low pressure drop and may assume steady-state
conditions for normal operational conditions
– Emergency venting may be very dynamic, non-steady,
but we often do conservative analyses assuming worst-
case as if a steady-state condition
• Cryogenic liquids and vapors (except for Helium
II) behave like normal liquids and gases
• Standard engineering pressure drop and heat
transport equations may be used
January, 2017
USPAS
Cryogenic Fluids
Tom Peterson
26
January, 2017
USPAS
Cryogenic Fluids
Tom Peterson
27
January, 2017
USPAS
Cryogenic Fluids
Tom Peterson
28

January, 2017
USPAS
Cryogenic Fluids
Tom Peterson
29
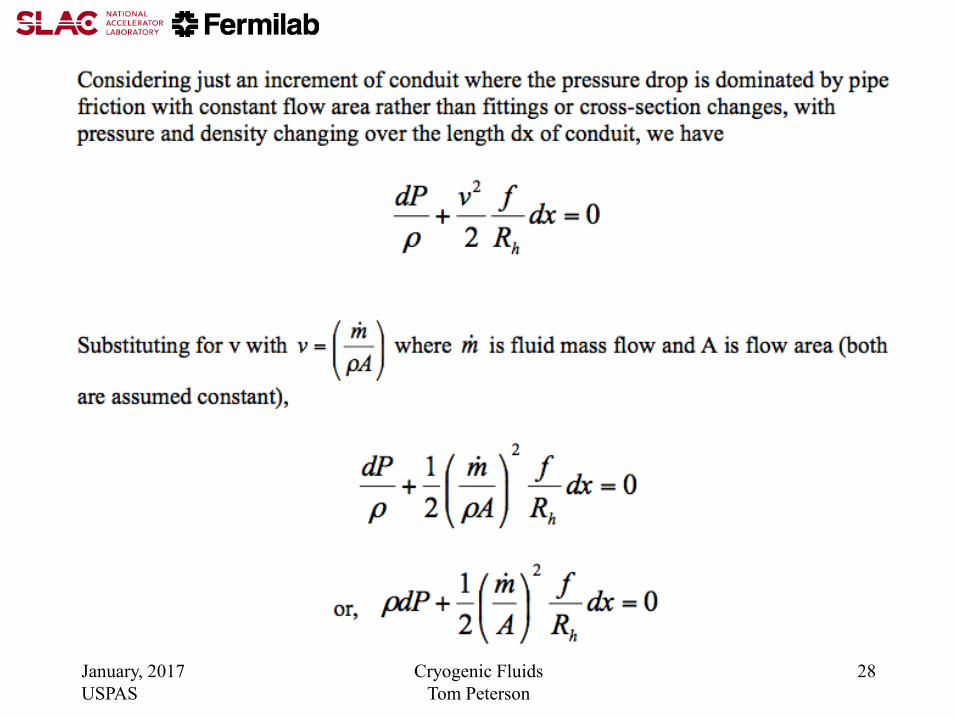
The point of this little derivation is to show that for sections of pipe with large enough pressure drop that density and velocity changes are significant, iterating pressure drop calculations to come up with a linear average density through the section of constant cross section gives a good estimate of pressure drop.

Pressure drop analysis,
working formula for round pipes
This is a form of the D'Arcy-Weisbach formula. With pressure drop
expressed as head loss, this is sometimes called simply the Darcy formula. (Note that delta-P changed signs here, to a positive number.)
January, 2017
USPAS
Cryogenic Fluids
Tom Peterson
30
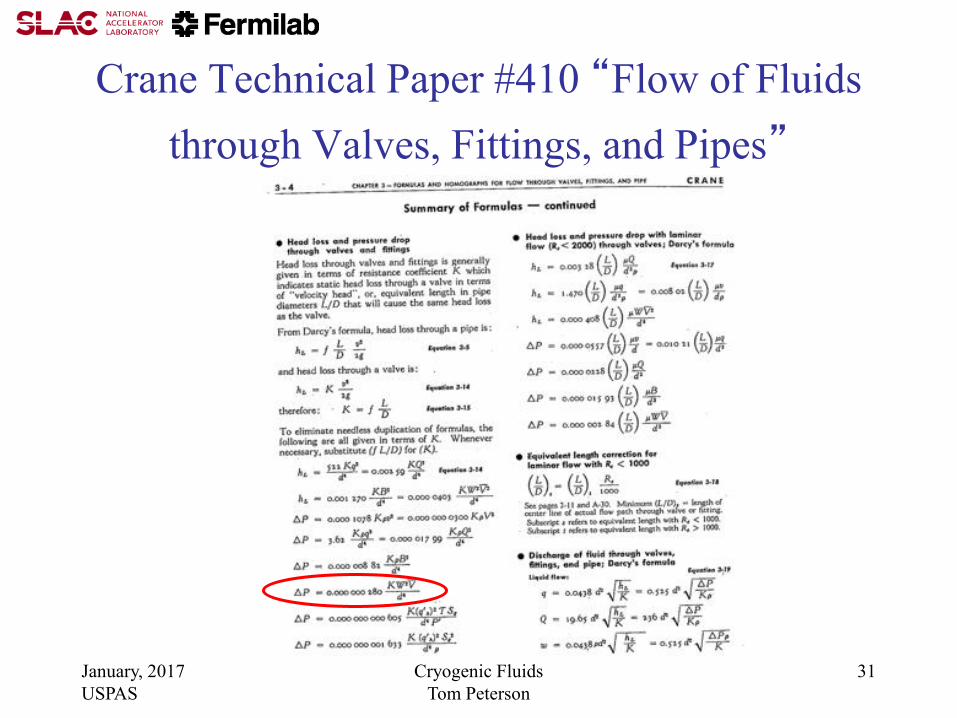
Crane Technical Paper #410 “Flow of Fluids
through Valves, Fittings, and Pipes”
January, 2017
USPAS
Cryogenic Fluids
Tom Peterson
31
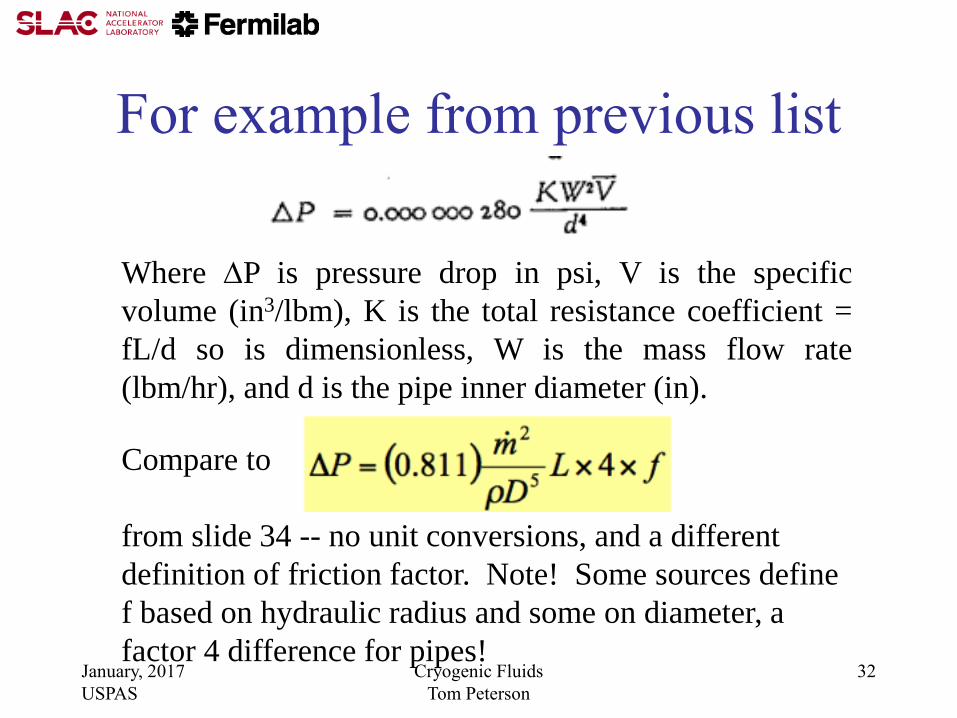
For example from previous list
January, 2017
USPAS
Cryogenic Fluids
Tom Peterson
32
Where P is pressure drop in psi, V is the specific
volume (in3/lbm), K is the total resistance coefficient =
fL/d so is dimensionless, W is the mass flow rate
(lbm/hr), and d is the pipe inner diameter (in).
Compare to
from slide 34 -- no unit conversions, and a different
definition of friction factor. Note! Some sources define
f based on hydraulic radius and some on diameter, a
factor 4 difference for pipes!
Example pressure drop analyses
• See Excel file C5_39_relief_calcs-TJP.xls
– Illustrates relief venting calculation with
stepwise reassessment of Re, friction factor,
and fittings losses for constant mass flow
• See Excel file
PressureDropLongPipeDec2008.xls
– Pipe divided into sections for reassessment of
properties
January, 2017
USPAS
Cryogenic Fluids
Tom Peterson
33
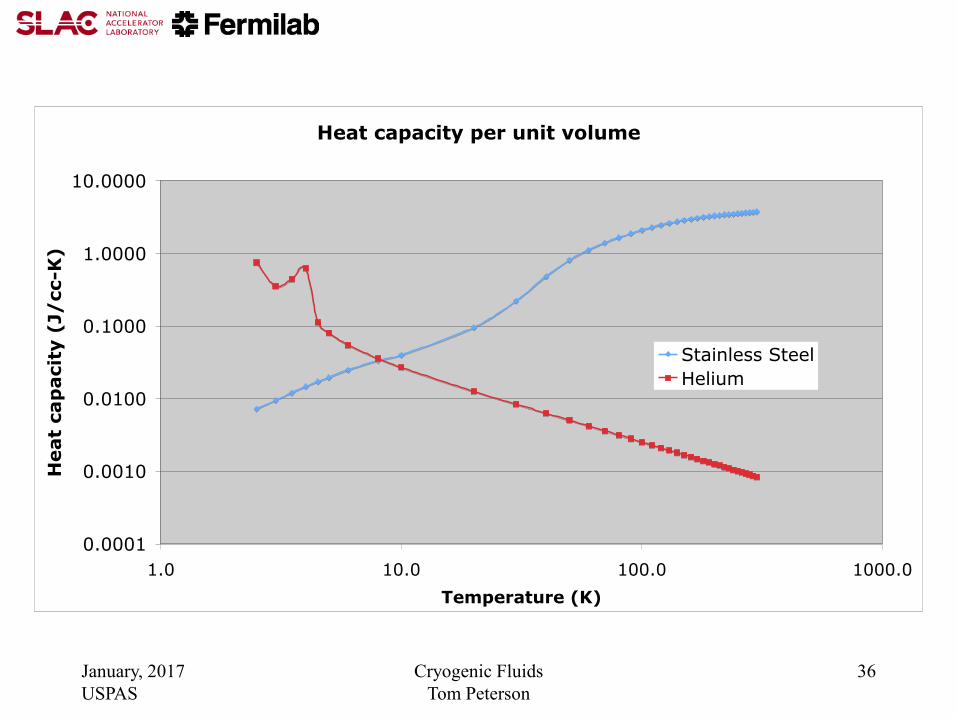
Heat capacity discussion
• The following plots illustrate the fact that
the heat capacity of metals becomes
vanishingly small at liquid helium
temperatures
– Cool-down to ~80 K is dominated by removal
of heat from the solid materials
– Cool-down below ~20 K is dominated by
removal of heat from the helium
January, 2017
USPAS
Cryogenic Fluids
Tom Peterson
34

Heat capacity
January, 2017
USPAS
Cryogenic Fluids
Tom Peterson
35
Heat capacity per unit mass
0.00010
0.00100
0.01000
0.10000
1.00000
10.00000
0.0 50.0 100.0 150.0 200.0 250.0 300.0 350.0
Temperature (K)
Heat
cap
acit
y (
J/
gK
)
Stainless Steel
Helium
January, 2017
USPAS
Cryogenic Fluids
Tom Peterson
36
Heat capacity per unit volume
0.0001
0.0010
0.0100
0.1000
1.0000
10.0000
1.0 10.0 100.0 1000.0
Temperature (K)
Heat
cap
acit
y (
J/
cc-K
)
Stainless Steel
Helium
Provisions for cool-down and warm-up
• Cool-down
– Return vapor may block liquid supply flow in the same channel; a simple fill from the top or one end might not work. A cool-down vent and/or a bottom-fill port may be required.
• Warm-up
– Flow will stratify. Local electric heat, a bottom vent port, or other feature to force heat down to the lower parts of a cold mass may be required.
• The small “capillary” tubes connected to a manifold and providing helium to the bottoms of helium vessels in TESLA-style cryomodules were included primarily with warm-up in mind
January, 2017
USPAS
Cryogenic Fluids
Tom Peterson
37
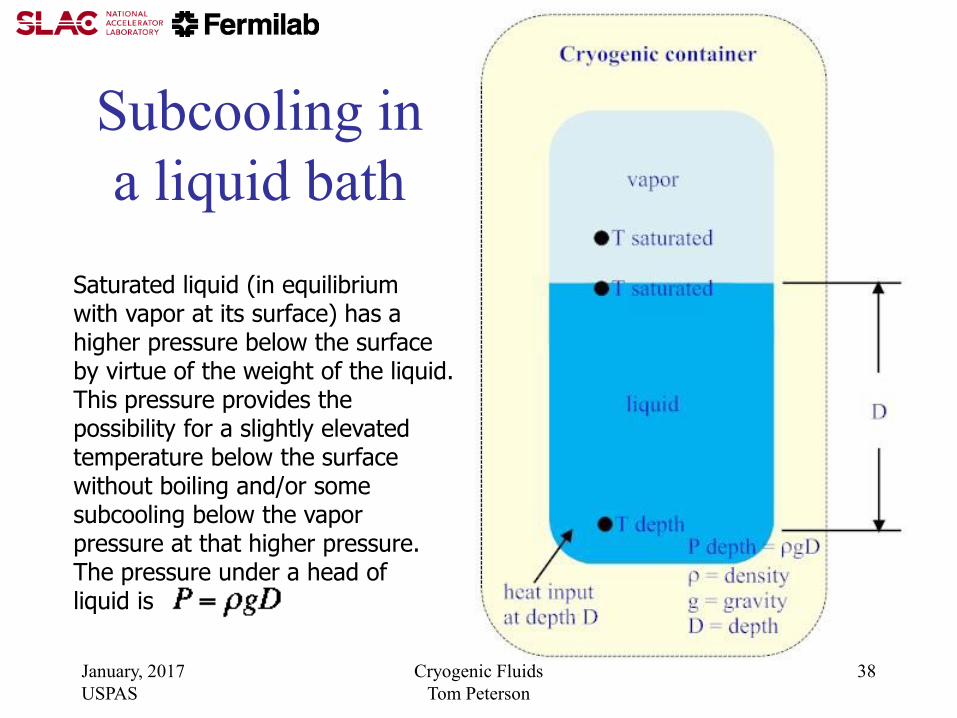
Subcooling in
a liquid bath
January, 2017
USPAS
Cryogenic Fluids
Tom Peterson
38
Saturated liquid (in equilibrium with vapor at its surface) has a higher pressure below the surface by virtue of the weight of the liquid. This pressure provides the possibility for a slightly elevated temperature below the surface without boiling and/or some subcooling below the vapor pressure at that higher pressure. The pressure under a head of liquid is
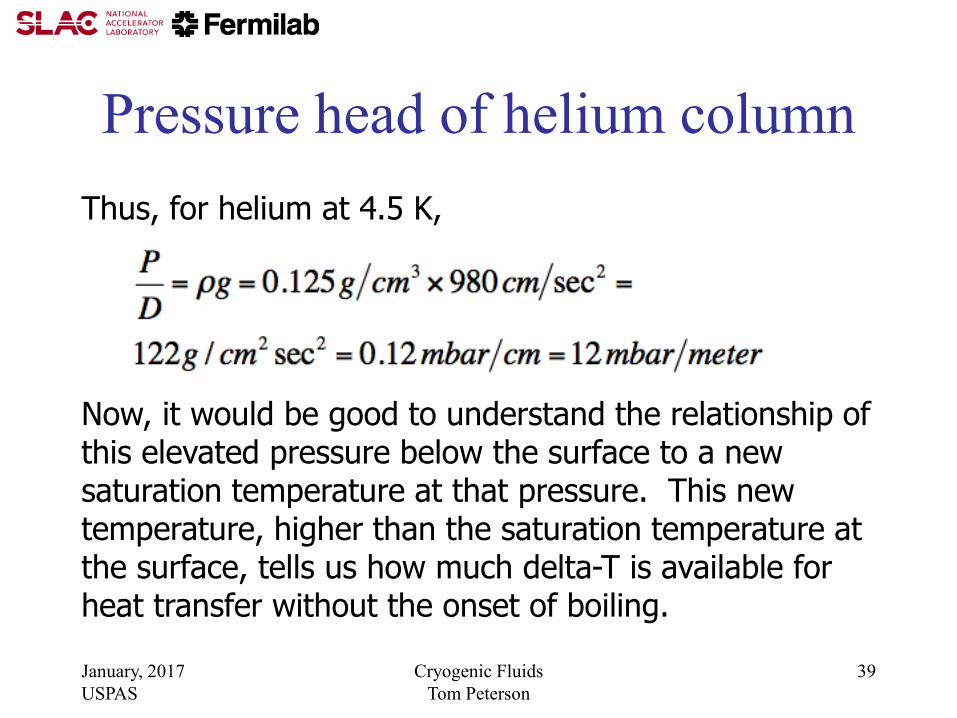
Pressure head of helium column
January, 2017
USPAS
Cryogenic Fluids
Tom Peterson
39
Thus, for helium at 4.5 K,
Now, it would be good to understand the relationship of this elevated pressure below the surface to a new saturation temperature at that pressure. This new temperature, higher than the saturation temperature at the surface, tells us how much delta-T is available for heat transfer without the onset of boiling.
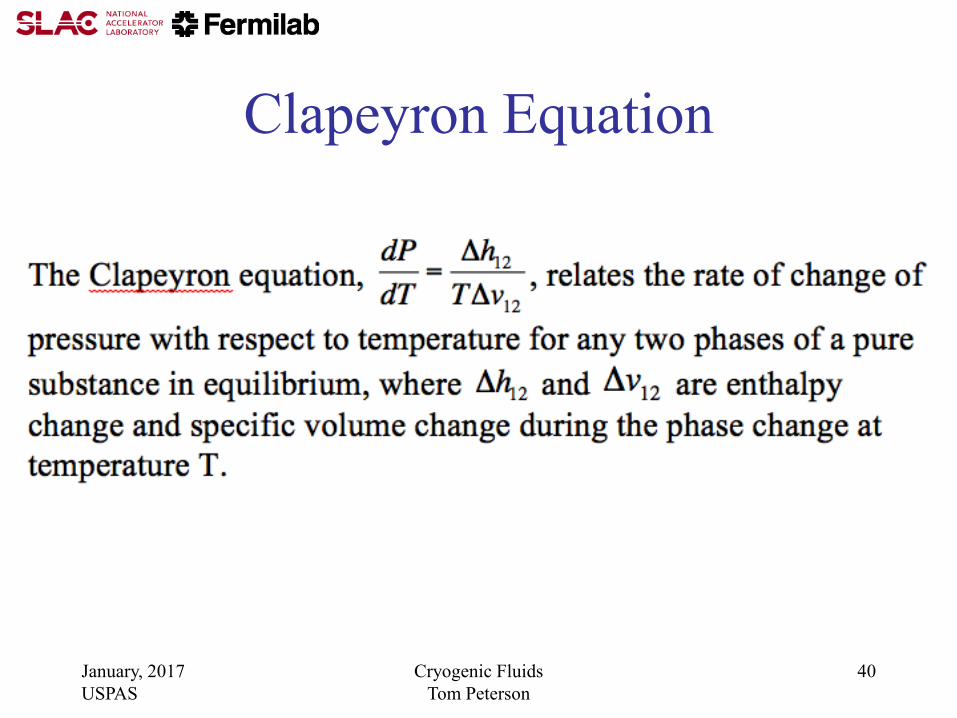
Clapeyron Equation
January, 2017
USPAS
Cryogenic Fluids
Tom Peterson
40
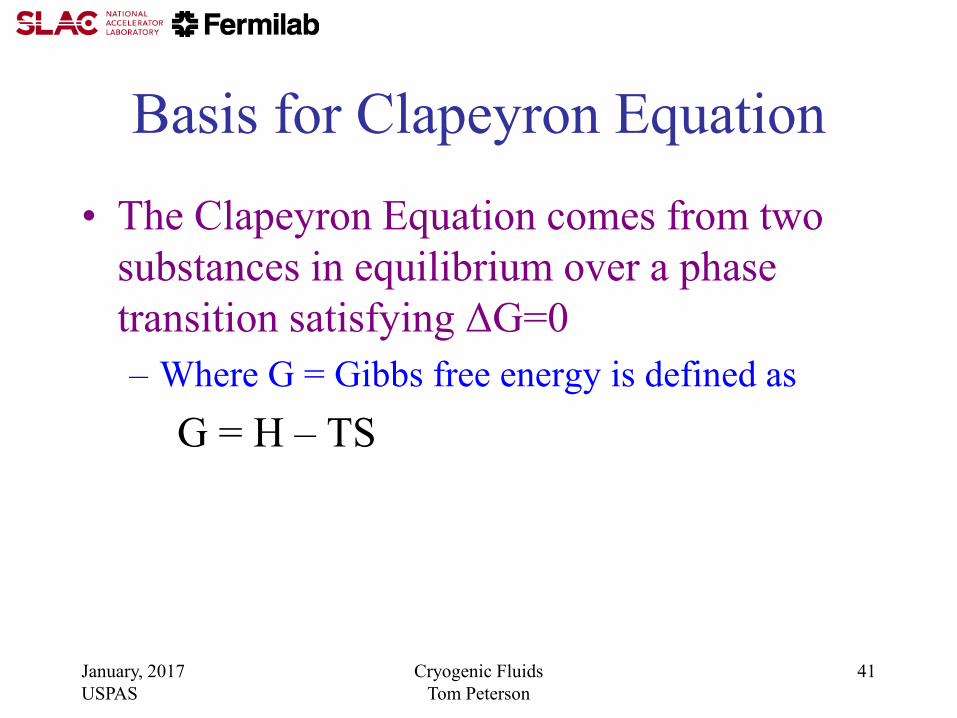
Basis for Clapeyron Equation
• The Clapeyron Equation comes from two
substances in equilibrium over a phase
transition satisfying ΔG=0
– Where G = Gibbs free energy is defined as
G = H – TS
January, 2017
USPAS
Cryogenic Fluids
Tom Peterson
41
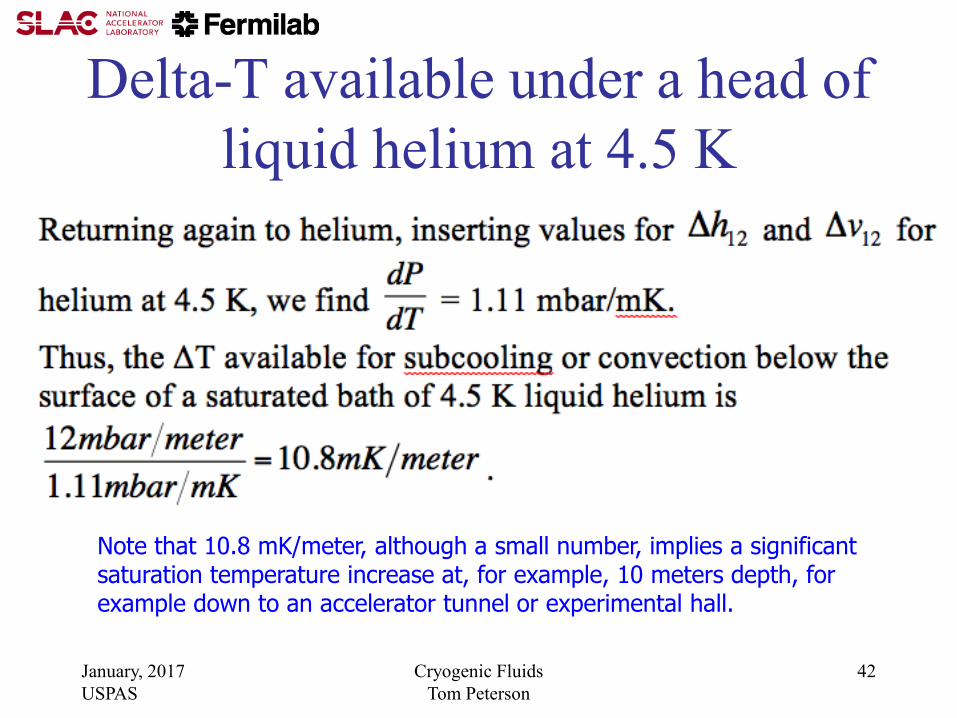
Delta-T available under a head of
liquid helium at 4.5 K
January, 2017
USPAS
Cryogenic Fluids
Tom Peterson
42
Note that 10.8 mK/meter, although a small number, implies a significant saturation temperature increase at, for example, 10 meters depth, for example down to an accelerator tunnel or experimental hall.
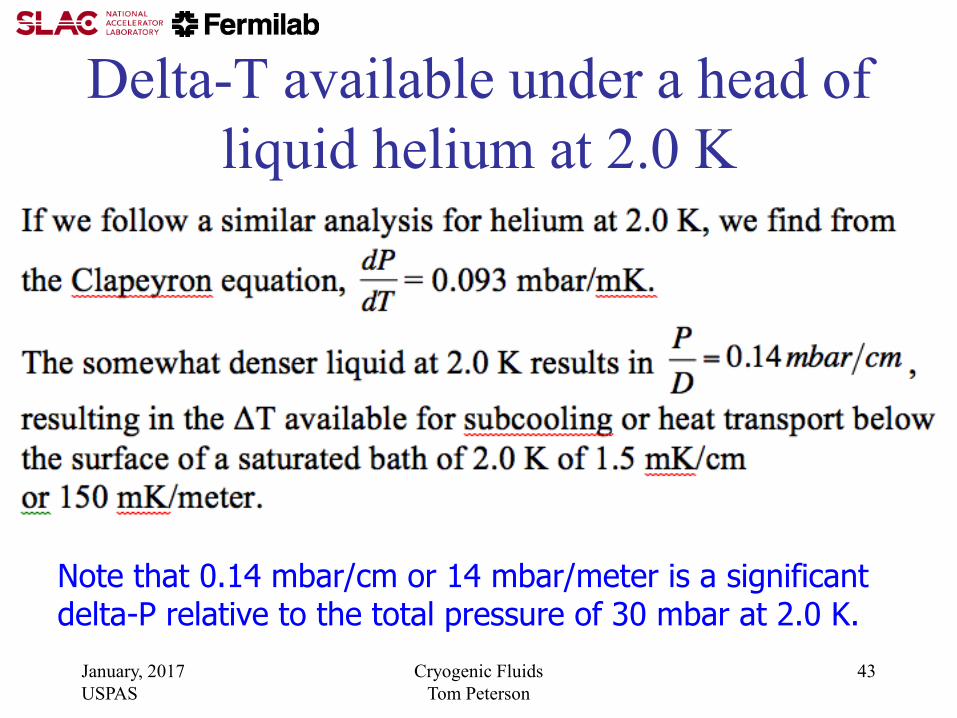
Delta-T available under a head of
liquid helium at 2.0 K
January, 2017
USPAS
Cryogenic Fluids
Tom Peterson
43
Note that 0.14 mbar/cm or 14 mbar/meter is a significant delta-P relative to the total pressure of 30 mbar at 2.0 K.

Saturated bath of liquid Argon
• Pure liquid argon is a common component
of high energy physics detectors
– Liquid argon calorimetry
– Time Projection Chamber (TPC)
• In both cases, especially in the latter, purity
and lack of bubbles are important for
minimal noise and good signal
– TPC depends on electron drift to a charged
plate, and electron lifetime is critical January, 2017
USPAS
Cryogenic Fluids
Tom Peterson
44

January, 2017
USPAS
Cryogenic Fluids
Tom Peterson
45
Looking at maximum heat flux via free convection (no boiling) for D0 liquid argon calorimeter back in 1988. Analytical process: Calculate available ΔT as a function of depth. Given ΔT, calculate free convective heat flux for various geometries and Orientations.
Liquid Argon TPC
• Heat input from supports and other heat
sources to the liquid argon bath should not
produce bubbles
– Heat transport by free convection without
nucleation of bubbles
– Free convection driven by liquid density
differences, due to temperature differences
– Temperature differences limited by saturation
temperature at depth
January, 2017
USPAS
Cryogenic Fluids
Tom Peterson
46
Total pressure vs vapor pressure • Consider a glass of water open to normal air and at
the same temperature as the air
– 100% humidity in air water vapor in air in
equilibrium with liquid in the glass
– Now warm the water slightly saturation pressure of
liquid higher than vapor pressure of water in air
– Why does it not boil?
• Answer: bubbles must overcome total pressure,
not just vapor pressure of the water in air
• Typically our cryogenic systems involve pure
helium and nitrogen, so vapor pressure = total P
January, 2017
USPAS
Cryogenic Fluids
Tom Peterson
47
Inhibit boiling with total pressure
• One could accomplish the same sort of
thing for a liquid argon bath
• Pressurize the system with helium gas
• Total pressure much higher than vapor
pressure of LAr
• (Problem for detectors: argon purity with
some helium dissolving in LAr)
January, 2017
USPAS
Cryogenic Fluids
Tom Peterson
48
References
• S. W. VanSciver, “Helium Cryogenics,” Plenum Press, 1986.
• R. Byron Bird, Warren E. Stewart, Edwin N. Lightfoot, “Transport Phenomena,” John Wiley &Sons, 1960.
• Ovid Baker, "Design of Pipelines for the Simultaneous Flow of Oil and Gas," Oil and Gas Journal (July 26, 1954) p. 185-195
• J. C. Theilacker and C. H. Rode, “An Investigation into Flow Regimes for Two-phase Helium Flow,” Advances in Cryogenic Engineering, Vol. 33, pp. 391-398, 1988.
• E.G. Brentari, et al, “Boiling Heat Transfer for Oxygen, Nitrogen, Hydrogen, and Helium,” NBS Technical Note 317, Boulder, CO, 1965.
• Crane Technical Paper #410 “Flow of Fluids through Valves, Fittings, and Pipes”
January, 2017
USPAS
Cryogenic Fluids
Tom Peterson
49
![Fluid Mechanics - An-Najah Videos · [3] Fall –2010 –Fluid Mechanics Dr. Mohammad N. Almasri [3-1] Fluid Statics Fluid Pressure Fluid pressure is the normal force exerted by the](https://img.pdfslide.net/doc/110x75/5adc4efd7f8b9a8b6d8b62a3/fluid-mechanics-an-najah-videos-3-fall-2010-fluid-mechanics-dr-mohammad.jpg)