Embed Size (px)
Citation preview

Chapter 2Normal Glucose Homeostasis
Muhammad Z. Shrayyef and John E. Gerich
Glucose: From Origins to Fates
Arterial plasma glucose values throughout a 24-h period average approximately 90 mg/dl, with a maximal con-centration usually not exceeding 165 mg/dl such as after meal ingestion1 and remaining above 55 mg/dl such asafter exercise2 or a moderate fast (60 h).3 This relative stability contrasts with the situation for other substratessuch as glycerol, lactate, free fatty acids, and ketone bodies whose fluctuations are much wider (Table 2.1).4
This narrow range defining normoglycemia is maintained through an intricate regulatory and counterregula-tory neuro-hormonal system: A decrement in plasma glucose as little as 20 mg/dl (from 90 to 70 mg/dl) willsuppress the release of insulin and will decrease glucose uptake in certain areas in the brain (e.g., hypothalamuswhere glucose sensors are located); this will activate the sympathetic nervous system and trigger the release ofcounterregulatory hormones (glucagon, catecholamines, cortisol, and growth hormone).5 All these changes willincrease glucose release into plasma and decrease its removal so as to restore normoglycemia. On the other hand,a 10 mg/dl increment in plasma glucose will stimulate insulin release and suppress glucagon secretion to preventfurther increments and restore normoglycemia.
Glucose in plasma either comes from dietary sources or is either the result of the breakdown of glycogen inliver (glycogenolysis) or the formation of glucose in liver and kidney from other carbons compounds (precursors)such as lactate, pyruvate, amino acids, and glycerol (gluconeogenesis).
In humans, glucose removed from plasma may have different fates in different tissues and under differentconditions (e.g., postabsorptive vs. postprandial), but the pathways for its disposal are relatively limited. It (1)may be immediately stored as glycogen or (2) may undergo glycolysis, which can be non-oxidative producingpyruvate (which can be reduced to lactate or transaminated to form alanine) or oxidative through conversionto acetyl CoA which is further oxidized through the tricarboxylic acid cycle to form carbon dioxide and water.Non-oxidative glycolysis carbons undergo gluconeogenesis and the newly formed glucose is either stored asglycogen or released back into plasma (Fig. 2.1).
Importance of Glucose Homeostasis
Although free fatty acids are the main fuel for most organs, glucose is the obligate metabolic fuel for the brainunder physiologic conditions. This occurs because of low circulating concentrations of other possible alternativesubstrates (e.g., ketone bodies) or because of limitations of transport across the blood-brain barriers (e.g., freefatty acids).6 After prolonged fasting, because of an increase in their circulating concentration, ketone bodiesmay be used by the brain to a significant extent.7
J.E. Gerich (B)Department of Medicine, University of Rochester School of Medicine, Rochester, NY 14642, USAe-mail: [email protected]
19L. Poretsky (ed.), Principles of Diabetes Mellitus, DOI 10.1007/978-0-387-09841-8_2,C© Springer Science+Business Media, LLC 2010

20 M.Z. Shrayyef and J.E. Gerich
Table 2.1 Circulating substrates and regulatory hormones after overnight, moderate, and prolonged fasting
Overnight fast (12–16 h) Moderate fast (30–60 h) Prolonged fast (>1 week)
Substrates (mmol/l)Glucose 5.0 4.0 3.0Free fatty acids 0.5 1.0 1.5Glycerol 0.05 0.1 0.23-Hydroxybutyrate 0.02 0.5 1.0Lactate 0.8 0.8 0.7Glutamine 0.6 0.5 0.4Alanine 0.3 0.2 0.2
HormonesInsulin (pmol/l) 60 40 20Glucagon (ng/l) 100 150 150Cortisol (mmol/l) 0.3 0.5 0.9Growth hormone (ng/l) <2 4 8Triiodothyronine (nmol/l) 1.8 1.6 0.9Epinephrine (nmol/l) 0.2 0.4 0.6
This table was published in Gerich4. Copyright © Elsevier. Used with permission.
Fig. 2.1 Routes of postprandial glucose disposal. From Woerle et al.18. Copyright © 2003. The American Physiological Society.Used with permission
Brain cannot synthesize glucose or store as glycogen more than a few minutes supply. Thus brain is dependenton a continuous supply of glucose from plasma.
At plasma glucose concentrations 20 mg/dl below normal levels, glucose transport becomes rate-limiting forbrain glucose utilization.6 Glucose plasma concentrations below 55 mg/dl impair cerebral function,8 whereasmore severe and prolonged hypoglycemia causes convulsions, permanent brain damage, and even death. On theother hand, even mildly elevated plasma glucose concentrations which occur in patients with impaired glucosetolerance increase risk for cardiovascular morbidity.9–11
General Considerations
Relative Changes in Glucose Fluxes
Plasma glucose concentrations are determined by the relative rates at which glucose enters and leaves the circu-lation. Thus, the plasma glucose will increase only if the rate of entry exceeds its rate of exit and, conversely,plasma glucose level will decrease only if rates of exit exceed the rates of entry. To maintain relatively stableplasma glucose concentrations, increases in rates of glucose delivery into the systemic circulation (e.g., when

2 Normal Glucose Homeostasis 21
meal is ingested) require a comparable increase in rates of glucose removal from the circulation.12 For example,during vigorous exercise, fever, or trauma when the body’s utilization of glucose increases, there is normally acompensatory increase in glucose delivery.2
Changes in glucose clearance, an index of efficiency of glucose removal from the circulation, by itself do notaffect plasma glucose concentrations independent of changes in rates of glucose entry and exit.
Factors Influencing Glucose Fluxes
The most important factors on a moment to moment basis are the hormones (insulin, glucagon, and cate-cholamines), the sympathetic nervous system activity as well as the concentration of other substrates (FFA).On a more prolonged time basis (hours–days), other hormones (cortisol and growth hormone), nutritional fac-tors (e.g., diet composition), exercise and physical fitness, along with concomitant changes in the sensitivityto hormones become important.4 Cortisol, growth hormone, and catecholamines affect glucose homeostasis byaltering insulin sensitivity and also by changes in the availability of alternative substrates.
Fasting vs. Postprandial States
The mechanisms delivering glucose into the circulation (i.e., glycogenolysis vs. gluconeogenesis) and the sitesfor glucose disposal will vary depending on duration of fasting. For example, as fasting is prolonged, the pro-portion of gluconeogenesis increases and the contribution of hepatic glycogen stores decreases. Moreover,the relative contribution of the kidney increases. In regard to utilization, after an overnight fast, there isno net storage of glucose and all glucose taken up by tissues is either completely oxidized or converted tolactate.
Actions of Key Regulatory Factors
Insulin
Insulin regulates glucose metabolism by direct and indirect actions. Through binding to its receptors in the liver,kidney, muscle, and adipose tissue, insulin activates its signaling pathway which involves a complex cascade ofprotein kinases and regulatory proteins of which IRS-1 and IRS-2 are the most important (Table 2.2). This causes(1) suppression of glucose release from liver and kidney,13 (2) translocation of glucose transporters in muscleand adipose tissue to increase their glucose uptake,14 and (3) inhibition of release of FFA into the circulationdue to suppression of the activity of hormone-sensitive lipase and a simultaneous increase in their clearancefrom the circulation.15 Although insulin does not increase glucose transport into liver, it promotes glycogenaccumulation by inhibiting glucose-6-phosphatase and phosphorylase (glycogenolysis enzymes) while sti-mulating glycogen synthase .16
The effect of insulin on circulating FFA levels indirectly reduces glucose release into circulation and promotesglucose removal since FFA stimulate gluconeogenesis and reduce glucose transport into cells.15

22 M.Z. Shrayyef and J.E. Gerich
Table 2.2 Mechanism of action of key metabolic regulators
Glucose production Glucose utilization Lipolysis
Insulin ↓ ↑ ↓Glucagon ↑ – –Epinephrine ↑ ↓ ↑Cortisol ↑ ↓ ↑Growth hormone ↑ ↓ ↑FFA ↑ ↓ –
The main regulator of insulin secretion is the plasma glucose concentration: Increased plasma glucose aftermeal ingestion results in three-to fourfold increase in plasma insulin within 30–60 min whereas a decrease plasmaglucose below 50 mg/dl will result in 80–90% reduction in plasma insulin levels. Acute increases in amino acids,and to a lesser extent, FFA also increase insulin secretion.4,16–18
After meal ingestion, intestinal factors called incretins (e.g., gastrointestinal-inhibitory peptide [GIP] andglucagon-like peptide [GLP-1]) augment insulin secretion. This is why plasma insulin concentrations increaseto a greater extent after oral glucose load than after intravenous glucose despite identical plasma glucoseconcentrations.18,19
Metabolic processes vary in their sensitivity to insulin and their dose-response characteristics. At basal levelsobserved in the postabsorptive state (∼5–10 μU/ml), insulin is already inhibiting glucose and FFA release 30–50% (counteracting the effect of glucagon and the sympathetic nervous system) while having a trivial effecton tissue glucose uptake. Maximal suppression of glucose and FFA release normally is observed with plasmainsulin concentrations seen postprandially (∼40–50 μU/ml), whereas maximal stimulation of tissue glucoseuptake requires plasma insulin concentrations greater than 300 μU/ml levels not seen under normal physiologicalconditions except in extremely insulin resistant individuals in whom, of course, such level would not producemaximal effect.4,17,18,20
Glucagon
Glucagon, a hormone secreted from the α cells of the endocrine pancreas, is the major counterpart to insulin inthe moment to moment regulation of plasma glucose. The control of its secretion is multifactorial.21 The mainfactors are direct effects of glucose and insulin. In humans, neural signals and substrates other than glucose, e.g.,FFA and amino acids, play a minor role. Glucagon secretion is inhibited by hyperglycemia and stimulated byhypoglycemia.
Glucagon acts exclusively on the liver where it binds to its receptors and activates adenylate cyclase.As a result, intracellular cAMP level increases, enhancing glycogenolysis as a result of phosphorylase stim-ulation.22,23 This response wanes after several hours and is followed by an increase in gluconeogenesisdue to a complex process involving both increased substrate uptake and enzyme activation.4,19–21,24 Thus,the main immediate action of glucagon to increase plasma glucose level is through stimulation of hepaticglycogenolysis.24
Catecholamines
Catecholamine release is mediated through changes in sympathetic nervous system, being increased during stressand hypoglycemia. Catecholamines inhibit insulin secretion while decreasing insulin action. Acting as bothhormones (epinephrine) and neurotransmitters (norepinephrine), they are potent hyperglycemic factors whoseactions, unlike those of glucagon, are sustained and affect both glucose release and glucose removal.20,25,26
For the most part, metabolic actions of catecholamines are mediated through beta 2 adrenergic receptors: Atthe liver, they directly increase glycogenolysis via cAMP activation of phosphorylase and, to a lesser extent, aug-ment gluconeogenesis indirectly through increasing gluconeogenic substrate availability and plasma FFA.24,26

2 Normal Glucose Homeostasis 23
At the kidney level, they are potent stimulators of gluconeogenesis both directly and indirectly as in the liver andare actually more potent stimulators of renal glucose release than hepatic glucose release.27 In skeletal muscles,they reduce glucose uptake and stimulate glycogenolysis which results in an increase in release of lactate – themajor gluconeogenic precursor. In adipose tissue, catecholamines stimulate lypolysis via activation of hormone-sensitive lipase which results in an increase in the release of FFA and glycerol, another key gluconeogenicprecursor.24–26,28
Growth Hormone and Cortisol
In contrast to glucagon and catecholamines which act almost immediately, the metabolic actions of growthhormone and cortisol generally take several hours to become evident. These can be summarized as being antag-onistic to the action of insulin (i.e., they reduce the ability of insulin to suppress glucose release, stimulateglucose uptake, and inhibit lipolysis).25,29 Both hormones increase the synthesis of gluconeogenic enzymes andreduce glucose transport.29–31 In addition, cortisol can impair insulin secretion.31 Accordingly, the mechanismsfor deterioration in glucose tolerance during immunosuppressive glucocorticoid treatment involve induction ofinsulin resistance and prevention of an appropriate compensatory increase in insulin secretion.31
It is important to note that counterregulatory hormones work via different intracellular mechanisms whichreinforce/synergize with one another. Simultaneously small increases in their plasma levels will have greatereffect than large increases in plasma levels of only one hormone.8
FFA
FFA are the predominant fuel used by most tissues of the body, the major exceptions being the brain, renalmedulla, and blood cells.32–34 Increases in plasma FFA have many potentially important metabolic conse-quences35,36: stimulation of hepatic and renal gluconeogenesis; inhibition of muscle glucose transport; andcompetition with glucose as an oxidative fuel. The major regulators of circulating FFA levels are the sympa-thetic nervous system and growth hormone32 (which increase plasma FFA levels), insulin (which reduces plasmaFFA levels by suppressing lipolysis and increasing FFA clearance), and hyperglycemia. There is evidence forheterogeneity of adipose depots with visceral fat being more metabolically active than subcutaneous fat.32,36
Incretins: The Entero-insular Axis
The concept that certain factors secreted from the intestinal mucosa in response to nutrients can stimulate thepancreas to release insulin was first introduced to explain the phenomenon of greater increase in plasma insulinlevels in response to oral glucose load compared with the same load of glucose given intravenously (Table 2.3).The term incretin was used to denote these factors.37 The first incretin hormone identified, was called gastricinhibitory polypeptide (GIP) based on its ability to inhibit gastric acid secretion in dogs.37 Another peptide wasdiscovered later and named glucagon-like peptide-1 based on its homology to glucagon.38 Both peptides are
Table 2.3 Effects of GLP1 and GIP on different tissues
Effects on GLP1 GIP
Pancreas ↑Insulin secretion ↑Insulin secretion↓Glucagon secretion –
Peripheral ↓Hepatic glucose release –↑Muscle glucose uptake –
Gastric Delay gastric emptying Inhibit secretions only atsupraphysiologic levels
CNS ↑ Satiety, ↓ appetite, ↓ weight –

24 M.Z. Shrayyef and J.E. Gerich
secreted from intestinal endocrine mucosa (L and K cells) within minutes of nutrient ingestion and have shorthalf-life (minutes) due to the rapid inactivation by a proteolytic enzyme called dipeptidyl peptidase-4 (DPP-4).
GLP-1 and GIP inhibit glucagon secretion;39 only GLP-1 delays gastric emptying and only GLP-1, possiblythrough a neural mechanism, promotes satiety, decreasing food intake and leading to weight loss.37
Upper Gastrointestinal Function and Glycemic Homeostasis
Recent studies indicate that gastric emptying is a major physiologic determinant of postprandial glycemia bycontrolling the nutrient delivery into the small intestine: It accounts for ∼35% of the variance in peak blood glu-cose concentrations after ingestion of oral glucose in healthy volunteers40,41 or patients with type 2 diabetes.40,42
It is delayed in acute hyperglycemia14,43 and accelerated during hypoglycemia.44
Effect of Meal Composition on Glucose Metabolism
In healthy humans, adding protein or fat to oral glucose was found to lower postprandial glucose concentrationsby slowing the gastric emptying and stimulating incretins. Protein also enhances non-glucose-dependent insulinrelease.45,46
Glucose Transport Pathways
Due to its hydrophilic nature, glucose diffuses slowly across the lipid bilayer of the cell membrane and needsspecific transporter proteins to facilitate its entry into cells. Glucose flux varies among tissues depending to alarge extent on the characteristics of the transporters in that specific tissue and whether the process is sensitiveto insulin or not.47,48 Insulin regulates the steady-state concentration of glucose transporters by promoting theirsynthesis and also acutely accelerates the uptake of glucose, promoting mobilization of the transporters to thecell membrane.48
There are two distinct families of transport proteins.49 (1) Facilitative GLUT family: These transporters pro-mote facilitated diffusion of glucose, a process that is not energy dependent and that follows Michaelis–Mentonkinetics.50 The high-affinity transporters (GLUT 1, 3, 4) have a Michaelis–Menton constant (Km) below the nor-mal range of blood glucose concentrations and are capable of providing glucose transport under basal conditionsfor many cells.49 GLUT3 is the major neuronal transporter (lowest Km) whereas GLUT4 mediates insulin-stimulated glucose uptake by skeletal muscle, heart, and adipose tissues. Insulin and exercise promote GLUT3expression on cell surface.49,51 The low-affinity transporters (GLUT2) are present on ß-cells and in tissuesexposed to large glucose fluxes, such as intestine, liver, and kidney.49 (2) SGLT family: These transporters utilizethe electrochemical sodium gradient to transport glucose against concentration gradients49,52 and are prominentin intestine and kidney. SGLT1 is responsible for the dietary uptake of glucose from the small intestine lumenwhereas SGLT2 plays a major role in glucose reabsorption from proximal renal tubule.49,52
Glucose Production and Hepatorenal Glucose Reciprocity
A considerable body of evidence indicates that somehow release of glucose by the liver and kidney are inter-related so that a reduction in release by one organ is associated by an increase by the other to further maintainoptimal glucose homeostasis. This relationship is referred to as hepatorenal glucose reciprocity.53
Until recently, it was widely thought that the liver was the sole source of glucose except during acidosis andafter prolonged fasting. During the past few years, numerous reports54–62 indicated that the kidney is responsible

2 Normal Glucose Homeostasis 25
on an average for about 20% of glucose released into the circulation in overnight fasted normal human volun-teers. Moreover, a number of studies have shown that kidney increased its glucose release (gluconeogenesis) tocompensate for restricted (physiologic) or impaired (pathologic) hepatic glucose release.53
Physiologic examples of the phenomena occur postprandially and after prolonged fasting. After meal inges-tion, the hepatic glucose release is suppressed ∼80%, while renal glucose release increases and actually exceedshepatic glucose release (HGR) for several hours63 to allow for hepatic glycogen repletion.53 Also after prolongedfasting (60 h), renal glucose release increases fourfold while hepatic glucose release decreases by ∼45%.59
Examples of renal compensation with pathologic process are the following: (1) Hepatic Diseases: Hypoglycemiais extremely uncommon in patients with severe liver disease in the absence of other factors (infection, heart fail-ure). Studies using an animal model for liver failure have demonstrated that there is a compensatory increasein renal glucose release to compensate for the reduced hepatic glucose release.53,64–66 In humans, during theperiod of hepatic transplantation when patients have no functioning liver, hypoglycemia does not occur; overallglucose release into the circulation either decreases minimally or not at all, and there is an increase in renalglucose release.67,68 (2) Acidosis: Acidosis stimulates renal glucose release69 while inhibiting hepatic glucoserelease.70 In patients with respiratory acidosis, an increase in net renal glucose release has been demonstratedinversely proportional to blood pH.71 (3) Glucose Counterregulation in Diabetes: Patients with type 15 andprolonged type 272 diabetes lose their glucagon response and become dependent on catecholamine responses.Catecholamines are the major hormonal factor responsible for the increase in renal glucose release during hypo-glycemia.73 Consequently, type 1 diabetic patients with both reduced glucagon and epinephrine responses havedecreases in both hepatic and renal glucose release during hypoglycemia.74 In patients with type 2 diabetes, whohave reduced plasma glucagon responses, compensatory increases in hepatic glucose release during recoveryfrom hypoglycemia are reduced, whereas renal glucose release is increased.75
The Postabsorptive State
The period after 14–16 h overnight fast is commonly referred to as the postabsorptive state. During this timeplasma glucose concentrations average about 85 mg/dl (70–100 mg/dl) and are relatively stable since rates ofglucose release into the circulation approximate the rates of glucose exit from the circulation (∼10 μg/kg/min).4
Glucose Production
The liver is responsible for approximately 80% of glucose release into the circulation in the postabsorptivestate.76 Under these conditions, ∼50% of the glucose entering the circulation is due to glycogenolysis andthe reminder (∼5.0 μmol/kg/min) to gluconeogenesis77 (Table 2.4). The proportion owing to gluconeogenesisrapidly increases with the duration of fasting, as glycogen stores become depleted; by 24 h from the last meal,gluconeogenesis accounts for about 70% of all glucose released into the circulation, and by 48 h, it accounts forover 90% of all glucose released into the circulation.3,77
The kidney normally contains little glycogen and renal cells that could make glycogen lack glucose-6-phosphatase. Consequently, virtually all the glucose released by the kidney is the result of gluconeogene-sis.76 Although the liver releases about four times as much as the kidney under postabsorptive conditions, bothorgans release about the same amount (2.5–3.0 μmol/kg/min) from gluconeogenesis and the proportion of overallglucose release owing to renal gluconeogenesis increases even further with prolonged fasting.60
The liver releases glucose both by glycogenolysis and gluconeogenesis and can be considered to be the solesource of glucose due to glycogenolysis. In overnight fasted people, the liver contains about 75 g of glycogen.78
Thus, if it releases glycogen at a rate of 63 mg/min (5 μmol/kg/min), glycogen stores would be totally depletedin about 20 h and the sole source of glucose released into the circulation at this point would be gluconeogenesis.4

26 M.Z. Shrayyef and J.E. Gerich
Table 2.4 Summary of postabsorptive glucose release
Rate (μmol/kg/min) % of total
I. Glucose release 10.0 100A. Hepatic 8.0 80
1. Glycogenolysis 5.0 502. Gluconeogenesis 3.0 30
Lactate 1.3 13Alanine 0.8 8Other amino acids 0.2 2Glycerol 0.4 4Glutamine 0.3 3
B. Renal 2.0 201. Glycogenolysis 0 02. Gluconeogenesis 2.0 20
Lactate 1.2 12Glutamine 0.4 4Glycerol 0.2 2Other amino acids 0.1 1Alanine 0.1 1
Regulation of Glucose Production: Hepatic vs. Renal
Glucose release by the liver and kidney are regulated differently. Insulin suppresses glucose release byboth organs (1) directly by affecting enzyme activation/deactivation and (2) indirectly through gluconeogenicsubstrate availability and gluconeogenic activators (e.g., suppression of FFA and glucagon).13
Glucagon, which increases both glycogenolysis and gluconeogenesis in the liver, however, has no effect on thekidney.55 Epinephrine, which can directly activate hepatic glycogenolysis, appears to increase glucose release,predominantly by directly stimulating renal gluconeogenesis and, to a lesser extent, by increasing availability ofgluconeogenic precursors/activators (e.g., glycerol and FFA).27,56
The major precursors for gluconeogenesis are lactate, glycerol, glutamine, and alanine.4 Most amino acidsreleased from skeletal muscle protein are converted to alanine and glutamine for transport through plasma toliver and kidney: alanine being selectively used by liver, glutamine being preferentially used in the kidney, whilelactate and glycerol used to roughly comparable extent by both organs. In the resting postabsorptive state, lactateis the major gluconeogenic precursor, accounting for about half of all gluconeogenesis.4
Glucose Utilization
Although the postabsorptive state is often considered to represent a steady state, it is actually a pseudo-steadystate, since rates of glucose removal slightly, and undetectably, exceed rates of glucose release so that if fast-ing is prolonged, plasma glucose levels gradually decrease; by 20–24 h of fasting they may be 15–20% lower(Fig. 2.2). However, even after 72 h of fasting, they are usually maintained above 50 mg/dl.3
In the postabsorptive state, there is no net storage of glucose; consequently, glucose taken up by tissues iseither completely oxidized to CO2 or released back into the circulation as lactate, alanine, and glutamine79 forreincorporation into glucose via gluconeogenesis (Table 2.5).
Most glucose used by the body can be accounted for by six tissues: the brain (45–60%), skeletal muscle(15–20%), kidney (10–15%), blood cells (5–10%), splanchnic organs (3–6%), and adipose tissue (2–4%).4
Glucose taken up by the brain is completely oxidized whereas that taken up by the kidney, blood cells,splanchnic tissues, and muscle mainly undergoes glycolysis. Recall that most of the body energy requirementsare met by oxidation of FFA which compete with glucose as the fuel of choice in certain organs (e.g., skeletalmuscles, heart, and possibly kidney).35

2 Normal Glucose Homeostasis 27
Liver 10.0
Kidney
8.0
Muscle
Brain
2.0
5.0
1.5
0.5
0.5
2.0
Adipose Tissueand Skin
Blood CellsSplanchnic Organs
Fig. 2.2 Glucose utilization and production in the postabsorptive state. The liver and kidney contribute approximately 8.0 and2.0 μmol/kg/min, respectively; top, the total release of glucose into the circulation (10 μmol/kg/min); the brain, splanchnic tissue,muscle, adipose tissue, and blood cells account for approximately 5.0, 2.0, 1.5, 0.5, and 0.5 μmol/kg/min, respectively. This figurewas published in Endocrinology Volume 1 edited by LJ DeGroot and JL Jameson, chapter entitled “Hypoglycemia” authored byJohn Gerich, p. 923. Copyright © Elsevier 2001. Used with permission
Table 2.5 Glucose disposal in the postabsorptive state
Rate (μmol/kg/min) % of total
Overall 10 100Oxidation ∼7 ∼70Glycolysis ∼3 ∼30
TissuesBrain 5 ∼50Skeletal muscle 2 ∼20Splanchnic organs 1 ∼10Kidney 1 ∼10Adipose tissue 0.5 ∼5Blood cells 0.5 ∼5
Glucose uptake by brain, blood cells, renal medulla, and splanchnic tissue occurs largely independent ofinsulin, and plasma insulin concentrations are low in the postabsorptive state (<10 μU/ml). Under these condi-tions, amount of glucose removed from the circulation is determined almost exclusively by tissue demands, themass action effect of the plasma glucose concentration per se, and the number and characteristics of the glucosetransporters in specific tissue rather than by insulin. Insulin may be viewed as playing a permissive role, whilecounterregulatory hormones that antagonize the action of insulin (e.g., cortisol, growth hormone, epinephrine,and thyroid hormones) can be viewed as modulating the sensitivity of tissue to the effect of insulin on tissueglucose uptake and utilization.4,8
Prolonged Fasting
With prolongation of fasting, plasma insulin levels decrease while those of glucagon, catecholamines, growthhormone, and cortisol increase (Table 2.6). Consequently, plasma FFA, glycerol, and the ketone bodies – productsof FFA oxidation (beta hydroxybutyrate) – increase. Since hepatic glycogen stores become depleted by 60 h,virtually all of the glucose release at this time is due to gluconeogenesis. Initially, hepatic gluconeogenesisdecreases while renal gluconeogenesis increases, with an overall result of a decrease in overall glucose release

28 M.Z. Shrayyef and J.E. Gerich
Table 2.6 Glucose release and disposal after prolonged fasting (∼60 h)
Glucose disposala Glucose releasea
Overall 6.0 Overall 6.0Oxidation 4.8 Gluconeogenesis 5.5Glycolysis 1.2 Glycogenolysis 0.5
Tissues TissuesBrain 3.5 Liver 2.7Skeletal muscle 1.0 Kidney 2.8Splanchnic organs 0.5Kidney 0.4Adipose tissue 0.2Blood cells 0.4
a μmol/kg/min.
and a slight increase in gluconeogenesis. With more prolonged fasting, there is a further decrease in glucoserelease as gluconeogenesis decreases.59
Although more glycerol is available for gluconeogenesis, less lactate is available due to decreased pro-duction by glycolysis, and less amino acids are available because muscle proteolysis decreases. Thesechanges limit gluconeogenesis despite increase in plasma FFA and counterregulatory hormones which promotegluconeogenesis.
Initially during the course of the fast, decreases in glucose release are slightly greater than decreases inglucose uptake so that plasma glucose levels decrease slowly. However, eventually, the rates of uptake andrelease approximate one another so that a new pseudo-steady state is established after 60–70 h with plasmaglucose levels usually averaging 55–65 mg/dl.59
These changes during prolonged fasting are relevant to changes seen in chronically ill patients who often areanorexic, malnourished, and miss meals in hospital because of diagnostic or therapeutic procedures. Because ofthe limitations on gluconeogenesis, such patients, i.e., those with chronic renal failure, severe liver disease, orheart failure, are prone to develop hypoglycemia during infections or other situations which increase the body’sglucose utilization.4,59
Suppression of insulin secretion with prolonged fasting forms the basis for the 72 h fast for the diagnosis ofinsulinoma. In such patients, insulin secretion is not appropriately reduced and this leads to the development ofhypoglycemia (i.e., plasma glucose levels <45 mg/dl).4
The Postprandial State
Complete assimilation of the constituents of a mixed meal containing fat, protein, and carbohydrate and restora-tion of the postabsorptive state takes at least 6 h,80 whereas assimilation of a pure carbohydrate load is generallycomplete within 4–5 h. Despite these time differences, there is little evidence that the fate of ingested carbo-hydrate differs markedly under the two conditions.80 Because people usually eat at least three times a day, themajority of the day is spent in the postprandial state.
Various factors can affect the extent of circulating glucose excursions after meal ingestion. These include thetime and the degree of physical activity since the last meal; the composition and form (liquid vs. solid); rate ofgastric emptying; digestion within the lumen of the small intestine; absorption into the portal vein; extraction bythe liver; suppression of endogenous glucose release; and finally the uptake, storage, oxidation, and glycolysisof glucose in posthepatic tissues.81
From a practical point of view, however, the major factors influencing postprandial glucose homeostasis arethose that affect suppression of endogenous glucose release and those that affect hepatic and posthepatic tissueglucose uptake.
2 Normal Glucose Homeostasis 29
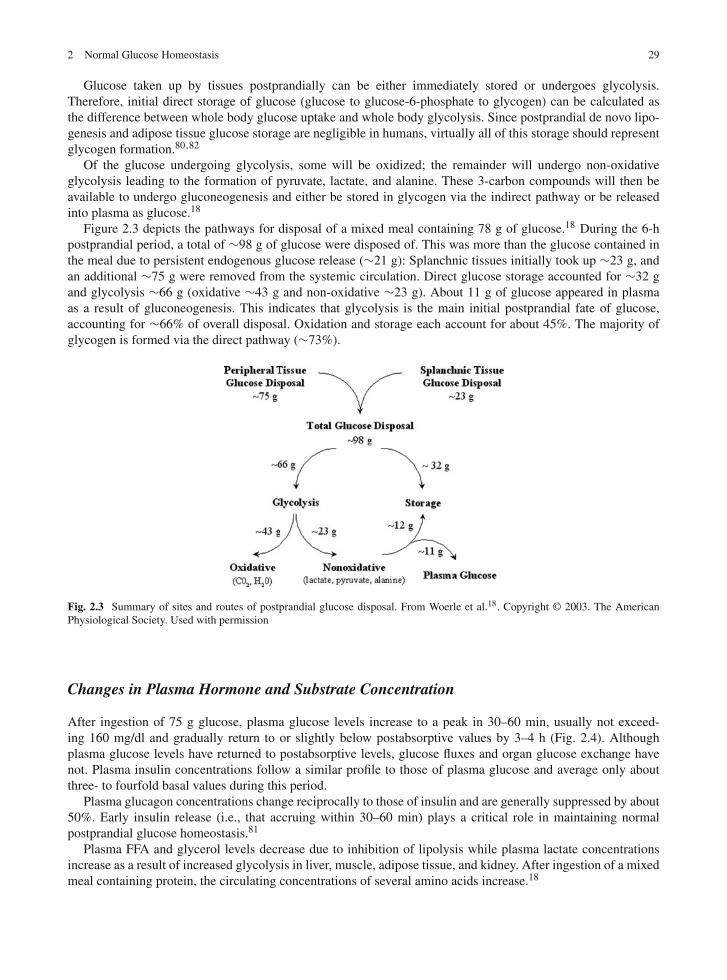
Glucose taken up by tissues postprandially can be either immediately stored or undergoes glycolysis.Therefore, initial direct storage of glucose (glucose to glucose-6-phosphate to glycogen) can be calculated asthe difference between whole body glucose uptake and whole body glycolysis. Since postprandial de novo lipo-genesis and adipose tissue glucose storage are negligible in humans, virtually all of this storage should representglycogen formation.80,82
Of the glucose undergoing glycolysis, some will be oxidized; the remainder will undergo non-oxidativeglycolysis leading to the formation of pyruvate, lactate, and alanine. These 3-carbon compounds will then beavailable to undergo gluconeogenesis and either be stored in glycogen via the indirect pathway or be releasedinto plasma as glucose.18
Figure 2.3 depicts the pathways for disposal of a mixed meal containing 78 g of glucose.18 During the 6-hpostprandial period, a total of ∼98 g of glucose were disposed of. This was more than the glucose contained inthe meal due to persistent endogenous glucose release (∼21 g): Splanchnic tissues initially took up ∼23 g, andan additional ∼75 g were removed from the systemic circulation. Direct glucose storage accounted for ∼32 gand glycolysis ∼66 g (oxidative ∼43 g and non-oxidative ∼23 g). About 11 g of glucose appeared in plasmaas a result of gluconeogenesis. This indicates that glycolysis is the main initial postprandial fate of glucose,accounting for ∼66% of overall disposal. Oxidation and storage each account for about 45%. The majority ofglycogen is formed via the direct pathway (∼73%).
Fig. 2.3 Summary of sites and routes of postprandial glucose disposal. From Woerle et al.18. Copyright © 2003. The AmericanPhysiological Society. Used with permission
Changes in Plasma Hormone and Substrate Concentration
After ingestion of 75 g glucose, plasma glucose levels increase to a peak in 30–60 min, usually not exceed-ing 160 mg/dl and gradually return to or slightly below postabsorptive values by 3–4 h (Fig. 2.4). Althoughplasma glucose levels have returned to postabsorptive levels, glucose fluxes and organ glucose exchange havenot. Plasma insulin concentrations follow a similar profile to those of plasma glucose and average only aboutthree- to fourfold basal values during this period.
Plasma glucagon concentrations change reciprocally to those of insulin and are generally suppressed by about50%. Early insulin release (i.e., that accruing within 30–60 min) plays a critical role in maintaining normalpostprandial glucose homeostasis.81
Plasma FFA and glycerol levels decrease due to inhibition of lipolysis while plasma lactate concentrationsincrease as a result of increased glycolysis in liver, muscle, adipose tissue, and kidney. After ingestion of a mixedmeal containing protein, the circulating concentrations of several amino acids increase.18

30 M.Z. Shrayyef and J.E. Gerich
– 60 90 180 2700
0
200
400
4.0
6.5
9.0
40
80
120
MINUTES
pMm
M
PLASMAINSULIN
PLASMAGLUCAGON
ng/l
PLASMAGLUCOSE
Fig. 2.4 Changes in plasma glucose, insulin, and glucagon after ingestion of a 75 g oral glucose load in normal volunteers
Changes in Rates of Glucose Entry into and Exit from Plasma
Rates of glucose appearance in plasma represent the sum of orally ingested glucose escaping first pass splanchnic(hepatic) extraction and the residual release of endogenous glucose by liver and kidney (Figs. 2.5 and 2.6).Appearance of ingested glucose in the systemic circulation is detected as early as 15 min. Glucose concentrationreaches a peak at 60–80 min and gradually decreases thereafter.18
On average during a 4–5 h postprandial period about 75% of the glucose molecules in plasma represent thosefrom the meal. Endogenous glucose release by the liver decreases rapidly and is suppressed nearly 80% duringthe 5 h postprandial period. As a result, nearly 25 g less glucose due to endogenous production reaches thesystemic circulation during this interval. In contrast to the liver, recent studies indicate that endogenous renalglucose release is not suppressed and actually increases during this period so that it exceeds hepatic glucoserelease.83 This increase in renal glucose release would permit more complete suppression of hepatic glucoserelease and facilitate more efficient hepatic glycogen replenishment.83
– 60 0 90 180 270
8
16
24
MINUTES
µmol
·kg
– 1 ·
min
– 1
SYSTEMIC GLUCOSEAPPEARANCE
SYSTEMIC GLUCOSEDISAPPEARANCE
Fig. 2.5 Changes in rates of glucose entry into and removal from plasma after ingestion of a 75 g oral glucose load in normalvolunteers

2 Normal Glucose Homeostasis 31
– 60 0 90 180 270
0
8
16
MINUTES
GLU
CO
SE A
PPEA
RA
NC
EIN
SYS
TEM
IC C
IRC
ULA
TIO
N(µ
mol
·kg
– 1 ·
min
– 1 )
INGESTED
HEPATIC
RENAL
Fig. 2.6 Changes in rates of entry of glucose into the circulation from ingested glucose, liver, and kidney
Tissues Responsible for Disposal of Ingested Glucose
Based on a survey of published studies, a consensus view of the disposal of a hypothetical meal containing 100 gcarbohydrate is depicted in Fig. 2.7. About 30% of the ingested glucose (∼33 g) is initially extracted by splanch-nic tissues.12,80,84–89 Most is taken up by the liver and immediately incorporated into glycogen via “directpathway” to hepatic glycogen.90,91 A significant portion of glucose taken up by the liver probably undergoes gly-colysis and is released as lactate which is eventually taken up by the liver where it undergoes gluconeogenesis andis subsequently incorporated into glycogen via “indirect pathway.”12,91–93 Inhibition of glucose-6-phosphatasecauses the glucose-6-phosphate made from this lactate to enter glycogen rather than being released into thecirculation as free glucose.
Gut
30gLiver
100g
8gKidney
15g
5gAdipose Tissue
27gMuscle
15gBrain
70g
Fig. 2.7 Postprandial glucose disposal. Of 100 g glucose ingested 30% is taken up by the liver and 70% is released into the systemiccirculation. Of this 70 g, 15 g (∼20%) is extracted by the liver, 15 g (∼20%) is taken up by the brain, 27 g (∼40%) is taken up byskeletal muscle, and the remaining 20% is taken up by kidney, adipose tissue, skin, and blood cells
Of the remaining 70 g glucose, which enters the systemic circulation, 25–30 g is taken up by skeletal mus-cle,12,80,84,85,87,89,94 initially to be oxidized in place of FFA and later (after 2–3 h) to be stored as glycogen.82,95
Relatively little of the glucose taken up by muscle is released into the circulation as lactate and alanine.12,96
About 15 g (∼20% of the ingested glucose entering the circulation) is taken up by brain as a substitute forthe endogenously produced glucose that normally would have been taken up during this period. Recall thatendogenous release of glucose from the liver is markedly reduced postprandially.

32 M.Z. Shrayyef and J.E. Gerich
Another 15 g is extracted from the systemic circulation by the liver either as intact glucose (direct pathway) oras lactate, alanine, and glutamine, whose carbon backbone originated from ingested glucose, for further glyco-gen formation (indirect pathway).92 Thus, ultimately splanchnic tissues dispose of nearly half of the ingestedglucose.97
The kidney may take up as much as 8 g (∼10% of the ingested glucose entering the circulation).83 This wouldleave 5–10 g (7–15%) of the ingested glucose reaching the systemic circulation) to be taken up by adipose andother tissues.82
Summary
For both the fasting and postprandial states, factors which affect the rate of entry of glucose into the circu-lation are more important for maintaining normal glucose homeostasis than those which affect the rate ofremoval of glucose from the circulation. In the postabsorptive state gluconeogenesis and glycogenolysis con-tribute equally to glucose release. The liver is responsible for all of glycogenolysis and half of gluconeogenesis.In the postprandial state almost all endogenous glucose release is via gluconeogenesis.
The regulation of glucose entry into the circulation is complex, being influenced by hormones, the sympatheticnervous system, and substrates (i.e., free fatty acid concentrations and availability of gluconeogenic precursors).Of these, insulin and glucagon are most important both in the fasting and in the postprandial state. In the latter,incretins which form the entero-insular axis contribute by altering gastric emptying and insulin and glucagonsecretion. Finally, recent studies have provided evidence for hepatorenal reciprocity, meaning that, under a vari-ety of conditions, reciprocal changes occur in hepatic and renal glucose release so as to maintain overall glucoserelease relatively constant.
References
1. Rizza R, Gerich J, Haymond M, et al. Control of blood sugar in insulin-dependent diabetes: comparison of an artificial endocrinepancreas, subcutaneous insulin infusion and intensified conventional insulin therapy. N Engl J Med. 1980;303:1313–1318.
2. Wahren J, Felig P, Hagenfeldt L. Physical exercise and fuel homeostasis in diabetes mellitus. Diabetologia. 1978;14:213–222.3. Consoli A, Kennedy F, Miles J, Gerich J. Determination of Krebs cycle metabolic carbon exchange in vivo and its use to
estimate the individual contributions of gluconeogenesis and glycogenolysis to overall glucose output in man. J Clin Invest.1987;80:1303–1310.
4. Gerich J. Control of glycaemia. Baillieres Clin Endocrinol Metab. 1993;7:551–586.5. Gerich J. Glucose counterregulation and its impact on diabetes mellitus. Diabetes. 1988;37:1608–1617.6. Siesjo BK. Hypoglycemia, brain metabolism, and brain damage. Diabetes Metab Rev. 1988;4:113–144.7. Owen O, Morgan A, Kemp H, Sullivan J, Herrera M, Cahill G. Brain metabolism during fasting. J Clin Invest. 1967;46:
1589–1595.8. Mitrakou A, Ryan C, Veneman T, et al. Hierarchy of glycemic thresholds for counterregulatory hormone secretion, symptoms,
and cerebral dysfunction. Am J Physiol. 1991;260:E67–E74.9. Jarrett RJ, Keen H. Hyperglycaemia and diabetes mellitus. Lancet. 1976;2:1009–1012.
10. Tominaga M, Eguchi H, Manaka H, Igarashi K, Kato T, Sekikawa A. Impaired glucose tolerance is a risk factor forcardiovascular disease, but not impaired fasting glucose. The Funagata Diabetes Study. Diabetes Care. 1999;22:920–924.
11. Tchobroutsky G. Relation of diabetic control to development of microvascular complications. Diabetologia. 1978;15:143–152.12. Kelley D, Mitrakou A, Marsh H, et al. Skeletal muscle glycolysis, oxidation, and storage of an oral glucose load. J Clin Invest.
1988;81:1563–1571.13. Meyer C, Dostou J, Nadkarni V, Gerich J. Effects of physiological hyperinsulinemia on systemic, renal and hepatic substrate
metabolism. Am J Physiol. 1998;275:F915–F921.14. Oster-Jorgensen E, Pedersen SA, Larsen ML. The influence of induced hyperglycaemia on gastric emptying rate in healthy
humans. Scand J Clin Lab Invest. 1990;50:831–836.15. Meyer C, Nadkarni V, Stumvoll M, Gerich J. Human kidney free fatty acid and glucose uptake: evidence for a renal glucose-fatty
acid cycle. Am J Physiol. 1997;273:E650–E654.16. Gerich JE. Physiology of glucose homeostasis. Diabetes Obes Metab. 2000;2:345–350.17. Stumvoll M, Mitrakou A, Pimenta W, et al. Assessment of insulin secretion from the oral glucose tolerance test in white patients
with type 2 diabetes. Diabetes Care. 2000;23:1440–1441.

2 Normal Glucose Homeostasis 33
18. Woerle HJ, Meyer C, Dostou JM, et al. Pathways for glucose disposal after meal ingestion in humans. Am J Physiol EndocrinolMetab. 2003;284:E716–E725.
19. Gosmanov NR, Szoke E, Israelian Z, et al. Role of the decrement in intraislet insulin for the glucagon response to hypoglycemiain humans. Diabetes Care. 2005;28:1124–1131.
20. Bolli G, Gottesman I, Cryer P, Gerich J. Glucose counterregulation during prolonged hypoglycemia in normal humans. Am JPhysiol. 1984;247:E206–E214.
21. Gromada J, Franklin I, Wollheim CB. Alpha-cells of the endocrine pancreas: 35 years of research but the enigma remains.Endocr Rev. 2007;28:84–116.
22. Magnusson I, Rothman D, Gerard D, Katz L, Shulman G. Contribution of hepatic glycogenolysis to glucose production inhumans in response to a physiological increase in plasma glucagon concentration. Diabetes. 1995;44:185–189.
23. Gerich J. Physiology of glucagon. Int Rev Physiol. 1981;24:244–275.24. Lecavalier L, Bolli G, Cryer P, Gerich J. Contributions of gluconeogenesis and glycogenolysis during glucose counterregulation
in normal humans. Am J Physiol. 1989;256:E844–E851.25. Gerich J, Cryer P, Rizza R. Hormonal mechanisms in acute glucose counterregulation: the relative roles of glucagon,
epinephrine, norepinephrine, growth hormone and cortisol. Metabolism. 1980;29(Suppl 1):1164–1175.26. Rizza R, Cryer P, Haymond M, Gerich J. Adrenergic mechanisms of catecholamine action on glucose homeostasis in man.
Metabolism. 1980;29(Suppl):1155–1163.27. Stumvoll M, Chintalapudi U, Perriello G, Welle S, Gutierrez O, Gerich J. Uptake and release of glucose by the human kidney:
postabsorptive rates and responses to epinephrine. J Clin Invest. 1995;96:2528–2533.28. DeFeo P, Perriello G, Torlone E, et al. Contribution of adrenergic mechanisms to glucose counterregulation in humans. Am J
Physiol. 1991;261:E725–E736.29. Rizza R, Mandarino L, Gerich J. Effects of growth hormone on insulin action in man: mechanisms of insulin resistance,
impaired suppression of glucose production and impaired stimulation of glucose utilization. Diabetes. 1982;31:663–669.30. DeFeo P, Perriello G, Torlone E, et al. Demonstration of a role of growth hormone in glucose counterregulation. Am J Physiol.
1989;256:E835–E843.31. DeFeo P, Perriello G, Torlone E, et al. Contribution of cortisol to glucose counterregulation in humans. Am J Physiol.
1989;257:E35–E42.32. Fanelli C, Calderone S, Epifano L, et al. Demonstration of a critical role for free fatty acids in mediating counterregulatory
stimulation of gluconeogenesis and suppression of glucose utilization in humans. J Clin Invest. 1993;92:1617–1622.33. Cahill G. Starvation in man. N Engl J Med. 1970;282:668–675.34. Havel R. Caloric homeostasis and disorders of fuel transport. N Engl J Med. 1972;287:1186–1192.35. Boden G. Role of fatty acids in the pathogenesis of insulin resistance and NIDDM. Diabetes. 1997;46:3–10.36. McGarry J. Glucose-fatty acid interactions in health and disease. Am J Clin Nutr. 1998;67(3 Suppl):500S–504S.37. Baggio LL, Drucker DJ. Biology of incretins: GLP-1 and GIP. Gastroenterology. 2007;132:2131–2157.38. Brown JC, Dryburgh JR, Ross SA, Dupre J. Identification and actions of gastric inhibitory polypeptide. Recent Prog Horm Res.
1975;31:487–532.39. Nauck MA, Heimesaat MM, Behle K, et al. Effects of glucagon-like peptide 1 on counterregulatory hormone responses, cogni-
tive functions, and insulin secretion during hyperinsulinemic, stepped hypoglycemic clamp experiments in healthy volunteers.J Clin Endocrinol Metab. 2002;87:1239–1246.
40. Rayner CK, Samsom M, Jones KL, Horowitz M. Relationships of upper gastrointestinal motor and sensory function withglycemic control. Diabetes Care. 2001;24:371–381.
41. Horowitz M, Edelbroek MA, Wishart JM, Straathof JW. Relationship between oral glucose tolerance and gastric emptying innormal healthy subjects. Diabetologia. 1993;36:857–862.
42. Jones KL, Horowitz M, Carney BI, Wishart JM, Guha S, Green L. Gastric emptying in early noninsulin-dependent diabetesmellitus. J Nucl Med. 1996;37:1643–1648.
43. MacGregor IL, Gueller R, Watts HD, Meyer JH. The effect of acute hyperglycemia on gastric emptying in man.Gastroenterology. 1976;70:190–196.
44. Bjornsson ES, Urbanavicius V, Eliasson B, Attvall S, Smith U, Abrahamsson H. Effects of hyperglycemia on interdigestivegastrointestinal motility in humans. Scand J Gastroenterol. 1994;29:1096–1104.
45. Karamanlis A, Chaikomin R, Doran S, et al. Effects of protein on glycemic and incretin responses and gastric emptying afteroral glucose in healthy subjects. Am J Clin Nutr. 2007;86:1364–1368.
46. Gentilcore D, Chaikomin R, Jones KL, et al. Effects of fat on gastric emptying of and the glycemic, insulin, and incretinresponses to a carbohydrate meal in type 2 diabetes. J Clin Endocrinol Metab. 2006;91:2062–2067.
47. Mueckler M. Family of glucose-transporter genes implications for glucose homeostasis and diabetes. Diabetes. 1990;39:6–11.48. Cushman S, Wardzala L. Potential mechanism of insulin action on glucose transport in the isolated rat adipose cell. Apparent
translocation of intracellular transport systems to the plasma membrane. J Biochem. 1980;255:4728–4762.49. Bouche C, Serdy S, Kahn CR, Goldfine AB. The cellular fate of glucose and its relevance in type 2 diabetes. Endocr Rev.
2004;25:807–830.50. Gottesman I, Mandarino L, Gerich J. Use of glucose uptake and glucose clearance for the evaluation of insulin action in vivo.
Diabetes. 1984;33:184–191.

34 M.Z. Shrayyef and J.E. Gerich
51. Rodnick KJ, Piper RC, Slot JW, James DE. Interaction of insulin and exercise on glucose transport in muscle. Diabetes Care.1992;15:1679–1689.
52. Wright EM. Renal Na(+)-glucose cotransporters. Am J Physiol Renal Physiol. 2001;280:F10–F18.53. Gerich J. Hepatorenal glucose reciprocity in physiologic and pathologic conditions. Diab Nutr Metab. 2002;15:298–302.54. Meyer C, Stumvoll M, Nadkarni V, Dostou J, Mitrakou A, Gerich J. Abnormal renal and hepatic glucose metabolism in type 2
diabetes mellitus. J Clin Invest. 1998;102:619–624.55. Stumvoll M, Meyer C, Kreider M, Perriello G, Gerich J. Effects of glucagon on renal and hepatic glutamine gluconeogenesis
in normal postabsorptive humans. Metabolism. 1998;47:1227–1232.56. Stumvoll M, Meyer C, Perriello G, Kreider M, Welle S, Gerich J. Human kidney and liver gluconeogenesis: evidence for organ
substrate selectivity. Am J Physiol. 1998;274:E817–E826.57. Cersosimo E, Garlick P, Ferretti J. Renal glucose production during insulin-induced hypoglycemia in humans. Diabetes.
1999;48:261–266.58. Cersosimo E, Garlick P, Ferretti J. Insulin regulation of renal glucose metabolism in humans. Am J Physiol. 1999;276:E78–E84.59. Ekberg K, Landau B, Wajngot A, et al. Contributions by kidney and liver to glucose production in the postabsorptive state and
after 60 h of fasting. Diabetes. 1999;48:292–298.60. Cersosimo E, Garlick P, Ferretti J. Regulation of splanchnic and renal substrate supply by insulin in humans. Metabolism.
2000;49:676–683.61. Cersosimo E, Garlick P, Ferretti J. Renal substrate metabolism and gluconeogenesis during hypoglycemia in humans. Diabetes.
2000;49:1186–1193.62. Moller N, Rizza R, Ford G, Nair K. Assessment of postabsorptive renal glucose metabolism in humans with multiple glucose
tracers. Diabetes. 2001;50:747–751.63. Meyer C, Dostou J, Welle S, Gerich J. Role of human liver, kidney and skeletal muscle in postprandial glucose homeostasis.
Am J Physiol Endocrinol Metab. 2002;282:E419–E427.64. Garcia-Ruiz J, Moreno F, Sanchez-Medina F, Mayor F. Stimulation of rat kidney phosphoenolpyruvate carboxykinase activity
in experimental liver disease induced by galactosamine. FEBS Lett. 1973;34:13–16.65. Bergman H, Drury DR. The relationship of kidney function to the glucose utilization of the extra abdominal tissues. Am J
Physiol. 1938;124:279–284.66. Drury D, Wick A, MacKay E. Formation of glucose by the kidney. Am J Physiol. 1950;165:655–661.67. Joseph S, Heaton N, Potter D, Pernet A, Umpleby M, Amiel S. Renal glucose production compensates for the liver during the
anhepatic phase of liver transplantation. Diabetes. 2000;49:450–456.68. Battezzati A, Fattorini A, Caumo A, et al. Non-hepatic glucose production in humans. Diabetes. 1999;48(Suppl 1):A49
(Abstract).69. Schoolwerth A, Smith B, Culpepper R. Renal gluconeogenesis. Min Electr Metab. 1988;14:347–361.70. Iles R, Cohen R, Rist A, Baron P. The mechanism of inhibition by acidosis of gluconeogenesis from lactate in rat liver. Biochem
J. 1977;164:185–191.71. Aber G, Morris L, Housley E. Gluconeogenesis by the human kidney. Nature. 1966;212:1589–1590.72. Gerich J. Hypoglycaemia and counterregulation in type 2 diabetes. Lancet. 2000;356:1946–1947.73. Meyer C, Dostou J, Gerich J. Role of the human kidney in glucose counterregulation. Diabetes. 1999;48:943–948.74. Cersosimo E, Garlick P, Ferretti J. Abnormal glucose handling by the kidney in response to hypoglycemia in type 1 diabetes.
Diabetes. 2001;50:2087–2093.75. Woerle HJ, Meyer C, Popa E, Cryer P, Gerich J. Renal compensation for impaired hepatic glucose release during hypoglycemia
in type 2 diabetes. Diabetologia. 2001;44(Suppl 1):A67 (Abstract).76. Stumvoll M, Meyer C, Mitrakou A, Nadkarni V, Gerich J. Renal glucose production and utilization: new aspects in humans.
Diabetologia. 1997;40:749–757.77. Landau B, Wahren J, Chandramouli V, Schuman W, Ekberg K, Kalhan S. Contributions of gluconeogenesis to glucose
production in the fasted state. J Clin Invest. 1996;98:378–385.78. Nilsson L, Hultman E. Liver glycogen in man – the effect of total starvation or a carbohydrate-poor diet followed by refeeding.
Scand J Clin Lab Invest. 1973;32:325–330.79. Perriello G, Jorde R, Nurjhan N, et al. Estimation of the glucose-alanine-lactate-glutamine cycles in postabsorptive man: role
of the skeletal muscle. Am J Physiol. 1995;269:E443–E450.80. McMahon M, Marsh H, Rizza R. Comparison of the pattern of postprandial carbohydrate metabolism after ingestion of a
glucose drink or a mixed meal. J Clin Endocrinol Metab. 1989;68:647–653.81. Dinneen S, Gerich J, Rizza R. Carbohydrate metabolism in noninsulin-dependent diabetes mellitus. N Engl J Med.
1992;327:707–713.82. Marin P, Hogh-Kristiansen I, Jansson S, Krotkiewski M, Holm G, Bjorntorp P. Uptake of glucose carbon in muscle glycogen
and adipose tissue triglycerides in vivo in humans. Am J Physiol. 1992;263:E473–E480.83. Meyer C, Dostou J, Welle S, Gerich J. Role of liver, kidney and skeletal muscle in the disposition of an oral glucose load.
Diabetes. 1999;48(Suppl 1):A289 (Abstract).84. Kelley D, Mokan M, Veneman T. Impaired postprandial glucose utilization in non-insulin-dependent diabetes mellitus.
Metabolism. 1994;43:1549–1557.

2 Normal Glucose Homeostasis 35
85. Butler P, Kryshak E, Rizza R. Mechanism of growth hormone-induced postprandial carbohydrate intolerance in humans. Am JPhysiol. 1991;260:E513–E520.
86. Ferrannini E, Bjorkman O, Reichard G, et al. The disposal of an oral glucose load in healthy subjects: a quantitative study.Diabetes. 1985;34:580–588.
87. Jackson R, Roshania R, Hawa M, Sim B, DiSilvio L. Impact of glucose ingestion on hepatic and peripheral glucose metabolismin man: an analysis based on simultaneous use of the forearm and double isotope techniques. J Clin Endocrinol Metab.1986;63:541–549.
88. McMahon M, Marsh H, Rizza R. Effects of basal insulin supplementation on disposition of a mixed meal in obese patients withNIDDM. Diabetes. 1989;38:291–303.
89. Mitrakou A, Kelley D, Mokan M, et al. Role of reduced suppression of glucose production and diminished early insulin releasein impaired glucose tolerance. N Engl J Med. 1992;326:22–29.
90. Beckmann N, Fried R, Turkalj I, Seelig J, Keller U, Stalder G. Noninvasive observation of hepatic glycogen formation in manby 13C MRS after oral and intravenous glucose administration. Magn Reson Med. 1993;29:583–590.
91. Petersen K, Cline G, Gerard D, Magnusson I, Rothman D, Shulman G. Contribution of net hepatic glycogen synthesis todisposal of an oral glucose load in humans. Metabolism. 2001;50:598–601.
92. Taylor R, Magnusson I, Rothman D. Direct assessment of liver glycogen storage by 13C nuclear magnetic resonancespectroscopy and regulation of glucose homeostasis after a mixed meal in normal subjects. J Clin Invest. 1996;97:126–132.
93. Mitrakou A, Jones R, Okuda Y, et al. Pathway and carbon sources for hepatic glycogen repletion in the dog. Am J Physiol.1991;260:E194–E202.
94. Firth R, Bell P, Marsh H, Hansen I, Rizza R. Postprandial hyperglycemia in patients with noninsulin-dependent diabetesmellitus. Role of hepatic and extrahepatic tissues. J Clin Invest. 1986;77:1525–1532.
95. Taylor R, Price T, Katz L, Shulman R, Shulman G. Direct measurement of change in muscle glycogen concentration after amixed meal in normal subjects. Am J Physiol. 1993;265:E224–E229.
96. Radziuk J, Inculet R. The effects of ingested and intravenous glucose on forearm uptake of glucose and glucogenic substrate innormal man. Diabetes. 1983;32:977–981.
97. Ferrannini E, Wahren J, Felig P, DeFronzo R. The role of fractional glucose extraction in the regulation of splanchnic glucosemetabolism in normal and diabetic man. Metabolism. 1980;29:28–35.

http://www.springer.com/978-0-387-09840-1