Embed Size (px)
Citation preview
0 0 M o n t h 2 0 1 6 | V o L 0 0 0 | n A t U R E | 1
LEttERdoi:10.1038/nature17655
Normalizing the environment recapitulates adult human immune traits in laboratory miceLalit K. Beura1, Sara E. hamilton2, Kevin Bi3, Jason M. Schenkel1, oludare A. odumade2†, Kerry A. Casey1†, Emily A. thompson1, Kathryn A. Fraser1, Pamela C. Rosato1, Ali Filali-Mouhim4, Rafick P. Sekaly4, Marc K. Jenkins1, Vaiva Vezys1, W. nicholas haining3, Stephen C. Jameson2 & David Masopust1
Our current understanding of immunology was largely defined in laboratory mice, partly because they are inbred and genetically homogeneous, can be genetically manipulated, allow kinetic tissue analyses to be carried out from the onset of disease, and permit the use of tractable disease models. Comparably reductionist experiments are neither technically nor ethically possible in humans. However, there is growing concern that laboratory mice do not reflect relevant aspects of the human immune system, which may account for failures to translate disease treatments from bench to bedside1–8. Laboratory mice live in abnormally hygienic specific pathogen free (SPF) barrier facilities. Here we show that standard laboratory mouse husbandry has profound effects on the immune system and that environmental changes produce mice with immune systems closer to those of adult humans. Laboratory mice—like newborn, but not adult, humans—lack effector-differentiated and mucosally distributed memory T cells. These cell populations were present in free-living barn populations of feral mice and pet store mice with diverse microbial experience, and were induced in laboratory mice after co-housing with pet store mice, suggesting that the environment is involved in the induction of these cells. Altering the living conditions of mice profoundly affected the cellular composition of the innate and adaptive immune systems, resulted in global changes in blood cell gene expression to patterns that more closely reflected the immune signatures of adult humans rather than neonates, altered resistance to infection, and influenced T-cell differentiation in response to a de novo viral infection. These data highlight the effects of environment on the basal immune state and response to infection and suggest that restoring physiological microbial exposure in laboratory mice could provide a relevant tool for modelling immunological events in free-living organisms, including humans.
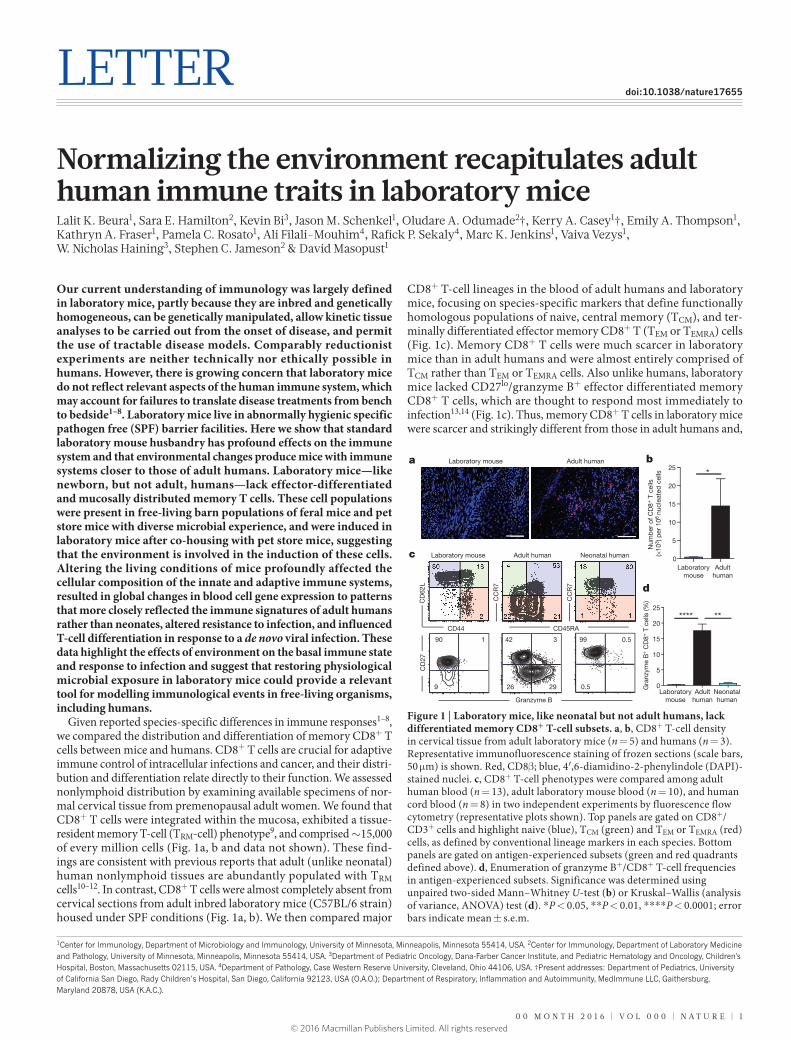
Given reported species-specific differences in immune responses1–8, we compared the distribution and differentiation of memory CD8+ T cells between mice and humans. CD8+ T cells are crucial for adaptive immune control of intracellular infections and cancer, and their distri-bution and differentiation relate directly to their function. We assessed nonlymphoid distribution by examining available specimens of nor-mal cervical tissue from premenopausal adult women. We found that CD8+ T cells were integrated within the mucosa, exhibited a tissue- resident memory T-cell (TRM-cell) phenotype9, and comprised ~15,000 of every million cells (Fig. 1a, b and data not shown). These find-ings are consistent with previous reports that adult (unlike neonatal) human nonlymphoid tissues are abundantly populated with TRM cells10–12. In contrast, CD8+ T cells were almost completely absent from cervical sections from adult inbred laboratory mice (C57BL/6 strain) housed under SPF conditions (Fig. 1a, b). We then compared major
CD8+ T-cell lineages in the blood of adult humans and laboratory mice, focusing on species-specific markers that define functionally homologous populations of naive, central memory (TCM), and ter-minally differentiated effector memory CD8+ T (TEM or TEMRA) cells (Fig. 1c). Memory CD8+ T cells were much scarcer in laboratory mice than in adult humans and were almost entirely comprised of TCM rather than TEM or TEMRA cells. Also unlike humans, laboratory mice lacked CD27lo/granzyme B+ effector differentiated memory CD8+ T cells, which are thought to respond most immediately to infection13,14 (Fig. 1c). Thus, memory CD8+ T cells in laboratory mice were scarcer and strikingly different from those in adult humans and,
1Center for Immunology, Department of Microbiology and Immunology, University of Minnesota, Minneapolis, Minnesota 55414, USA. 2Center for Immunology, Department of Laboratory Medicine and Pathology, University of Minnesota, Minneapolis, Minnesota 55414, USA. 3Department of Pediatric Oncology, Dana-Farber Cancer Institute, and Pediatric Hematology and Oncology, Children's Hospital, Boston, Massachusetts 02115, USA. 4Department of Pathology, Case Western Reserve University, Cleveland, Ohio 44106, USA. †Present addresses: Department of Pediatrics, University of California San Diego, Rady Children’s Hospital, San Diego, California 92123, USA (O.A.O.); Department of Respiratory, Inflammation and Autoimmunity, MedImmune LLC, Gaithersburg, Maryland 20878, USA (K.A.C.).
18 80
1 1
80 18 4 53
22 21
a b
CD45RA
CC
R7
Granzyme B
CD44
CD
62L
42 3
26 29
CD
27
99 0.5
0.5
90 1
9
0
5
10
15
20
25
Num
ber
of C
D8+
T c
ells
(×
103 )
per
106
nucl
eate
d c
ells
0
5
10
15
20
25
Gra
nzym
e B
+ C
D8+
T c
ells
(%)
*
2
Laboratorymouse
Adulthuman
Laboratorymouse
Adulthuman
Neonatalhuman
d
c
**** **
Laboratory mouse Adult human Neonatal human
Laboratory mouse Adult human
CC
R7
Figure 1 | Laboratory mice, like neonatal but not adult humans, lack differentiated memory CD8+ T-cell subsets. a, b, CD8+ T-cell density in cervical tissue from adult laboratory mice (n = 5) and humans (n = 3). Representative immunofluorescence staining of frozen sections (scale bars, 50 μm) is shown. Red, CD8β; blue, 4′,6-diamidino-2-phenylindole (DAPI)-stained nuclei. c, CD8+ T-cell phenotypes were compared among adult human blood (n = 13), adult laboratory mouse blood (n = 10), and human cord blood (n = 8) in two independent experiments by fluorescence flow cytometry (representative plots shown). Top panels are gated on CD8+/CD3+ cells and highlight naive (blue), TCM (green) and TEM or TEMRA (red) cells, as defined by conventional lineage markers in each species. Bottom panels are gated on antigen-experienced subsets (green and red quadrants defined above). d, Enumeration of granzyme B+/CD8+ T-cell frequencies in antigen-experienced subsets. Significance was determined using unpaired two-sided Mann–Whitney U-test (b) or Kruskal–Wallis (analysis of variance, ANOVA) test (d). *P < 0.05, **P < 0.01, ****P < 0.0001; error bars indicate mean ± s.e.m.
© 2016 Macmillan Publishers Limited. All rights reserved
2 | n A t U R E | V o L 0 0 0 | 0 0 M o n t h 2 0 1 6
LetterreSeArCH
in fact, appeared much more similar to those of neonatal humans (Fig. 1c, d and Extended Data Fig. 1).
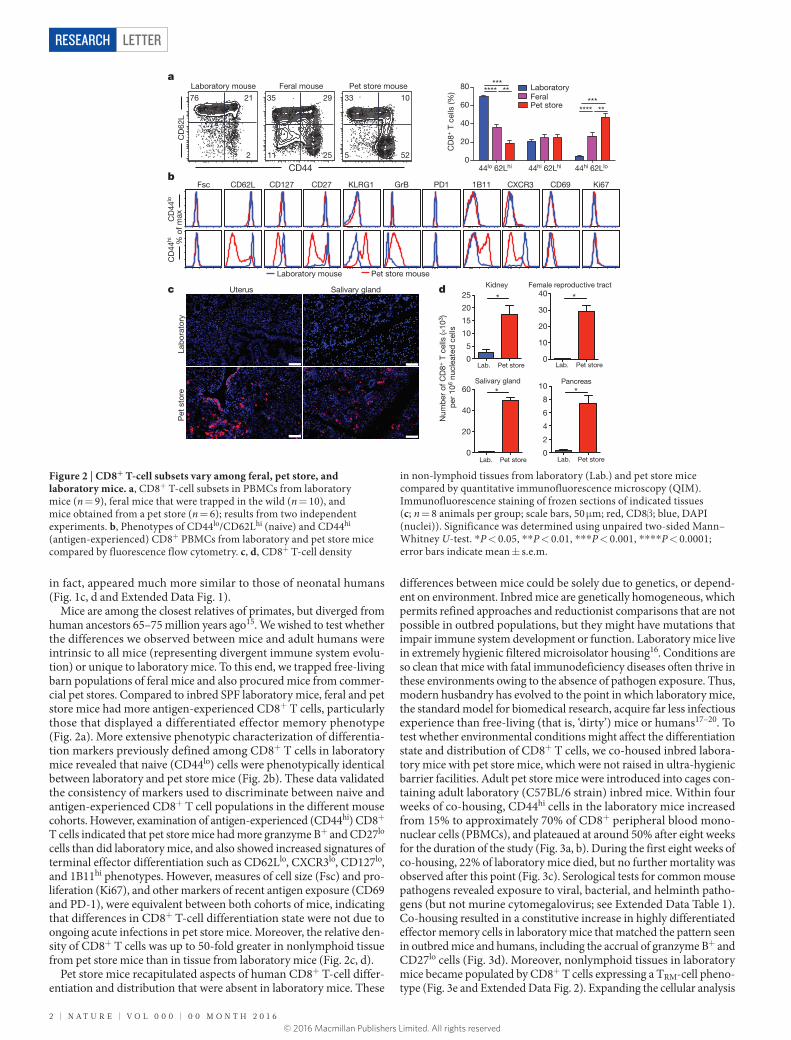
Mice are among the closest relatives of primates, but diverged from human ancestors 65–75 million years ago15. We wished to test whether the differences we observed between mice and adult humans were intrinsic to all mice (representing divergent immune system evolu-tion) or unique to laboratory mice. To this end, we trapped free-living barn populations of feral mice and also procured mice from commer-cial pet stores. Compared to inbred SPF laboratory mice, feral and pet store mice had more antigen-experienced CD8+ T cells, particularly those that displayed a differentiated effector memory phenotype (Fig. 2a). More extensive phenotypic characterization of differentia-tion markers previously defined among CD8+ T cells in laboratory mice revealed that naive (CD44lo) cells were phenotypically identical between laboratory and pet store mice (Fig. 2b). These data validated the consistency of markers used to discriminate between naive and antigen-experienced CD8+ T cell populations in the different mouse cohorts. However, examination of antigen-experienced (CD44hi) CD8+ T cells indicated that pet store mice had more granzyme B+ and CD27lo cells than did laboratory mice, and also showed increased signatures of terminal effector differentiation such as CD62Llo, CXCR3lo, CD127lo, and 1B11hi phenotypes. However, measures of cell size (Fsc) and pro-liferation (Ki67), and other markers of recent antigen exposure (CD69 and PD-1), were equivalent between both cohorts of mice, indicating that differences in CD8+ T-cell differentiation state were not due to ongoing acute infections in pet store mice. Moreover, the relative den-sity of CD8+ T cells was up to 50-fold greater in nonlymphoid tissue from pet store mice than in tissue from laboratory mice (Fig. 2c, d).
Pet store mice recapitulated aspects of human CD8+ T-cell differ-entiation and distribution that were absent in laboratory mice. These
differences between mice could be solely due to genetics, or depend-ent on environment. Inbred mice are genetically homogeneous, which permits refined approaches and reductionist comparisons that are not possible in outbred populations, but they might have mutations that impair immune system development or function. Laboratory mice live in extremely hygienic filtered microisolator housing16. Conditions are so clean that mice with fatal immunodeficiency diseases often thrive in these environments owing to the absence of pathogen exposure. Thus, modern husbandry has evolved to the point in which laboratory mice, the standard model for biomedical research, acquire far less infectious experience than free-living (that is, ‘dirty’) mice or humans17–20. To test whether environmental conditions might affect the differentiation state and distribution of CD8+ T cells, we co-housed inbred labora-tory mice with pet store mice, which were not raised in ultra-hygienic barrier facilities. Adult pet store mice were introduced into cages con-taining adult laboratory (C57BL/6 strain) inbred mice. Within four weeks of co-housing, CD44hi cells in the laboratory mice increased from 15% to approximately 70% of CD8+ peripheral blood mono-nuclear cells (PBMCs), and plateaued at around 50% after eight weeks for the duration of the study (Fig. 3a, b). During the first eight weeks of co-housing, 22% of laboratory mice died, but no further mortality was observed after this point (Fig. 3c). Serological tests for common mouse pathogens revealed exposure to viral, bacterial, and helminth patho-gens (but not murine cytomegalovirus; see Extended Data Table 1). Co-housing resulted in a constitutive increase in highly differentiated effector memory cells in laboratory mice that matched the pattern seen in outbred mice and humans, including the accrual of granzyme B+ and CD27lo cells (Fig. 3d). Moreover, nonlymphoid tissues in laboratory mice became populated by CD8+ T cells expressing a TRM-cell pheno-type (Fig. 3e and Extended Data Fig. 2). Expanding the cellular analysis
CD
44lo
Lab
orat
ory
Pet
sto
re
Uterus
44lo 62Lhi 44hi 62Lhi 44hi 62Llo0
20
40
60
80
*
*
CD
8+ T
cel
ls (%
)Lab. Pet store
*
5
10
15
20
25
0
*
10
0
20
30
40
0
20
40
60
4
0
2
6
8
10
Num
ber
of C
D8+
T c
ells
(×10
3 )
per
106
nucl
eate
d c
ells
CD44C
D62
L
Laboratory Feral Pet store
a
b
Lab. Pet store
c d
***76 21 35 29 33 10
2 11 25 5 52
Laboratory mouse Feral mouse Pet store mouse
Laboratory mouse Pet store mouse
Salivary gland
Fsc CD62L CD127 CD27 KLRG1 GrB PD1 1B11 CXCR3 CD69 Ki67
Kidney Female reproductive tract
Lab. Pet store Lab. Pet store
Salivary gland Pancreas
CD
44hi %
of m
ax
**** **
******* **
Figure 2 | CD8+ T-cell subsets vary among feral, pet store, and laboratory mice. a, CD8+ T-cell subsets in PBMCs from laboratory mice (n = 9), feral mice that were trapped in the wild (n = 10), and mice obtained from a pet store (n = 6); results from two independent experiments. b, Phenotypes of CD44lo/CD62Lhi (naive) and CD44hi (antigen-experienced) CD8+ PBMCs from laboratory and pet store mice compared by fluorescence flow cytometry. c, d, CD8+ T-cell density
in non-lymphoid tissues from laboratory (Lab.) and pet store mice compared by quantitative immunofluorescence microscopy (QIM). Immunofluorescence staining of frozen sections of indicated tissues (c; n = 8 animals per group; scale bars, 50 μm; red, CD8β; blue, DAPI (nuclei)). Significance was determined using unpaired two-sided Mann–Whitney U-test. *P < 0.05, **P < 0.01, ***P < 0.001, ****P < 0.0001; error bars indicate mean ± s.e.m.
© 2016 Macmillan Publishers Limited. All rights reserved
0 0 M o n t h 2 0 1 6 | V o L 0 0 0 | n A t U R E | 3
Letter reSeArCH
beyond CD8+ T cells revealed extensive and profound changes to many innate and adaptive immune cell lineages in diverse tissues from co-housed laboratory mice and increased levels of serum antibodies (Fig. 3f, g and Extended Data Fig. 2). Furthermore, principal compo-nent analysis of PBMC gene expression data in the space of all detected genes (~18,000) revealed a spatial shift of co-housed samples away from laboratory samples and towards pet store samples along the first principal component (PC1; Fig. 3h). Together, these data demonstrate that co-housing profoundly altered the status of the immune system.
Our data suggested that the immune systems of laboratory mice have features in common with those of neonatal humans, and that altering the environment reproduced phenotypic immune signatures of adult humans. To test this hypothesis more broadly, we queried expression- profiling data from maternal and neonatal cord PBMCs from an unaffiliated study21 with pet store versus laboratory and co-housed versus laboratory mouse signatures using gene set enrichment ana lysis (GSEA; Fig. 4a, b). The top 400 genes that were upregulated in pet store mice showed highly significant enrichment in adult human expression data, whereas the top 400 downregulated genes showed enrichment in neonatal humans. Laboratory mice acquired this gene expression program after co-housing.
To more deeply investigate similarities in transcriptional patterns among pet store mice, co-housed mice, and adult humans compared
with laboratory mice and neonatal humans, we applied GSEA with the ImmuneSigDB database of immunological signatures22. We then used leading-edge metagene analysis of GSEA results to identify modules of coregulated genes that were upregulated in human adult versus cord PBMCs, and those found in pairwise comparisons of laboratory, pet store, and co-housed mice. Overlap between the resulting metagenes was used to identify global similarities between each data set. We observed highly significant overlaps between metagenes that were upregulated in adult PBMCs compared with cord PBMCs and metagenes that were upregulated in PBMCs from pet store or co-housed mice compared with laboratory mice. These included numerous pathways related to innate and adaptive immune functions (Fig. 4c, Extended Data Fig. 3 and Supplementary Tables 1 and 2). Conversely, metagenes that were upregulated in human cord blood cells overlapped with those upreg-ulated in laboratory mice. Thus, these functional modules represent a major axis of similarity in immune status between pet store mice and adult humans relative to laboratory mice and neonatal humans, and can be conferred on laboratory mice through co-housing with pet store mice.
We next tested whether mouse husbandry affected immune responses. We challenged mice with the intracellular pathogen Listeria monocytogenes, a bacterial infection that is often used to gauge immune function in laboratory mice. Compared to laboratory mice, both pet
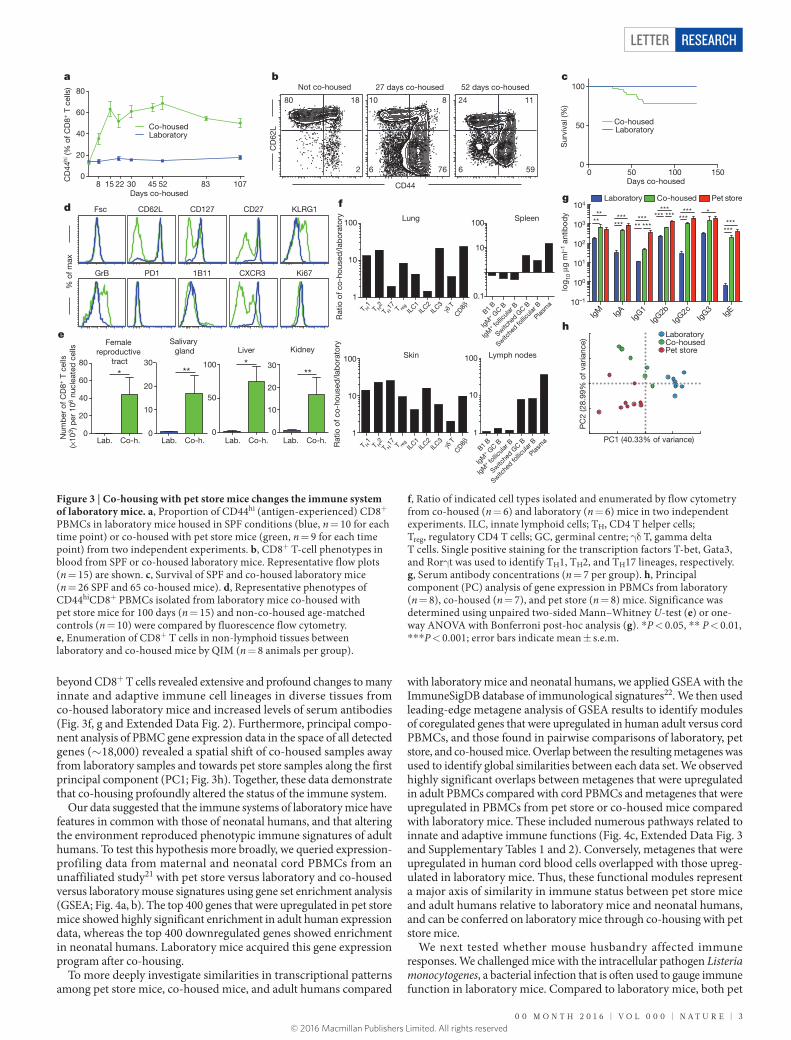
Figure 3 | Co-housing with pet store mice changes the immune system of laboratory mice. a, Proportion of CD44hi (antigen-experienced) CD8+ PBMCs in laboratory mice housed in SPF conditions (blue, n = 10 for each time point) or co-housed with pet store mice (green, n = 9 for each time point) from two independent experiments. b, CD8+ T-cell phenotypes in blood from SPF or co-housed laboratory mice. Representative flow plots (n = 15) are shown. c, Survival of SPF and co-housed laboratory mice (n = 26 SPF and 65 co-housed mice). d, Representative phenotypes of CD44hiCD8+ PBMCs isolated from laboratory mice co-housed with pet store mice for 100 days (n = 15) and non-co-housed age-matched controls (n = 10) were compared by fluorescence flow cytometry. e, Enumeration of CD8+ T cells in non-lymphoid tissues between laboratory and co-housed mice by QIM (n = 8 animals per group).
f, Ratio of indicated cell types isolated and enumerated by flow cytometry from co-housed (n = 6) and laboratory (n = 6) mice in two independent experiments. ILC, innate lymphoid cells; TH, CD4 T helper cells; Treg, regulatory CD4 T cells; GC, germinal centre; γδ T, gamma delta T cells. Single positive staining for the transcription factors T-bet, Gata3, and Rorγt was used to identify TH1, TH2, and TH17 lineages, respectively. g, Serum antibody concentrations (n = 7 per group). h, Principal component (PC) analysis of gene expression in PBMCs from laboratory (n = 8), co-housed (n = 7), and pet store (n = 8) mice. Significance was determined using unpaired two-sided Mann–Whitney U-test (e) or one-way ANOVA with Bonferroni post-hoc analysis (g). *P < 0.05, ** P < 0.01, ***P < 0.001; error bars indicate mean ± s.e.m.
IgM IgA IgG1
IgG2b
IgG2c
IgG3
IgE10–1
100
101
102
103
104
log 10
μg
ml–1
ant
ibo
dy
Laboratory Co-housed Pet store
****
******
*****
***
****
***
80 18 10
2 6 6
8
76 59
24 11
CD
62L
0
20
40
60
80
CD
44hi (%
of C
D8+
T c
ells
)
0 50 100 1500
50
100
Liver
***
0
20
40
60
80
0
20
10
30
0
50
100
0
20
10
30***
Co-housed Laboratory
Salivary gland
Days co-housed
Sur
viva
l (%
)
a
Co-housed Laboratory
b c
d
e
% o
f max
fDays co-housed
8 15 22 30 45 52 83 107
Kidney Female
reproductive tract
Fsc CD62L CD127 CD27 KLRG1
GrB PD1 1B11 CXCR3 Ki67
Lab. Co-h. Lab. Co-h. Lab. Co-h. Lab. Co-h. PC1 (40.33% of variance)
PC
2 (2
8.99
% o
f var
ianc
e)
1
10
100
0.1
1
10
100
1
10
100
Rat
io o
f co-
hous
ed/la
bor
ator
y Spleen
Lymph nodes
1
10
100
Lung
Skin
B1 B
IgM+ G
C B
IgM+ fo
llicula
r B
Switche
d GC B
Switche
d follic
ular B
Plas
ma
B1 B
IgM+ G
C B
IgM+ fo
llicula
r B
Switche
d GC B
Switche
d follic
ular B
Plas
ma
T H1
T H2
T H17 T re
gILC
1ILC
2ILC
3
CD8βγδ T
T H1
T H2
T H17 T re
gILC
1ILC
2ILC
3
CD8βγδ T
Rat
io o
f co-
hous
ed/la
bor
ator
y
Pet store
LaboratoryCo-housed
h
Not co-housed 27 days co-housed 52 days co-housed
CD44
g
*********
*** ***
Num
ber
of C
D8+
T c
ells
(×
103 )
per
106
nucl
eate
d c
ells
© 2016 Macmillan Publishers Limited. All rights reserved
4 | n A t U R E | V o L 0 0 0 | 0 0 M o n t h 2 0 1 6
LetterreSeArCH
store and co-housed mice exhibited a >10,000-fold reduction in bac-terial burden three days after the challenge, and this matched bacterial control in laboratory mice that had been previously vaccinated against L. monocytogenes (Fig. 4d and Extended Data Fig. 4a). Hence, C57BL/6 mice that had experienced physiological exposure to environmental microbes exhibited considerably more innate resistance to L. monocytogenes infection than indicated from studies using SPF laboratory mice. The effect of mouse husbandry on infection control extended to a cere-bral malaria model (Plasmodium berghei ANKA; Fig. 4e and Extended Data Fig. 4b). Lymphocytic choriomeningitis virus infection (LCMV)
is often used to investigate critical aspects of adaptive T-cell differen-tiation, including the regulation of memory precursor versus short-lived effector cell (MPEC versus SLEC) development23,24. We observed that the proportions of MPECs and SLECs in LCMV-infected mice were significantly altered by mouse husbandry (Fig. 4f and Extended Data Fig. 4c).
Experiments in mice have informed much of our understanding of immune regulation, and have directly contributed to the development of life-saving clinical therapies. However, our study reveals an unan-ticipated impact of SPF husbandry on the immune system. Our results
GO enrichment (–log10 P)400
Adult vs neonatal
Co-housed vs laboratory
Neonatal vs adult
Laboratory vs pet store
Laboratory vs co-housed
Typ
e I i
nter
fero
n si
gnal
ling
pat
hway
Reg
ulat
ion
of t
ype
I int
erfe
ron
pro
duc
tion
Pos
itive
reg
ulat
ion
of c
ell d
eath
Res
pon
se t
o in
terf
eron
-βR
esp
onse
to
inte
rfer
on-α
Reg
ulat
ion
of le
ukoc
yte
deg
ranu
latio
n
Reg
ulat
ion
of m
ast
cell
activ
atio
nP
ositi
ve r
egul
atio
n of
T-c
ell p
rolif
erat
ion
Reg
ulat
ion
of m
ast
cell
deg
ranu
latio
n
Pro
tein
loca
lizat
ion
to E
Rm
RN
A c
atab
olic
pro
cess
rRN
A m
etab
olic
pro
cess
GO terms
Ant
igen
pre
sent
atio
n vi
a M
HC
I
Pos
itive
reg
ulat
ion
of s
igna
l tra
nsd
uctio
n
Pos
itive
reg
ulat
ion
of c
ytok
ine
pro
duc
tion
Reg
ulat
ion
of in
terle
ukin
-6 p
rod
uctio
n
α-am
ino
acid
met
abol
ic p
roce
ss
Mac
rom
olec
ule
met
abol
ic p
roce
ss
a
c d
e
*****
Laboratory Co-housed Pet store
Par
asita
emia
(%)
FDR q < 0.001P < 0.001
FDR q < 0.001P < 0.001
FDR q < 0.001P < 0.001
FDR q < 0.001P < 0.001
0.00.10.20.30.40.50.6
0.0–0.1–0.2–0.3–0.4–0.5–0.6
0.0–0.1–0.2–0.3–0.4–0.5–0.6
Enr
ichm
ent
scor
e
0.00.10.20.30.40.50.6
Gene rank Gene rank
AdultPBMC
NeonatalPBMC
AdultPBMC
NeonatalPBMC
Metagene overlap(–log10 P)
600
Adult PBMC
Cord PBMC
Pet store orco-housed PBMC
Laboratory PBMC
Enrichment analysis of mouse signatures in
human adult and neonates
0
20
40
60
80
****
****
MPECs SLECs
H-2
Db/g
p33
+ C
D8+
T c
ells
(%)
0
5
10
15
c.f.u
. per
live
r
104
106
108
LOD
**
NSNS
Laboratory Co-housed Pet storeListeriaimmune
**
b
f
Reg
ulat
ion
of v
iral g
enom
e re
plic
atio
n
Cyt
opla
smic
tra
nsp
ort
Rib
onuc
leop
rote
in c
omp
lex
asse
mb
lyC
ell c
ycle
Mito
chon
dria
l tra
nsla
tiona
l ini
tiatio
n
Pet store vs laboratory
Co-housed Laboratory
Ad
ult
vs n
eona
tal
Co-
hous
ed v
s la
bor
ator
y
Neo
nata
l vs
adul
t
Lab
orat
ory
vs p
et s
tore
Lab
orat
ory
vs c
o-ho
used
Pet
sto
re v
s la
bor
ator
y
Pet store vs laboratory signature
Laboratory vs pet store signature
Laboratory vs co-housed signature
Co-housed vs laboratory signature
Enr
ichm
ent
scor
e
Leuk
ocyt
e ch
emot
axis
T-ce
ll d
iffer
entia
tion
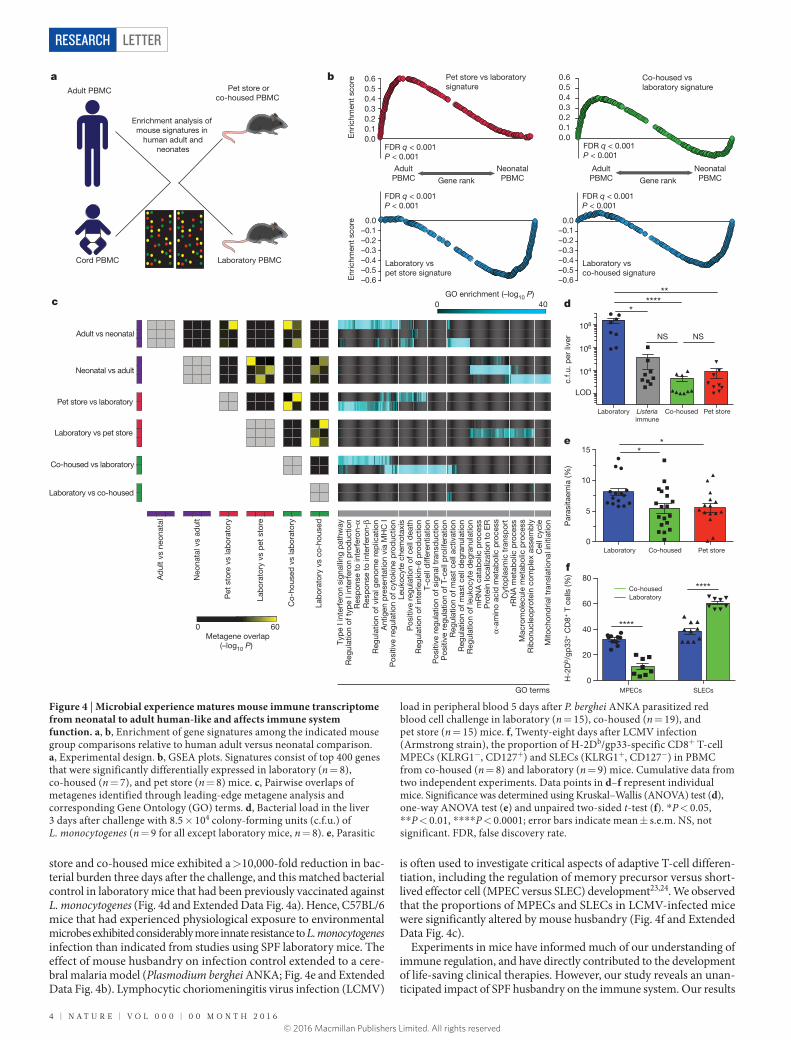
Figure 4 | Microbial experience matures mouse immune transcriptome from neonatal to adult human-like and affects immune system function. a, b, Enrichment of gene signatures among the indicated mouse group comparisons relative to human adult versus neonatal comparison. a, Experimental design. b, GSEA plots. Signatures consist of top 400 genes that were significantly differentially expressed in laboratory (n = 8), co-housed (n = 7), and pet store (n = 8) mice. c, Pairwise overlaps of metagenes identified through leading-edge metagene analysis and corresponding Gene Ontology (GO) terms. d, Bacterial load in the liver 3 days after challenge with 8.5 × 10⁴ colony-forming units (c.f.u.) of L. monocytogenes (n = 9 for all except laboratory mice, n = 8). e, Parasitic
load in peripheral blood 5 days after P. berghei ANKA parasitized red blood cell challenge in laboratory (n = 15), co-housed (n = 19), and pet store (n = 15) mice. f, Twenty-eight days after LCMV infection (Armstrong strain), the proportion of H-2Db/gp33-specific CD8+ T-cell MPECs (KLRG1−, CD127+) and SLECs (KLRG1+, CD127−) in PBMC from co-housed (n = 8) and laboratory (n = 9) mice. Cumulative data from two independent experiments. Data points in d–f represent individual mice. Significance was determined using Kruskal–Wallis (ANOVA) test (d), one-way ANOVA test (e) and unpaired two-sided t-test (f). *P < 0.05, **P < 0.01, ****P < 0.0001; error bars indicate mean ± s.e.m. NS, not significant. FDR, false discovery rate.
© 2016 Macmillan Publishers Limited. All rights reserved
0 0 M o n t h 2 0 1 6 | V o L 0 0 0 | n A t U R E | 5
Letter reSeArCH
do not support an end to SPF studies. However, it is ironic that such an immunologically inexperienced organism has become de rigueur for studies of the immune system, as our data show that this compromises development of a human adult-like immune system. To maximize opportunities to translate novel treatments from preclinical studies to clinical therapies, it may be opportune to add ‘dirty’ mice to our repertoire of investigative tools. Much as the analysis of truly sterile ‘germ-free’ mice has revealed how influential commensal flora are on ‘normal’ physiology and immune system function, our study suggests that the immune system in mice may not be fully ‘normalized’ without more complete microbial exposure10. Indeed, just as many autoimmune diseases do not manifest in genetically predisposed mice in the absence of commensal flora, certain infectious experiences have been shown to induce heterologous and innate immune memory, trigger autoim-mune disease, and affect transplantation tolerance25–30. Forward genetic screens to reveal the function of immunological genes are ongoing in mice, and it might be beneficial to conduct these screens in a dirty mouse model.
More generally, dirty mice might be valuable for investigating aspects of the hygiene hypothesis, immune function and treatments for disease in the settings of transplantation, allergy, autoimmunity, and vaccina-tion, and perhaps in disparate diseases that might involve the immune or inflammatory systems (such as cardiovascular disease and cancer)4. Such mice could supplement current models to either increase trans-lational potential to human disease or to better inform the efficacy of preclinical prophylactic and therapeutic modalities, without sacrificing powerful experimental tools and approaches that cannot be used in human studies.
Online Content Methods, along with any additional Extended Data display items and Source Data, are available in the online version of the paper; references unique to these sections appear only in the online paper.
received 21 January; accepted 11 March 2016.
Published online 20 April 2016.
1. Mestas, J. & Hughes, C. C. W. Of mice and not men: differences between mouse and human immunology. J. Immunol. 172, 2731–2738 (2004).
2. Seok, J. et al. Genomic responses in mouse models poorly mimic human inflammatory diseases. Proc. Natl Acad. Sci. USA 110, 3507–3512 (2013).
3. Shay, T. et al. Conservation and divergence in the transcriptional programs of the human and mouse immune systems. Proc. Natl Acad. Sci. USA 110, 2946–2951 (2013).
4. Mak, I. W., Evaniew, N. & Ghert, M. Lost in translation: animal models and clinical trials in cancer treatment. Am. J. Transl. Res. 6, 114–118 (2014).
5. Rivera, J. & Tessarollo, L. Genetic background and the dilemma of translating mouse studies to humans. Immunity 28, 1–4 (2008).
6. Payne, K. J. & Crooks, G. M. Immune-cell lineage commitment: translation from mice to humans. Immunity 26, 674–677 (2007).
7. von Herrath, M. G. & Nepom, G. T. Lost in translation: barriers to implementing clinical immunotherapeutics for autoimmunity. J. Exp. Med. 202, 1159–1162 (2005).
8. Takao, K. & Miyakawa, T. Genomic responses in mouse models greatly mimic human inflammatory diseases. Proc. Natl Acad. Sci. USA 112, 1167–1172 (2015).
9. Schenkel, J. M. & Masopust, D. Tissue-resident memory T cells. Immunity 41, 886–897 (2014).
10. Thome, J. J. C. et al. Early-life compartmentalization of human T cell differentiation and regulatory function in mucosal and lymphoid tissues. Nature Med. (2016).
11. Thome, J. J. C. et al. Spatial map of human T cell compartmentalization and maintenance over decades of life. Cell 159, 814–828 (2014).
12. Machado, C. S., Rodrigues, M. A. & Maffei, H. V. Gut intraepithelial lymphocyte counts in neonates, infants and children. Acta Paediatr. 83, 1264–1267 (1994).
13. Sallusto, F., Geginat, J. & Lanzavecchia, A. Central memory and effector memory T cell subsets: function, generation, and maintenance. Annu. Rev. Immunol. 22, 745–763 (2004).
14. Olson, J. A., McDonald-Hyman, C., Jameson, S. C. & Hamilton, S. E. Effector-like CD8+ T cells in the memory population mediate potent protective immunity. Immunity 38, 1250–1260 (2013).
15. Mouse Genome Sequencing Consortium Initial sequencing and comparative analysis of the mouse genome. Nature 420, 520–562 (2002).
16. Pritchett-Corning, K. R., Cosentino, J. & Clifford, C. B. Contemporary prevalence of infectious agents in laboratory mice and rats. Lab. Anim. 43, 165–173 (2009).
17. Pedersen, A. B. & Babayan, S. A. Wild immunology. Mol. Ecol. 20, 872–880 (2011).
18. Maizels, R. M. & Nussey, D. H. Into the wild: digging at immunology’s evolutionary roots. Nature Immunol. 14, 879–883 (2013).
19. Cadwell, K. The virome in host health and disease. Immunity 42, 805–813 (2015).
20. Virgin, H. W., Wherry, E. J. & Ahmed, R. Redefining chronic viral infection. Cell 138, 30–50 (2009).
21. Votavova, H. et al. Transcriptome alterations in maternal and fetal cells induced by tobacco smoke. Placenta 32, 763–770 (2011).
22. Godec, J. et al. Compendium of immune signatures identifies conserved and species-specific biology in response to inflammation. Immunity 44, 194–206 (2016).
23. Kaech, S. M. et al. Selective expression of the interleukin 7 receptor identifies effector CD8 T cells that give rise to long-lived memory cells. Nature Immunol. 4, 1191–1198 (2003).
24. Joshi, N. S. et al. Inflammation directs memory precursor and short-lived effector CD8+ T cell fates via the graded expression of T-bet transcription factor. Immunity 27, 281–295 (2007).
25. Jordan, M. B., Hildeman, D., Kappler, J. & Marrack, P. An animal model of hemophagocytic lymphohistiocytosis (HLH): CD8+ T cells and interferon gamma are essential for the disorder. Blood 104, 735–743 (2004).
26. Selin, L. K. et al. Memory of mice and men: CD8+ T-cell cross-reactivity and heterologous immunity. Immunol. Rev. 211, 164–181 (2006).
27. Sun, J. C., Ugolini, S. & Vivier, E. Immunological memory within the innate immune system. EMBO J. 33, 1295–1303 (2014).
28. Adams, A. B., Pearson, T. C. & Larsen, C. P. Heterologous immunity: an overlooked barrier to tolerance. Immunol. Rev. 196, 147–160 (2003).
29. Taurog, J. D. et al. The germfree state prevents development of gut and joint inflammatory disease in HLA-B27 transgenic rats. J. Exp. Med. 180, 2359–2364 (1994).
30. Pozzilli, P., Signore, A., Williams, A. J. K. & Beales, P. E. NOD mouse colonies around the world- recent facts and figures. Immunol. Today 14, 193–196 (1993).
Supplementary Information is available in the online version of the paper.
Acknowledgements This study was supported by National Institutes of Health grants 1R01AI111671, R01AI084913 (to D.M.), R01AI116678, R01AI075168 (to S.C.J.) and a BSL-3 suite rental waiver grant from the University of Minnesota. We thank R. Ahmed for providing reagents for pilot studies, P. Southern and D. McKenna for tissue samples or cord blood, and all members of the BSL-3 mouse team (University of Minnesota).
Author Contributions L.K.B., S.E.H., J.M.S., O.A.O., K.A.C., E.A.T., K.A.F, P.C.R, V.V., and D.M. performed the experiments and analysed the data. K.B. and W.N.H. analysed the transcriptome data. M.K.J., A.F.-M., and R.P.S. provided input on research design. L.K.B., S.E.H., W.N.H., S.C.J., and D.M. wrote the manuscript.
Author Information Reprints and permissions information is available at www.nature.com/reprints. The authors declare no competing financial interests. Readers are welcome to comment on the online version of the paper. Correspondence and requests for materials should be addressed to D.M. ([email protected]) or S.C.J. ([email protected]).
© 2016 Macmillan Publishers Limited. All rights reserved
LetterreSeArCH
MethOdSMice, co-housing and infections. Pet store mice were purchased from various Twin Cities area pet stores. Feral mice were trapped on a horse farm or rural outdoor petting zoo in Minnesota or Georgia, USA. Male or female pet store mice were introduced into the cages of 6–8-week-old C57BL/6 mice of the same sex purchased from the National Cancer Institute. Co-housing occurred within a BSL-3 facility. Age-matched C57BL/6 laboratory mice maintained in SPF facilities served as controls. The number of animals needed to reach statistical significance was determined on the basis of previous experience. All animals that survived the experimental treatment were included in the final analysis. No method of randomization was used to allocate animals to experimental groups. Investigators were not blinded to the group allocation during experiments. L. monocytogenes was grown in tryptic soy broth containing streptomycin to log phase growth. The indicated groups of mice were infected intravenously (i.v.) with 8.5 × 10⁴ c.f.u. of wild-type L. monocytogenes (provided by J. Harty). Bacterial load in the spleen and liver was determined 3 days post-challenge as previously described31,32. L. monocytogenes immune mice were generated by pri-mary infection with recombinant L. monocytogenes expressing OVA (LM-OVA) (provided by H. Shen)33 5 months before secondary challenge with wild-type L. monocytogenes. P. berghei ANKA (provided by S. K. Pierce) was propagated by passage in mice and blood collection. One-million parasitized RBCs were injected intraperitoneally (i.p.) into the indicated mice. Parasitaemia was meas-ured by flow cytometry of peripheral blood34. All mice were used in accordance with the guidelines of the Institutional Animal Care and Use Committees at the University of Minnesota.Human tissue. Adult PBMC samples were collected from healthy volunteers at the University of Minnesota35. Fresh cord blood samples were acquired from the Clinical Cell Therapy Laboratory at the University of Minnesota Medical Center. PBMC isolation has been described in detail elsewhere36. After isolation, cells were frozen in 107 cells-per-ml aliquots in a cryopreservative solution (Sigma-Aldrich) for future phenotyping. Cervical tissue from premenopausal women was obtained from the Tissue Procurement Facility (BioNet, University of Minnesota). Cervical samples were frozen roughly 1–2 h after surgical resection. Informed consent was obtained from all subjects. The University of Minnesota Institutional Review Board approved all protocols used.Intravascular staining, leukocyte isolation and phenotyping. An intravas-cular staining method was used to discriminate between cells present in the vasculature and cells in the tissue parenchyma37. Briefly, animals were injected i.v. with biotin/fluorochrome-conjugated anti-CD45 through the tail vein. Three minutes after injection, animals were killed by cervical dislocation, and tissues were collected as described38. Isolated mouse cells were surface-stained with antibodies against CD3 (145-2C11), CD45 (30F-11), CD11b (M1/70), CD11c (N418), NKp46 (29A1.4), Ly6G (1A8), MHC II (Ia-Ie) (M5/114.15.2), CD8α (53-6.7), CD45.2 (104), CD4 (RM4-5), CD62L (MEL-14), CD44 (IM7), CD69 (H1.2F3), CD103 (M290), Ly6C (AL21), CD43 (1B11), CD43 (S7), CD27 (LG.3A10), PD-1 (RMP1-30 and J43), KLRG1 (2F1), CXCR3 (CXCR3-173), CD127 (SB/199), α4β7 (DATK32), F4/80 (Cl−A3-1), CXCR5 (2G8), CD38 (90), IgM (RMM-1), IgD (11-26c.2a), GL7 (GL7), CD19 (6D5), and B220 (RA3-6B2). Isolated human cells were surface-stained with antibodies against CD8α (3B5), CD45RA (HI100), CCR7 (G043H7), CD27 (O323), and CD3 (SK7). All of the above antibodies were purchased from BD Biosciences, Biolegend or Affymetrix eBiosciences. Cell viability was determined using Ghost Dye 780 (Tonbo Biosciences). Intracellular staining with phycoerythrin (PE)-conjugated granzyme B (Invitrogen), fluorescein isothiocyanate (FITC)-conjugated Ki67 (Invitrogen) and AF488-conjugated goat anti-mouse IgG (H+L) antibodies was performed using the Cytofix/Cytoperm kit (BD Pharmingen) following the man-ufacturer’s instructions. Intracellular staining for transcription factors was per-formed using a transcription factor staining buffer set (Affymetrix eBiosciences) with antibodies against Foxp3 (FJK-16s), T-bet (4B10), Eomes (Dan11mag), Gata3 (L50-823) and Rorγt (Q31-378) following the manufacturer’s guidelines. Single positive staining for T-bet, Gata3, and Rorγt was used to identify TH1, TH2, and TH17 lineages, respectively. FITC-conjugated mouse lineage cocktail (Tonbo Biosciences) was used in combination with other recommended lineage markers to identify various innate lymphoid cell subsets. The stained samples were acquired using LSRII or LSR Fortessa flow cytometers (BD) and analysed with FlowJo software (Tree Star, Inc.).Infectious agent screening. Laboratory mice, co-housed laboratory mice (after at least 30 days of co-housing) and pet store mice were screened using EZ-spot and PCR Rodent Infectious Agent (PRIA) array methods (Charles River Laboratories). Dried whole blood, faeces, oral swabs and body swabs were collected as per the sample submission guidelines of Charles River Laboratories.Tissue freezing, immunofluorescence and microscopy. Collected mouse tis-sues were fixed in 2% paraformaldehyde for 2 h before being treated with 30%
sucrose overnight for cryoprotection. The sucrose-treated tissue was embedded in tissue-freezing medium OCT and snap-frozen in an isopentane liquid bath. Human cervix specimens were embedded in tissue-freezing medium OCT and snap-frozen in an isopentane liquid bath. Frozen blocks were processed, stained, imaged, and enumerated by quantitative immunofluorescence microscopy (QIM) as described39,40. Staining included the following antibodies: anti-mouse CD8β (YTS156.7.7), anti-human CD8β (SIDI8BEE, eBioscience), anti-mouse CD4 (RM4-5), anti-mouse CD11b (M1/70), and counterstaining with DAPI (mouse) or Cytox Green (human) to detect nuclei.Serum antibody quantification. Mouse serum antibody titres were quantified using Ready-Set-Go! ELISA kits (Affymetrix eBioscience) following the manu-facturer’s instructions.RNA isolation and microarray hybridization. For each sample, 1–3 × 10⁶ PMBCs were used for RNA extraction. Cells were first homogenized using QIAshredder columns (Qiagen) and RNA was then extracted using an RNeasy kit (Qiagen) as per the manufacturer’s instructions. Following quality control, total RNA samples were processed using the Illumina TotalPrep-96 RNA Amplification Kit for High-Throughput RNA Amplification for Array Analysis. Samples were loaded onto the MouseRef-8 v2.0 Expression BeadChip (Illumina) and hybridized beadchips were scanned using the Illumina iScan Beadarray Reader. Basic quality metrics were checked using Illumina Genomestudio.Bioinformatics analysis. Before analysis, mouse microarray data were quan-tile normalized using preprocessCore (Bioconductor) and batch correction was performed using the ComBat algorithm. Principal components analysis was performed in R. Raw human adult and neonatal cord PBMC microarray data were obtained from a previous unaffiliated study profiling the peripheral blood of 72 smoking or non-smoking women and the cord blood of their neonates (Gene Expression Omnibus, accession code GSE27272)21. Human microarray data were quantile normalized as described above. To obtain lists of genes that were upregulated or downregulated among pet store, co-housed, and labora-tory mice, differential expression analysis was performed using the linear mod-elling and empirical Bayesian method implemented in limma (Bioconductor). GSEA was performed as described previously41. LEM (Leading Edge Metagene) analysis was performed downstream of GSEA to yield groups of genes, termed metagenes, that are coordinately upregulated in a given phenotypic comparison and are common to multiple enriched gene sets. Briefly, for a given phenotypic comparison, GSEA was performed using ImmuneSigDB, a curated compendium of 4,872 gene sets describing a wide range of cell states and experimental pertur-bations from immunology literature22. The top 150 significantly enriched gene sets, as restricted by an FDR < 0.25 and ranked by P < 0.05, were subsetted for their leading edge genes. These genes were then clustered into metagenes using non-negative matrix factorization. The significance of overlap between pairs of metagenes was determined using a Fisher exact test (P < 1 × 10⁻⁵). Metagenes were functionally annotated based on the significance of overlap between member genes and GO terms41, as measured by hypergeometric test using the GOrilla enrichment analysis tool42.Statistics. Data were subjected to the D’Agostino and Pearson omnibus normality test to determine whether they were sampled from a Gaussian distribution. If a Gaussian model of sampling was satisfied, parametric tests (unpaired two-tailed Student’s t-test for two groups and one-way ANOVA with Bonferroni multiple comparison test for more than two groups) were used. If the samples deviated from a Gaussian distribution, non-parametric tests (Mann–Whitney U test for two groups, Kruskal–Wallis with Dunn’s multiple comparison test for more than two groups) were used unless otherwise stated. Variances between groups were compared using an F test and found to be equal. All statistical analysis was done in GraphPad Prism (GraphPad Software Inc.). P < 0.05 was considered significant.
31. Hamilton, S. E., Wolkers, M. C., Schoenberger, S. P. & Jameson, S. C. The generation of protective memory-like CD8+ T cells during homeostatic proliferation requires CD4+ T cells. Nature Immunol. 7, 475–481 (2006).
32. Hamilton, S. E., Schenkel, J. M., Akue, A. D. & Jameson, S. C. IL-2 complex treatment can protect naive mice from bacterial and viral infection. J. Immunol. 1950, 6584–6590 (2010).
33. Pope, C. et al. Organ-specific regulation of the CD8 T cell response to Listeria monocytogenes infection. J. Immunol. 1950, 3402–3409 (2001).
34. Gordon, E. B. et al. Inhibiting the Mammalian target of rapamycin blocks the development of experimental cerebral malaria. MBio 6, e00725 (2015).
35. Balfour, H. H. et al. Behavioral, virologic, and immunologic factors associated with acquisition and severity of primary Epstein-Barr virus infection in university students. J. Infect. Dis. 207, 80–88 (2013).
36. Odumade, O. A. et al. Primary Epstein-Barr virus infection does not erode preexisting CD8+ T cell memory in humans. J. Exp. Med. 209, 471–478 (2012).
© 2016 Macmillan Publishers Limited. All rights reserved

Letter reSeArCH
37. Anderson, K. G. et al. Intravascular staining for discrimination of vascular and tissue leukocytes. Nature Protocols 9, 209–222 (2014).
38. Beura, L. K. et al. Lymphocytic choriomeningitis virus persistence promotes effector-like memory differentiation and enhances mucosal T cell distribution. J. Leukoc. Biol. 97, 217–225 (2015).
39. Schenkel, J. M., Fraser, K. A., Vezys, V. & Masopust, D. Sensing and alarm function of resident memory CD8+ T cells. Nature Immunol. 14, 509–513 (2013).
40. Steinert, E. M. et al. Quantifying memory CD8 T cells reveals regionalization of immunosurveillance. Cell 161, 737–749 (2015).
41. Subramanian, A. et al. Gene set enrichment analysis: a knowledge-based approach for interpreting genome-wide expression profiles. Proc. Natl Acad. Sci. USA 102, 15545–15550 (2005).
42. Eden, E., Navon, R., Steinfeld, I., Lipson, D. & Yakhini, Z. GOrilla: a tool for discovery and visualization of enriched GO terms in ranked gene lists. BMC Bioinformatics 10, 48 (2009).
© 2016 Macmillan Publishers Limited. All rights reserved
LetterreSeArCH
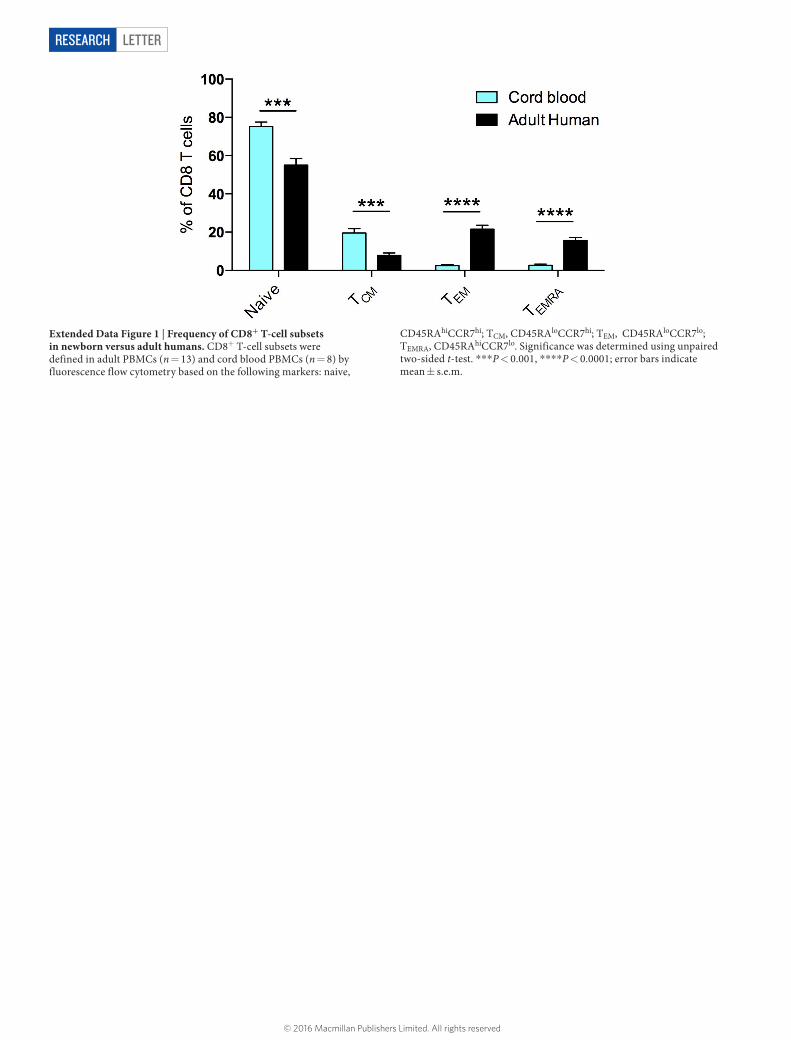
Extended Data Figure 1 | Frequency of CD8+ T-cell subsets in newborn versus adult humans. CD8+ T-cell subsets were defined in adult PBMCs (n = 13) and cord blood PBMCs (n = 8) by fluorescence flow cytometry based on the following markers: naive,
CD45RAhiCCR7hi; TCM, CD45RAloCCR7hi; TEM, CD45RAloCCR7lo; TEMRA, CD45RAhiCCR7lo. Significance was determined using unpaired two-sided t-test. ***P < 0.001, ****P < 0.0001; error bars indicate mean ± s.e.m.
© 2016 Macmillan Publishers Limited. All rights reserved
Letter reSeArCH
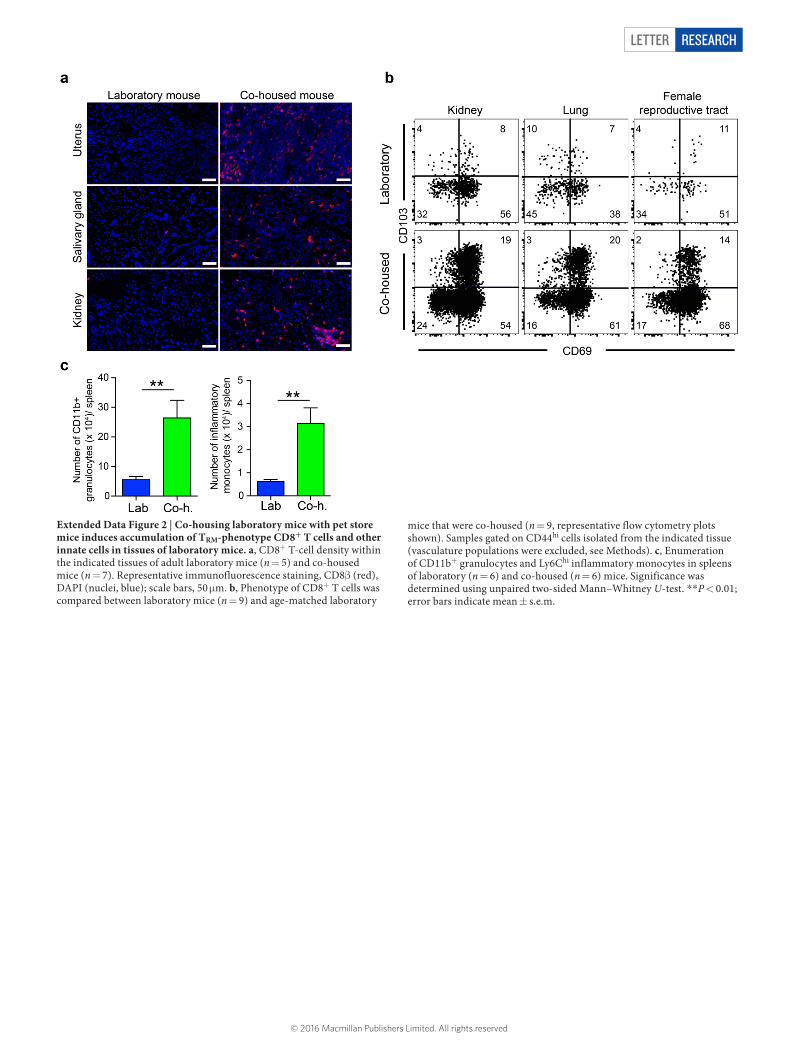
Extended Data Figure 2 | Co-housing laboratory mice with pet store mice induces accumulation of TRM-phenotype CD8+ T cells and other innate cells in tissues of laboratory mice. a, CD8+ T-cell density within the indicated tissues of adult laboratory mice (n = 5) and co-housed mice (n = 7). Representative immunofluorescence staining, CD8β (red), DAPI (nuclei, blue); scale bars, 50 μm. b, Phenotype of CD8+ T cells was compared between laboratory mice (n = 9) and age-matched laboratory
mice that were co-housed (n = 9, representative flow cytometry plots shown). Samples gated on CD44hi cells isolated from the indicated tissue (vasculature populations were excluded, see Methods). c, Enumeration of CD11b+ granulocytes and Ly6Chi inflammatory monocytes in spleens of laboratory (n = 6) and co-housed (n = 6) mice. Significance was determined using unpaired two-sided Mann–Whitney U-test. **P < 0.01; error bars indicate mean ± s.e.m.
© 2016 Macmillan Publishers Limited. All rights reserved
LetterreSeArCH
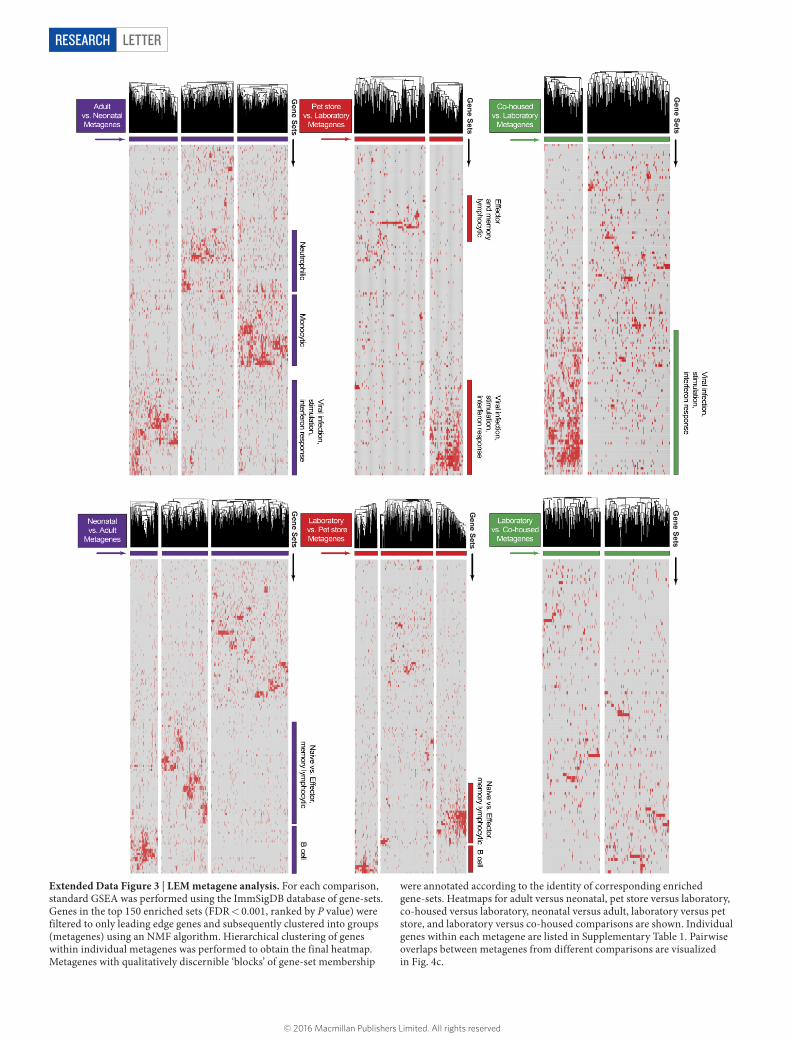
Extended Data Figure 3 | LEM metagene analysis. For each comparison, standard GSEA was performed using the ImmSigDB database of gene-sets. Genes in the top 150 enriched sets (FDR < 0.001, ranked by P value) were filtered to only leading edge genes and subsequently clustered into groups (metagenes) using an NMF algorithm. Hierarchical clustering of genes within individual metagenes was performed to obtain the final heatmap. Metagenes with qualitatively discernible ‘blocks’ of gene-set membership
were annotated according to the identity of corresponding enriched gene-sets. Heatmaps for adult versus neonatal, pet store versus laboratory, co-housed versus laboratory, neonatal versus adult, laboratory versus pet store, and laboratory versus co-housed comparisons are shown. Individual genes within each metagene are listed in Supplementary Table 1. Pairwise overlaps between metagenes from different comparisons are visualized in Fig. 4c.
© 2016 Macmillan Publishers Limited. All rights reserved
Letter reSeArCH
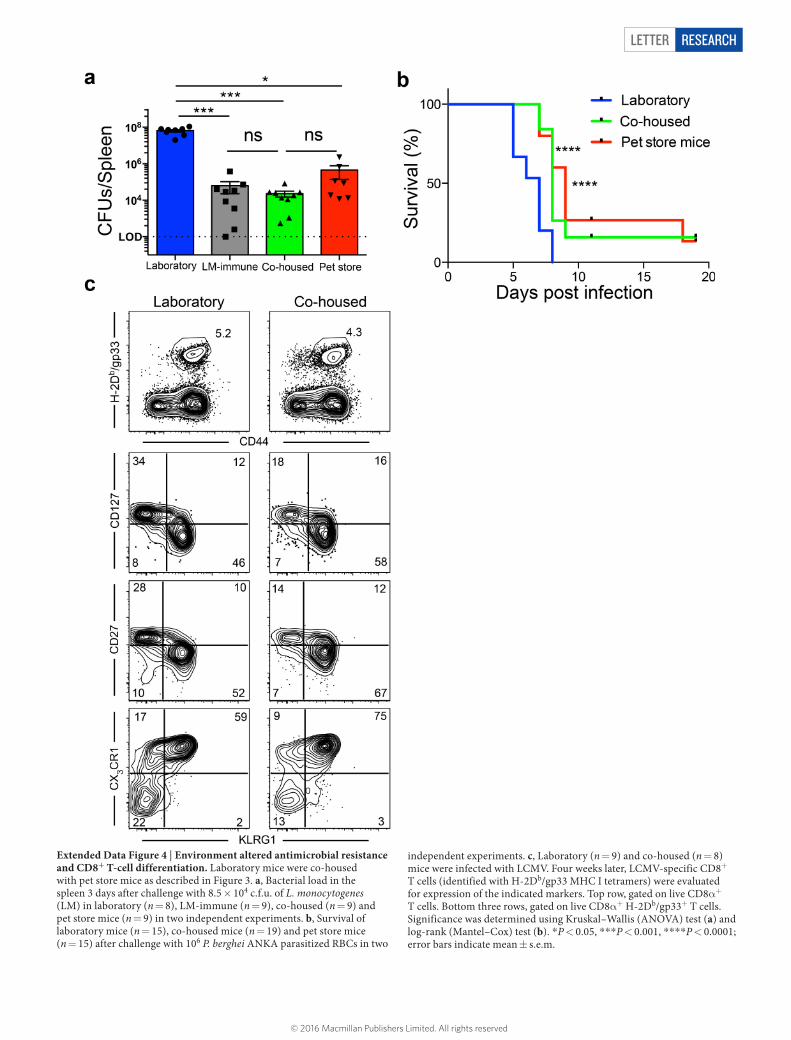
Extended Data Figure 4 | Environment altered antimicrobial resistance and CD8+ T-cell differentiation. Laboratory mice were co-housed with pet store mice as described in Figure 3. a, Bacterial load in the spleen 3 days after challenge with 8.5 × 10⁴ c.f.u. of L. monocytogenes (LM) in laboratory (n = 8), LM-immune (n = 9), co-housed (n = 9) and pet store mice (n = 9) in two independent experiments. b, Survival of laboratory mice (n = 15), co-housed mice (n = 19) and pet store mice (n = 15) after challenge with 106 P. berghei ANKA parasitized RBCs in two
independent experiments. c, Laboratory (n = 9) and co-housed (n = 8) mice were infected with LCMV. Four weeks later, LCMV-specific CD8+ T cells (identified with H-2Db/gp33 MHC I tetramers) were evaluated for expression of the indicated markers. Top row, gated on live CD8α+ T cells. Bottom three rows, gated on live CD8α+ H-2Db/gp33+ T cells. Significance was determined using Kruskal–Wallis (ANOVA) test (a) and log-rank (Mantel–Cox) test (b). *P < 0.05, ***P < 0.001, ****P < 0.0001; error bars indicate mean ± s.e.m.
© 2016 Macmillan Publishers Limited. All rights reserved
LetterreSeArCH
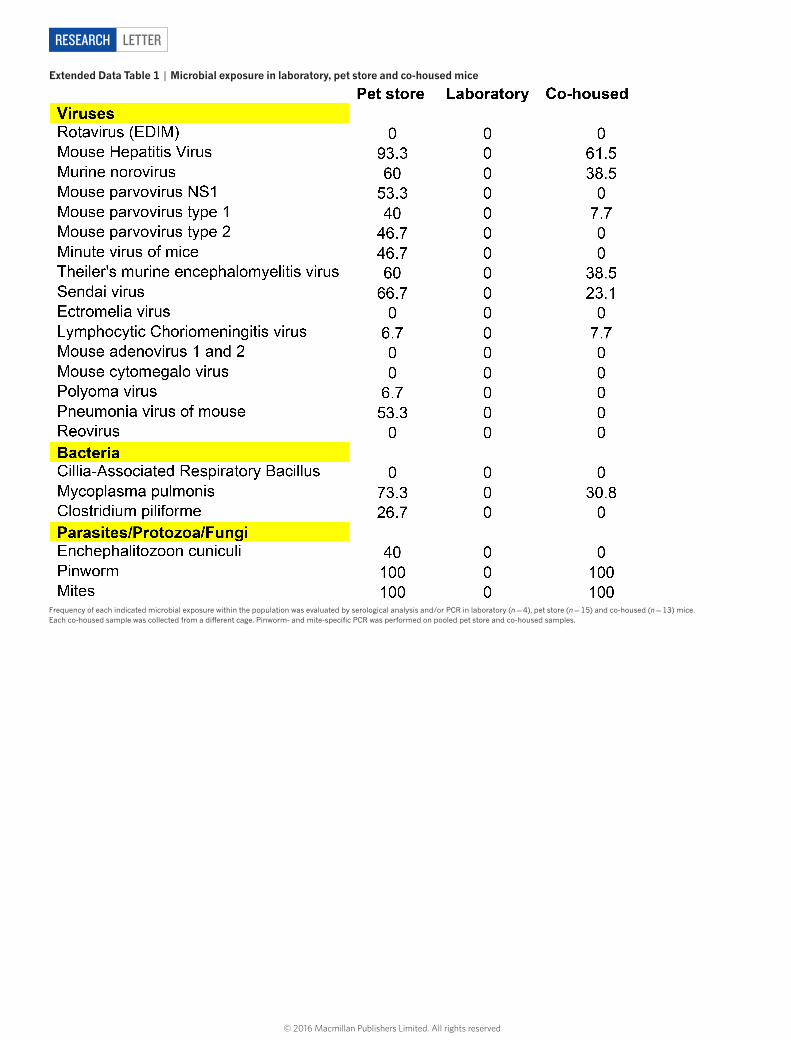
extended data table 1 | Microbial exposure in laboratory, pet store and co-housed mice
Frequency of each indicated microbial exposure within the population was evaluated by serological analysis and/or PCR in laboratory (n = 4), pet store (n = 15) and co-housed (n = 13) mice. Each co-housed sample was collected from a different cage. Pinworm- and mite-specific PCR was performed on pooled pet store and co-housed samples.
© 2016 Macmillan Publishers Limited. All rights reserved