Embed Size (px)
Citation preview

Nonnative Indicators 1
Normative Indicators for a Black, Xhosa Speaking Population
without Tertiary Education on Four Tests Used to Assess
Malingering
Andrea Jane Wong (607W4478)
Supervisor: Professor Ann Edwards
A minor dissertation submitted in partial fulfillment of the requirements for the award of the
Degree of Master of Arts in Clinical Psychology
Faculty of Humanities
Rhodes University
2008
COMPULSORY DECLARATION
This work has not been previously submitted in whole, or in part, for the award of any degree. It is my own
work. Each significant contribution to, and quotation in, this dissertation from the work, or works of other
people has been attributed, and has been cited and referenced.
Signature ------------------------- Date -------------------------
Normative Indicators 2 Abstract
Malingering has become an increasing concern in neuropsychological assessment in recent years, and a
wide range of tests have been designed and examined for the purpose of detecting malingering. Cut-off
scores have been recommended for these tests in order to provide indications of malingering performances.
However, the derived scores have been in respect of westernised populations of people with relatively high
levels of education who speak English as their first language. Accordingly, the current study aimed to attain
{ normative data and cut-off scores for four commonly employed neuropsychological tools, administered in
English, on a population of black, South African, Xhosa-speaking people (N = 33), who attended a former
DET-type school in the Eastern Cape, with a Grade 11-12 level of education, in the age range of 18 - 40
years. The targeted measures included the TOMM, the Rey-15 Item Memory Test, the Digit Span subtest of
the WAIS-III, and the Trail Making Test. The obtained scores were poorer than the previously published
cut-offs for at least one component of each of the tests investigated, except the TOMM. The fmdings of this
study highlight the important role that the factors of culture, quality of education, and language play in
neuropsychological test performance.

Normative Indicators 3 Acknowledgements
The author would like to thank: the following people for their assistance and support with this project:
My supervisor, Professor Ann Edwards, for her constant support, guidance, encouragement and patience.
Rhodes University, and especially the Human Resources Department and Rianna Hennint for all of their
assistance in the recruitment of participants for this study.
Rhodes University, and the postgraduate funding office, for the fmancial support granted to me in 2007
through the bursary given to me.
All the participants in this study, for so willingly giving your time.
All of my friends, for always supporting me, encouraging me, and praying for me.
My family, for always being there for me, and for providing me with support of every kind. Thank: you also
for all of your prayers and for your guidance, advice and especially, your patience with me. Thank: you also
for never giving up on me.
God, my Creator, for giving me everything I have and especially, for giving up His only Son that I may
know Him personally. This is all for Your Glory.

,,
Normative Indicators 4 Table of Contents
Abstract ............................................................................................................................................................ 2
Acknowledgements ......................................................................................................................................... 3
Table of Contents ............................................................................................................................................ 4
List of Tables ................................................................................................................................................... 6
1. Introduction and Literature Review ......................................................................................................... 7
1.1 Introduction ............................................................................................................................................. 7 1.2 Tests Specifically Designed to Assess Malingering ................................................................................ 8
I 1.2.1 The Test of Memory Malingering (TOMM) ..................................................................................... 8 1.2.2 The Rey 15-Item Memory Test ....................................................................................................... 10
1.3 Standard Neuropsychological Tests Commonly Used to Assess Malingering ..................................... 13 1.3.1 The Digit Span Subtest of the WAIS-R and the WAIS-IIL ............................................................. 15 1.3.2 The Trail Making Test .................................................................................................................... 16
1.4 Overall Findings on the Four Tests Used to Assess Malingering Reviewed ........................................ 19 1.5 The Effect of Culture, Language and Quality of Education on Neuropsychological Test Performance ................................................................................................................................................ 19
1.5.2. Level and Quality of Education .................................................................................................... 23 1.5.3 Language ........................................................................................................................................ 24
1.6 Objectives of Current Study .................................................................................................................. 25 2. Method ....................................................................................................................................................... 27
2.1 Sample ................................................................................................................................................... 27 2.1.1 Language ........................................................................................................................................ 27 2.1.2 Level and Quality of Education ..................................................................................................... 28 2.1.3 Age ................................................................................................................................................. 28 2.1.4 Gender ............................................................................................................................................ 29 2.1.5 Exclusion Criteria .......................................................................................................................... 30
2.3 Procedure .............................................................................................................................................. 31 2.3.1 Data Collection ..................................................................................................... , ........................ 31 2.3.2 Materials ........................................................................................................................................ 32 2.3.2 Data Processing ............................................................................................................................. 35 2.3.3 Data Analysis ................................................................................................................................. 35
3. Results ........................................................................................................................................................ 37
3.1 The TOMM .................................................. , ................................. , ................................................. , ..... 37 3.2 The Rey 15-Item Memory Test .............................................................................................................. 38 3.3 The Digit Span Subtest of the WAfS-III ............................................................... , ................................ 38 3.4 Trail Making Test .................................................................................................................................. 39
4. Discussion ................................................................................................................................................... 42

Normative Indicators 5 4.1 The TOMM ............................................................................................................................................ 42 4.2 Rey 15-Item Memory Test .................................................................................................................... 43
4.2.1 Items Correct in Any Position ........................................................................................................ 43 4.2.2 Rows Correct in Correct Position .................................................................................................. 44
4.3 The Digit Span Subtest of the WAIS-III ................................................................................................ 45 4.3.1 Age Correlated Scaled Scores (ACSS) ........................................................................................... 45 4.3.2 Reliable Digit Span (RDS) ...................................................................................................... 46
4.4 The Trail Making Test ........................................................................................................................... 47 4.4.1 Trail A and Trail B Completion Times ......................................................................................... 47
;j
4.4.2 Trail A and Trail B Errors ............................................................................................................. 47 4.4.3 The Trail B:A Ratio ........................................................................................................................ 48
4.5 Overall Indications from the Study ...................................................................................................... 49 'i I ,
4.6 Evaluation of the research ................................................................................................................... 51 4.7 Recommendations for Future Research ................................................................................................ 52 4.8 Final Summary ...................................................................................................................................... 53
,< 6. References .................................................................................................................................................. 54 t~ fj
Appendices ..................................................................................................................................................... 58
Appendix A: Biographical Questionnaire ................................................................................................... 58 Appendix B: Pre-Test Screening Questionnaire ......................................................................................... 62 Appendix C: Inj'ormed Consent Form ......................................................................................................... 67
.! Appendix D: Test Protocols ........................................................................................................................ 68 ':i
J' i
:
~~~lrl\,\.'i.~ ...... Vtl~~,',W. .... h~tolP.- ,. •• ~,.,...rl~ •.. ... ,. .... ~ "" ....... ' '''' .......... ~~"'A .... l'>H .. , .... ~ .... ~ ............ 4;0 • ....,,~,_ """'1.1·.""' .. U"t ... H~I ...... ~Ul.Ij> •• ·.u ..... ,J.,\".u,uh \J<At .. ,,".;r.;IVs. ... rii.,\\1r.'t' U.al .. ~'"\\"t ..... ,\\n~....w.l'lw_~·NoA\\\i.\\'V:~~~\, i\\\ijU~U

Normative Indicators 6 List of Tables
Table 1: Summary Table of Findings from Reviewed Studies on the TOMM 11 Table 2: Summary Table of Findings from Reviewed Studies on the Rey 15-Item Memory Test 14 Table 3: Summary Table of Findings from the Digit Span Subtest of the W AIS-RlW AIS-III 17 Table 4: Summary Table of Demographic Information and Results from Reviewed Studies on the Trail Making Test 20 Table 5: Summary Table of Cut-Off Scores from Reviewed Studies for the Trail Making Test 21 Table 6: Distribution of Highest Grade Obtained in the Two Age Groups 29 Table 7: Distibution of Gender in the Two Age Groups 29 Table 8: Distribution of Highest Grade Obtained in the Two Gender Groups 30 Table 9: Distribution of Age in the Two Gender Groups 30 Table 10: Order of Presentation of Tests in the Overall Neuropsychological Test Battery with Emphasis on Tests in the Present Study 33 Table 11: Descriptive Statistics for the TOMM 37 Table 12: Percentile Scores for the TOMM 37
i Table 13: Descriptive Statistics for the Rey 15-Item Memory Test 38 Table 14: Percentile Scores for the Rey 15-Item Memory Test 38 Table 15: Descriptive Statistics for the Digit Span Subtest of the WAIS-III 39 Table 16: Percentile Scores for the Digit Span Subtest of the W AIS-III 39 Table 17:Descriptive Statistics for the Trail Making Test 39 Table 18: Percentile Scores for the Trail Making Test 40 Table 19: Summary of Descriptive Statistics and Cut-Off Scores for the TOMM 43 Table 20: Summary of Descriptive Statistics and Cut-Off Scores for the Rey 15-Item Memory Test 45 Table 21: Summary of Descriptive Statistics and Cut-Off Scores for the Digit Span Subtest of the WAIS-III 47 Table 22: Summary of Descriptive Statistics and Cut-Off Scores for the Trail Making Test 49

Normative Indicators 7 1. Introduction and Literature Review
1.1 Introduction
Neuropsychological assessment frequently involves the evaluation of the nature and extent of dysfunction
related to traumatic head injury (Kelly, Binder, Villanueva & Winslow, 1995). The possibility of fmancial
gains in certain cases provide the incentive to feign or exaggerate neuropsychological symptoms during
psychological assessment, otherwise known as malingering (Kelly et aI., 1995; Lee, Loring & Martin, 1992;
Lezak, Howieson & Loring, 2004; Loring, 1995; Miller, 1996; Teichner & Wagner, 2004; Tombaugh,
1996). Such cases may include instances where an injury was sustained during a motor vehicle or
occupational accident, or in military service, or where an opportunity exists for ill or seriously injured
people to evade military service or to be excused of responsibility for crimes (Kelly et aI., 1995; Lee et aI.,
1992; Lezak et aI., 2004; Loring, 1995; Miller, 1996; Teichner & Wagner, 2004; Tombaugh, 1996.).
Historically, neuropsychologists would use their clinical judgement and qualitative observations to assess
for malingering (Tombaugh, 1997). This would consist of clinicians making note of indicators of suboptimal
effort, such as inconsistent performances on multiple tests of the same cognitive function or obtaining lower
scores on easier tasks than on more difficult ones (Tombaugh, 1997).
However, the validity of these qualitative indicators can be questionable, and they may commonly overlap
with genuine symptoms (Miller, 1996; Tombaugh, 1997). Furthermore, in legal cases, in which
neuropsychologists have become increasingly involved, empirical evidence is required as proof of
malingering, in addition to clinical observations (Arnett, Hammeke & Schwartz, 1995; Miller, 1996).
Subsequently, it has been suggested that measures designed specifically to detect malingering be developed
and included in all neuropsychological assessments, and an expansive amount of research has been
conducted to develop and investigate the efficacy of such measures (Arnett et aI., 1995; Fisher & Rose,
2005; Greiffenstein, Baker & Gola, 1994; Greve et aI., 2006; Iverson, Le Page, Koehler, Shojania & Badii,
2007; Kelly et al., 1995; Lee et aI., 1992; Lezak et al., 2004; O'Bryant, Engel, Kleiner, Vasterling & Black,
2007; Rees, Tombaugh & Boulay, 2001; Rees, Tombaugh, Gansler & Moczynski, 1998; Rosenfeld, Sands
I & Van Gorp, 2000; Teichner & Wagner, 2004; Tombaugh, 1996, 1997; Yanez, Fremouw, Tennant, Strunk
& Coker, 2006). Additionally, research has been conducted on utilising standard neuropsychological tests
generally included in most test batteries for the purpose of detecting feigned or exaggerated effort (Axelrod,

.1
I ! I
i
j
1.
Normative Indicators 8 Fichtenberg, Millis & Wertheimer, 2006; Babikian, Boone, Lu & Arnold, 2006; Egeland & Langfjaeran,
2007; Greiffenstein et aI., 1994; Inman & Berry, 2002; Iverson, Lange, Green & Franzen, 2002; Iverson &
Tulsky, 2003; Larrabee, 2003; Lezak et aI., 2004; O'Bryant, Hilsabeck, Fisher & McCaffrey, 2003; Ruffolo,
~ Guilmette & Willis, 2000; Tombaugh, 1996). This introductory section will fIrstly briefly examine the I existing literature on some of the tests in both of these categories which are commonly used to detect
malingering. It will then explore the effect that culture, language, and quality of education have on
neuropsychological test performance, thus emphasising the need for normative data to be produced on all
cognitive tests, including those used to assess malingering, in South Africa.
1.2 Tests Specifically Designed to Assess Malingering
~ J Poor memory is frequently the initial symptom seen in patients presenting with organic brain damage and is
subsequently the most commonly reported symptom in malingering patients (Lezak et aI., 2004; Tombaugh, /1 ,I I 1996). Consequently, measures of malingering are generally tests of memory impairment (Arnett et aI.,
1995; Lezak et aI., 2004; Rees et aI., 1998; Tombaugh, 1996, 1997). Amongst the most common of these are
symptom validity tests, which are forced-choice tests designed to be relatively easy for all people, except
perhaps for those who have signifIcant neurological impairment, and other simple tests of memory that
patients are made to believe are very diffIcult (Lee et aI., 1992; O'Bryant et aI., 2007; Rees et aI., 1998;
Tombaugh, 1996, 1997). Amongst the most frequently used of these tests are the Test of Memory
Malingering (TOMM) (O'Bryant et aI., 2007; Tombaugh, 1996) and the Rey 15-Item Memory Test (Arnett
et al., 1995; Lezak et aI., 2004; Rey, 1964). The most recent literature on these two respective tests will be
discussed separately below.
1.2.1 The Test of Memory Malingering (TOMM)
The TOMM is a 50-item test of recognition memory consisting of two learning trials and an additional
optional retention task (O'Bryant et aI., 2007; Rees et aI., 1998, 2001; Teichner & Wagner, 2004;
Tombaugh, 1996, 1997; Yanez et aI., 2006). As Tombaugh (1996) reports, a person can correctly identify
50% of the items on this test (25/50 items) by guessing. Furthermore, by applying the binomial distribution,
Tombaugh (1996) calculated that scores falling below 18/50 on the TOMM were highly unlikely to occur by
chance. However, the results of several studies conducted on the TOMM as a part of the initial validation

Normative Indicators 9 process indicated that very few people obtain scores that fall below chance levels (Rees et aI., 1998;
Tombaugh, 1996, 1997). In contrast, the researchers found that in all of these studies, a wide range of
participants (including those with genuine cognitive impairment and suspected and simulated malingerers)
obtained extremely high scores on this test (Rees et aI., 1998; Tombaugh, 1996, 1997). For instance, a group
of cognitively intact adults obtained a mean score of 49.90 on both trial 2 and the retention trial of the
TOMM, exceeding their own performance expectations (Tombaugh, 1996, 1997). Similar results were
obtained in a study comparing cognitively intact individuals with patients with cognitive impairment,
aphasia, traumatic brain injuries (TBls) and dementia, with even the demented group scoring a mean of 45.7
(92% accuracy) on trial 2 and the retention trial (Tombaugh, 1996, 1997).
Subsequently from these studies, a criterion score of 45/50 was established, and this score correctly
I classified 95% of all non-demented participants and 91 % of all participants as not malingering (Tombaugh,
1996, 1997). This criterion score also yielded high levels of sensitivity (that is, the percentage of people
:1 malingering that are correctly classified as such) and specificity (that is, the percentage of people not
j malingering correctly classified as such) when applied to a wide range of different participants. These
included university students, TBI patients, patients suffering from varying types of cognitive impairment,
ii simulated malingers and suspected malingerers (Rees et aI., 1998; Tombaugh, 1996, 1997). These sources
similarly found high levels of sensitivity and specificity for the TOMM when using varying administration
procedures (using the standard pencil-and-paper version of the test, using a computerised version of the test,
) administering the test alone and administering the test in a battery of other neuropsychological tests) in ,I 1\ !j !
separate validation studies conducted by Tombaugh and colleagues (Rees et aI., 1998; Tombaugh, 1996,
1997).
I This cut-off score was further validated in a study on 26 patients suffering from moderate to severe levels of
. depression (mean BDI score of 27.9) (Rees et aI., 2001). In this study, Rees et aI. (2001) found that all
patients obtained a score of 49 or 50 on both Trial 2 and the retention trial of the TOMM. The application of
the established cut-off score further yielded no misclassifications of malingerers, even in the severely
depressed patients (BDI scores ranging from 30-51) included in the sample (Rees et aI., 2001). In another
study investigating the performances of depressed patients on the TOMM, Yanez et aI. (2006) compared test
results of patients with severe Major Depressive Disorder (N = 20; mean BDI-II score of 43.20) to those of
" non-depressed participants (N = 20). The researchers found that their depressed sample, like the participants i
in the study by Rees et al. (2001) obtained high results, with both participant groups obtaining mean scores

Ij
I ,j I
Normative Indicators 10 '\ above 45. However, the researchers note that many of their participants were on anti-depressant medications
1.1
;j at the time of testing and it is unclear what effect this factor may have had on test performance (Yanez et aI.,
~ 2006). Similarly, 54 patients diagnosed with fibromyalgia, who were also experiencing high levels of self~ 1 reported depression, chronic pain and disability, obtained a mean score of 49.8 on trial 2 and 49.6 on the :, : retention trial of the TOMM, thus giving further evidence for the utility of the TOMM and of the cut-off
.!; score of 45 on a wide range of people (Iverson et aI., 2007). \~
Ij j Ii This cut-off score was further shown to be useful in accurately identifying malingering and non-malingering i
f participants in a study comparing performances on the TOMM of two groups of people who were at risk of
'.I sustaining cognitive impairment from toxic exposure (suspected malingerers (N = 33) and non-malingerers
') (N = 17)) with 14 TBI patients and 22 patients with diagnosed memory disorders (Greve et al., 2006). The .'
application of the cut-off score of < 45 to this sample yielded perfect specificity and high levels of I) [; sensitivity (>50%). It appears that only one study has indicated a possible misclassification of participants
Ii as malingering when using a cut-off score of 45 and this was with a group of elderly patients (mean age of
·:i 70.5) with dementia (Teichner & Wagner, 2004). These results are in contrast to the findings of Tombaugh ,j j '\
(1996, 1997) in his original validation studies, which indicated that even the dementia patients in the sample
obtained scores above 45/50 on trial 2 and the retention trial of the TOMM. Teichner and Wagner (2004)
suggest that the differences in fmdings between their study and those of Tombaugh (1996, 1997) may be
attributable to their dementia group being more severely cognitively impaired than that used in the studies
;' conducted by Tombaugh (1996, 1997). Nevertheless, even in the study by Teichner and Wagner (2004)
;1 study of 78 elderly patients, 100% of the cognitively intact participants and 92.7% of the non-demented, I
.1 cognitively impaired patients obtained scores above 45. The authors therefore suggest that this cut-off score
!1 is still useful for detecting malingering in patients where dementia has been excluded (Teichner & Wagner,
:1 2004). j
! Overall, these studies have indicated that non-demented participants ranging from normal controls to head-
1 injured patients all generally perform at a very high level on the TOMM. Furthermore, the established cut
l off of 45 on Trial 2 or the retention trial appears to accurately detect malingering in individuals without
dementia. A summary of the fmdings from all of the studies investigating the TOMM that have been ,
ij reviewed here is presented in Table 1 .
. , 'I !

1"1-· ,
I I ,j i,l ,/
"
:1 Normative Indicators 11 ;1) Table 1 i Summary Table of Findings from Reviewed Studies on the TOMM
:1 Authors Sample N Age Education Trial 2 Retention Sensitivity Specificity Cut-(in years) (in years) (%) (%) off *
;: M SD M SD M SD M SD
; **Tombaugh Cognitively intact - 20.4- - 11.8 - - >45 - >45 - 82-100 91 - 100 <45 1 (1996, 1997) adults, simulated 72.1 14.1
: & malingerers, ! Rees et al. litigating and
Ii (1998) non-litigating
\ TBI patients,
t hospital
outpatients, cognitively
I impaired adults, ; patients with q
dementia Rees et a1. Depressed 26 40.4 11.2 14.9 2.8 49.9 0.2 49.9 0.3 - - <45
'i (2001) clinical group
Non-litigating 24 40 14 13.6 2.7 49.6 1.3 49.6 1 - - <45 I TBI group
! Community 26 42.3 10.3 12.7 1.2 49.9 0.4 49.9 0.5 - - <45
II control group
./ Yanez et a1. Depressed 20 39.05 8.88 11.15 1.57 48 4.9 48.6 4.2 - - <45
(2006) clinical group
:1 Non-depressed 20 41.65 10.79 13.3 2.79 49.8 0.9 49.8 0.6 <45 - -'" il control group
Iverson et al. Patients with 54 51.4 12.8 13.5 2.4 49.8 0.5 49.6 0.9 - - <45 i (2007) fibromyalgia
" Greve et a1. Toxic exposure 33 43 11.4 10.8 2.9 40.9 10.3 38.5 11.8 +/- 60 - <45 I (2006) group suspected j of malingering ~ I I;
Non-malingering 17 41.5 12.5 12.8 2.8 50 0 49.8 0.6 - 100 <45
':1
toxic exposure group
t,
:\ Non-litigating !] TBI group 14 34.3 12.6 13.6 3.3 49.4 1 49.6 0.8 - 100 <45
;1 Memory disorder
:'1 patient group 22 73.5 9.3 12.5 3.3 46.9 5.5 46.0 6.4 100 <45
-
:1 Teichner & Elderly dementia 21 75.3 6.1 13.6 3.3 39.5 6.8 39.5 6.8 - 76.9" <45 1 ~agner (2004) patient group i
1 Elderly 36 70.6 8.1 14.2 3.2 48.6 2.8 48.3 2.9 - 94.7b <45 ..
1 cognitively 1 impaired patient
1 group 94.7b 21 65.6 8.6 14.2 3.6 49.7 0.7 49.7 0.7 - <45 I. Elderly normal
'1 control group d ,!
*Cut-off scores are for trial 2 and retention trial. ** These are validation studies conducted by Tombaugh and his colleagues, including a number of different experiments, which utilise varying participant groups and administrations procedures. 'Specificity rate using cut-off of < 45 if dementia cannot be ruled out. bSpecificity rate using cut-off of < 45 when dementia can be ruled out.
,
ii

Normative Indicators 12 il1.2.2 The Rey 15-Item Memory Test
,1
~ \ I
The Rey I5-Item Memory Test is a simple task that is presented as being a very difficult test of memory
functioning (Arnett et aI., 1995; Lee et aI., 1992; Lezak et aI., 2004). Many studies have been conducted in
, an attempt to attain an appropriate cut-off score for malingering for this test (Arnett et al., 1995;
j Greiffenstein et aI., 1994; Inman & Berry, 2002; Lee et aI., 1992; Lezak et aI., 2004). A number of varying I
cut-off scores have been indicated, with the most consistent being that of 9 correctly reproduced items in
total, regardless of spatial location (Arnett et aI., 1995; Greiffenstein et aI., 1994; Inman & Berry, 2002; Lee
et aI., 1992; O'Bryant et aI., 2003).
In their study comparing the performances ofTBI patients (N = 30), patients with persistent postconcussive
syndrome (PPCS) (N = 30) and probable malingerers (N = 43) on a number of commonly used measures of
)' episodic memory and malingering, Greiffenstein et aI. (1994) found that the probable malingering group
¥ performed significantly more poorly than both the TBI and PPCS groups on the Rey 15-Item Test. They
j :j I. I:'
further found that using a cut-off score of 9 items correct in any location, they attained sensitivity rates of
62-63% and specificity rates of 88-93%. Alternatively, when they used a cut-off score of 10, they attained
sensitivity and specificity rates of 62-93% and 64-81% respectively. The authors note that the Rey 15-Item
Test yielded the smallest overall hit rate (overall hit rate of 71 % using a cut-off score of 10) of all the tests
examined. However, they describe this as still being a respectable hit rate (Greiffenstein et aI., 1994). Using
the cut-off score of 9 items correct in any location, in their study cross-validating numerous measures of
malingering on 55 university students who had previously suffered a head injury (randomly assigned to a
simulated malingering or non-malingering group) and 53 participants with no history of prior head injuries
, (randomly assigned to a normal control group or simulated malingering group), Inman and Berry (2002)
~ found that participants in the malingering groups scored significantly lower than those in the groups 1 Ii required to use optimal effort. They obtained an overall hit rate of only 53% (specificity rate of 100% and
I sensitivity rate of 2%) on the Rey 15-Item Test, a much lower overall hit rate than that obtained by
Greiffenstein et al. (1994) using a cut-off score of 10 items correct in any position.
,1\· On the other hand, in their study investigating test performances on the Rey IS-Item Test in temporal lobe
epilepsy patients with memory impairment compared to a group of outpatients with varying neurological )
,: conditions, Lee et aI. (1992) found that at least 95% of all patients obtained scores of 8 or more. They 1 .~ proposed a cut-off score of < 7 correct items in any location, as this score was at or below the 5th percentile "
) '.

%
'j J Normative Indicators 13 1 of both participant group scores (Lee et aI., 1992). This cut-off score is lower than those suggested by both .'i 'I Greiffenstein et aI. (1994) and Inman and Berry (2002). Arnett et aI. (1995) utilised a different cut-off score
lJ 1\
;,
of < 8 in their two studies comparing the performance of neurologically impaired subjects with participants
simulating malingering. They found that sensitivity rates were high, but specificity rates were only 74%-
84% using this cut-off score. Alternatively, using the cut-off criterion of less than 2 rows correct, in correct
! spatial location, they found sensitivity rates of 47% and 64% and specificity rates of 97% and 96% in their
Ij two respective studies. They therefore suggest that using the criterion of < 2 rows correct in correct position
'I ,j
I '\ ", 1
is a more effective way of discriminating malingerers from non-malingerers than looking at the number of
correct items in any spatial location (Arnett et aI., 1995).
Overall, these studies have indicated that the measure of correct items in any position on the Rey 15-Item
Test has yielded variable results, with cut-offs ranging from 7 to 10. On the other hand, the measure of
'j correct rows in correct position has only been investigated in one study reviewed here (Arnett et aI., 1995), I i and the cut-off indication was 2. A summary of the findings from all of the studies investigating the Rey 15-1
} Item Memory Test that have been reviewed here is presented in Table 2.
1.3 Standard Neuropsychological Tests Commonly Used to Assess Malingering
In addition to tests designed specifically to assess for malingering, tests commonly included in standard
neuropsychological batteries are also frequently used as measures of malingering (Axelrod et aI., 2006;
I Babikian et aI., 2006; Egeland & Langfjaeran, 2007; Fisher & Rose, 2005; Greiffenstein et aI., 1994; Inman
& Berry, 2002; Iverson et aI., 2002; Larrabee, 2003; Lezak et aI., 2004; Miller, 1996; O'Bryant et aI., 2003).
There are advantages to using standard cognitive tests as measures of malingering, such as the relatively
;j easier accessibility and availability of these tests compared to those specifically designed to assess
'! malingering, as well as the reduction of administration time when using a test already in a standard battery ~ 1 (Babikian et aI., 2006; Lezak et aI., 2004). Furthermore, using standard neuropsychological tests also makes
J it more difficult for advocates or interested others to coach patients to avoid detection via specific tests of y, I malingering (Babikian et aI., 2006; Lezak et al., 2004). Two of the standard cognitive tasks that are
J ~ 1
commonly used as indicators of malingering are the Digit Span subtest of the Wechsler Adult Intelligence
Scale-Revised (WAIS-R) or the Wechsler Adult Intelligence Scale-Third Edition (WAIS-III) and the Trail
j Making Test. Some of the available literature investigating the utility of these two respective tests as

}fi
;
~,
i Nonnative Indicators 14 ,
iiI Table 2 ~" Summary Table of Findings from Reviewed Studies on the Rey 15-ltem Memory Test
1 Authors Sample N Age (in Education Correct Correct Sensit- Specificity Hit Cut-off
years) (in years) items rows ivity (%) rate
il (any (correct (%) (%)
location) location) M SD M SD M SD M SD Correct Correct
'1 items rows Greiffenstein TBI group 33 33.1 9.5 11.3 1 12.8 2.8 - - - 88/81" 71" <91 -if et aI. (1994) 10c ,I
'J PPCS* 30 37.6 13.9 11.7 0.8 13.2 2.1 - - - 93/64b - -group < 9/10c
n ~.! Probable 43 39.3 10 11.1 2.2 9.7 3.8 - - 62/62" - 71" -l malingerer 63/93b < 9II0c
j JUoup lnman& Head 21 18.67 0.91 12.48 0.98 14 2.39 - - 2 - 53 <9d -
Berry (2002) injured 'I simulated
1 malingerers
Head 24 18.67 1.69 12.25 0.61 14.83 0.65 - - - 100 53 <9d -injured
:\ controls , " i Normal 23 18.91 1.27 12.83 1.19 13.70 1.82 - - 2 - 53 <9d -
simulated Ii malingerers
-Normal 24 18.42 0.88 12.21 0.51 15 0 - - 100 53 <9d -controls
Lee et al. Temporal 100 30 9.6 11 2 12.5 2.8 - - - - - <7" -
tl (1992) lobe
epilepsy
j patients
,. Non- 40 38.4 16 11.3 2.3 12.1 2.5 - - - - - <7" -~i litigating I
d outpatients il
,( Litigating 16 35.4 9.8 9.8 2.4 9.1 3.8 - - - - - <7" -j outpatients
I Arnett et al. Study 1
I (1995) Simulated 49 20.6 - 14.67 - 12.14 2.57 1.94 1.6 47 - - - <2 /1 malingerers
,j 'I Neurolo- 34 39.6 13.03 12.77 2.34 3.32 1.12 97 <2 I., - - - - -i gica1 • r Patients
, , 26.1 17.2 10.84 3,57 1.52 1.5 64 <2 1 Study 2 25 - - - - -,
:1 Simulated 'I malingerers ~: I ., ,
~ I Neurolo- 25 38.9 - 12.8 - 12 2.29 3.28 1.10 - 96 - - <2 , gical }l Patients ; • Persistent postconcussive syndrome, 'Rates based on comparison between TBI and probable malingerer groups. Where 2 numbers given, the first number is based on a cut-off score of < 9 items
k correct in any location and the second score is based on a cut-off score of < I 0 items correct in any location. 'Rates based on comparison between PPCS and probable malingerer groups. Where 2 numbers given, the first number is based on a cut-off score of< 9 items correct in any location and the second score is based on a cut-off score of< 10 correct in any location. 'The first cut-off
" Score was set at-1.3SD of the TBlgroup mean and the second cut-off score was setat-1.0SD of the TBI group mean. 'Cut_off score chosen as it is the one most consistently used by other
. ,' researchers. cS1h percentile score used as cut-off .
11 " I
I '\ 1 i !
", .-'.

--............... -----------------------------------Nonnative Indicators 15
measures of malingering will briefly be discussed below (Babikian et al., 2006; Inman & Berry, 2002;
Iverson & Tulsky, 2003; O'Bryant et al., 2003; Ruffolo et aI., 2000).
1.3.1 The Digit Span Subtest of the WAIS-R and the WAIS-III
r;l Several different scores obtainable from the WAIS-R and WAIS-III Digit Span subtest have been used and
ii investigated as means of identifying suspected malingerers, most notably the standard Age Correlated
i,1 Scaled Score (ACSS) and the Reliable Digit Span (RDS) (Axelrod et aI., 2006; Babikian et aI., 2006; l
i.' Greiffenstein et aI., 1994; Inman & Berry, 2002; Iverson & Tulsky, 2003; Larrabee, 2003). The RDS is
, thesum of the longest correct strings of digits obtained on two trials on both the forwards and backwards
~ tasks (Axelrod et aI., 2006; Babikian et aI., 2006; Inman & Berry, 2002; Iverson & Tulsky, 2003; Larrabee,
~
2003). Findings have been variable in tenns of identifying an appropriate cut-off score (Axelrod et aI.,
2006; Babikian et aI., 2006; Inman & Berry, 2002; Iverson & Tulsky, 2003; Larrabee, 2003).
,i In their study introducing the measure of the RDS, Greiffenstein et ai. (1994) found that using a RDS cut-off " " score of 7 from the WAIS-R Digit Span subtest yielded sensitivity rates of 68-70% and specificity rates of
73-89% when comparing groups of probable malingerers, patients with persistent postconcussive syndrome, i
.~ and TBI patients. On the other hand, using a RDS < 8 yielded higher sensitivity rates of 82%, but lower
'J specificity rates of only 54-69% (Greiffenstein et aI., 1994). Using this same cut-off score ofRDS < 8 on the
1 Digit Span subtest of the WAIS-R, Larrabee (2003) obtained a sensitivity rate of 50% and a specificity rate ~l 1 of 93.5% in his study investigating cut-off scores for five standard neuropsychological tests used to detect
" malingering on a group of 26 malingering participants and 31 patients suffering from moderate to severe
,; closed head injuries. Additionally, Inman & Berry (2002) applied this same cut-off in their study cross-
) \ I'!
i J I ¥
validating a number of different measures of malingering, obtaining a perfect (100%) specificity rate, but a
low sensitivity rate of only 27%, giving an overall hit rate of 65% (Inman & Berry, 2002).
Alternatively, Iverson & Tulsky (2003) investigated test perfonnance patterns of the digit span subtest of the
WAIS-III using the ACSS measurement. Utilising the W AIS-III standardisation sample and several of the
clinical groups presented in the WAIS-III technical manual, they suggested a cut-off score of ACSS < 5 or \
\ ACSS < 4 (Iverson & Tulsky, 2003). The ACSS cut-off score < 4 yielded high specificity rates, but only
i moderate sensitivity rates (Iverson & Tulsky, 2003). Babikian et al. (2006) conducted a study in which they
I compared ACSS and RDS scores of suspected malingering, neuropsychology outpatient, and nonnal control .~
) groups on either the WAIS-III or the WAIS-R Digit Span subtest. Consistent with the findings ofIverson & "
"
I
-,. ..... --~ ::"'~' ' T4;;f .... ·*..j,""~*'"~ ..... ,.......AeI..wJoo .. .oj~· __ .... w.\.,4»~f.M~\\~'__"~~~.~.!~:ti\tt_.~fJfl_a«\\'ffJ~'! .. J~rl~'\tti\\~'Mlnk~4·'{lf~\~t,~1';' !\-:\'\I, '\;),l"\' !~\ . ?- H1,r/. t~i1.\'''' r; .. '~f "", f\ tA~\\'~ '\\~;y:

................... -----------------------------------
Normative Indicators 16 , Tulsky (2003), the results ofthe study by Babikian et al. (2006) indicate that an ACSS score of 5 or less is a r
relatively sensitive cut-off score (Babikian et aI., 2006). Babikian et al. (2006) additionally found that a
RDS score of 6 or less was more sensitive to accurately detect malingering than the cut-off scores of 7 or 8
I, suggested in the studies mentioned above (Babikian et aI., 2006). )
, However, in their study comparing the ACSS and RDS scores from the WAIS-III digit span test on a group
of probable malingerers and two TBI patient groups, Axelrod et al. (2006) found that ACSS was the best
11 measure of malingering (Axelrod et aI., 2006). They recommended a cut-off score of ~ 7, which is higher
tj than the ACSS cut-off suggested by Iverson & Tulsky (2003) and Babikian et aI. (2006). Using this cut-off
'1 Overall, Axelrod et aI. (2006) suggest that the digit span subtest should not be used as the only measure for
. ~ the assessment of malingering, and recommend that it be used in combination with other indicators of
,~ malingering . '\
score of ACSS ~ 7 produced a sensitivity rate of 75% and specificity rates of 69-77% (Axelrod et aI., 2006).
I
'\ Overall, these studies have indicated that the measures ofRDS and ACSS are those most commonly used to
I assess malingering from the Digit Span silbtest of the W AIS-RlW AIS-III. Findings have varied substantially
:~ be~een studies, wi~ cut~off sc~re~ ranging from 6-8 for the RDS and 4-7 for the ~~SS. A summary of the
Ii fmdmgs of the studIes mvestIgatmg the ACSS and RDS measures from the DIgIt Span subtest of the
W AIS-RIW AIS-III that have been reviewed here is presented in Table 3.
I 1.3.2 The Trail Making Test
, Another commonly administered test that has also recently been examined for its efficacy as a measure of I :! malingering is the Trail Making Test (Egeland & Langfjaeran, 2007; Iverson et aI., 2002; O'Bryant et aI., I
'II 2003; Ruffolo et aI., 2000). A number of different measures of the Trail Making Test have been evaluated as
:1 being possible indicators of malingering, including: total time taken to complete Trail A and Trail B,
J number of errors made on Trail A and Trail B, and the ratio of the completion time on Trail B to the
, completion time on Trail A (TMTB: TMTA) (Egeland & Langfjaeran, 2007; Iverson et aI., 2002; O'Bryant i I: et aI., 2003; Ruffolo et aI., 2000). Varying results have been found using these different measures. ,i 11 i ~
I ! ;. ,
,j i
'I I \
.-:4P ; 2?4¥ :Vii,*,? .

,ll
'i J Normative Indicators 17 i
1 Table 3
Summary Table of Findings from the Digit Span Subtest of the W AlS-R/W AlS-III
Authors Sample N Age (in years) Education RDS ACSS Sensit- Specif Cut-off
1 (in years) ivity -icity
M SD M SD M SD M SD (%) (%) RDS ACSS
Greiffenstein TBI group 33 33.1 9.5 11.3 I 8.8 1.2 - - -, 73/54' < 7/8c -" , et al. (1994)
PPCS group 30 37.6 13.9 11.7 0.8 8.9 1.1 - - - 89/69b < 7/8c -i
i
Probable i malingerer 43 39.3 10 11.1 2.2 6.7 1.2 - - 70/82' - < 7/8c -
i group 68/82b
Larrabee Defmite 26 39.33 11.78 12.54 2.25 -' - - - 50 - < 8a -(2003) malingerer
!1 group
-
1 Moderate- 31 34.80 16.78 12.56 2.56 - 5 - - - 93.5 <8d -
. , severe closed head injury , group
:I . Inman & Head injured 21 18.67 0.91 12.48 0.98 9.19 2.27 - - 27 - < 8e -d
Berry (2002) simulated i . "
malingerers
,i 1.69 100 <8e ., Head injured 24 18.67 12.25 0.61 11.58 2.39 - - - -i
, controls
I I Normal 23 18.91 1.27 12.83 1.19 8.09 2.41 - - 27 - <8e -,1 simulated
malingerers ,
i Normal controls 24 18.42 0.88 12.21 0.51 10.83 2.16 - - - 100 <8e -Iverson & Mixed clinical 123 55 17.7 - - - - 10.1 2.8 - - - <415'
Tulsky sample (2003)
Matched 105 54 18.5 - - - - 10.6 3.1 - - - < 415 f
controls Babikian et Suspected 66 42.5 12.3 13 2.4 6.7 2.4 6.2 3.1 45142' ::: 6n
::: 5n
al. (2006) malingerer group
'! 93/93g ::: 6h ::: 5h
i Clinical patient 56 48.4 16.4 13.3 2.4 8.9 2 8.8 2.8 -, group
Normal control group 32 72.5 4.8 14.2 2.1 9.28 1.61 9.42 2.20 - 93/93g <6h <5h
I Axelrod et Non- 29 38.2 17.8 12.8 2.1 8.6 1.8 8.5 2.1 - 69' - :::7J
al. (2006) malingering TBI group
Probable 36 43.1 11.9 12.5 1.6 6.9 2.2 6.3 2.1 753 - - :::7i
I malingering .,
group
Non-litigating 22 43.2 16.4 13.1 2.6 9.5 2.1 9.7 2.7 - 7i - :::7i
mild TBI group Note: PPCS - Persistent postconcussive syndrome; RDS - Reliable Digit Span; ACSS Age Correlated Scaled Scores 'Rates calculated from comparison between TBI and probable malingerer groups. The fIrst number is based on a cut-off score of RDS < 7 and the second score is based on a cut-off score ofRDS < 8. "Rates calculated from comparison between PPCS and probable malingerer groups. The fust number is based on a cut-off score ofRDS < 7 and the second score is based On a cut-off score ofRDS < 8. "The frrst cut-off score was set at -1.3SD of the TBI group mean and the second cut-off score was set at -I.OSD of the TBI group mean. dCut-offscore devised using a formula derived from comparisons between the 2 participant groups. 'Cut-off score suggested by previous researchers. 'Cut-off score suggested from base rate data for ACSS from standardisation sample & other clinical samples in WAIS-III manual. "The flTst sensitivity and specificity rates given based on a cut-off score of RDS :'0 6 and the
i second rates given based on cut-off score of ACSS :'0 5. 'eut-offs were suggested as they yielded the most acceptable sensitivity and specificity rates altogether. 'Based on a cut-off
1 SCore of ACSS:'O 7. iCut-off score suggested as it was found to be the best discriminating index and score. i r ;
f I ! i )
\ 'f '-" '.' l1li

Nonnative Indicators 18 \ For instance, in their study comparing error rates, Trail B:A ratios and completion times for both Trails A
and B on a sample of head injured patients, suspected malingerers, simulated malingerers, and nonna!
controls, Ruffolo et al. (2000) found that the two malingerer groups perfonned slower and obtained much "{,?
;J . higher error rates on both Trails A and B than all of the other participant groups. From the results of this
study, Ruffolo et al. (2000) suggest that completion times and error scores on both Trails A and B of the
Trail Making test are the best indicators of malingering. They were unable to establish a cut-off score for
~ completion times for both Trails A and B, as there was significant variability within the head-injured "l~
'j participant groups for these scores (Ruffolo et aI., 2000). However, they recommend that a cut-off error ",!
score of 4 or more errors on either Trail A or B be used as a possible indicator of malingering (Ruffolo et
aI.,2000).
,I Iverson et aI. (2002) conducted a similar study whereby they investigated completion times on Trails A and
B and Trail B:A ratios for a group of 571 head injured participants. The researchers then utilised scores that ',::
"',1,1:. ::s:tc:~:~~: ::;o::~~:;~ ::t~::~:~:m~:;:'~~:~=;: 2:: ::::;;: • B:A ratio of ::: 1.49. Applying these cut-off scores to a sample group of 228 litigating head injured patients,
these researchers found that the Trail B:A ratio score yielded very low sensitivity rates of 2.4-7.4% and they
concluded that this measure is of little value as an indicator of malingering (Iverson et aI., 2002). On the
other hand, their results suggested that completion times for Trials A and B were both more accurate
indicators of malingering, showing similar findings to those of Ruffolo et aI. (2000). However, these
measures still yielded very low sensitivity rates of only 7.1-18.5% for all participant groups (Iverson et aI.,
2002). These researchers therefore concluded that, overall, the Trail Making Test is limited in its value as a
measure of malingering (Iverson et aI., 2002). O'Bryant et al. (2003) examined error rates and Trail B: A
ratio scores in a group of suspected malingering and non-malingering TBI litigating patients (total N = 94).
Their fmdings indicated that the suspected malingerers and non-malingerers did not differ significantly in
! Trail Making Test error scores, while the suspected malingering group obtained significantly lower Trail .'t
B:A ratio scores than the non-malingering group (O'Bryant et aI., 2003). Nonetheless, consistent with the
j fmdings by Iverson et al. (2002) and Ruffolo et aI. (2000), they found that Trail B:A ratio scores still yielded ,J
'1 '.1
.1 .\ \i
d '!
low sensitivity and specificity rates (63% and 45% respectively). Similarly, Egeland and Langfjaeran (2007)
obtained a fairly low sensitivity rate of 61 % and specificity rate of 57% using the cut-off score of Trail B:A
ratio :s 2.5 in their study comparing a group of possible malingering, cognitively impaired and cognitively
normal litigants.

Nonnative Indicators 19 overall, these studies have indicated that clinicians should exercise caution when using the Trail Making
fi test as an indicator of malingering, particularly when using the Trail B: A ratio score. Cut-off scores of 2: 4
'JJ errors on either Trail, 2: 63 seconds completion time on Trail A, 2: 200 seconds completion time on Trail B
) and Trail B:A ratio scores of:s 1.49 and :s 2.5, have been suggested. A summary of the demographic
!I information and results from the studies investigating the Trail Making Test that have been reviewed here is
,l 'I' ~
I
presented in Table 4. A summary of the suggested cut-off scores and the corresponding sensitivity and
specificity rates from the studies reviewed is presented in Table 5.
1.4 Overall Findings on the Four Tests Used to Assess Malingering Reviewed
1'1 The majority of the studies reviewed above made comparisons in tenns of the factors of age, gender and/or
education between the varying participant groups that they utilised. However, the only studies to investigate
whether any of these factors have an impact on neuropsychological test perfonnance in a focussed way are
those conducted by Tombaugh (1996, 1997). In these studies validating the TOMM, Tombaugh (1996,
1997) found that age and education did not have any significant effects on test perfonnance on any of the
'i trials of this test. All the other studies reviewed did not specifically investigate the role that these factors
~J may have played on test results. i1 " II Overall, the studies described above have shown variable results in the validity of the TOMM, the Rey 15-
'1 Item Test, the Diait Span subtest of the WAIS-RIWAIS-III, and the Trail Making Test as measures to detect
',.,' malingering. Ho;ever, in the case of each test, it was suggested that the use of malingering indicators on
that test, taken alongside clinical observations, should be able to at least provide some suggestion of
i suspected malingering.
'1
1.5 The Effect of Culture, Language and Quality of Education on Neuropsychological Test Performance
The nonnative data and proposed cut-off scores for the tests reviewed above been obtained from studies
conducted in westernised countries such as the United States of America, Canada, or England, using
samples consisting of predominantly white participants, usually with English as their first language,

Normative Indicators 20 Table 4
Summary Table of Demographic lriformation and Results from Reviewed Studies on the Trail Making Test
Authors Sample N Age Education Trail A Time TrailB Time Trail A Trail B Trail B:A (in years) (in years) (in sees) (in sees) Errors errors Ratio M SD M SD M SD M SD M SD M SD M SD
Ruffolo et al. Mild head injury 62 35.9 13.4 12.6 2.2 39.5 17.7 84.6 42.1 0.27 0.52 0.50 0.74 2.14 -(2000) group
Moderate-severe 46 29.8 11.4 11.9 1.7 39.6 31.5 90.3 41 0.17 0.44 0.59 0.93 2.28 -head injury group
Suspected malingerers 7 31.3 6.1 11.3 3.4 69.6 33 160.9 78.3 0.29 0.49 1.57 1.81 2.31 -
Simulated malingerers 31 30.3 12.9 15 2.4 103.3 46.9 116.6 37.4 2.87 2.13 3.65 2.59 l.l3 -Normal controls
49 29.1 12.1 14.3 1.9 26.6 7.9 57.2 17.2 0.14 0.41 0.47 0.77 2.15 -Iverson et al. Uncomplicated 328 31.6 12.2 12.3 2.3 30.99 12.77 82.39 44.63 0.21 0.48 0.63 0.98 2.75 1.11 (2002) mild TBI patients
Mild TBI with 86 30.2 11.5 11.7 1.8 34.40 15.90 94.41 51.12 0.26 0.46 0.88 1.51 2.87 1.37 skull fracture patients
Complicated mild 117 34.8 14.4 12.2 2 36.77 15.03 104.93 48.85 0.15 0.45 0.86 1.38 2.98 1.15 TBI patients
Moderate-Severe 40 34.7 15 11.8 1.8 50.78 28.36 154.65 68.81 0.15 0.43 0.88 1.72 3.32 2.01 TBI patients
Non- malingering 77 38.9 10.8 12.2 2.8 27.69 8.87 67.84 26.79 - - - - 2.57 1.01 very mild TBI patients
Non-malingering 83 34.4 13.7 11.4 2.6 32.14 13.82 79.59 46.60 - - - - 2.51 1.03 well-defined TBI patients
Suspected 69 - - - - 44.27 18.98 122.75 80.60 - - - - 2.83 1.46 malingering combined TBI patients
O'Bryant et Suspected 27 44.5 11.7 12.3 1.8 73.4 36.3 143.4 74.9 0.43 0.63 0.81 1.27 2.01 0.58 al. (2003) malingerers
Non-malingerers 67 39.6 12.5 13.5 2.8 41.7 20.1 100.1 61.8 0.13 0.49 0.37 0.67 2.44 0.99
Egeland & Litigating possible 41 44 11 10.2 2.2 61 22 147 68 - - - - 2.47 0.94 Langfjaeran malingerers (2007)
Litigating impaired 30 44 12 10.2 1.4 44 19 121 67 - - - - 2.76 1.05 participants
Litigating normal controls 17 42 13 10.8 1.5 41 17 118 65 - - - - 2.89 0.98

Normative Indicators 21 Table 5
Summary Table of Cut-Off Scores from Reviewed Studies for the Trail Making Test
Authors Sample N Cut-off Sensitivity Specificity (%) (%)
Trail A TrailB Trail A Trail B Trail Time Time Errors Errors B:A (in (in Ratio seconds) seconds)
Ruffolo et al. Mild head injury 62 - - ~4a ~4a - - -(2000) group
46 - - ~4a ~4a - - -Moderate-severe head injury group
7 - - ~4a ~4a - - -Suspected malingerers
31 - - ~4a ~4a - - -Simulated 49 - - ~4a ~4a - - -malingerers
Normal controls Iverson et a1. Non-malingering 77 ~63b ~200b - - :s 1.49" - 100c/l00d87" (2002) very mild TBI
group
Non-malingering 83 ~63b ~200b - - :s 1.49b - 97.6c/95.25d/89.2" well-defmed TBI group
Suspected 42 ~63b ~200b - - :s 1.49b 16.76c/7.ld/ -malingering very 2.4" mild TBI group
Suspected 27 ~63b ~200b - - :s 1.49b 11.1cI18.5d/ -malingering well- 7.4" defmed TBI group
Non-malingering 160 ~63b ~200b - - :s 1.49b - 98.8c/97.5d/88.l " combined TBI group
Malingering 69 ~63b ~200b - - :s 1.49b 14SI11.6d/ -combined TBI 4.3" group
O'Bryant et al. Suspected 27 - - - - - 63 -(2003) malingering group
Non-malingering 67 - - - - - - 45f
control group Egeland & Litigating possible 41 - - - - <2.5 68 -Langfjaeran malingerers (2007)
Litigating impaired 30 - - - - <2.5 - 57 participants
Litigating normal 17 - - - - <2.5 - 57 controls
a .. . . This cut-off score IS based on the results of comparisons between the five partiCIpant groups utilISed m this study
bThese cut-off scores were based on performances by a TBI patient group with varying severities of head injuries. Cut-off scores were devised from those scores that were at or below the Sib percentile for this sample. 'Based on time on Trail A dBased on time on Trail B "Based on Trail B:A ratio ~o definite cut-offs were given and sensitivity and specificity rates were based on the Trail B:A ratio scores.
Normative Indicators 22 generally having at least 12 years of education, and frequently even tertiary education (Arnett et aI., 1995;
Axelrod et aI., 2006; Babikian et aI., 2006; Egeland & Langfjaeran, 2007; Fisher & Rose, 2005;
Greiffenstein et aI., 1994; Inman & Berry, 2002; Iverson et aI., 2002; Iverson & Tulsky, 2003; Larrabee,
2003; Lee et aI., 1992; O'Bryant et aI., 2003; 2007; Rees et aI., 1998; Ruffolo et aI., 2000; Teichner &
Wagner, 2004; Tombaugh, 1996, 1997; Yanez et aI., 2006). Subsequently, no data are currently available
that examine the utility of these cut-off scores in different cultures, in people whose fIrst language is not
English, and in people with varying levels and quality of education. However, these factors cannot be
ignored, as they have each been shown to play an important role in neuropsychological test performance
(Ardila, 2005; Roselli & Ardila, 2003; Shuttleworth-Edwards, Donnelly, Reid & Radloff, 2004;
Shuttleworth-Edwards, Kemp et aI., 2004; Nell, 1999; Shuttleworth-Jordan, 1996). Each of these factors
f will therefore be explored briefly below.
1
I 1, '
1.5.1 Culture
It has been well documented and accepted that culture plays a role in neuropsychological testing, given that
this, like any other social situation, is governed by commonly accepted cultural rules (Ardila, 2005;
Shuttleworth-Edwards, Donnelly et aI., 2004; Shuttleworth-Edwards, Kemp et aI., 2004; Shuttleworth
Jordan, 1996; Rosselli & Ardila, 2003). Commonly used neuropsychological tests are generally developed
on the basis of middle-class, westernised ways of thinking and understandings of intelligence. As a result,
poor test performance in individuals from different cultures may be a reflection of different cultural
interpretations, rather than an indication of a low level of cognitive functioning (Ardila, 2005; Nell, 1999;
Rosselli & Ardila, 2003; Shuttleworth-Edwards, Kemp et aI., 2004; Shuttleworth-Jordan, 1996).
In other words, variations in neuropsychological test performance depend on differences in "acculturation"
to middle-class westernised cultures (Byrd, Touradji, Tang & Manly, 2004; Helms, 1992; Shuttleworth
Edwards, Kemp et aI., 2004). Acculturation is the extent to which an individual has adopted the values and
traditions of westernised culture as their own, and this has been found to be a more potent variable than the
ethnicity or race of the individual being tested (Byrd et aI., 2004; Helms, 1992; Shuttleworth-Edwards,
Kemp et aI., 2004).
Nell (1999) suggests that an important factor to be considered when applying psychological tests to different
cultures is the level of test-wiseness of the individual being tested. He argues that, in western societies, test-

Normative Indicators 23 taking skills are "absorbed" rather than directly taught, and it is therefore taken for granted that when a test
of any type is being taken, one needs to be highly motivated, needs to apply a high level of concentration on
the task at hand, and needs to work both as accurately and as quickly as possible (Nell, 1999; Shuttleworth
Edwards, Kemp et aI., 2004). On the other hand, individuals from non-westernised cultures may not have a
high level oftest-wiseness, and may believe that it is more important to produce accurate and careful work,
regardless of the time taken to complete it (Helms, 1992). As such, individual test performance will be
impacted by the type of educational institution attended. The factor of culture is thus closely inter-related to
the factors of quality and type of education received and language, which will be discussed further below,
1,5.2. Level and Quality of Education
Much research has been conducted evidencing a relationship between level of education and improved
neuropsychological test performance (Lezak et aI., 2004; Shuttleworth-Edwards, Donnelly et aI., 2004),
However, in South Africa, level of education is a less accurate predictor of test performance than quality of
'j education, given that differing qualities and types of education were made available to varying race groups
in this country under the legislature of the Apartheid system (Shuttleworth-Edwards, Donnelly et aI., 2004).
As such, the majority of black people in South Africa attended schools run by the former Department of
Education (DET schools), which received a substantially lower amount of financial resources than schools
attended to by white children (Claassen, Krynauw, Paterson & Mathe, 2001).
Although these disparities in educational systems no longer officially exist, former DET type schools still
receive education that is of a significantly lower standard to that received at Model C/private schools, with , " former DET type schools placing an increased emphasis on rote learning rather than focussing on problem-
solving ability like the model C/private schools (Grieve & Viljoen, 2000). Furthermore, problems continue
to persist in former DET type schools, especially in the Eastern Cape, where significant shortages of
teachers, furniture, buildings, textbooks and stationery are forcing pupils to leave school early (Matomela,
2008). Quality of education is therefore an especially potent variable in neuropsychological test
performance in this area in South Africa, as poor test results are likely to be a reflection of the type of
education received rather than actual cognitive ability,
Accordingly, a recent study conducted by Shuttleworth-Edwards, Kemp et al. (2004) illustrates the impact
of quality of education on neuropsychological test performance. In this study, it was found that scores on the
English administration of the Wechsler Adult Intelligence Test Version III (WAIS-III) for white, English

, ! I I I I
Normative Indicators 24 fIrst language speakers and black, indigenous South African fIrst language speakers with advantaged
educational backgrounds were reliably comparable to normative data taken from the United States. On the
other hand, scores for black indigenous South African language speakers with relatively disadvantaged
educational backgrounds (former DET-type education) were found to be substantially (approximately 20 IQ
points) lower than US norms (Shuttleworth-Edwards, Kemp et aI., 2004). These fmdings therefore indicate
that, regardless of whether or not English is the fIrst language of an individual, if that individual has
attended an advantaged educational institution, he/she is more likely to obtain higher scores on cognitive
tests. However, the factor of language is very closely linked to the factor of quality of education and both of
these play an equally important role in neuropsychological test performance.
1.5.3 Language
Standard neuropsychological tests are generally developed in middle-class, westernised countries, where
English is the fIrst language and, as a result, standard test instructions assumed to be easily understandable
for all participants, may be misinterpreted by people whose fIrst language is not English and who may have
different understandings of words and concepts to those expected by the test developers and administrators
(Ardila, 2005). In South Africa, there are 11 offIcial languages, each of which has a further number of
varying dialects. As a result, it would not be viable to translate standard neuropsychological tests into the
relevant language of the test taker, as translation would be very costly and there would be too many
different translations required. Furthermore, standard neuropsychological tests, administered in English,
including those used to assess malingering reviewed above, have been well-established and validated on
wide ranges of samples. Normative data currently available for these tests are additionally based on them
being administered in English. Consequently, it is more feasible to administer these neuropsychological
tests in their standardised English form and obtain appropriate normative data for second language English
speakers, such as has been the model in the research conducted by Shuttleworth-Edwards and her colleagues
(Shuttleworth-Edwards, Donnelly et aI., 2004; Shuttleworth-Edwards, Kemp et aI., 2004; Shuttleworth
Jordan, 1996).
Using this model in the study described above, Shuttleworth-Edwards, Kemp et aI. (2004) found that black
indigenous South African language speakers who had received an advantaged education performed to a
level comparable to the United States normative data on the WAIS-III (Shuttleworth-Edwards, Kemp et aI.,
2004). It may be extrapolated that a possible reason for these differences in performance between black,

Nonnative Indicators 25 indigenous language speakers with a more advantaged educational background and those who were
schooled in fonner DET-type schools, is that the fonner participant group was likely to have had a better
grasp of the English language. This is attributable to the fact that advantaged educational institutions teach
in the medium of English and students who attend these institutions therefore develop a relatively high level
of English proficiency, even if English is not their first language. On the other hand, in fonner DET -type
schools, English is frequently not the language of tuition and students are only required to learn it as a
subject at second-language level. It can therefore be seen that the factors of language and quality of
education are strongly enmeshed. This is further highlighted in the work of Manly, Byrd, Touradji, Sanchez
& Stem (2004), which has indicated that reading level is one of the strongest predictors of
neuropsychological test perfonnance and is partly reflective of quality of education. These findings
therefore illustrate the importance of language in neuropsychological test perfonnance and also show the
intricate link between the factors of language and education.
Overall, culture, language, and quality of education, are necessary variables to be considered when applying
any neuropsychological tests to the South African context. Given the significant role of malingering in
neuropsychological assessment, especially considering the possibility of financial compensation for those
people deemed to be neuropsychologically impaired, such nonnative indicators for this population should be
obtained for the English administration of those tests commonly used to detect malingering too, seeing as
current nonns and cut-off scores are only available in respect of more advantaged populations. Considering
the particularly poor quality of education delivered in the Eastern Cape province, it is especially important
that appropriate nonnative data be obtained for the people who have received a relatively disadvantaged
education in this area in South Africa.
1.6 Objectives of Current Study
Taking the above review of the literature into account, this study subsequently aims to obtain nonnative data
for the four tests examined above, administered in English, from a relatively disadvantaged population of
black South Africans with no tertiary education, who attended a previously disadvantaged (fonner DET
type) school in the Eastern Cape, and who speak Xhosa as their first language. The nonnative scores
obtained from this study can then be compared to current cut-off scores in order to establish whether these
can viably be used in this population as indicators of malingering, or whether this popUlation generally
perfonn at a lower level and will thus attain lower than expected scores, even when they are not
malingering.

Nonnative Indicators 26 As such, this study aimed to meet the following specific objectives:
1.) To attain nonnative data (means and standard deviations) for the TOMM, the Rey-15 Item Memory
Test, the Digit Span subtest of the WAIS-III, and the Trail Making Test, administered in English, on
a population of black, South African, Xhosa-speaking people, who attended a fonner DET-type
school in the Eastern Cape, with a Grade 11-12 level of education, in the age range of 18-40 years.
2.) To establish tables of cut-off scores indicative of malingering for the TOMM, the Rey-15 Item
Memory Test, the Digit Span subtest of the WAIS-III, and the Trail Making Test, administered in
English, on a population of black, South African, Xhosa-speaking people, who attended a fonner
DET-type school in the Eastern Cape, with a Grade 11-12 level of education, in the age range of 18-
40 years.
3.) A subsidiary aim was to investigate any differences for younger and older age (18-29 versus 30-40)
and gender within the sample to identify whether there was a need for separate nonnative indications
and cut off scores for either of these factors.

·J )i
d, I
Normative Indicators 27 2. Method
2.1 Sample
A non-clinical sample of 33 black participants with Xhosa as their fIrst language, ranging in age from 18-40
years (mean age = 28.39 years; SD = 5.989), was utilised in this study. All participants were born in,
attained their education from, and currently reside in, the Eastern Cape province in South Africa.
:,' Participants were drawn from this province, as this area has been identifIed as one where the quality of . "~
.' \ education is particularly poor, even when compared to that obtained from former DET-type schools in other
provinces (Matomela, 2008). The majority of the participants (n=19) held jobs as casual workers at the
Rhodes University campus, primarily in the housekeeping and grounds and gardens departments. Several
others (n=7) held various jobs at a fast food outlet in Grahamstown, primarily working in the kitchen or as
waitrons. The remaining 7 participants were unemployed at the time of the study.
2.1.1 Language
Xhosa is the most prominent of the 11 offIcial South African languages spoken in the Eastern Cape
province. Subsequently, in order to ensure as much homogeneity as possible in the sample, all participants
included spoke Xhosa as their fIrst language. However, as all of the tests included in this study were
administered in English, it was also necessary to ensure that all participants were profIcient in English. As a
result, only people who either worked in an English environment at the time of the study, or had previously
worked in an English environment, were included in the sample. Rhodes University is an English
environment and all participants who were casual workers on the university campus received work
instructions and communicated with their supervisors in the medium of English. The participants who
worked at a fast food outlet similarly spoke in English to their supervisors and customers. Additionally, all
participants who were unemployed at the time of the study had previously held jobs in which they were
required to communicate in English on a daily basis. All participants were questioned extensively at the
time of testing about their English language usage in order to ensure that they all spoke this language on a
regular basis. Furthermore, all participants were required to have passed English as a second language
school subject at the Grade 11 or Grade 12 level. This was assessed by reviewing the participants' school
reports and/or Matric certifIcates and looking at the marks that they had attained for English. Participants

1 ,J
Nonnative Indicators 28 also gave a subjective rating from poor to excellent of their grasp of the English language and were
questioned about their reasons for the rating given on the pre-test screening questionnaire administered to
them at the time of testing (see Appendix B). It was not considered necessary to exclude any of the
participants on the basis of not being proficient in English for any of these screening procedures adopted.
2.1.2 Level and Quality of Education
The sample included participants who had acquired at least a Grade 11 level of education, with no tertiary
education. This would ensure that participants had attained a high level of senior school education without
having studied further, thereby representing the nonnal population. As previously discussed in the literature
review section above, differing qualities and types of education were offered to varying race groups under
the Apartheid regime, with the black people receiving education from fonner DET schools. Although this
DET system of education no longer officially exists, fonner DET schools found in the more economically
disadvantaged areas of South Africa, such as the townships or locations and particularly in the Eastern Cape,
still receive a poorer quality of education to other types of schools in this country (see literature review
above). Subsequently, all participants included in this sample were required to have received their education
from a township or fonner DET type school in the Eastern Cape.
2.1.3 Age
The sample was stratified into two groups according to age in order to assess whether age would have an
effect on test perfonnance on any of the measures of malingering utilised in this study. As such, the
participants were divided into a group of 18-29 year olds (n = 17; mean age = 23.65 years, SD = 3.463;
mean education = 11.76 years, SD = 0.437) and a group of 30-40 year olds (n = 16; mean age = 33.44 years,
SD = 3.326; mean education = 11.69 years, SD = 0.479). There were no significant differences in
distribution of highest grade achieved or of gender between the two age groups (p = > 0.05 in both
instances). The distribution tables and Pearson Chi-Square data for highest grade obtained and gender in the
two age groups are presented in Tables 6 and 7 respectively.
The complete age range of 18-40 was chosen, as people located within this age range are most at risk for
suffering from a TBI.

-, \
,:~ '.
t' ./ '
'.': ;!
.,,'.
"
':
\
:; ·:t
:; ~
.~\
1 ,
'~.
1
1
1 1'1
I
l
Normative Indicators 29 Table 1
Distribution of Highest Grade Obtained in the Two Age Groups
Grade
11 12 Total
Age 18-29 yrs Count 4 13 17
% within Age 23.5% 76.5% 100.0%
30-40 yrs Count 5 11 16
% within Age 312% 68.8% 100.0%
Total Count 9 24 33
% within Age 27.3% 72.7% 100.0%
Pearson Chi-Squarep = 0.619
Table 7 Distribution of Gender in the Two Age Groups
Gender
Female Male Total
Age 18-29 yrs Count 10 7 17
% within Age 58.8% 41.2% 100.0%
30-40 yrs Count 11 5 16
% within Age 68.8% 31.2% 100.0%
Total Count 21 12 33
% within Age 63.6% 36.4% 100.0%
Pearson Chi-Square p = 0.554
2.1.4 Gender
The sample was divided into two groups according to gender in order to explore whether
an effect on test performance on the measures of malingering used in this study. The fema
gender would have
Ie group consisted
ion of 11. 76 years
ears (SD = 4.622)
of 21 participants, with a mean age of 28.90 years (SD = 6.7) and a mean level of educat
(SD = 0.436). The male group comprised of 12 participants, with a mean age of 27.50 y
rences in the and a mean level of education of 11.67 years (SD = 0.492). There were no significant diffe

Normative Indicators 30 distribution of highest grade completed or age between the two gender groups (p = > 0.05 in both instances).
Distribution tables and Pearson Chi-Square data for highest grade obtained and age in the two gender groups
are displayed in Tables 8 and 9 respectively.
Table 8 Distribution of Highest Grade Obtained in the Two Gender Groups
Highest_Grade
11 12 Total
Gender Female Count 5 16 21
% within Gender 23.8% 76.2% 100.0%
Male Count 4 8 12
% within Gender 33.3% 66.7% 100.0%
Total Count 9 24 33
% within Gender 27.3% 72.7% 100.0%
Pearson Chi-Square p = 0.555
Table 9 Distribution of Age in the Two Gender Groups
Age
18-29 yrs 30-40 yrs Total
Gender Female Count 10 11 21
% within Gender 47.6% 52.4% 100.0%
Male Count 7 5 12
% within Gender 58.3% 41.7% 100.0%
Total Count 17 16 33
% within Gender 51.5% 48.5% 100.0%
Pearson ChI-Square p = 0.554
2.1.5 Exclusion Criteria
Exclusion criteria included: any reported history of a neurological disorder or traumatic brain injury (loss of
consciousness> 1 hour); any current psychiatric disorder; any prenatal or birth complications; a history of
learning disability; the need for special education; two or more repeated school grades; the current use of
psychotropic medications; a diagnosis of substance abuse or recreational drug use in the year prior to

Normative Indicators 31 testing; or an admission to a rehabilitation facility or ward for substance abuse. The application of these
criteria ensured that the participant group would be representative of a non-clinical population of normal,
well-functioning individuals within this population. Information regarding these exclusion criteria was
based on self-report and was obtained from an initial biographical questionnaire (see Appendix A)
completed by all prospective participants, as well as from an additional pre-test screening questionnaire (see
Appendix B) completed by all participants at the time of testing.
2.3 Procedure
This study formed part of a larger research investigation into the collection of normative data on the same
sample for sixteen neuropsychological measures across a spectrum of functional modalities.
2.3.1 Data Collection
The research was conducted in Grahamstown, in the Eastern Cape province and Rhodes University was
\, chosen as a research site for the purpose of convenience. Permission was fIrst acquired from the registrar to
utilise this university as a research site. The researchers also liaised with the Human Resources department
of this university to use staff from Rhodes University as participants for this study. This department then
identifIed the casual staff from this university as a suitable sample group who met the required criteria for
this study. Thereafter, the researchers were granted access to the entire database of Rhodes University
casual staff. The researchers searched this database and compiled a list of individuals who had completed a
Grade 11 or Grade 12 level of education.
The identifIed individuals were contacted and invited to attend one of two research presentations held by the
research team. The individuals were informed that any transport costs (standard taxi fares) would be
reimbursed following attendance at one ofthese presentations. During these presentations, the prospective
participants were given information about the purpose of the study, as well as details of what their
participation in it would entail. They were also asked to complete a biographical questionnaire (see
Appendix A). The information obtained from this questionnaire allowed the researchers the opportunity to
identify participants who met the inclusion criteria for the study. These participants were contacted and
invited to participate in the research if they so desired. During this process, it became apparent that only a
small number of suitable participants would be willing and able to participate in the study. Subsequently, the

Normative Indicators 32 researchers then utilised snowball sampling, asking the existing sample to identify further prospective
participants. These participants were then contacted and asked to complete the biographical questionnaire
(see Appendix A), and those who met the inclusion criteria for the study were invited to participate. All
participants were offered a voucher from Steers valued at RIOO,OO as a means of encouraging participation
in the study.
Once the sample had been identified, an equal number of participants was randomly allocated to each
member of the research team. The research team consisted of three intern clinical psychologists and one
intern counselling psychologist, all of whom had been trained in the administration and scoring of each test
administered in this study by a qualified clinical psychologist. The four members of the research team also
practiced administering the entire battery of neuropsychological tests utilised in this study on each other in
order to ensure a consistent and standardised method of test administration. Thereafter, each researcher
tested the participants that they had been allocated. At the time of testing, each researcher clearly stipulated
the voluntary nature of participation in this study and a consent form was explained to and signed by each
participant (see Appendix C for the consent form). The researcher then administered a pre-test screening
questionnaire (see Appendix B), as well as a battery of neuropsychological tests in English, and in a
standardised order, to each participant.
2.3.2 Materials
Four tests commonly used as measures of malingering were administered as part of the battery of 16
standard neuropsychological measures that were involved in the larger study covering a spectrum of
functional modalities (see Table 10 for a list of all the tests included in the neuropsychological test battery
utilised in this study, written in the order in which they were routinely administered on all test occasions).
The results of these tests were utilised as data for another three research studies. However, for the purposes
of this study, the results of the following tests (which have been reviewed in the literature review section
above) were used and examined further:
The test of memory malingering (TOMM). The TOMM is a recognition task containing two learning trials
and an optional retention trial. During the two learning trials, participants are shown 50 items for 3 seconds
each and are then shown 50 recognition panels containing 2 pictures, only 1 of which was previously shown

" ;'! i'J
;j
':; ,\'
;r:
1;
"
'j:~ ,~ \'l ',; ]~
,;, :,
\'
~
Nonnative Indicators 33
Table 10 Order of Presentation of Tests in the Overall Neuropsychological Test Battery with Emphasis on Tests in the Present Study.
Name of Test Author :'-'.::::.;"---------{
1. Wechsler Memory Scale (WMS) Reproduction for Designs - Immediate Recall Wechsler, 1945 2. Wechsler Memory Scale (WMS) Paired Associates - Immediate Recall Wechsler, 1945 3. Successive Finger Tapping Test Denckla, 1973 4. Purdue Pegboard Tiffin & Asher, 1948 5. Trail Making Test - Trail A and Trail B Reitan, 1956 6. Wechsler Memory Scale (WMS) Reproduction for Designs - Delayed Recall Wechsler, 1945 7. Wechsler Memory Scale (WMS) Paired Associates - Delayed Recall Wechsler, 1945 8. Digit Span Subtest ofWAIS-Ill - Forwards and Backwards Wechsler, 1997 9. Rey-Osterreith Complex Figure - Copy and Immediate Recall Osterreith, 1944 10. TOMM - Trial 1 and Trial 2 Tombaugh, 1996 11. Words-in-a-Minute Baker & Leland, 1967 12. 'S' Words-in-a-Minute Benton, Hamsher, & Sivan, 1994 13. Stroop Test Golden, 1978 14. TOMM - Retention Trial Tombaugh,1996 15. Rey-Osterreith Complex Figure - Delayed Recall Osterreith, 1944 16. Rey IS-Item Memory Test Rey, 1964
to them. Participants are required to point to the picture which has been viewed previously. The retention
trial is administered approximately 15 minutes after Trial 2. During this trial, the participant is only shown
50 recognition panels and required to point to the picture they have seen previously. On each trial, 1 point is
given for every correct answer, giving a total score out of 50 for each trial. Although the retention trial is
optional and is usually only required to be administered if participants received less than 45 out of 50 on
Trial 2 (Tombaugh, 1996), it was decided that this trial would be administered to all participants regardless
of their Trial 2 score in this study. Although scores from all three trials of the TOMM were obtained and
reported below, only the scores from Trial 2 and the retention trial were analysed in more detail (to make up
two measures in respect of the TOMM), as the cut-off score of 45 is applied to these two trials only.
The rey i5-item memory test. The Rey 15-Item Test is a simple visual recall task, which is presented
as being very difficult. In this task, participants are shown a card with 15 stimuli, with 3 different items
displayed on 5 rows. The stimulus card is shown to the participant for 10 seconds and then taken away. The
participant is then required to reproduce the stimuli on a piece of paper provided. Although the words "15"
and "different" are emphasised, patients are actually only required to remember a maximum of five ideas to
correctly recall and reproduce the stimulus items (Arnett et aI., 1995; Inman & Berry, 2002; Lee et aI., 1992;
Lezak et aI., 2004). Various scores can be taken from this test and for the purposes of this study, the scores
" of the total number of items correctly recalled, regardless of spatial location and the total number of correct r
rows produced in their correct spatial location (to make up two measures in respect of the Rey 15-Item Test)
were recorded.

Normative Indicators 34 The digit span subtest of the WAfS-III. The Digit Span subtest of the WAIS-III consists of two parts,
the Digit Span forwards and the Digit Span backwards. In the first part (Digit Span forwards), participants
are read a string of numbers and are immediately required to repeat the numbers in the exact order in which
they were read. The strings of numbers are increased in length after two trials. The task ends when the
participant fails both trials of a given string length. The second part (Digit Span backwards) is administered
in the same manner as the digit span forwards, except that participants are required to recite numbers in the
reverse order to which they were read. Several scores may be obtained from this subtest, but for the
purposes of this study, only the Age-Correlated Scaled Scores (ACSS) and Reliable Digit Span (RDS) were
used (to make up two measures in respect of the Digit Span test), as these are the scores most commonly
utilised for the assessment of malingering (Axelrod et al., 2006; Babikian et aI., 2006; Inman & Berry, 2002;
Iverson & Tulsky, 2003; Larrabee, 2003). ACSS scores were obtained from the tables found in the WAIS
III administration and scoring manual. The RDS was calculated as specified by Greiffenstein et aI. (1994),
whereby the longest string of numbers attained over two trials on the Digit Span forwards is added to the
longest string of digits attained over two trials on the Digit Span backwards.
The trail making test (trails A & B). The Trail Making Test is a commonly used neuropsychological
test, which assesses visuomotor speed, cognitive flexibility, sequencing and set shifting ability (Iverson et
aI., 2002). It consists of two parts, known as Trail A and Trail B. On Trail A, the participant is given a page
on which a set of numbers in circles have been scattered. The participant is required to join these circles in
numerical order as quickly as possible. On Trail B, the participant is given a similar page with a set of
numbers and letters in circles scattered across the page. On this trail, the participant is required to join the
circles in numerical and alphabetical order by alternating between numbers and letters, again working as
quickly as they can. The following five scores were used from this test (to make up five measures in respect
of the Trail Making Test), as these have been identified as those that are most commonly used to assess
malingering: total completion time for Trail A in seconds; total completion time for Trail B in seconds; total
number of errors made on Trail A; total number of errors made on Trail B; and the ratio of the completion
time for Trail B to the completion time for Trail A (i.e. the completion time of Trail B divided by the
completion time of Trail A) (Egeland & Langfjaeran, 2007; Iverson et aI., 2002; O'Bryant et aI., 2003;
Ruffolo et aI., 2000).
The various indicators from each of these tests described above together make up the following 11
measures, investigated in this study: i.) total score from Trial 2 of the TOMM; ii.) total score from the
retention trial of the TOMM; iii.) total number of correct items in any position on the Rey I5-Item Memory

\~ ill ~:.
'~f Normative Indicators 35 .,;j Test; iv.) total number of correct rows in correct position on the Rey 15-Item Memory Test; v.) Age 3~
Correlated Scaled Scores (ACSS) from the Digit Span test; vi.) Reliable Digit Span (RDS) from the Digit
Span test); vii.) completion time on Trail A from the Trail Making Test; viii.) completion time on Trail B
from the Trail Making Test; ix.) number of errors on Trail A; x.) number of errors on trail B; xi.) Trail B:A
ratio
These four tests (11 measures) targeted for the purposes of this study, were all administered in English, in
the standardised form, as specified by the respective administration and scoring manuals.
2.3.2 Data Processing
,v II Each member of the research team scored all of the tests contained in the neuropsychological battery for
each participant whom they had tested. Tests were scored in the standardised manner specified by the
respective administration and scoring guidelines. A second member of the research team then re-scored all
of the tests in order to ensure reliable scoring. Any discrepancies noted were resolved between the two
scorers. Additionally, two participant test batteries from each member of the research team were randomly
selected and counter-scored by a third member of the research team. No further discrepancies were found at
this stage.
2.3.3 Data Analysis
The primary purpose of this study was to obtain normative data for a specific population group for four tests
J commonly used to detect malingering, with a subsidiary aim of investigating any gender or age effects on 1 I these tests. The results were analysed by using descriptive statistics, and the mean, median, mode, standard
deviation, range, and percentiles were calculated for each measure of malingering used in this study.
Normative tables for the four tests assessing malingering included in this study were drawn up using these
data. These tables can be used for future clinical practice in South Africa. T-tests were also carried out on all
measures to assess for differences in test performance between the younger and older age groups (18-29 and
30-40 respectively) and the two genders.
In addition to this, the results of this study were also compared to existing cut-off scores in order to evaluate
whether or not these scores are appropriate for use as indicators of malingering in this population group.
New cut-off scores appropriate for the population group utilised in this study were then proposed. These

Nonnative Indicators 36 new cut-off scores were devised by comparing the score in the 5th percentile obtained for each measure of
malingering used in this study to the cut-off scores found by the other studies reviewed earlier in this paper.
If this score for this population was better than the previously suggested cut-off scores, the published score
was used as the cut-off score for this population group. However, if the proposed cut-off scores were shown
not to be appropriate for this population (Le. the scores from the current study were poorer than established
cut-offs), the 5th percentile score was used as the new cut-off score. The majority of the previous studies
reviewed established cut-off scores using fonnulas derived from comparisons between their various
participant groups or using the scores that yielded the best sensitivity and specificity rates amongst their
different sample groups. However, there was only one population group in this study, so these methods
could not be utilised. As a result, the 5th percentile score was taken as the cut-off score, as this has been used
as a way to devise cut-off scores for the assessment of malingering in some of the other studies reviewed in
this paper (Iverson et aI., 2002; Lee et aI., 1992). Nonnative tables listing these new proposed cut-off scores
were also created for use for future clinical practice on similar populations in South Africa.
•• ".. ~NiW~IiI"\W~_~," ... ~.~",~I,\I~'I.lM(iii\\\~\:l.i"''''''l>.'','''\.o~,v''''kll1\t"\~,.~f.\,~>,·:,'·,,,~~:o.'\It\l~"".{":"};I\'W\'j._,(;"\\":"".M'l.;\'i):'.\\\\\I~M!;·I~ijj\'\;l.IA\\:\.\\\,.~"<I\'I'.',r.1: ,

:'~ :
Normative Indicators 37 3. Results
No significant differences were found on any of the 12 indicators of malingering from the four tests utilised
in this study between the two age groups (18-29 and 20-40) and the two genders (males and females), using
t-tests (p = > 0.05, in both instances). Consequently, the fmdings of this study will be reported in terms of
the entire sample.
3.1 The TOMM
The descriptive statistics and percentiles obtained from the complete sample for the three trials on the
TOMM (Trial 1 , Trial 2 and retention trial) are shown in Tables 11 and 12 respectively.
Table 11 D S .. fi h TOMM escnptlve tatlstlcs or t e
Measure Mean Median Mode Std. Deviation Minimum Maximum
Trial 1 45.48 48 50 6.59 21 50
Trial 2 49.82 50 50 0.58 47 50
Retention 49.61 50 50 1.09 44 50
Table 12 Percentile Scores for the TOMM
Measure Percentile 5 10 15 20 25 30 35 40 45 50 55 60 65 70 75 80 85 90
Triall 26.6 35.2 41.1 43.6 44.5 46 46 46 47 48 48.7 49 49 49 50 50 50 50
Trial 2 48.4 49 50 50 50 50 50 50 50 50 50 50 50 50 50 50 50 50
Retention 47.5 49 49 49 49.5 50 50 50 50 50 50 50 50 50 50 50 50 50
95
50
50
50
As these tables indicate, the current sample obtained a mean score of 45.48 (SD = 6.59; range = 21-50) on
Trial 1 of the TOMM and mean scores of 49.82 (SD=0.58; range = 47-50) and 49.61 (SD = 1.09; range =
44-50) on Trial 2 and the retention trial respectively. Additionally, the scores in the 5th percentile for this
sample were 26.6; 48.4 and 47.5 for Trials 1 and 2 and the retention trial, respectively. In other words, only
five percent of this sample attained scores lower than these on each of the relevant trials.
"',,it - ~~Nt~ii'\I""'I"~IMIII;!.'->l\;>l"'Ik\~~'i\W"'Iil4~iloili.4Nx.~'W."'\h\H\t""'I"'!~\'t;G,.:,'~NA.,'it\\1i.H~II.I,\\~h"r'.t\'~,r;\'\l\~iM>I"';\'i~\ .. \t\~~l\!~\t\"\l\\\.,',\\~WiW,l;'f.\,

.:'
i;
':::
.,
. (~
I I
Normative Indicators 38 3.2 The Rey i5-Item Memory Test
The descriptive statistics and percentiles obtained from the complete sample for the two indicators of
malingering on the Rey 15-Item Test assessed in this study (number of correct items regardless of spatial
location and number of correct rows in correct spatial location) are shown in Tables 13 and 14 respectively.
Table 13 Descriptive Statistics for the Rey 15-ltem Memory Test
Measure Mean Median Mode Std. Deviation Minimum Maximum
Correct Items in Any Position 13.64 15 15 2.03 7 15
Rows in Correct Position 3.39 3 5 1.46 o 5
These results indicate that the sample obtained a mean of 13.64 (SD = 2.03; range = 7-15) items correct
regardless of spatial location and a mean of 3.39 (SD = 1.46; range = 0-5) rows correct in the correct spatial
location. Furthermore, the scores in the 5th percentile for this sample were 7.7 items correct regardless of
spatial location and 0 rows correct in the correct spatial location. The score in the 10th percentile for rows
correct in correct spatial location was 1.4.
3.3 The Digit Span Subtest of the WAfS-III
The descriptive statistics and percentiles obtained from the complete sample for the two indicators of
malingering on the Digit Span subtest of the WAIS-III assessed in this study (Age Correlated Scaled Scores
(ACSS) and Reliable Digit Span (RDS)) are shown in Tables 15 and 16 respectively.

t ,
Normative Indicators 39 Table 15
Descriptive Statistics for the Digit Span Subtest of the W AIS-III Measure Mean Median Mode Std. Deviation Minimum Maximum
ACSS 6.91 7 5 2.08 3 11
RDS 7.42 7 7 1.6 4 10
Table 16 Percentile Scoresfor the Digit Span Subtest of the WAIS-III
Measure Percentile 5 10 15 20 25 30 35 40 45 50 55 60 65 70 75 80 85 90 95
ACSS 3.7 4 5 5 5 5.2 6 6 7 7 7 7.4 8 8 8 9 9 10
RDS 4.7 5.4 6 6 6 6.2 7 7 7 7 7 8 8 8.8 9 9 9 10
As can be seen from the above tables, the sample obtained a mean Age Correlated Scaled Score (ACSS) of
6.91 (SD = 2.08; range = 3-11) on the Digit Span subtest of the WAIS-III. This sample obtained a mean
Reliable Digit Span (RDS) of 7.42 (SD = 1.60; range = 4-10). The scores in the 5th percentile of this sample
were 3.7 and 4.7 for ACSS and RDS respectively.
3.4 Trail Making Test
The descriptive statistics and percentiles obtained from the complete sample for the five indicators of
malingering assessed for the Trail Making Test (Trail A completion time; Trail B completion time; number
of errors on Trail A; number of errors on Trail B; ratio of completion time on Trail B to completion time on
Trail A) are shown in Tables 17 and 18.
Table 17 escnptlve tatlstlcs or t e raz a ng est D .. S .. fi h 1'; "lMki Ii
Measure Mean Median Mode Std. Deviation Minimum Maximum
Trail A 39.66 36.3 15.2 15.93 15.2 82.6
Trail B 90.16 82.14 36.96 36.13 36.96 185.89
Trail A Errors 0.21 0 0 0.42 0 1
Trail B Errors 1.3 0 0 2.3 0 12
Trail B:A 2.49 2.11 1.19 1.24 1.19 6.86
, .
11
10

Normative Indicators 40 Table 18
Percentile Scores for the Trail Making Test r- Measure Percentile
5 10 15 20 25 30 35 40 45 50
Trail A 19.27 24.33 25.53 26.67 27.82 28.80 30.31 31 34.03 36.3
Trail B 46.25 52.92 56.50 59.41 64.37 67.24 70.23 76.8 80.10 82.14
Trail A Errors 0 0 0 0 0 0 0 0 0 0
Trail B Errors 0 0 0 0 0 0 0 0 0 0
Trail B:A 1.33 1.49 1.57 1.73 1.76 1.77 1.82 1.87 1.96 2.11
Table 18, ctd. Percentile Scores for the Trail Making Test
Measure Percentile 55 60 65 70 75 80 85 90 95
Trail A 38.40 40.42 42.86 43.21 46.33 51.15 59.12 68.65 74.04
Trail B 84.44 88.81 92.29 98.78 103.93 111.3 144.38 152.85 174.07
Trail A Errors 0 0 0 0 0
Trail B Errors 0.7 1.1 2 2 3 3 3 6.4
TrailB:A 2.15 2.26 2.34 2.51 2.97 3.25 3.40 4.35 5.94
As is evident from the results in these tables, this sample obtained a mean completion time of39.66 seconds
(SD = 15.93; range = 15.2-82.6) and a mean of 0.21 errors (SD = 0.42; range = 0-1) on Trail A.
Additionally, this sample attained a mean completion time of 90.16 seconds (SD = 36.13; range = 36,96-
185,89) and a mean of 1.3 errors (SD = 2.30; range = 0-12) on Trail B of the Trail Making Test. The mean
ratio of completion times of Trail B to Trail A was 2.49 (SD = 1.24; range = 1.19-6.86).
It is important to note that the scores for the first four indicators of malingering on the Trail Making Test
assessed in this study (Trail A completion time; Trail B completion time; number of errors on Trail A;
number of errors on Trail B), a higher score indicates a poorer performance. Subsequently, for these
indicators, the scores in the 95th percentile were examined instead of those in the 5th percentile. This means
that for these four specific indicators, 95 percent of the current sample obtained better scores than those
given or, in other words, only five percent ofthe sample obtained poorer scores than this. As such, this is
I
:1 II I'
I

Normative Indicators 41 comparable to looking at scores in the 5th percentile of the sample for the other indicators assessed in this
study.
Tables 17 and 18 indicate that the scores in the 95th percentile of this sample were a completion time of
74.04 seconds and 1 error made on Trail A and a completion time of 174.07 seconds and 6.4 errors made on
Trail B. The ratio for the completion time obtained for Trail B to the completion time obtained for Trail A in
the 5th percentile of this sample was 1.33.

., Normative Indicators 42
4. Discussion
This study aimed to investigate the performances of a relatively disadvantaged population on four tests
administered in English that are commonly used in the detection of malingering (the TOMM, the Rey 15-
Item Memory Test, the Digit Span subtest of the WAIS-III and the Trail Making Test). The sample included
33 black, South African, Xhosa-speaking people, who attended a former DET-type school in the Eastern
Cape, with a Grade 11-12 level of education, in the age range of 18-40 years. The objectives of the study
were to obtain normative indicators for these four tests for this population and to compare these to the cut
off scores proposed by previous studies conducted in westernized countries on relatively advantaged
populations with at least 12 years or more education, and whose fIrst language is English. The study further
aimed to devise new cut-off scores appropriate for use on this relatively disadvantaged Xhosa speaking
population if deemed necessary based on current results. These new cut-off scores were established by using
the 5th percentile score as the cut-off. A subsidiary objective was also to assess whether any differences
were found between younger and older age groups (ages 18-29 versus 30-40) and the two gender groups on
any of the tests utilised in order to determine if separate normative indicators and/or cut-off scores should be
produced for any of these groups.
In terms of this fInal objective, no signifIcant differences were found on the t-tests that were carried out on
any of the measures used between the two age groups or the two genders. Although very few of the studies
reviewed specifIcally investigated differences in respect of these two factors, these fmdings do support those
of Tombaugh (1996, 1997), who found that age had no signifIcant effects on test performance on the
TOMM. Following these results, a single set of normative indications was provided and analysed for this
sample.
Normative indications on the four tests revealed the need for norm adjustments in most instances, but not
invariably, as follows.
4.1 The TOMM
Participants generally performed very well on the TOMM, obtaining mean scores of 45.48 (SD=6.59) on
Trial 1, 49.82 (SD=0.58) on Trial 2 and 49.61 (SD=1.09) on the retention trial. These means are very similar
I: .'

, , ,
Y ,
Normative Indicators 43 to those attained by all non-malingering participant groups in the studies reviewed above (Greve et aI.,
2006; Iverson et al., 2007; Rees et aI., 1998, 2001; Teichner & Wagner, 2004; Tombaugh, 1996, 1997;
Yanez et aI., 2006). The 5th percentile scores of 48.4 and 47.5 on Trial 2 and the retention trials respectively
indicate that performances on the TOMM by the current sample are placed well above the proposed cut-off
scores of < 45 on either of these trials.
Previous studies assessing the utility of this cut-off score on various normal and clinical sample groups have
similarly shown excellent performances on the TOMM, even on patients with clinical depression, head
injuries and dementia (Greve et aI., 2006; Iverson et aI., 2007; Rees et aI., 1998, 2001; Tombaugh, 1996,
1997). Only one study has yielded scores falling below 45, fmding that more severely demented patients
than those tested in previous studies were misc1assified as malingerers using the cut-off of < 45 (Teichner &
Wagner, 2004; Tombaugh, 1996, 1997). The results of the present study therefore support these fmdings
that the TOMM and the cut-off of <45 can be used with relative confidence on non-demented participants.
They further build on the existing body of literature, showing that findings can be extended to Xhosa
speaking individuals in the young adult age range with at least 11 years of education and with a relatively
poor quality of education. A summary of the mean scores, standard deviations, 5th percentile scores,
published cut-off scores and cut-off scores from the present study for the two measures from the TOMM
used in this study are given in Table 19.
Table 19 Summary of Descriptive Statistics and Cut-q[[ Scores for the TOMM
Measure Mean SD Score in Previousl! Pronosed Cut-off
5th Percentile suggested Cut-off For Current Samnle
Trial 1 45.48 6.59 26.6 - -Trial 2 49.82 0.58 48.4 45 45
Retention 49.61 1.09 47.5 45 45
4.2 The Rey 15-Item Memory Test
4.2.1 Items Correct in Any Position
Participants obtained a mean of 13.64 (SD=2.03) items correct in any spatial location. This is substantially
J higher than the means attained by the clinical and simulated malingering populations of Arnett et al. (1995), l
Nonnative Indicators 44 Greiffenstein et al. (1994), and Lee et al. (1992). However, the head injured simulated malingerers, head
injured controls and nonnal controls included in the study conducted by Inman and Berry (2002) all
acquired means above 14. Additionally, the nonnal simulated malingering participants in that study
obtained a very similar mean (13.70) to that scored by the current, relatively disadvantaged participants,
who were exerting their best effort. The sample in the study by Inman & Berry (2002) is younger (mean
ages for all participant groups less than 19 years) than those in the other studies reviewed (mean ages
ranging from 20.6 - 39.3 years). However, no significant differences were found between the younger and
older age groups (18-29 versus 30-40) included in the current study, and it is therefore unlikely that age
accounts for the relatively better perfonnance by participants in the Inman and Berry (2002) study.
~; The score in the 5th percentile for this sample is 7.7, which falls below the published cut-off scores of < 9 or
)1;: < 10, as suggested by Greiffenstein et al. (1994) and Inman and Berry (2002). On the other hand, this is
higher than the cut-off of < 7 correct items in any location recommended by Lee et al. (1992). These results
therefore suggest that the cut-off score proposed by Lee et. al (1992) is the most appropriate for use on this
population, and it was therefore adopted here.
.,
4.2.2 Rows Correct in Correct Position
In tenns of rows correct in correct spatial location, a mean of 3.39 (SD=1.46) was obtained in the current
study. The only other study reviewed to investigate this measure was that conducted by Arnett et al. (1995),
which yielded mean scores ranging from 1.52 - 3.32. That study utilised neurological patients and simulated
malingerers, and it would therefore be expected that scores obtained from that sample would be lower than
those attained by the Xhosa speaking, nonnal population utilised in the current study.
As the score in the 5th percentile for this measure was 0, the 10th percentile score was examined instead. This
score was 1.4, thus falling below the cut-off of < 2 rows correct in correct position proposed by Arnett et al.
j. (1995). This proposed cut-off score therefore appears to be too stringent for this sample and a new cut-off
score of::: 1 row correct in correct position was established after converting the 10th percentile score to a
whole number.

~ ;
I , ~ , ;j , ~l'
J '.
:~: .~ . ' ,
l ,\
~
if "f
~J f/: ;,
;~:',:
........
Normative Indicators 4S A summary of the mean scores, standard deviations, Sth percentile scores, published cut-off scores and cut-
off scores from the present study for the two measures from the Rey IS-Item Memory Test used in this
study is given in Table 20 .
Table 20 Summary of Descriptive Statistics and Cut-Off Scores for the Rey 15-ltem Memory Test
Measure Mean SD Score in Previously Proposed Cut-off
5th Percentile suggested Cut-off For Current Sample
Items Correct in Any Position 13.64 2.03 7.7 < 7" < 9 <10c <7
Rows Correct in Correct Position 3.39 1.46 0 (104 in 10 percentile) < 2
'Suggested in Lee et at (1992) bSuggested in Greiffentstein et at (1994) & Inman & Berry (2002) 'Suggested in Greiffenstein et at (1994)
:' dSuggested in Arnett et aI, (1995)
f .:,
4.3 The Digit Span Subtest of the WAlS-IlI
4.3.1 Age Correlated Scaled Scores (ACSS)
The current sample obtained a mean ACSS score of6.9I (SD=2.08) on the Digit Span subtest of the WAIS
III. This generally falls below the mean ACSS scores (ranging from 6.2 - 10.6) attained by the clinical,
suspected malingering, and normal control sample groups utilised in previous studies assessing this measure
(Axelrod et aI., 2006; Babikian et aI., 2006; Iverson & Tulsky, 2003). Additonally, the mean ACSS scored
by the current normal, Xhosa speaking popUlation with a former DET-type education is the closest to those
means obtained by the suspected malingering groups in the studies conducted by Babikian et aI. (2006)
(mean ACSS score for suspected malingerers = 6.2) and Axelrod et al. (2006) (mean score for suspected
malingerers = 6.3). This therefore reveals that the current sample performed at a level substantially below
what would ordinarily be expected from a normal westernised population and, in fact, obtained scores
similar to participants suspected of malingering.
Furthermore, the Sth percentile score of 3.7 is substantially lower than the published cut-off scores of::: 7
and ::: S proposed by Axelrod et al. (2006) and Babikian et al. (2006) respectively. It is also lower than one
of the cut-off scores proposed by Iverson and Tulsky (2003) (ACSS< S). As a result, a new cut-off score
was proposed for this sample, converting the Sth percentile score to a round number for use as an ACSS.

~',
Normative Indicators 46 This, then, gives a cut-off score of ACSS < 4, consistent with the second cut-off score suggested by Iverson
and Tulsky (2003).
4.3.2 Reliable Digit Span (RDS)
In terms of RDS, the mean score of this sample was 7.42 (SD= 1.6). This is lower than the mean scores
obtained by all the simulated malingering, head injured, normal control and mixed clinical sample groups
included in previous studies, which attained mean RDS scores ranging from 8.09 - 11.58 (Axelrod et aI.,
2006; Babikian et aI., 2006; Greiffenstein et aI., 1994; Inman & Berry, 2002). The only participants to
acquire lower RDS scores than the current sample were the suspected malingerer groups included in the
:r~ studies conducted by Axelrod et aI. (2006), Babikian et al. (2006), and Greiffenstein et aI. (1994), thereby
" showing similar results to those obtained from the ACSS measure of the Digit Span test. Consequently,
these findings show that the Xhosa speaking group with a poor quality of education utilised in this study
generally obtained RDS scores far below all other participant groups used previously, only surpassing those
obtained by probable malingerers.
Further, examining the score placed in the 5th percentile (4.7) shows that the current published cut-off scores
of:::: 6, < 7 and < 8 recommended by Babikian et al. (1994), Greifenstein et aI., Inman and Berry (2002) and
Larrabee (2003) respectively, would incorrectly classify participants from this sample as malingerers. As a
result, a new cut-off score ofRDS < 5 was established.
A summary of the mean scores, standard deviations, 5th percentile scores, published cut-off scores and cut
off scores from the present study for the two measures from the Digit Span subtest of the W AIS-III used in
this study is given in Table 21.
Table 21 Summary of Descriptive Statistics and Cut-Off Scores for the Digit Span Subtest of the WAIS-III
Measure Mean SD Score in Previously Pro]2osed Cut-off
5th Percentile suggested Cut-off For Current Sam]2le
ACSS 6.91 2.08 3.7 <4or5a < 6° < 7c I < 8
3 <4
RDS 7.42 1.6 4.7 ~5D ~ 7" <5 a oc Suggested ill Iverson & TuIsky (2003) Suggested ill Babikian et al. (2006) 'Suggested in Greiffenstein et al. (1994) dSuggested in Greiffenstein et al. (1994), Larrabee (2003) & Inman & Berry (2002) 'Suggested in Axelrod et al. (2006)

" ~
Normative Indicators 47 4.4 The Trail Making Test
4.4.1 Trail A and Trail B Completion Times
The current sample obtained a mean completion time of 39.66 seconds (SD=15.93) on Trail A and 90.16
seconds (SD=36.16) on Trail B. Participants showed similar comparative patterns of performance relative to
the means obtained from previous studies in terms of completion time on both Trails A and B, generally
taking longer to complete both trails than all non-litigating normal control groups and non-malingering mild
TBI patient groups utilised in these studies (mean completion times ranging from 20.10-39.5 and 57.2-90.3
seconds for Trails A and B respectively) (Iverson et aI., 2002; Ruffolo et aI., 2000). On the other hand, the
mean completion times attained by the current sample are substantially shorter than those acquired by
suspected and simulated malingerers, more severely head injured patients, and litigating normal controls on
both trails (mean completion times ranging from 41-103.3 and 94.41-160.9 seconds for trails A and B
respectively) (Egeland & Langfjaeran, 2007; Iverson et aI., 2002; O'Bryant et aI., 2003; Ruffolo et aI.,
2000). These mean comparisons therefore suggest that although the current Xhosa speaking sample with a
poor quality of education generally performed slightly worse on the completion time measures on Trails A
and B than westernised samples of non-litigating normal control and mildly head injured groups, they still
obtained better scores (lower times) on this measure than malingering, litigating, and severely head injured
participants, as would be expected.
An examination of the scores falling in the 5th percentile (74.04 and 174.07) seconds on Trails A and B
respectively; a higher score indicates a poorer performance on this measure) reveals that the current sample
performed at a poorer level than the cut-off score of 2: 63 seconds on Trail A, but at a superior level to the
cut-off of 2: 200 seconds on Trail B proposed by Iverson et al. (2002). As a result, it was necessary to
establish a new cut-off score of 2: 74 seconds for Trail A. However, no adjustments needed to be made to
existing indications of malingering for Trail B.
4.4.2 Trail A and Trail B Errors
Regarding the number of errors made on Trail A and Trail B, the participants of this study made a mean of
0.21 errors (SD=0.42) on Trail A and 1.3 errors (SD=2.3) on Trail B. The mean error score obtained on
Trail A by the sample in this study is higher (which indicates a poorer performance) than the mean errors

Normative Indicators 48 made on all normal non-litigating control groups and three groups of mild-moderately head injured
participants used in previous studies (mean errors ranging from 0.13-0.17) (Iverson et al., 2002; 0' Bryant
et aI., 2003; Ruffolo et al., 2000). On the other hand, all malingering, litigating control and other head
injured participant groups made a higher number of mean errors on Trail A than the participants in this
study (Iverson et aI., 2002; O'Bryant et al., 2003; Ruffolo et aI., 2000). Mean comparisons between errors
made on Trail B on this study and published studies reveals that all participant groups in previous studies
made less errors on this trail than the current sample (mean errors from previous studies ranging from 0.3 7-
0.88), with the exception of one simulated malingering and one suspected malingering group (Iverson et al.,
2002; O'Bryant et al., 2003; Ruffolo et aI., 2000). These results therefore show that the current normal,
Xhosa speaking population generally made more errors than the westernised non-litigating normal control
groups and some head injured groups included in previous studies on Trail A, while making more mean
errors than almost all participant groups on Trail B.
The error score in the 95th percentile (as a higher score indicates a worse performance for this measure, the
95h percentile score was used instead of the 5th percentile score) for Trail A of 1 is much better than the cut
off of 2: 4 errors on either Trail A or Trail B suggested by Ruffolo et al. (2000). In contrast, this error score
on Trail B (6.4) falls significantly above the proposed cut-off score. These findings therefore indicate that
no adjustments need to be made to these normative indications for Trail A, while a new cut-off score needs
to be established for Trail B for the current sample. Converting the 95th percentile score of 6.4 to a whole
number for use as an error score, a new cut-off score of 2: 6 is proposed for this popUlation of Xhosa
speaking, black participants with a former DET -type education.
4.4.3 The Trail B:A Ratio
Finally, on the measure of the Trail B:A ratio, the participants in this study obtained a mean ratio score of
2.49 (SD=1.24). This score is lower and therefore poorer than that attained by the entire sample of head
injured patients included in the study conducted by Iverson et al. (2002) (mean ratio scores ranging from
2.51-3.32), as well as the litigating normal control and litigating cognitively impaired participant groups
included in the study by Egeland and Langfjaeran (2007). These findings therefore show that the current
normal sample of Xhosa speaking participants with a relatively poor quality of education obtained poorer
Trail B:A ratio scores than a sample group comprising of mild-severely head injured patients, who would be
expected to perform much worse than a normal functioning group (Iverson et al., 2002).
I' , I'
I
i I

Normative Indicators 49 Additionally, the Trail B:A ratio score falling in the 5th percentile is 1.33. This score falls below the
proposed cut-off scores of < 2.5 and ::: 1.49 used by Egeland and Langfjaeran (2007) and Iverson et aL
(2002) in their respective studies. These results therefore suggest that participants from this sample would
be classified as malingering if utilising the previous cut-off scores recommended for the Trail B:A ratio.
Using the 5th percentile score, a new cut-off score of Trail B:A::: 1.33 is therefore proposed here for use on
this sample.
A summary of the mean scores, standard deviations, 5th percentile scores, published cut-off scores and cut
off scores from the present study for the five measures from Trail Making Test used in this study is given in
Table 22.
Table 22 Summary of Descriptive Statistics and Cut-Off Scores for the Trail Making Test
Measure Mean SD Score in Previousll: Pronosed Cut-off 5th Percentile smm:ested Cut-off For Current Samnle
Trail A 39.66 15.93 *74.04 > 63" >74 Trail B 90.16 36.13 *174.07 >200" >200
Trail A Errors 0.21 0.42 *1 >4° >4 Trail B Errors 1.3 2.3 *6.4 >4° >6
Trail B:A 2.49 1.24 1.33 < 1.493 I < 2.5e <1.33 * olh For these measures a higher score means a poorer performance, so the score was taken from the 95 percentile mstead of the 5th percentile 'Suggested in Iverson et al. (2002) bSuggested in Ruffolo et al. (2000) ·Suggested in Egeland & Langfjaeran (2007)
4.5 Overall Indications from the Study
Overall, the results of this study have shown that test performances falling within one standard deviation of
the mean in this sample on at least one measure of all tests used to assess malingering would have been
considered as possible malingering, with the exception of the TOMM. The participants obtained high mean
scores on both Trial 2 and the retention trial of the TOMM, lending support to all previous studies
conducted on this test which have shown that all non-malingering participants without dementia are able to
obtain scores ~ 45, including those who were cognitively impaired or suffered from various illnesses. The
results of this study therefore serve to build on the body of literature on this test and show that individuals
from a non-western culture with another language as their first language and with a poor quality of
education were also able to obtain high scores on this test. This test is less challenging than the other tests
utilised in this study. Additionally, it contains two practice examples, regardless of whether the participant
completed the first one correctly, whereas the other tests used only contained one sample question or two if

'1 l
Normative Indicators 50 the first question was answered incorrectly. This is consistent with Nell (2000), who suggests in his book on
cross-cultural neuropsychology that relatively disadvantaged groups, such as the one used in this study,
frequently need additional practice on standard neuropsychological tests than other more advantaged
groups. These factors may have therefore made this test more understandable and accessible to the
participants from this sample, thus possibly accounting for the differences in performances on this and the
other tests used to assess malingering investigated here.
The results of this study show that for all other tests used, and specifically on the measures of items correct
in correct location and rows correct in the correct spatial location on the Rey IS-Item Test; ACSS and RDS
on the Digit Span subtest of the W AIS-III; and completion time on Trail A, Trail B errors and Trail B:A
ratio on the Trail Making Test, current published cut-off scores would incorrectly classify participants
obtaining scores in the 5th percentile for this sample as malingering. As a result, it was necessary to make
adjustments to existing normative indications, and new cut-off scores were established for the
aforementioned measures. The extent of this misclassification possibility is highlighted by the fact that the
current sample of black, Xhosa speaking participants with a Grade 11 or 12 education from a former DET
school, with no cognitive impairment obtained poorer mean scores than most normal control groups, some
groups of head injured patients, patients with various types of cognitive impairment, and groups of
simulated and "real-world" probable malingerers on at least one measure of all tests used in this study
except for the TOMM. These findings therefore illustrate the manner in which performance is impacted by
the factors of culture and/or language, and/or quality of education. As mentioned in the literature review
section of this paper, the factors of culture, quality of education, and language are all very closely
interconnected (Rosselli & Ardila, 2003; Shuttleworth-Edwards, Donnelly et aI., 2004; Shuttleworth
Edwards, Kemp et aI., 2004) and it is therefore unclear if any one of them would have more singular impact
on performance on these measures than others. Nonetheless, it emphasises the role that the combination of
these factors plays in results of neuropsychological tests.
These findings are of particular importance in South Africa, as many black people in this country are
affected by all of these factors following the legacy of the Apartheid regime, the effects of which still
impact many people in this population group with a low socio-economic status. However, as Shuttleworth
Jordan (1996) notes, this does not mean that well established and tested measures, such as the ones of
malingering included in this study, cannot be meaningfully administered to this population. Instead, it
emphasises the pressing need for more normative indicators and, in the case of tests assessing malingering,
for new cut-off scores, to be established that are appropriate for use on this population group. Furthermore,

Normative Indicators 51 the results from this study also stress the importance of making tentative interpretations when using cut-off
scores from various neuropsychological tests to detect malingering. As with all previous studies conducted
on these tests, the fmdings from this study additionally highlight the necessity of administering more than
one measure of malingering in a test battery (Axelrod et aI., 2006; Egeland & Langfjaeran, 2007; Iverson et
aI., 2002; Larrabee, 2003; Lee et aI., 1992; O'Bryant et aI., 2003; Ruffolo et aI., 2000) and of examining
test results alongside qualitative observations, and also taking into consideration the biographical
information of the particular individual being assessed.
4.6 Evaluation of the Research
The sample group utilised in this study was stratified for age, first language spoken, level of education,
quality of education, area of residence and education, and nationality. This is a strength of this study,
ensuring that the findings in relation to this particular population are likely to be robust in spite of a small
sample size (N = 33), as it is better to utilise a small, but well-defined sample group than a much larger
sample group that is poorly defined (Lezak et aI., 2004). However, the results clearly cannot be generalized
to other South African people, living in and receiving their education from other areas of this country,
speaking a different indigenous South African language, and who are of younger child and adolescent or
older adult age groups. The geographical limitation is of particular concern seeing as the quality of
education and general conditions at former DET-type schools has been shown to be particularly poor, even
when compared to similar types of schools in other provinces (Matomela, 2008). The participants in this
study may therefore have yielded poorer results than those who received a DET-type education in other
parts of the country.
A second strength of this study relates to the test battery used, which focussed on four of the tests most
commonly used to assess malingering. These tests were additionally administered within a larger
neuropsychological test battery containing other standard cognitive tests covering all functional modalities.
The testing conditions therefore closely resemble those under which participants applying for fmancial
compensation or other individuals likely to malinger would usually be placed during neuropsychological
assessment. However, indications on the four tests used to assess malingering utilised in this study suggest
that each test may produce very different findings from one another within the same population, and each
test therefore needs research in its own right. The findings of this study therefore are clearly specific to the

Normative Indicators 52 tests utilised here and very different results may be attained if using other tests often used to detect
malingering.
A final limitation of this study is that it only offers preliminary normative data and proposed cut-off scores
on the four tests used to assess malingering included in this study for the current non-clinical sample. It is
therefore uncertain how accurately these cut-off scores would be able to differentiate suspected malingerers,
simulated malingerers and patients with cognitive impairment from this and other normal participant groups
from this particular population.
4.7 Recommendations for Future Research
Taking the above limitations into consideration, the following recommendations are given for future
research in order to validate the findings from this study and increase their usefulness for future clinical use:
(i.) More studies are needed which assess a larger sample of black people who have received a
former DET-type education from other provinces in South Africa and who speak other
indigenous South African languages. This would enable one to assess whether the findings and
cut-off scores proposed in the current study can be generalised for use on similar populations in
other parts of the country.
(ii.) It would be useful to build on this study by assessing test performances of this population in the
Eastern Cape, as well as in other provinces in South Africa, on other commonly used measures
of malingering.
(iii.) Further studies are needed which examine the sensitivity and specificity rates of these new cut
off scores in accurately being able to identify malingering and non-malingering groups of
participants. It is therefore suggested that cross validation studies be conducted which apply these newly
proposed cut-off scores to groups of litigating and non-litigating head injured patients, people with other
forms of cognitive impairment, other suspected malingerers and simulated malingerers belonging to this
population group in order to assess the validity of these cut-off scores.
Normative Indicators 53 4.8 Final Summary
This study aimed to acquire normative indications using the standard English administration for four
commonly employed psychometric test measures used in the detection of malingering., in respect of a
sample of Eastern Cape Xhosa-speaking individuals (N = 33) with a Grade 11 or 12 relatively
disadvantaged education. Results indicated the need for revised cut-off points in most instances due to
consistently poorer performances in this group. These fmdings thus implicate the need for extreme
caution when making assumptions about malingering using data derived from more advantaged,
English-speaking populations. The data are in respect of a well stratified sample and represent a
clinically useful addition to normative collections specifically for use in respect of this relatively
disadvantaged Eastern Cape population. Further research is needed on clinical and malingering
populations to ratify the proposed new cut-off points, on populations in other age and language groups
within the South African context, and on all tests used to identify malingering prior to their valid use for
this purpose.

)
'J
Normative Indicators 54 6. References
Arnett, P. A., Hammeke, T. A., & Schwartz, L. (1995). Quantitative and qualitative performance on Rey's 15-Item Test in neurological patients and dissimulators. The Clinical Neuropsychologist, 9, 17-26.
Ardila, A. (2005). Cultural values underlying psychometric cognitive testing. Neuropsychology Review, 15, 185-195.
Axelrod, B. N., Fichtenberg, N. L., Millis, S. R., & Wertheimer, J. C. (2006). Detecting incomplete effort with Digit Span from the Wechsler Adult Intelligence Scale-Third Edition. The Clinical Neuropsychologist, 20, 513-523.
Babikian, T., Boone, K. B., Lu, P., & Arnold, G. (2006). Sensitivity and specificity of various Digit Span scores in the detection of suspect effort. The Clinical Neuropsychologist, 20, 145-159.
Baker, H. J. & Leland, B. (1967). Detroit Tests of Leaming Aptitude, Test No. 11, Free Association - Words in One Minute: Unstructured Verbal Fluency Test.
Benton, A. L., Hamsher, K. S., & Sivan, A. B. (1994). Multilingual Aphasia Examination (3rd ed.). San Antonia TX: Psychological Corporation.
Byrd, D. A., Touradji, P., Tang, M., & Manly, J. (2004). Cancellation test performance in AfricanAmerican, Hispanic and White elderly. Journal of the International Neuropsychological Society, 10, 401-410.
Claassen, N. C. W., Krynauw, A. H., Paterson, H., & Mathe, M. (2001). A South African standardization of the WAIS-III for English-speaking South Africans. Modified report. Pretoria: Human Science Research Council.
Denckla, M. B. (1973). Development of speed in repetitive and successive finger movements in normal children. Developmental Medical Child Neurology, 15, 635-645.
Egeland, J. & Langfjaeran, T. (2007). Differentiating malingering from genuine cognitive dysfunction using the Trail Making Test-ratio and Stroop interference scores. Applied Neuropsychology, 14, 113-119.
Fisher, H. L. & Rose, D. (2005). Comparison of the effectiveness of two versions of the Rey Memory Test in discriminating between actual and simulated memory impairment, with and without the addition of a standard memory test. Journal of Clinical and Experimental Neuropsychology, 27, 840-858.
Golden, C. J. (1978). Stroop Color and Word Test: A manual for clinical and experimental uses. Chicago, USA: Stoelting.
Greiffenstein, M. F., Baker, W. J., & Gola, T. (1994). Validation of malingered amnesia measures with a large clinical sample. Psychological Assessment, 6,218-224.

Normative Indicators 55 Greve, K. W., Bianchini, K. J., Black, F. W., Heinly, M. T., Love, J. M., Swift, D. A., & Ciota, M. (2006).
Classification accuracy of the Test of Memory Malingering in persons reporting exposure to environmental and industrial toxins: Results of a known-groups analysis. Archives of Clinical Neuropsychology, 21, 439-448.
Grieve, K. W. & Viljoen, S. (2000). An exploratory study of the use of the Austin Maze in South Africa. South African Journal of Psychology, 30, 14-18.
Helms, J. E. (1992). Why is there no study of cultural equivalence in standardized cognitive ability testing? American Psychologist, 47, 1083-1101.
Inman, T. H. & Berry, D. T. R. (2002). Cross-validation of indicators of malingering: A comparison of nine neuropsychological tests, four tests of malingering, and behavioral observations. Archives of Clinical Neuropsychology, 17, 1-23.
Iverson, G. L., Lange, R. T., Green, P., & Franzen, M. D. (2002). Detecting exaggeration and malingering with the Trail Making Test. The Clinical Neuropsychologist, 16, 398-406.
Iverson, G. L., Le Page, J., Koehler, B. E., Shojania, K., & Badii, M. (2007). Test of Memory Malingering (TOMM) scores are not affected by chronic pain or depression in patients with fibromyalgia. The Clinical Neuropsychologist, 21, 532-546.
Iverson, G. L. & Tulsky, D. S. (2003). Detecting malingering on the WAIS-III unusual Digit Span performance patterns in the normal population and in clinical groups. Archives of Clinical Neuropsychology, 18, 1-9.
Kelly, M. P., Binder, L. M., Villaneuva, M. R., & Winslow, M. M. (1995, February). Motivation and neuropsychological test performance following closed head injury. Paper presented at the INS 23Td
Annual Meeting, Seattle, United States of America.
Larrabee, G. J. (2003). Detection of malingering using atypical performance patterns on standard neuropsychological tests. The Clinical Neuropsychologist, 17,410-425.
Lee, G. P., Loring, D. W., & Martin, R. C. (1992). Rey's 15-Item Visual Memory Test for the detection of malingering: Normative observations on patients with neurological disorders. Psychological Assessment, 4,43-46.
Lezak, M. D., Howieson, D. B., & Loring, D.W. (2004). Neuropsychological assessment (4th ed.). Oxford: Oxford University Press.
Loring, D. W. (1995, May). Psychometric detection of malingering. Paper presented at the Annual Meeting of the American Academy of Neurology, Seattle, United States of America.
Manly, J., Byrd, D., Touradji, P., Sanchez, D., & Stern, Y. (2004). Literacy and cognitive change among ethnically diverse elders. International Journal of Psychology, 39, 47-60.

Normative Indicators 56 Miller, L. (1996). Malingering in mild head injury and the postconcussion syndrome: Clinical,
neuropsychological, and forensic considerations. The Journal of Cognitive Rehabilitation, July/August, 6-15.
Matomela, D. (2008, January 17). New year, same old story. The Herald, p. 1.
N ell, V. (1999). Standardising the W AIS-III and WMS-III for South Africa: Legislative, psychometric, and policy issues. South African Journal of Psychology, 29 (3), 128-137.
~ . Nell, V. (2000). Cross-cultural neuropsychological assessment: Theory and practice. London: Lawrence Erlbaum Assoc.Publ.
O'Bryant, S. E., Engel, L. R., Kleiner, J. S., Vaster1ing, J. J., & Black, F. W. (2007). Test of Memory Malingering (TOMM) Trial 1 as a screening measure for insufficient effort. The Clinical Neuropsychologist, 21, 511-521.
O'Bryant, S. E., Hilsabeck, R C., Fisher, J. M., & McCaffrey, R J. (2003). Utility of the Trail Making Test " ' in the assessment of malingering in a sample of mild traumatic brain injury litigants. The Clinical
Neuropsychologist, 17, 69-74.
Osterreith, P.A. (1944). Le test de copie d'une figure complex: Contribution a l'etude de la perception et de la memoire. Archives de Psychologie, 30, 286 - 356.
Rees, L. M., Tombaugh, T. N., & Boulay, L. (2001). Depression and the Test of Memory Malingering. Archives of Clinical Neuropsychology, 16, 501-506.
Rees, L. M., Tombaugh, T. N., Gansler, D. A., & Mocczynski, N. P. (1998). Five validation experiments of the Test of Memory Malingering (TOMM). Psychological Assessment, 10, 10-20.
Reitan, RM. (1956). The Trail Making Test: Manual for administration, scoring and interpretation. Indiana: Indiana Medical Center, Indiana University (Mimeographed).
Rey, A. (1964). L'examen clinique en psycho1ogie (The clinical examination in psychology). Paris: Presses Universitaires de France.
Rosenfeld, B., Sands, S. A., & Van Gorp, W. G. (2000). Have we forgotten the base rate problem? Methodological issues in the detection of distortion. Archives of Clinical Neuropsychology, 15, 349-359.
Rosselli, M. & Ardila, A. (2003). The impact of culture and education on non-verbal neuropsychological measurements: A critical review. Brain and Cognition, 52, 326-333.
Ruffolo, L. F., Guilmette, T. J., & Willis, W. G. (2000). Comparison of time and error rates on the Trail Making Test among patients with head injuries, experimental malingerers, patients with suspect effort on testing, and normal controls. The Clinical Neuropsychologist, 14, 223-230.
Shuttleworth-Edwards, A.B., Donnelly, M.J.R, Reid, 1., & Radloff, S.E. (2004). A cross-cultural study with culture fair normative indications on WAIS-III Digit Symbol- Incidental Learning. Journal of Clinical and Experimental Neuropsychology, 26, (7), 921-932.

Nonnative Indicators 57 Shuttleworth-Edwards, A. B., Kemp, R.D., Rust, A.L., Muirhead, J.O.L., Hartman, N.L., & Radloff, S. E.
(2004). Cross-cultural effects on IQ test perfonnance: A review and preliminary nonnative indications on WAIS-III test perfonnance. Journal of Clinical and Experimental Neuropsychology, 26, 921-932.
Shuttleworth-Jordan, A. (1996). On not reinventing the wheel: A clinical perspective on culturally relevant test usage in South Africa. South African Journal of Psychology, 26, 96-102.
Teichner, O. & Wagner, M. T. (2004). The Test of Memory Malingering (TOMM): Nomative data from cognitively intact, cognitively impaired, and elderly patients with dementia. Archives of Clinical Neuropsychology, 19, 455-464.
Tiffm, J., & Asher, EJ. (1948). The Purdue Pegboard: Nonns and studies of reliability and validity. Journal of Applied Psychology, 32,234-247.
Tombaugh, T. N. (1996). Test of Memory Malingering (TOMM). New York: Multi Health Systems.
Tombaugh, T. N. (1997). The Test of Memory Malingering (TOMM): Nonnative data from cognitively intact and cognitively impaired individuals. Psychological Assessment, 9, 260-268.
Wechsler, D. (1945). A standardized memory scale for clinical use. The Journal of Psychology, 19, 87-95.
Wechsler, D. (1997). Manual for the Wechsler Adult Intelligence Scale-Third Edition. San Antonio: The Psychological Corporation.
Yanez, Y. T., Fremouw, W., Tennant, J., Strunk, J., & Coker, C. (2006). Effects of severe depression on TOMM perfonnance among disability-seeking outpatients. Archives of Clinical Neuropsychology, 21, 161-165.

'. ~: "
.. - ~'''' , , 1,'.":.1 ~, ', ..
Normative Indicators 58 Appendices
Appendix A: Biographical Questionnaire
General Information Questionnaire: Please Note: All information that you write on this report is strictly CONFIDENTIAL and will ONLY be used for the research project. It will NOT be passed onto any employers. Your ANONYMITY will be maintained.
1. Demographic Information
1.1. Name: ________________________ _
1.2. Gender: _______ _
1.3. Age: ________ _
1.4. Date of Birth: ______ _
1.5. Place of Birth (City & Country):
1.6. Occupation (Employment at present time):
1.7. E-mail Address: ____________ _
1.8. Contact Number:. ____________ _
1.9. First Language: ____________ _
2. Education History
2.1. Name, location and dates of High School (s) (Secondary School) attended:
I
I

Nonnative Indicators 59 1.) Name: ____________ _ 2.) Name: ___________ _
Location: ------------------------ Location: ------------------------
Dates: _________________________ _ Dates: _______________________ _
3.) Name: ____________ _ 4.) Name: ___________ _
Location: Location: --------------------- ----------------------
Dates: Dates: ------------------------ -------------------------
2.2. YEAR that you finished school? ___________________ _
2.3. Highest Level of Education (Highest Grade Reached): Tick appropriate level.
Grade 10: Grade 11: Grade 12:
2.3.1. If you TICKED Grade 10 or Grade 11, what was the reason you left before completing Grade 12?
2.4. What symbol (eg, D, E, F) did you get for English at School?
2.5. Did you fail or repeat any grades at school? ____________________________ _
2.5.1 If YES, which grade and how many times did you fail or repeat? ------------------
3. Socio-Economic Information Please answer this section WHEN YOU WERE AT SCHOOL, not at PRESENT Please answer YES or No 3.1. When you were still at SCHOOL, did you have:

-
Normative Indicators 60 a: Electricity at home? ____________________________ _
b: Running water? ______________________________ _
c: Did you have your own room? _________________________ _
d: Did you have at least 2 meals per day? _____________________ _
e: Did you have your own toys worth in total over R50? ________________ _
f: What was the attitude of your parents towards your schooling?
Positive, negative or neutral? ________________________ _
4. Additional Information
4.1. Have you ever been diagnosed with a learning problem (e.g. dyslexia), or received treatment for a learning problem? Please give details.
4.2. Have you ever been admitted to a psychiatric (mental) hospital or unit? Please give details.
4.2. Are you currently taking any medications (tablets, injection) for a psychological or psychiatric disorder (mental illness)? Please give details.
4.3. Have you ever taken any medications (tablets, injection) for a psychological or psychiatric disorder (mental illness) in the PAST? Please give details.
4.4. Do you suffer or have you ever suffered from any serious illnesses? Please give details.
4.5. Have you ever suffered any form of head injury (eg. hit your head after falling off a bicycle, injured your head in a car accident or during sports)? Please give details, including whether
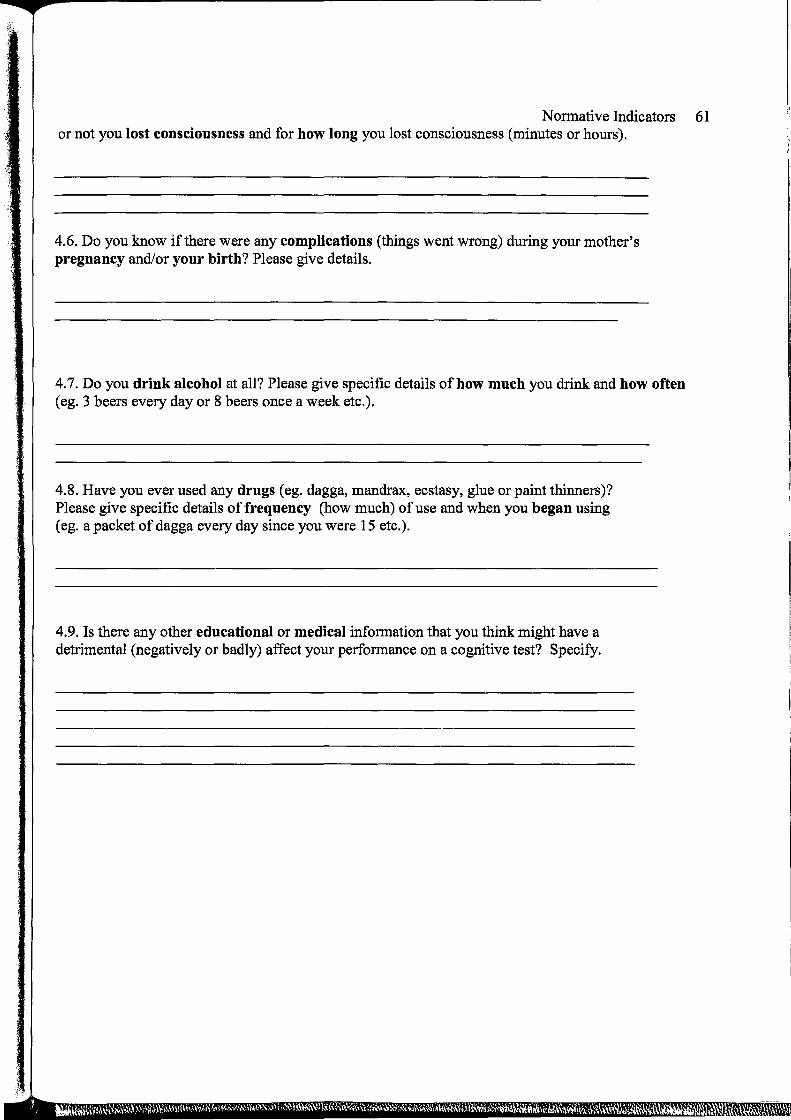
Nonnative Indicators 61 or not you lost consciousness and for how long you lost consciousness (minutes or hours).
4.6. Do you know if there were any complications (things went wrong) during your mother's pregnancy and/or your birth? Please give details.
4.7. Do you drink alcohol at all? Please give specific details of how much you drink and how often (eg. 3 beers every day or 8 beers once a week etc.).
4.8. Have you ever used any drugs (eg. dagga, mandrax, ecstasy, glue or paint thinners)? Please give specific details of frequency (how much) of use and when you began using (eg. a packet of dagga every day since you were 15 etc.).
4.9. Is there any other educational or medical infonnation that you think might have a detrimental (negatively or badly) affect your perfonnance on a cognitive test? Specify.

Nonnative Indicators 62 Appendix B: Pre-Test Screening Questionnaire
" Encourage participant to answer as accurately as possible. Tick the option that applies and elaborate when requested. If some questions do not apply to the participant or she/he does not know the answer, record NI A if not applicable, or UK if unknown. Assure participants that infonnation obtained will be kept in the strictest confidence.
),
I
"I
Biographical information
Name:
Gender: M F
Age: Date of Birth:
Handedness: Right Left
First Language:
English Proficiency: Poor 1 Average 2
Elaborate:
Test Date:
1. General
1.1. Have you had something eat this morning? o Yes o No
1.2. Have you slept well? o Yes o No
1.3. Do you wear glasses? o Yes o No
1.4. Do you experience any problems with your eyes? o Yes o No
Tester: -------------------------
Good 3 Excellent 4

Normative Indicators 63 1.5. Do you have a problem with hearing?
o Yes o No
1.6. Have you ever broken an arm? o Yes o No
1.7. If yes, which one? o Right o Left
2. Remedial treatment for learning disabilities
2.1. Did you experience any difficulties or problems with learning at school?
o No o Yes
2.1.1 If YES, elaborate
2.2. Did you receive any extra help for those problems or difficulties from someone other than your teacher like an Occupational Therapist, Psychologist, Doctor etc?
o No o Yes
2.2.1 If YES, elaborate
3. Neurological
3.1. Have you had any head injuries or any other problem that might have effected your brain?
o No o Yes
11

i,
Normative Indicators 64 3.1.1. If YES,
(To researcher, if yes, indicate number of previous head injuries sustained by participants and type of head injury. (eg: MV A, fall, assault, gunshot wound etc.)
PatholoJOT Type Date (month/year) Type Hospitalized (Yes/No) Length of Unconsciousness Duration of stay in hospital
1 2 3
3.2. When you left the hospital, did you have to continue to see the doctor as an outpatient?
o Yes o No
3.3. Are you experiencing any problems related to this injury currently? o No o Yes
3.3.1. If YES, please give further information
4. Education
4.1. What was the last grade you passed? (NB, not just started)
o Grade 10 o Grade 11 o Grade 12
4.2. Did you fail or repeat any grades at school?
o Yes o No

Nonnative Indicators 65 4.3. If YES, which grade and how many times did you fail or repeat?
o Once o Twice o 3 times or more
4.4. What was the reason you failed/repeated?
o Financial o Family responsibilities o Lack of interest o Political unrest/Strike, School closing o Poor academic perfonnance o Other
5. Substance Use
5.1. How often do you have a drink containing alcohol?
o Never o Monthly or less o Once a week o Three times a week o Four or more times a week
5.2. How many drinks containing alcohol do you have on a typical day of drinking?
o lor2 o 30r4 o 50r6 o 7to 9 o 10 or more
5.3. How long have you been drinking in this way?
o Within the past 6 months o From 6 months to 5 years o More than 5 years
5.4. How often have you needed a drink in the morning to get yourself going after a heavy drinking session?
o Never o Within the past 6 months o From 6 months to 5 years o More than 5 years

Normative Indicators 66 5.5. Are there fmancial, legal or family problems related to your drinking?
o No o Yes, but not in the past year o Yes, during the past year
5.6. Has a relative, friend, doctor or health worker been concerned about your drinking or suggested you cut down?
o No o Yes, but not in the past year o Yes, during the past year
5.6.1. If YES, who and what were the reasons for their concerns?
5.7. Have you ever gone to anyone for help about your drinking?
If YES, when? o Within the past 6 months o From 6 months to 5 years o More than 5 years
5.7.1. If YES, who did you go to?
5.8. Have you ever been admitted to hospital for substance use?
5.8.1. If YES, when? o Within the past 6 months o From 6 months to 5 years o More than 5 years
5.8.2 If YES, please give more details of the place of admission and the programme etc.:
OPTIONAL (as directed by information contained on questionnaire):
5.9. Have you ever used any drugs (eg. dagga, mandrax, ecstasy, glue or paint thinners)? Please give specific details of frequency (how much) of use and when you began using
i (eg. a packet of dagga every day since you were 15 etc.).
II,
!I 'I'
Ir'I :1
I
'I I
II
II

Appendix C: Informed Consent Form
RHODES UNIVERSITY DEPARTMENT OF PSYCHOLOGY PARTICIPANT CONSENT FORM
Normative Indicators 67
I, have been informed of the nature of the research in which I will participate. I understand that four intern psychologists from Rhodes University, Karen Anne Hope Andrews, Andrea Jane Wong, Lauren Nicola Fike, and Anita Da Silva Pita will be administering some cognitive tests on me, and I hereby agree to participate in this project.
I understand that:
1) The above-mentioned intern clinical psychologists are conducting research as a requirement for a Masters degree in clinical psychology at Rhodes University. Their aim is to collect scores for a number of cognitive tests for a normal population of black South African people, who speak Xhosa as their first language. These scores will then be used as standard for this population group.
2) The research will involve willing, black, Xhosa speakers with a Grade 11 - 12 education, from a former Department of Education and Training (DET)-type school.
3) Participants will be assessed using various commonly used cognitive tests.
4) Participation in the research is completely voluntary and I have the right to withdraw from the study at any stage.
5) The information collected on individual participants will be strictly confidential, with no personal information being disclosed to anyone, except members of the research team.
6) No individual test results will be given to me or to any other person outside of the research team. The information collected will be used for research purposes only by the researchers and will not be made available to my employers or anyone else under any circumstances.
7) Information collected from this project may be used anonymously for thesis and publication purposes.
Signed (Participant) Signed (Researcher)
Name Name
Date

Nonnative Indicators 68 Appendix D: Test Protocols
TEST OF MEMORY MALINGERING crOMM) -TRIAL 1 AND TRIAL 2
Name: ----------------- Clinician: _________ _
Requirements:
NOT TIMED
Instructions:
TOMM score sheet TOMM Stimulus booklets Pencil (for recording)
Place the test booklet for Trial i in front of examinee. Say:
Date:. ____ _
"This is a test of your ability to learn and remember pictures of common objects. First, I'll show you 50 pictures, one at a time. Then I'll give you a chance to see how many of them you can remember."
Sample Trial: Open the test booklet to the page, titled Sample Trial and say:
"Let's try a sample trial fIrst that contains only two pictures. Look carefully at each picture and try to remember it. You don't have to learn the name of the picture. Just look at each one and try to remember it."
Show each picture for 3 seconds, with a i-second interval between pictures. Then the clinician turns to the page with 2 pictures (the recognition panel) and says:
"Point to the picture I showed you before. Was it this one (clinician points to top picture) or this one (clinician points to bottom picture)?"
If examinee has not responded within i 0 seconds, he/she should be encouraged to guess. If either answer is incorrect or examinee seems uncertain about the procedure, the sample trial should be repeated until both answers are correct.
Trial 1: Turn to the page titled Trial i and say:
"I'm going to show you 50 pictures, one at a time. Look at each one and try to remember it. Do you have any questions before we begin?"
Show each picture for 3 seconds, with a i-second interval between pictures. Do not speed up or slow down the process on the examinee's request. Also, ensure that the examinee looks at each picture and tap the picture if the examinee does not seem to be paying attention to it. The clinician then turns to the first recognition panel and says:
"Point to the picture I showed you previously."
I
I' I I
,I

----;-r (!"
Normative Indicators 69 If examinee has not responded within 10 seconds, he/she should be encouraged to guess. The examinee must give a response for each panel. If the response is correct, the clinician must tell the examinee "correct". If the response is incorrect, the clinician must say, "No, that is not right. It was this one," and point to the correct picture.
Trial 2: Place test booklet for Trial 2 in front of examinee and say:
"I'm going to show you the same 50 pictures again. Look at each one and try to remember it. Any questions?"
Repeat procedure as above for recognition test.
Scoring:
Circle the answer given by the examinee on the TOMM score sheet. The correct answers are in bold and underlined. Once testing has been completed, place a check in the box provided for all correct answers and score each correct answer 1 point.
I:

Normative Indicators 70 TEST OF MEMORY MALINGERING (TOMM) RETENTION TRIAL
Name: ---------------- Clinician:, _________________ _
Requirements:
NOT TIMED
Instructions:
TOMM score sheet TOMM Stimulus booklets Pencil (for recording)
Date: ._--------
Given after a 15 minute delay after Trial 2. The interval should be filled with non-visual tests. Place the Retention Trial test booklet in front of the examinee and say:
"Remember the booklet I showed you earlier that contained the 50 pictures? Let's see how many you can remember."
Turn to the first page in the Retention Trial booklet and say:
"Point to the picture I showed you previously."
Follow the same scoring and administration procedure as for Trials 1 and 2 recognition tests.
i I
il

... 'I
REY IS-ITEM MEMORY TEST
Name: ----------------- Clinician: __________________ __
Requirements:
TIMED
Time Limit:
Instructions:
Stimulus card (11 ,Scm X 9cm) Blank A4 paper
Viewing
10 seconds
Normative Indicators 71
Date: -----------
"I am going to show you a card with 15 items on it, I will only show you the card for 10 seconds and I want you to try and memorise all 15 items on it."
The idea is to create the impression that the task is difficult: ego "There are quite a few items to remember in a short time, but just do your best and see how many
you can remember."
Place the memory stimulus card containing the 15 items in front of the subject for 10 seconds. Remove the card and place a blank A 4 piece of paper in front of participant and ask them to reproduce the set of characters. If the subject is impulsive or casual during the learning period, they should be encouraged to concentrate on the task.
Observations and impressions made during this test may be very important and must therefore be recorded.
Scoring:
TOTAL NUMBER OF CORRECT ITEMS IN ANY LOCATION = ______ _
TOTAL NUMBER OF CORRECT ROWS IN CORRECT LOCATION = _______ _

WAIS-III DIGIT SPAN TEST
Name: Clinician: -------- ------------------Requirements: WA1S-1II Manual p. 133-135 and 181-193 (or below)
WA1S-1II record form (or below) Pencil
NOT TIMED
Instructions: DIGITS FORWARD:
Normative Indicators 72
Date: --------
"I am going to say some numbers. Listen carefully, and when I am through, I want you to say them right after me. Just say what I say."
Read the digits at the rate of one per second, dropping your voice inflection slightly on the last digit in the sequence.
Discontinue after a score of 0 on both trials of any item.
ITEM NUMBER TRIAL ITEM TRIAL SCORE ITEM SCORE (0, 1, 2) 1.) 1. 1-7
2. 6-3 2.) 1. 5-8-2
2. 6-9-4 3.) 1. 6-4-3-9
2. 7-2-8-6 4.) 1. 4-2-7-3-1
2. 7-5-8-3-6 5.) 1. 6-1-9-4-7-3
2. 3-9-2-4-8-7 6.) 1. 5-9-1-7-4-2-8
2. 4-1-7-9-3-8-6 7.) 1. 5-8-1-9-2-6-4-7
2. 3-8-2-9-5-1-7-4 8.) 1. 2-7-5-8-6-2-5-8-4
2. 7-1-3-9-4-2-5-6-8 DIGITS SPAN FORWARDS TOTAL SCORE

· ~
Nonnative Indicators 73 DIGITS BACKWARD: Administer even if examinee obtains a score of 0 on Digits Forward
"Now I am going to say some more numbers. But this time when I stop, I want you to say them backward. For example, if! say 7-1-9, what would you say?"
If the examinee responds correctly (9-1-7), say: "That's right" and proceed to trial 1 of item 1.
If the examinee responds incorrectly, provide the correct response and say, "No, you would say 9-1-7. I said 7-1-9, so to say it backward, you would say 9-1-7. Now try these numbers. Remember, you are to say them backward: 3-4-8."
Do not provide any assistance on this example. Whether or not the examinee responds correctly to this example (8-4-3), proceed to trial 1 of item 1.
Read the digits at the rate of one per second, dropping your voice inflection slightly on the last digit in the sequence.
Discontinue after a score of 0 on both trials of any item.
ITEM NUMBER TRIAL TRIAL SCORE ITEM SCORE (0, 1, 2) 1.) 1. 2-4
2. 5-7 2.) 1. 6-2-9
2. 4-1-5 3.) 1. 3-2-7-9
2. 4-9-6-8 4.) 1. 1-5-2-8-6
2. 6-1-8-4-3 5.) 1. 5-3-9-4-1-8
2. 7-2-4-8-5-6 6.) 1. 8-1-2-9-3-6-5
2. 4-7-3-9-1-2-8 7.) 1. 9-4-3-7-6-2-5-8
2. 7-2-8-1-9-6-5-3 DIGITS SPAN BACKWARD TOTAL SCORE
Scoring: Calculate the digit span raw score by adding up the digit span backwards and forwards scores. You then obtain the age-correlated scaled score (ACSS) by looking up the score for the appropriate age group in the manual. The Reliable Digits Score (RDS) is calculated by adding up the longest digit string recalled correctly on both trials of the item for the digit span forwards and digit span backward.
DIGITS SPAN TOTAL RAW SCORE (FORWARD + BACKWARD SCORES) =
AGE CORRELATED SCALED SCORE (ACSS) (FROM MANUAL) = ______ _
RELIABLE DIGITS SCORE (RDS) = ______ _

Normative Indicators 74 TRAIL MAKING TEST
Name: ----------------- Clinician: __________ __ Date: -----------
Requirements: Test sheets (4 sheets) Pencil Stop watch
TIMED Time to complete each trail
Time Limit: None
TRAIL A: Sample: "Draw a line to connect the circles in order from 1 to 8, without lifting your pencil, as fast as you can."
Test: Showing the subject the test sheet and pointing out the first 3 or 4 circles which must be joined, give the following instruction:
"Now here is a page with numbers all over it. Draw a line to join the circles in order from 1 to 25, without lifting your penciL Do it as fast as you can."
Record time taken to join all the circles in the correct order.
TRAILB: Sample: "Draw a line to connect the circles in order, switching from numbers and letters, starting with 1 then A. Do it as fast as you can without lifting your penciL"
Test: Showing the subject the test sheet and pointing out the first 3 or 4 circles which must be joined, give the following instruction:
"Now here is a page with numbers and letters all over it. Draw a line to join the circles in order by switching between numbers and letters, starting with 1 then A, and fmishing with 13. Do it as fast as you can without lifting your pencil."
Record time taken to join all the circles in the correct order.
Note: If participant makes a mistake, DO NOT STOP TIMING; point out mistake and participant corrects the error and carries on.
Scoring: COMPLETION TIME FOR TRAIL A: _____ _
COMPLETION TIME FOR TRAIL B: _____ _
ERRORS ON TRAIL A: _____ _ ERRORS ON TRAIL B: _____ _
TRAIL B:A RATIO SCORE: ______ _