Embed Size (px)
Citation preview
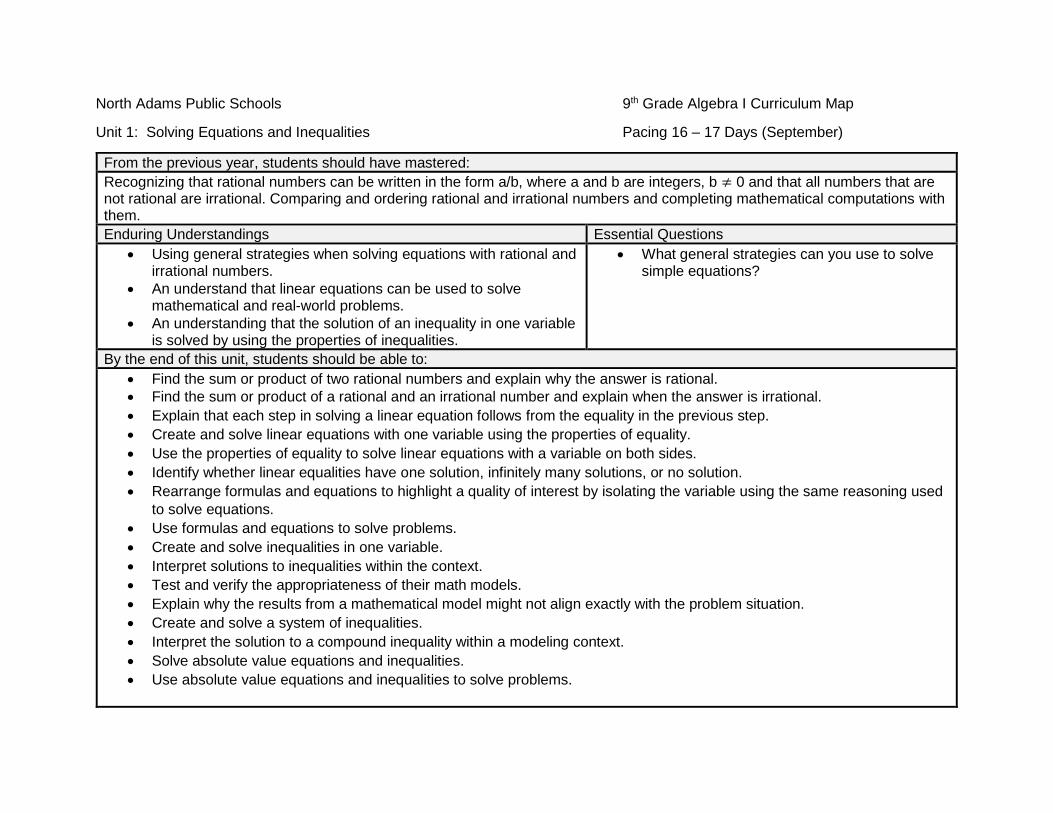
North Adams Public Schools 9th Grade Algebra I Curriculum Map
Unit 1: Solving Equations and Inequalities Pacing 16 – 17 Days (September)
From the previous year, students should have mastered:
Recognizing that rational numbers can be written in the form a/b, where a and b are integers, b ≠ 0 and that all numbers that are not rational are irrational. Comparing and ordering rational and irrational numbers and completing mathematical computations with them.
Enduring Understandings Essential Questions
Using general strategies when solving equations with rational and irrational numbers.
An understand that linear equations can be used to solve mathematical and real-world problems.
An understanding that the solution of an inequality in one variable is solved by using the properties of inequalities.
What general strategies can you use to solve simple equations?
By the end of this unit, students should be able to:
Find the sum or product of two rational numbers and explain why the answer is rational.
Find the sum or product of a rational and an irrational number and explain when the answer is irrational.
Explain that each step in solving a linear equation follows from the equality in the previous step.
Create and solve linear equations with one variable using the properties of equality.
Use the properties of equality to solve linear equations with a variable on both sides.
Identify whether linear equalities have one solution, infinitely many solutions, or no solution.
Rearrange formulas and equations to highlight a quality of interest by isolating the variable using the same reasoning used
to solve equations.
Use formulas and equations to solve problems.
Create and solve inequalities in one variable.
Interpret solutions to inequalities within the context.
Test and verify the appropriateness of their math models.
Explain why the results from a mathematical model might not align exactly with the problem situation.
Create and solve a system of inequalities.
Interpret the solution to a compound inequality within a modeling context.
Solve absolute value equations and inequalities.
Use absolute value equations and inequalities to solve problems.
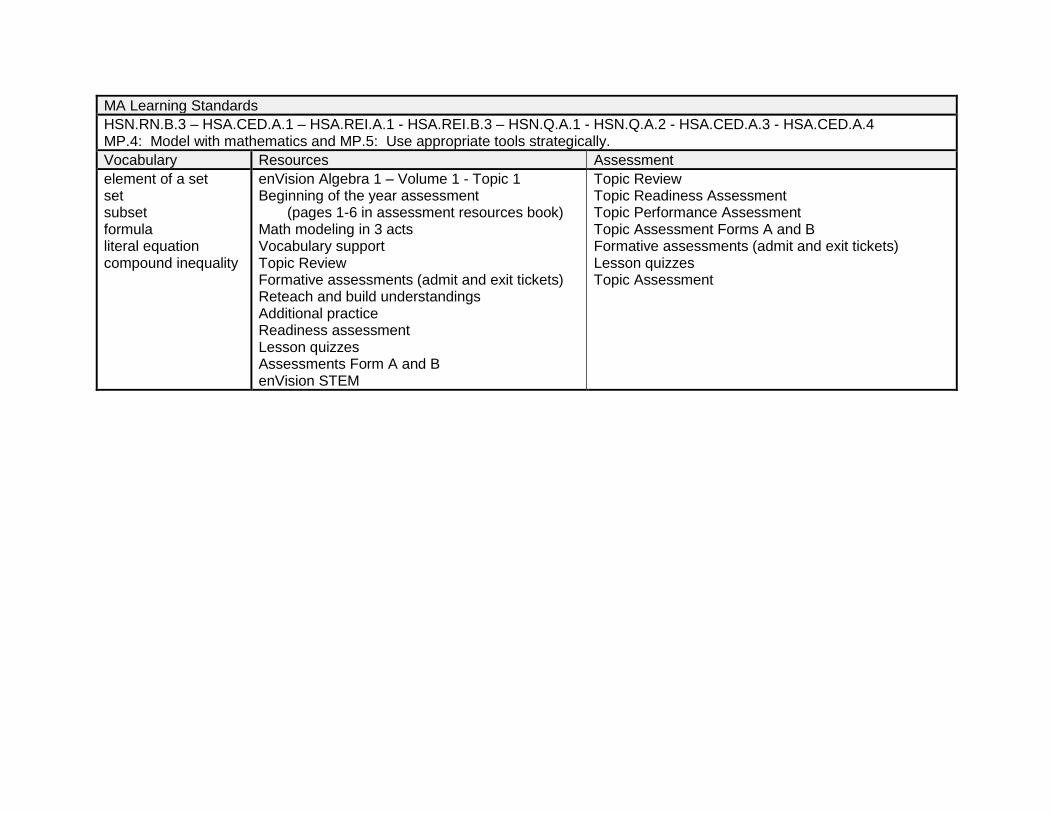
MA Learning Standards
HSN.RN.B.3 – HSA.CED.A.1 – HSA.REI.A.1 - HSA.REI.B.3 – HSN.Q.A.1 - HSN.Q.A.2 - HSA.CED.A.3 - HSA.CED.A.4 MP.4: Model with mathematics and MP.5: Use appropriate tools strategically.
Vocabulary Resources Assessment
element of a set set subset formula literal equation compound inequality
enVision Algebra 1 – Volume 1 - Topic 1 Beginning of the year assessment (pages 1-6 in assessment resources book) Math modeling in 3 acts Vocabulary support Topic Review Formative assessments (admit and exit tickets) Reteach and build understandings Additional practice Readiness assessment Lesson quizzes Assessments Form A and B enVision STEM
Topic Review Topic Readiness Assessment Topic Performance Assessment Topic Assessment Forms A and B Formative assessments (admit and exit tickets) Lesson quizzes Topic Assessment
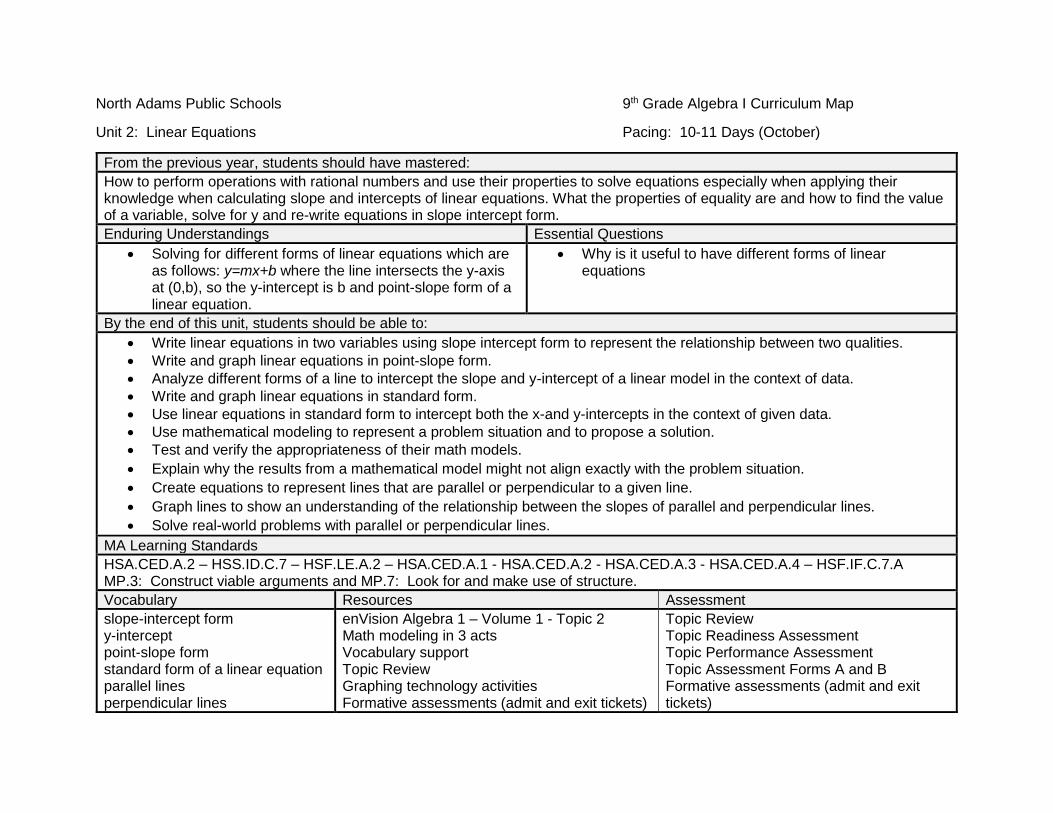
North Adams Public Schools 9th Grade Algebra I Curriculum Map
Unit 2: Linear Equations Pacing: 10-11 Days (October)
From the previous year, students should have mastered:
How to perform operations with rational numbers and use their properties to solve equations especially when applying their knowledge when calculating slope and intercepts of linear equations. What the properties of equality are and how to find the value of a variable, solve for y and re-write equations in slope intercept form.
Enduring Understandings Essential Questions
Solving for different forms of linear equations which are as follows: y=mx+b where the line intersects the y-axis at (0,b), so the y-intercept is b and point-slope form of a linear equation.
Why is it useful to have different forms of linear equations
By the end of this unit, students should be able to:
Write linear equations in two variables using slope intercept form to represent the relationship between two qualities.
Write and graph linear equations in point-slope form.
Analyze different forms of a line to intercept the slope and y-intercept of a linear model in the context of data.
Write and graph linear equations in standard form.
Use linear equations in standard form to intercept both the x-and y-intercepts in the context of given data.
Use mathematical modeling to represent a problem situation and to propose a solution.
Test and verify the appropriateness of their math models.
Explain why the results from a mathematical model might not align exactly with the problem situation.
Create equations to represent lines that are parallel or perpendicular to a given line.
Graph lines to show an understanding of the relationship between the slopes of parallel and perpendicular lines.
Solve real-world problems with parallel or perpendicular lines.
MA Learning Standards
HSA.CED.A.2 – HSS.ID.C.7 – HSF.LE.A.2 – HSA.CED.A.1 - HSA.CED.A.2 - HSA.CED.A.3 - HSA.CED.A.4 – HSF.IF.C.7.A MP.3: Construct viable arguments and MP.7: Look for and make use of structure.
Vocabulary Resources Assessment
slope-intercept form y-intercept point-slope form standard form of a linear equation parallel lines perpendicular lines
enVision Algebra 1 – Volume 1 - Topic 2 Math modeling in 3 acts Vocabulary support Topic Review Graphing technology activities Formative assessments (admit and exit tickets)
Topic Review Topic Readiness Assessment Topic Performance Assessment Topic Assessment Forms A and B Formative assessments (admit and exit tickets)
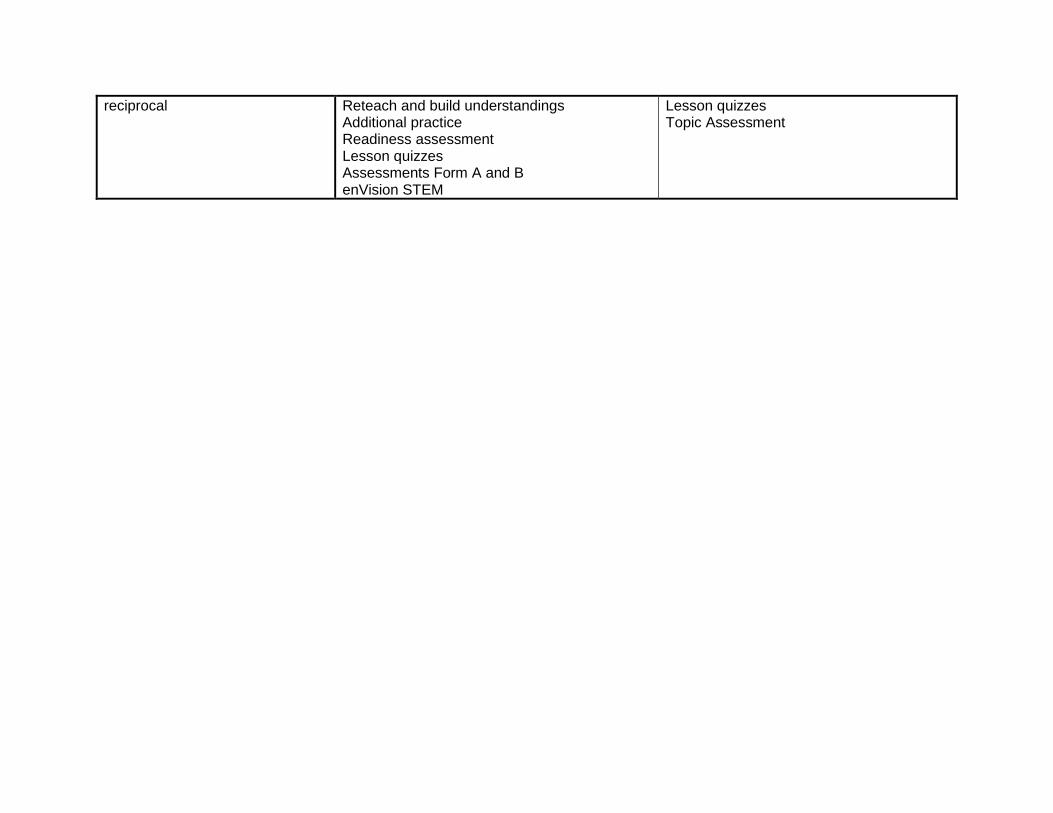
reciprocal
Reteach and build understandings Additional practice Readiness assessment Lesson quizzes Assessments Form A and B enVision STEM
Lesson quizzes Topic Assessment
North Adams Public Schools 9th Grade Algebra I Curriculum Map
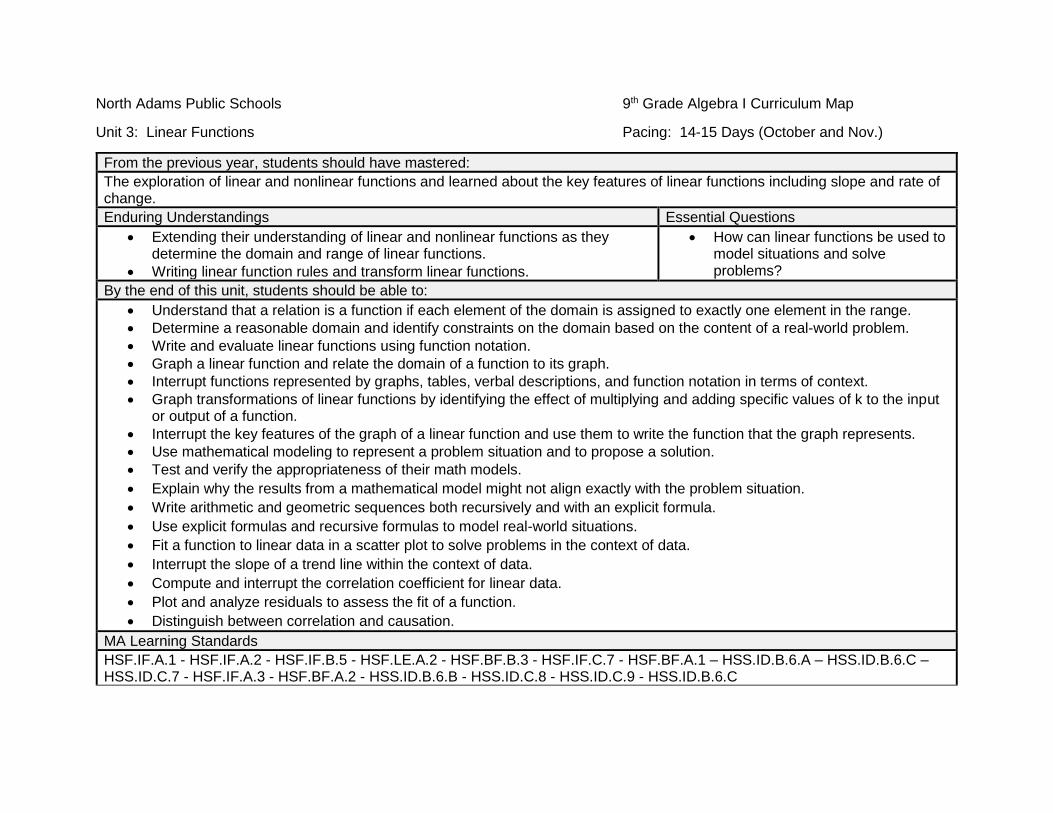
Unit 3: Linear Functions Pacing: 14-15 Days (October and Nov.)
From the previous year, students should have mastered:
The exploration of linear and nonlinear functions and learned about the key features of linear functions including slope and rate of change.
Enduring Understandings Essential Questions
Extending their understanding of linear and nonlinear functions as they determine the domain and range of linear functions.
Writing linear function rules and transform linear functions.
How can linear functions be used to model situations and solve problems?
By the end of this unit, students should be able to:
Understand that a relation is a function if each element of the domain is assigned to exactly one element in the range.
Determine a reasonable domain and identify constraints on the domain based on the content of a real-world problem.
Write and evaluate linear functions using function notation.
Graph a linear function and relate the domain of a function to its graph.
Interrupt functions represented by graphs, tables, verbal descriptions, and function notation in terms of context.
Graph transformations of linear functions by identifying the effect of multiplying and adding specific values of k to the input or output of a function.
Interrupt the key features of the graph of a linear function and use them to write the function that the graph represents.
Use mathematical modeling to represent a problem situation and to propose a solution.
Test and verify the appropriateness of their math models.
Explain why the results from a mathematical model might not align exactly with the problem situation.
Write arithmetic and geometric sequences both recursively and with an explicit formula.
Use explicit formulas and recursive formulas to model real-world situations.
Fit a function to linear data in a scatter plot to solve problems in the context of data.
Interrupt the slope of a trend line within the context of data.
Compute and interrupt the correlation coefficient for linear data.
Plot and analyze residuals to assess the fit of a function.
Distinguish between correlation and causation.
MA Learning Standards
HSF.IF.A.1 - HSF.IF.A.2 - HSF.IF.B.5 - HSF.LE.A.2 - HSF.BF.B.3 - HSF.IF.C.7 - HSF.BF.A.1 – HSS.ID.B.6.A – HSS.ID.B.6.C – HSS.ID.C.7 - HSF.IF.A.3 - HSF.BF.A.2 - HSS.ID.B.6.B - HSS.ID.C.8 - HSS.ID.C.9 - HSS.ID.B.6.C
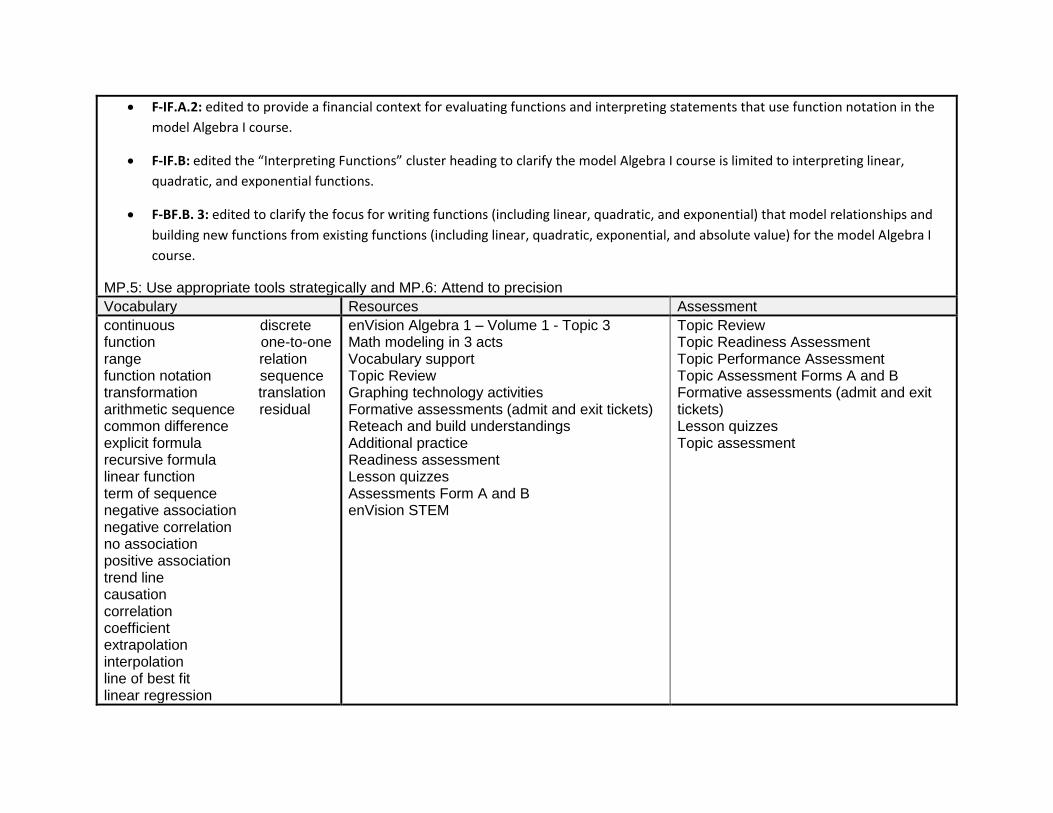
F-IF.A.2: edited to provide a financial context for evaluating functions and interpreting statements that use function notation in the
model Algebra I course.
F-IF.B: edited the “Interpreting Functions” cluster heading to clarify the model Algebra I course is limited to interpreting linear,
quadratic, and exponential functions.
F-BF.B. 3: edited to clarify the focus for writing functions (including linear, quadratic, and exponential) that model relationships and
building new functions from existing functions (including linear, quadratic, exponential, and absolute value) for the model Algebra I
course.
MP.5: Use appropriate tools strategically and MP.6: Attend to precision
Vocabulary Resources Assessment
continuous discrete function one-to-one range relation function notation sequence transformation translation arithmetic sequence residual common difference explicit formula recursive formula linear function term of sequence negative association negative correlation no association positive association trend line causation correlation coefficient extrapolation interpolation line of best fit linear regression
enVision Algebra 1 – Volume 1 - Topic 3 Math modeling in 3 acts Vocabulary support Topic Review Graphing technology activities Formative assessments (admit and exit tickets) Reteach and build understandings Additional practice Readiness assessment Lesson quizzes Assessments Form A and B enVision STEM
Topic Review Topic Readiness Assessment Topic Performance Assessment Topic Assessment Forms A and B Formative assessments (admit and exit tickets) Lesson quizzes Topic assessment
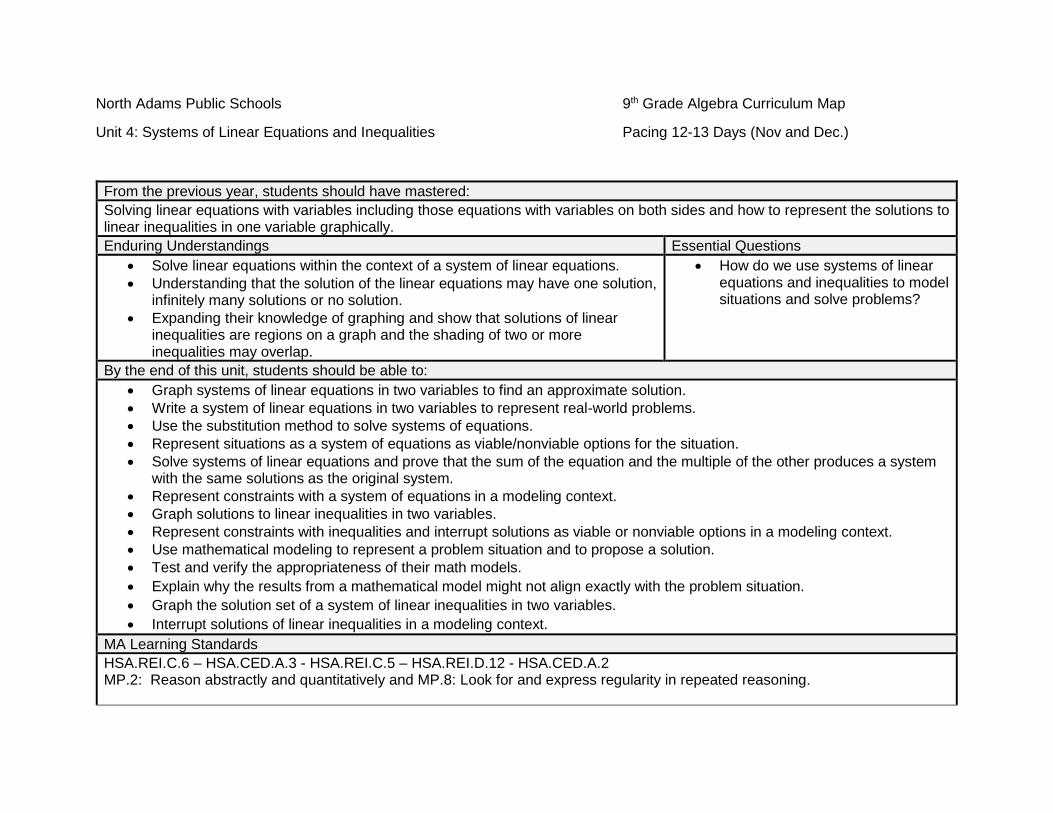
North Adams Public Schools 9th Grade Algebra Curriculum Map
Unit 4: Systems of Linear Equations and Inequalities Pacing 12-13 Days (Nov and Dec.)
From the previous year, students should have mastered:
Solving linear equations with variables including those equations with variables on both sides and how to represent the solutions to linear inequalities in one variable graphically.
Enduring Understandings Essential Questions
Solve linear equations within the context of a system of linear equations.
Understanding that the solution of the linear equations may have one solution, infinitely many solutions or no solution.
Expanding their knowledge of graphing and show that solutions of linear inequalities are regions on a graph and the shading of two or more inequalities may overlap.
How do we use systems of linear equations and inequalities to model situations and solve problems?
By the end of this unit, students should be able to:
Graph systems of linear equations in two variables to find an approximate solution.
Write a system of linear equations in two variables to represent real-world problems.
Use the substitution method to solve systems of equations.
Represent situations as a system of equations as viable/nonviable options for the situation.
Solve systems of linear equations and prove that the sum of the equation and the multiple of the other produces a system with the same solutions as the original system.
Represent constraints with a system of equations in a modeling context.
Graph solutions to linear inequalities in two variables.
Represent constraints with inequalities and interrupt solutions as viable or nonviable options in a modeling context.
Use mathematical modeling to represent a problem situation and to propose a solution.
Test and verify the appropriateness of their math models.
Explain why the results from a mathematical model might not align exactly with the problem situation.
Graph the solution set of a system of linear inequalities in two variables.
Interrupt solutions of linear inequalities in a modeling context.
MA Learning Standards
HSA.REI.C.6 – HSA.CED.A.3 - HSA.REI.C.5 – HSA.REI.D.12 - HSA.CED.A.2 MP.2: Reason abstractly and quantitatively and MP.8: Look for and express regularity in repeated reasoning.
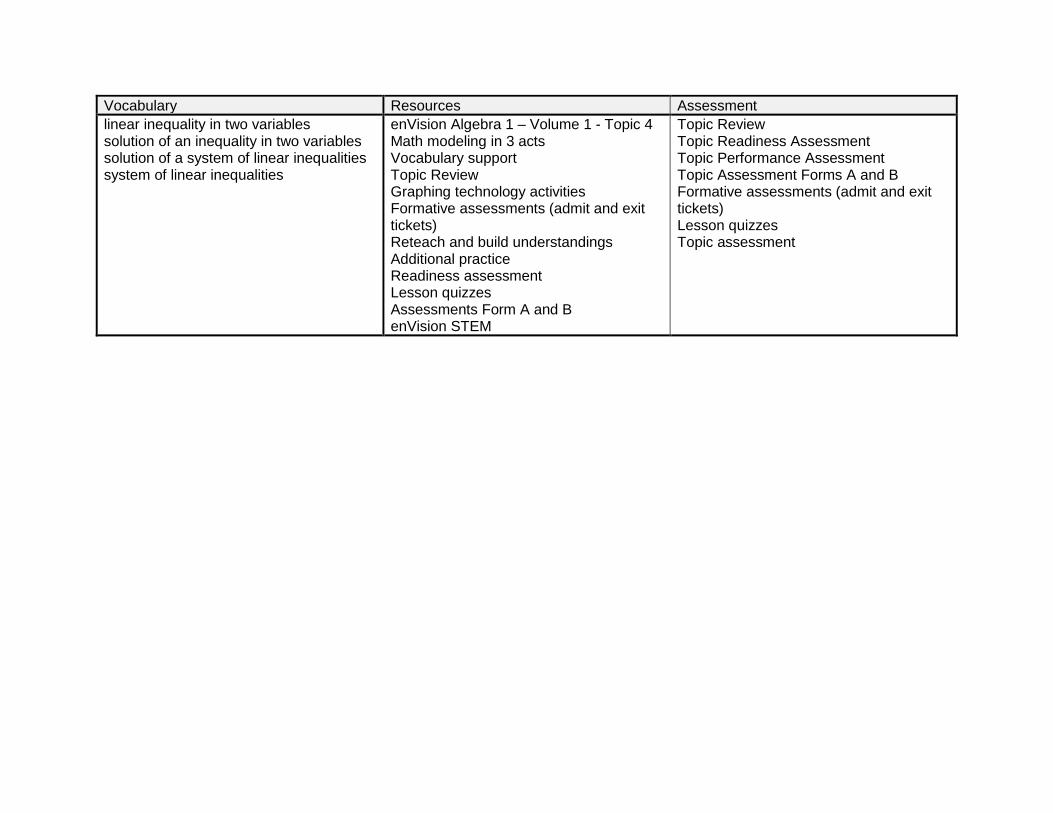
Vocabulary Resources Assessment
linear inequality in two variables solution of an inequality in two variables solution of a system of linear inequalities system of linear inequalities
enVision Algebra 1 – Volume 1 - Topic 4 Math modeling in 3 acts Vocabulary support Topic Review Graphing technology activities Formative assessments (admit and exit tickets) Reteach and build understandings Additional practice Readiness assessment Lesson quizzes Assessments Form A and B enVision STEM
Topic Review Topic Readiness Assessment Topic Performance Assessment Topic Assessment Forms A and B Formative assessments (admit and exit tickets) Lesson quizzes Topic assessment
North Adams Public Schools 9th Grade Algebra I Curriculum Map
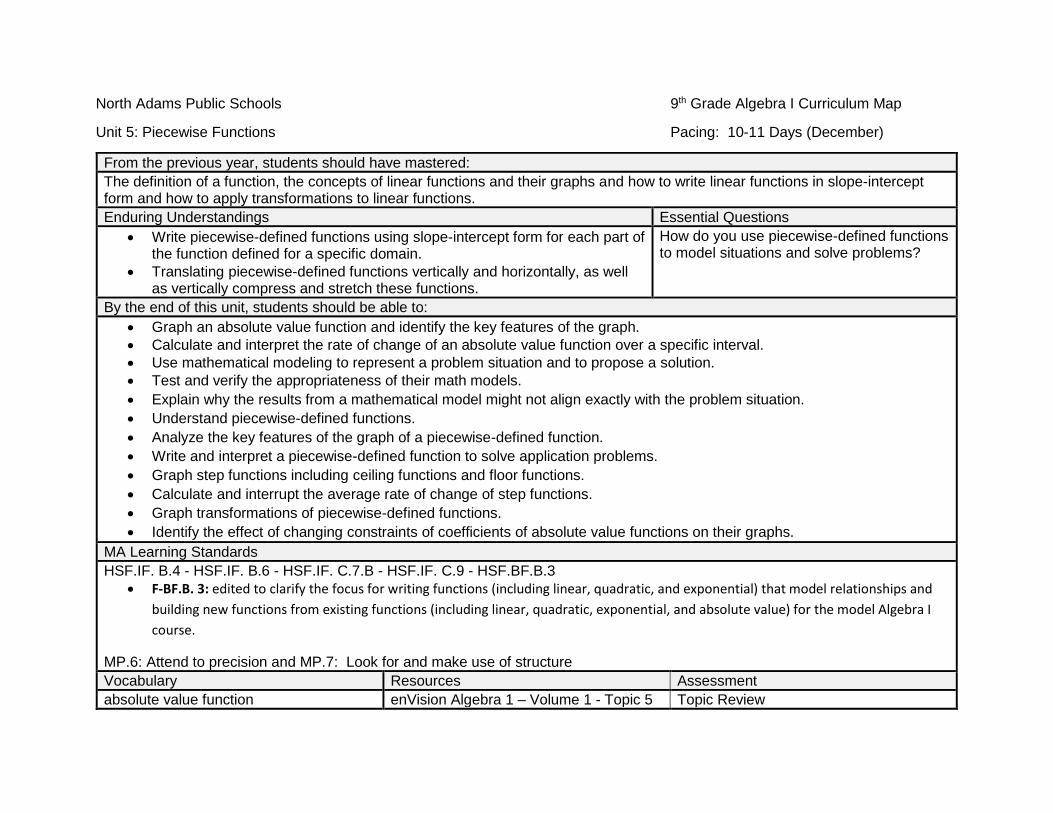
Unit 5: Piecewise Functions Pacing: 10-11 Days (December)
From the previous year, students should have mastered:
The definition of a function, the concepts of linear functions and their graphs and how to write linear functions in slope-intercept form and how to apply transformations to linear functions.
Enduring Understandings Essential Questions
Write piecewise-defined functions using slope-intercept form for each part of the function defined for a specific domain.
Translating piecewise-defined functions vertically and horizontally, as well as vertically compress and stretch these functions.
How do you use piecewise-defined functions to model situations and solve problems?
By the end of this unit, students should be able to:
Graph an absolute value function and identify the key features of the graph.
Calculate and interpret the rate of change of an absolute value function over a specific interval.
Use mathematical modeling to represent a problem situation and to propose a solution.
Test and verify the appropriateness of their math models.
Explain why the results from a mathematical model might not align exactly with the problem situation.
Understand piecewise-defined functions.
Analyze the key features of the graph of a piecewise-defined function.
Write and interpret a piecewise-defined function to solve application problems.
Graph step functions including ceiling functions and floor functions.
Calculate and interrupt the average rate of change of step functions.
Graph transformations of piecewise-defined functions.
Identify the effect of changing constraints of coefficients of absolute value functions on their graphs.
MA Learning Standards
HSF.IF. B.4 - HSF.IF. B.6 - HSF.IF. C.7.B - HSF.IF. C.9 - HSF.BF.B.3
F-BF.B. 3: edited to clarify the focus for writing functions (including linear, quadratic, and exponential) that model relationships and
building new functions from existing functions (including linear, quadratic, exponential, and absolute value) for the model Algebra I
course.
MP.6: Attend to precision and MP.7: Look for and make use of structure
Vocabulary Resources Assessment
absolute value function enVision Algebra 1 – Volume 1 - Topic 5 Topic Review
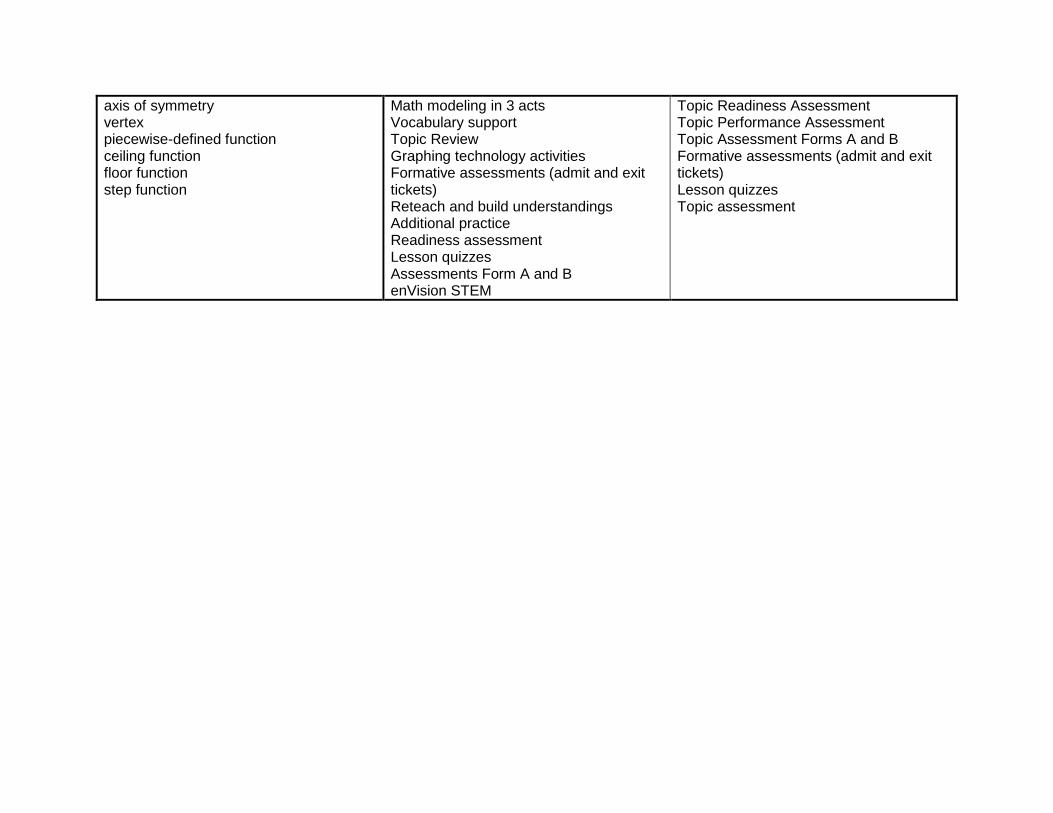
axis of symmetry vertex piecewise-defined function ceiling function floor function step function
Math modeling in 3 acts Vocabulary support Topic Review Graphing technology activities Formative assessments (admit and exit tickets) Reteach and build understandings Additional practice Readiness assessment Lesson quizzes Assessments Form A and B enVision STEM
Topic Readiness Assessment Topic Performance Assessment Topic Assessment Forms A and B Formative assessments (admit and exit tickets) Lesson quizzes Topic assessment
North Adams Public Schools 9th Grade Algebra I Curriculum Map
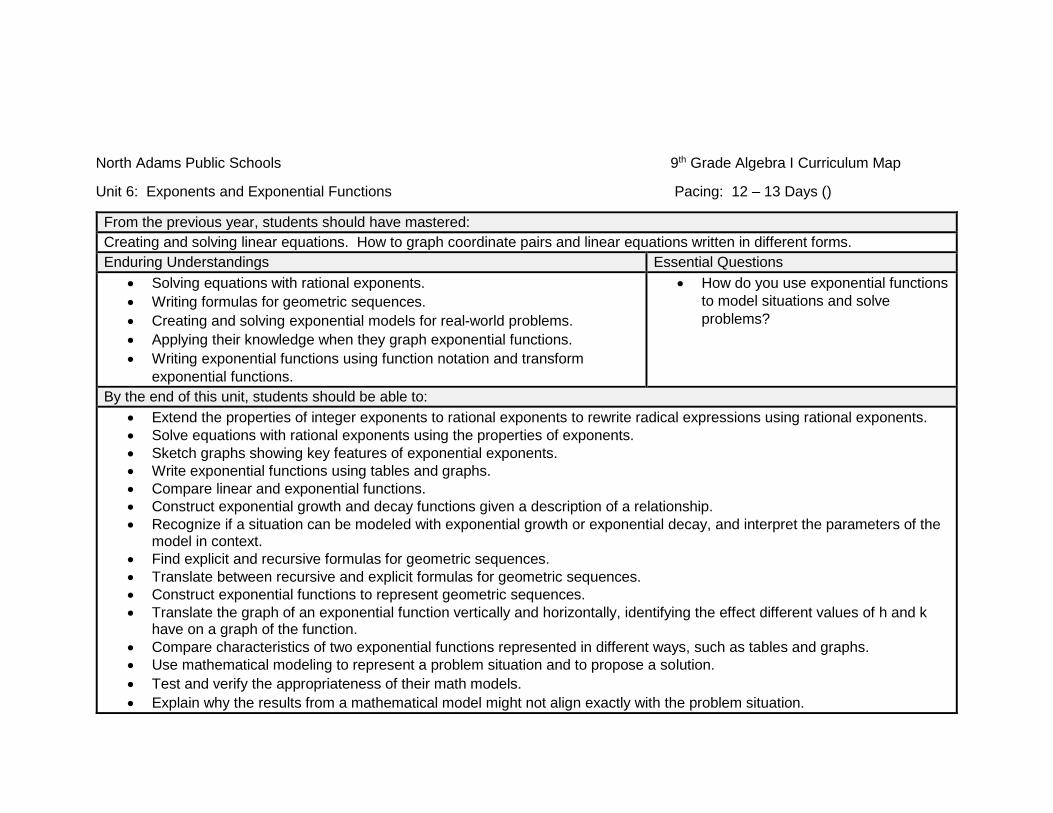
Unit 6: Exponents and Exponential Functions Pacing: 12 – 13 Days ()
From the previous year, students should have mastered:
Creating and solving linear equations. How to graph coordinate pairs and linear equations written in different forms.
Enduring Understandings Essential Questions
Solving equations with rational exponents.
Writing formulas for geometric sequences.
Creating and solving exponential models for real-world problems.
Applying their knowledge when they graph exponential functions.
Writing exponential functions using function notation and transform
exponential functions.
How do you use exponential functions
to model situations and solve
problems?
By the end of this unit, students should be able to:
Extend the properties of integer exponents to rational exponents to rewrite radical expressions using rational exponents.
Solve equations with rational exponents using the properties of exponents.
Sketch graphs showing key features of exponential exponents.
Write exponential functions using tables and graphs.
Compare linear and exponential functions.
Construct exponential growth and decay functions given a description of a relationship.
Recognize if a situation can be modeled with exponential growth or exponential decay, and interpret the parameters of the model in context.
Find explicit and recursive formulas for geometric sequences.
Translate between recursive and explicit formulas for geometric sequences.
Construct exponential functions to represent geometric sequences.
Translate the graph of an exponential function vertically and horizontally, identifying the effect different values of h and k have on a graph of the function.
Compare characteristics of two exponential functions represented in different ways, such as tables and graphs.
Use mathematical modeling to represent a problem situation and to propose a solution.
Test and verify the appropriateness of their math models.
Explain why the results from a mathematical model might not align exactly with the problem situation.
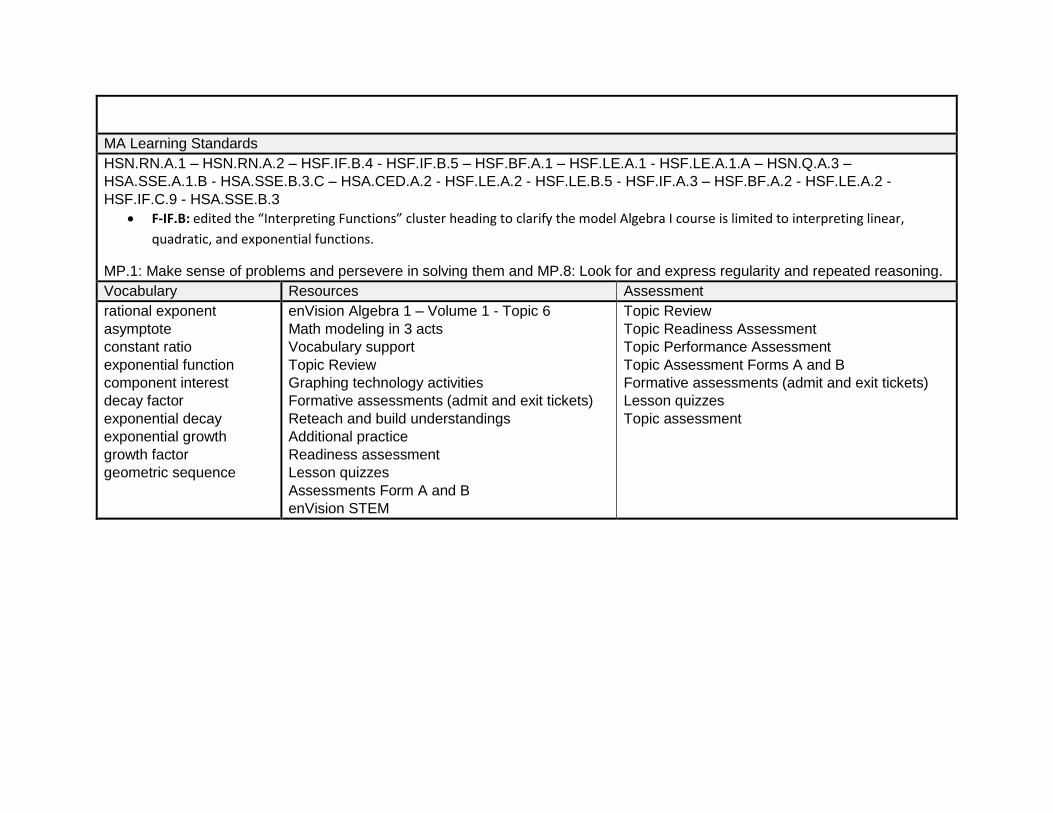
MA Learning Standards
HSN.RN.A.1 – HSN.RN.A.2 – HSF.IF.B.4 - HSF.IF.B.5 – HSF.BF.A.1 – HSF.LE.A.1 - HSF.LE.A.1.A – HSN.Q.A.3 –
HSA.SSE.A.1.B - HSA.SSE.B.3.C – HSA.CED.A.2 - HSF.LE.A.2 - HSF.LE.B.5 - HSF.IF.A.3 – HSF.BF.A.2 - HSF.LE.A.2 -
HSF.IF.C.9 - HSA.SSE.B.3
F-IF.B: edited the “Interpreting Functions” cluster heading to clarify the model Algebra I course is limited to interpreting linear,
quadratic, and exponential functions.
MP.1: Make sense of problems and persevere in solving them and MP.8: Look for and express regularity and repeated reasoning.
Vocabulary Resources Assessment
rational exponent
asymptote
constant ratio
exponential function
component interest
decay factor
exponential decay
exponential growth
growth factor
geometric sequence
enVision Algebra 1 – Volume 1 - Topic 6
Math modeling in 3 acts
Vocabulary support
Topic Review
Graphing technology activities
Formative assessments (admit and exit tickets)
Reteach and build understandings
Additional practice
Readiness assessment
Lesson quizzes
Assessments Form A and B
enVision STEM
Topic Review
Topic Readiness Assessment
Topic Performance Assessment
Topic Assessment Forms A and B
Formative assessments (admit and exit tickets)
Lesson quizzes
Topic assessment
North Adams Public Schools 9th Grade Algebra I Curriculum Map
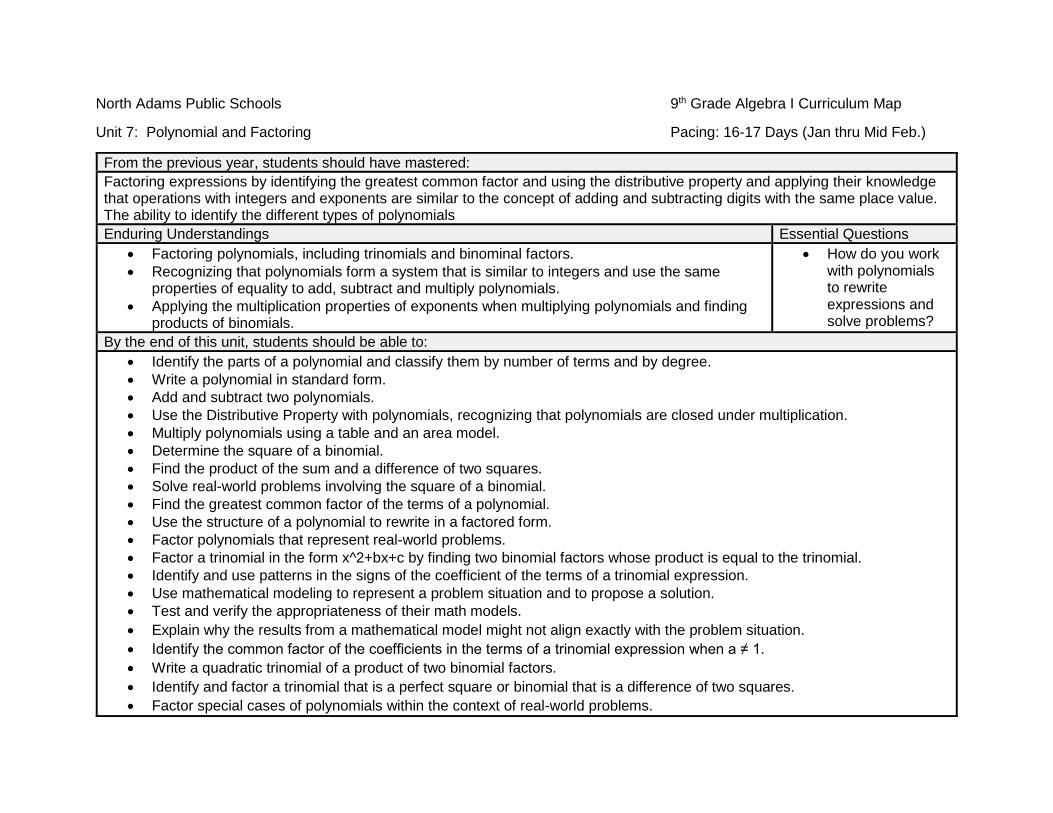
Unit 7: Polynomial and Factoring Pacing: 16-17 Days (Jan thru Mid Feb.)
From the previous year, students should have mastered:
Factoring expressions by identifying the greatest common factor and using the distributive property and applying their knowledge that operations with integers and exponents are similar to the concept of adding and subtracting digits with the same place value. The ability to identify the different types of polynomials
Enduring Understandings Essential Questions
Factoring polynomials, including trinomials and binominal factors.
Recognizing that polynomials form a system that is similar to integers and use the same properties of equality to add, subtract and multiply polynomials.
Applying the multiplication properties of exponents when multiplying polynomials and finding products of binomials.
How do you work with polynomials to rewrite expressions and solve problems?
By the end of this unit, students should be able to:
Identify the parts of a polynomial and classify them by number of terms and by degree.
Write a polynomial in standard form.
Add and subtract two polynomials.
Use the Distributive Property with polynomials, recognizing that polynomials are closed under multiplication.
Multiply polynomials using a table and an area model.
Determine the square of a binomial.
Find the product of the sum and a difference of two squares.
Solve real-world problems involving the square of a binomial.
Find the greatest common factor of the terms of a polynomial.
Use the structure of a polynomial to rewrite in a factored form.
Factor polynomials that represent real-world problems.
Factor a trinomial in the form x^2+bx+c by finding two binomial factors whose product is equal to the trinomial.
Identify and use patterns in the signs of the coefficient of the terms of a trinomial expression.
Use mathematical modeling to represent a problem situation and to propose a solution.
Test and verify the appropriateness of their math models.
Explain why the results from a mathematical model might not align exactly with the problem situation.
Identify the common factor of the coefficients in the terms of a trinomial expression when a ≠ 1.
Write a quadratic trinomial of a product of two binomial factors.
Identify and factor a trinomial that is a perfect square or binomial that is a difference of two squares.
Factor special cases of polynomials within the context of real-world problems.
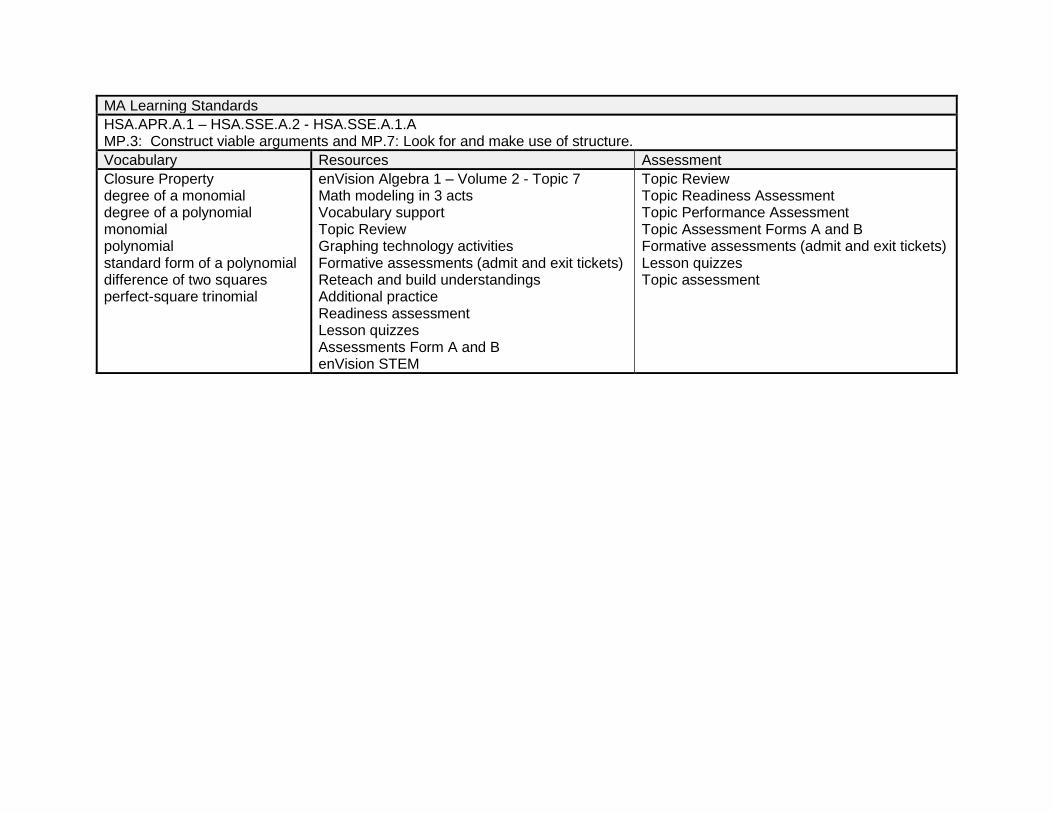
MA Learning Standards
HSA.APR.A.1 – HSA.SSE.A.2 - HSA.SSE.A.1.A MP.3: Construct viable arguments and MP.7: Look for and make use of structure.
Vocabulary Resources Assessment
Closure Property degree of a monomial degree of a polynomial monomial polynomial standard form of a polynomial difference of two squares perfect-square trinomial
enVision Algebra 1 – Volume 2 - Topic 7 Math modeling in 3 acts Vocabulary support Topic Review Graphing technology activities Formative assessments (admit and exit tickets) Reteach and build understandings Additional practice Readiness assessment Lesson quizzes Assessments Form A and B enVision STEM
Topic Review Topic Readiness Assessment Topic Performance Assessment Topic Assessment Forms A and B Formative assessments (admit and exit tickets) Lesson quizzes Topic assessment
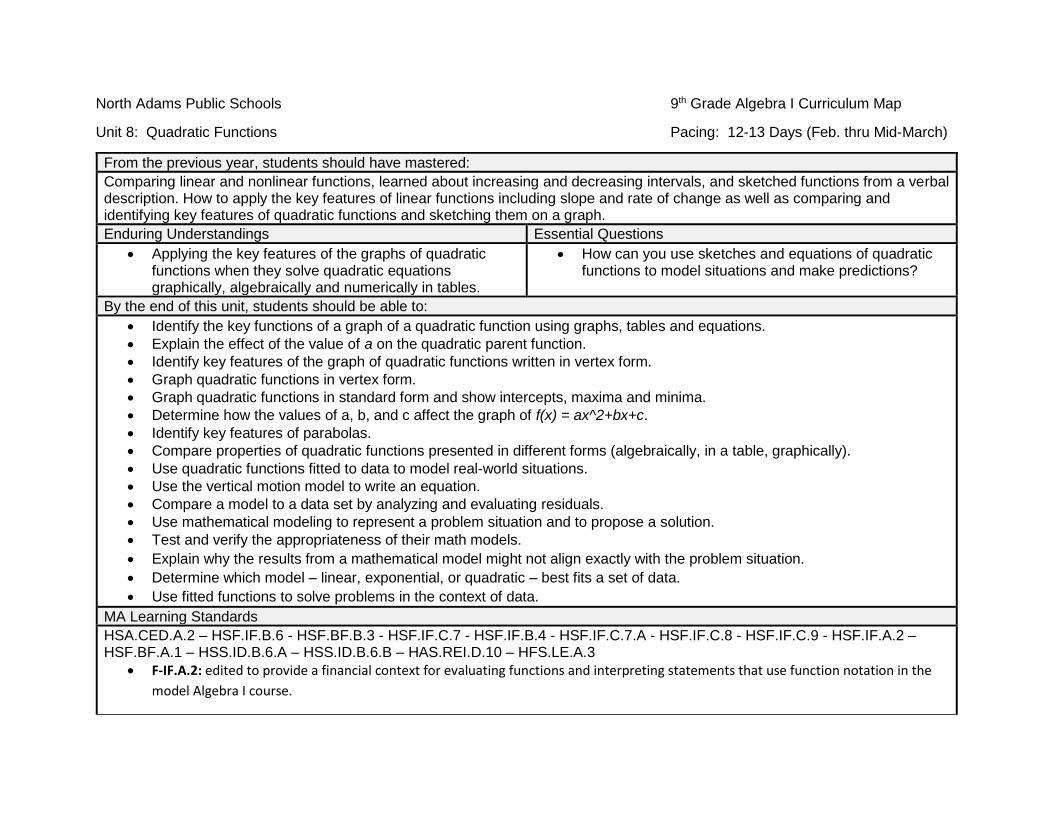
North Adams Public Schools 9th Grade Algebra I Curriculum Map
Unit 8: Quadratic Functions Pacing: 12-13 Days (Feb. thru Mid-March)
From the previous year, students should have mastered:
Comparing linear and nonlinear functions, learned about increasing and decreasing intervals, and sketched functions from a verbal description. How to apply the key features of linear functions including slope and rate of change as well as comparing and identifying key features of quadratic functions and sketching them on a graph.
Enduring Understandings Essential Questions
Applying the key features of the graphs of quadratic functions when they solve quadratic equations graphically, algebraically and numerically in tables.
How can you use sketches and equations of quadratic functions to model situations and make predictions?
By the end of this unit, students should be able to:
Identify the key functions of a graph of a quadratic function using graphs, tables and equations.
Explain the effect of the value of a on the quadratic parent function.
Identify key features of the graph of quadratic functions written in vertex form.
Graph quadratic functions in vertex form.
Graph quadratic functions in standard form and show intercepts, maxima and minima.
Determine how the values of a, b, and c affect the graph of f(x) = ax^2+bx+c.
Identify key features of parabolas.
Compare properties of quadratic functions presented in different forms (algebraically, in a table, graphically).
Use quadratic functions fitted to data to model real-world situations.
Use the vertical motion model to write an equation.
Compare a model to a data set by analyzing and evaluating residuals.
Use mathematical modeling to represent a problem situation and to propose a solution.
Test and verify the appropriateness of their math models.
Explain why the results from a mathematical model might not align exactly with the problem situation.
Determine which model – linear, exponential, or quadratic – best fits a set of data.
Use fitted functions to solve problems in the context of data.
MA Learning Standards
HSA.CED.A.2 – HSF.IF.B.6 - HSF.BF.B.3 - HSF.IF.C.7 - HSF.IF.B.4 - HSF.IF.C.7.A - HSF.IF.C.8 - HSF.IF.C.9 - HSF.IF.A.2 – HSF.BF.A.1 – HSS.ID.B.6.A – HSS.ID.B.6.B – HAS.REI.D.10 – HFS.LE.A.3
F-IF.A.2: edited to provide a financial context for evaluating functions and interpreting statements that use function notation in the
model Algebra I course.
F-IF.B: edited the “Interpreting Functions” cluster heading to clarify the model Algebra I course is limited to interpreting linear,
quadratic, and exponential functions.
F-BF.B. 3: edited to clarify the focus for writing functions (including linear, quadratic, and exponential) that model relationships and
building new functions from existing functions (including linear, quadratic, exponential, and absolute value) for the model Algebra I
course.
MP.4: Model with mathematics and MP.7: Look for and make use of structure.
Vocabulary Resources Assessment
parabola quadratic parent function vertex form of a quadratic function standard form of a quadratic function quadratic regression vertex motion model
enVision Algebra 1 – Volume 2 - Topic 8 Math modeling in 3 acts Vocabulary support Topic Review Graphing technology activities Formative assessments (admit and exit tickets) Reteach and build understandings Additional practice Readiness assessment Lesson quizzes Assessments Form A and B enVision STEM
Topic Review Topic Readiness Assessment Topic Performance Assessment Topic Assessment Forms A and B Formative assessments (admit and exit tickets) Lesson quizzes Topic assessment
North Adams Public Schools 9th Grade Algebra I Curriculum Map
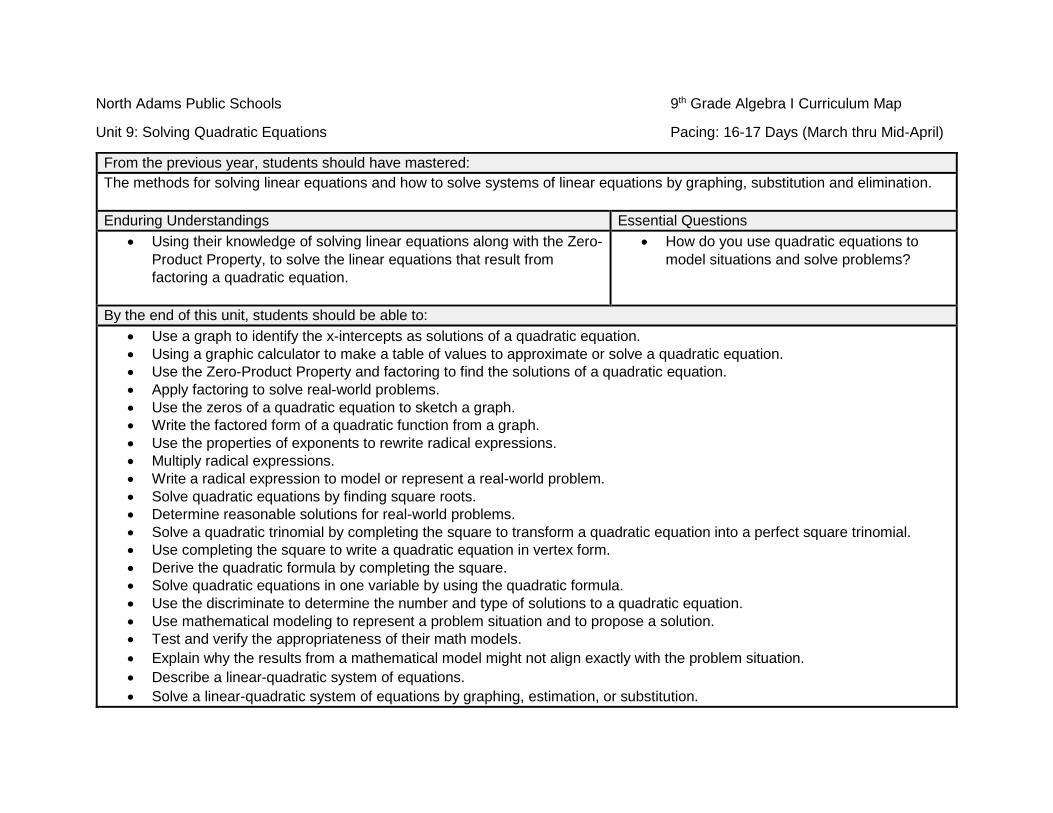
Unit 9: Solving Quadratic Equations Pacing: 16-17 Days (March thru Mid-April)
From the previous year, students should have mastered:
The methods for solving linear equations and how to solve systems of linear equations by graphing, substitution and elimination.
Enduring Understandings Essential Questions
Using their knowledge of solving linear equations along with the Zero-
Product Property, to solve the linear equations that result from
factoring a quadratic equation.
How do you use quadratic equations to
model situations and solve problems?
By the end of this unit, students should be able to:
Use a graph to identify the x-intercepts as solutions of a quadratic equation.
Using a graphic calculator to make a table of values to approximate or solve a quadratic equation.
Use the Zero-Product Property and factoring to find the solutions of a quadratic equation.
Apply factoring to solve real-world problems.
Use the zeros of a quadratic equation to sketch a graph.
Write the factored form of a quadratic function from a graph.
Use the properties of exponents to rewrite radical expressions.
Multiply radical expressions.
Write a radical expression to model or represent a real-world problem.
Solve quadratic equations by finding square roots.
Determine reasonable solutions for real-world problems.
Solve a quadratic trinomial by completing the square to transform a quadratic equation into a perfect square trinomial.
Use completing the square to write a quadratic equation in vertex form.
Derive the quadratic formula by completing the square.
Solve quadratic equations in one variable by using the quadratic formula.
Use the discriminate to determine the number and type of solutions to a quadratic equation.
Use mathematical modeling to represent a problem situation and to propose a solution.
Test and verify the appropriateness of their math models.
Explain why the results from a mathematical model might not align exactly with the problem situation.
Describe a linear-quadratic system of equations.
Solve a linear-quadratic system of equations by graphing, estimation, or substitution.
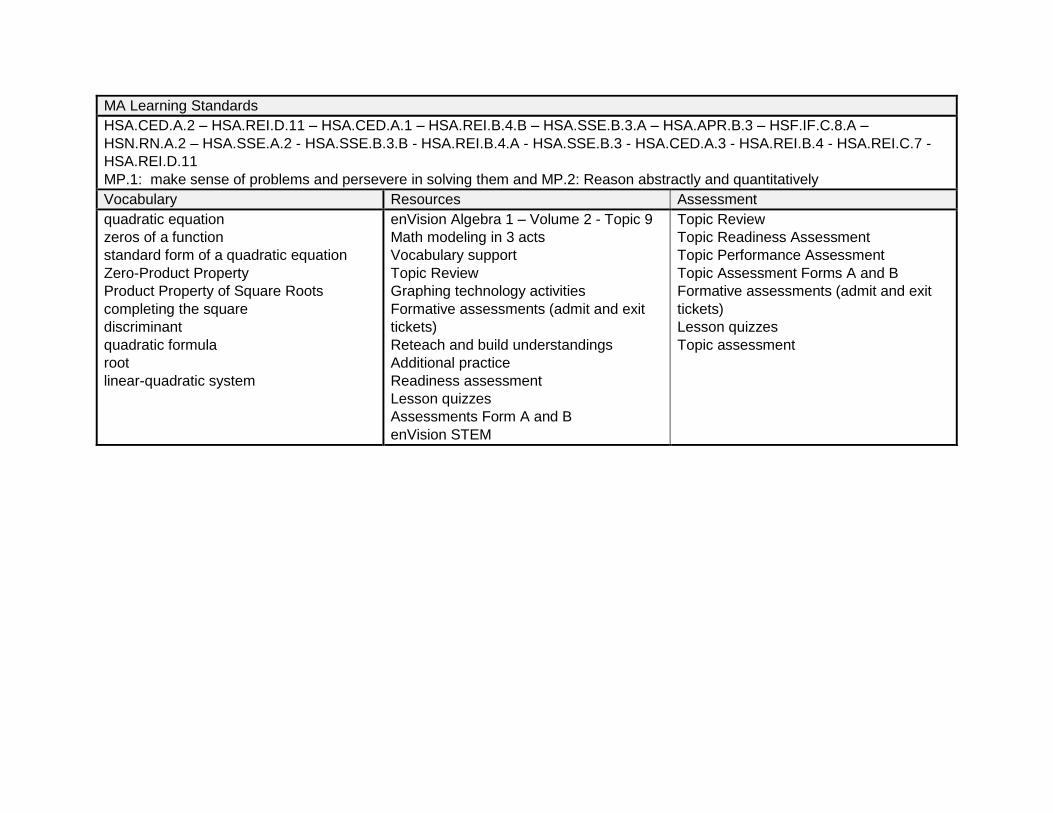
MA Learning Standards
HSA.CED.A.2 – HSA.REI.D.11 – HSA.CED.A.1 – HSA.REI.B.4.B – HSA.SSE.B.3.A – HSA.APR.B.3 – HSF.IF.C.8.A –
HSN.RN.A.2 – HSA.SSE.A.2 - HSA.SSE.B.3.B - HSA.REI.B.4.A - HSA.SSE.B.3 - HSA.CED.A.3 - HSA.REI.B.4 - HSA.REI.C.7 -
HSA.REI.D.11
MP.1: make sense of problems and persevere in solving them and MP.2: Reason abstractly and quantitatively
Vocabulary Resources Assessment
quadratic equation
zeros of a function
standard form of a quadratic equation
Zero-Product Property
Product Property of Square Roots
completing the square
discriminant
quadratic formula
root
linear-quadratic system
enVision Algebra 1 – Volume 2 - Topic 9
Math modeling in 3 acts
Vocabulary support
Topic Review
Graphing technology activities
Formative assessments (admit and exit
tickets)
Reteach and build understandings
Additional practice
Readiness assessment
Lesson quizzes
Assessments Form A and B
enVision STEM
Topic Review
Topic Readiness Assessment
Topic Performance Assessment
Topic Assessment Forms A and B
Formative assessments (admit and exit
tickets)
Lesson quizzes
Topic assessment
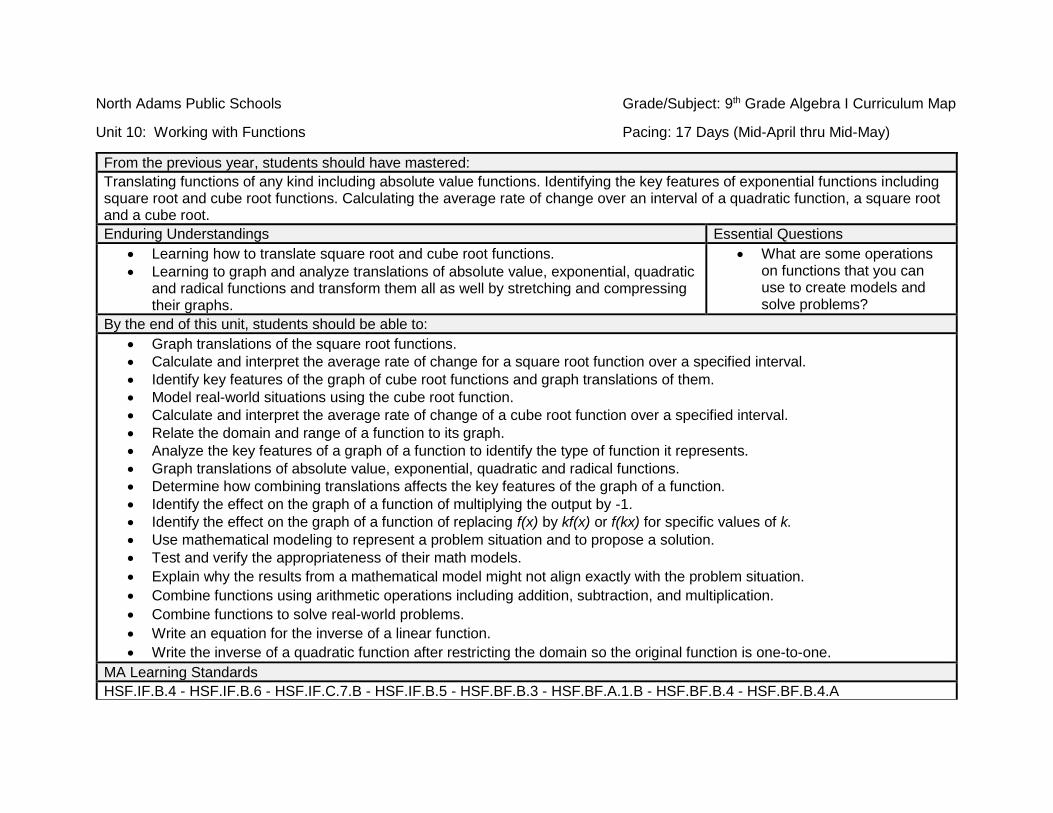
North Adams Public Schools Grade/Subject: 9th Grade Algebra I Curriculum Map
Unit 10: Working with Functions Pacing: 17 Days (Mid-April thru Mid-May)
From the previous year, students should have mastered:
Translating functions of any kind including absolute value functions. Identifying the key features of exponential functions including square root and cube root functions. Calculating the average rate of change over an interval of a quadratic function, a square root and a cube root.
Enduring Understandings Essential Questions
Learning how to translate square root and cube root functions.
Learning to graph and analyze translations of absolute value, exponential, quadratic and radical functions and transform them all as well by stretching and compressing their graphs.
What are some operations on functions that you can use to create models and solve problems?
By the end of this unit, students should be able to:
Graph translations of the square root functions.
Calculate and interpret the average rate of change for a square root function over a specified interval.
Identify key features of the graph of cube root functions and graph translations of them.
Model real-world situations using the cube root function.
Calculate and interpret the average rate of change of a cube root function over a specified interval.
Relate the domain and range of a function to its graph.
Analyze the key features of a graph of a function to identify the type of function it represents.
Graph translations of absolute value, exponential, quadratic and radical functions.
Determine how combining translations affects the key features of the graph of a function.
Identify the effect on the graph of a function of multiplying the output by -1.
Identify the effect on the graph of a function of replacing f(x) by kf(x) or f(kx) for specific values of k.
Use mathematical modeling to represent a problem situation and to propose a solution.
Test and verify the appropriateness of their math models.
Explain why the results from a mathematical model might not align exactly with the problem situation.
Combine functions using arithmetic operations including addition, subtraction, and multiplication.
Combine functions to solve real-world problems.
Write an equation for the inverse of a linear function.
Write the inverse of a quadratic function after restricting the domain so the original function is one-to-one.
MA Learning Standards
HSF.IF.B.4 - HSF.IF.B.6 - HSF.IF.C.7.B - HSF.IF.B.5 - HSF.BF.B.3 - HSF.BF.A.1.B - HSF.BF.B.4 - HSF.BF.B.4.A
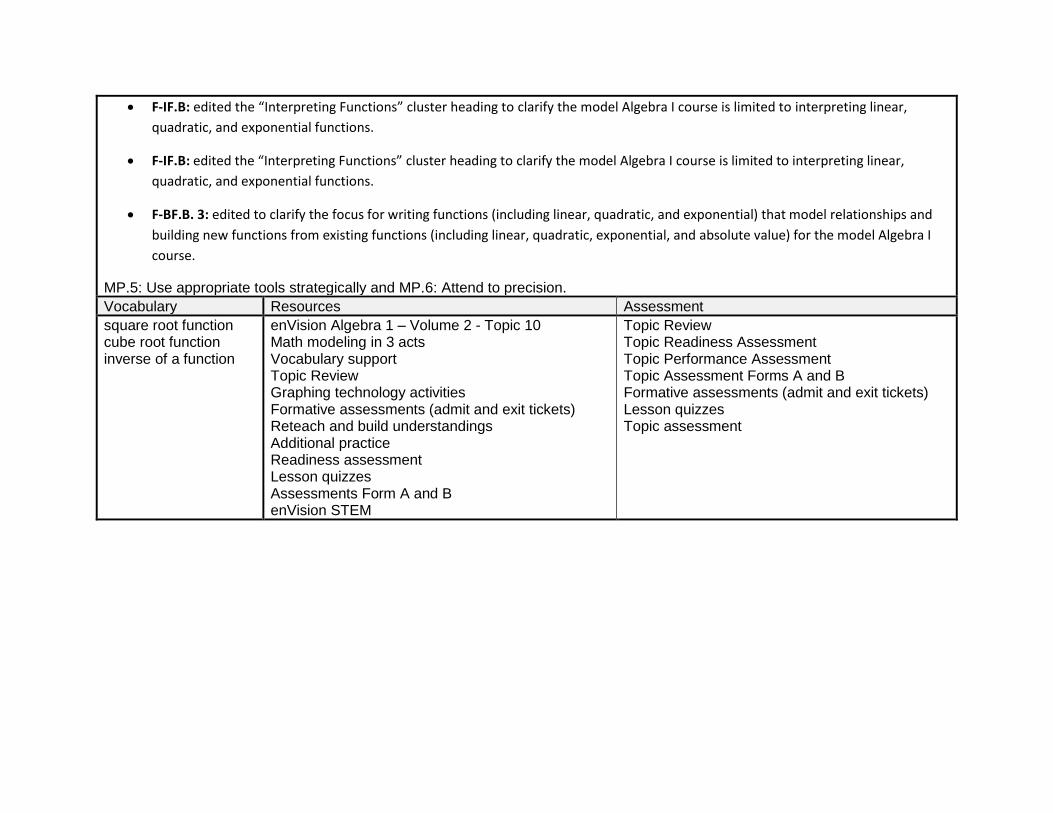
F-IF.B: edited the “Interpreting Functions” cluster heading to clarify the model Algebra I course is limited to interpreting linear,
quadratic, and exponential functions.
F-IF.B: edited the “Interpreting Functions” cluster heading to clarify the model Algebra I course is limited to interpreting linear,
quadratic, and exponential functions.
F-BF.B. 3: edited to clarify the focus for writing functions (including linear, quadratic, and exponential) that model relationships and
building new functions from existing functions (including linear, quadratic, exponential, and absolute value) for the model Algebra I
course.
MP.5: Use appropriate tools strategically and MP.6: Attend to precision.
Vocabulary Resources Assessment
square root function cube root function inverse of a function
enVision Algebra 1 – Volume 2 - Topic 10 Math modeling in 3 acts Vocabulary support Topic Review Graphing technology activities Formative assessments (admit and exit tickets) Reteach and build understandings Additional practice Readiness assessment Lesson quizzes Assessments Form A and B enVision STEM
Topic Review Topic Readiness Assessment Topic Performance Assessment Topic Assessment Forms A and B Formative assessments (admit and exit tickets) Lesson quizzes Topic assessment
North Adams Public Schools 9th Grade Algebra I Curriculum Map
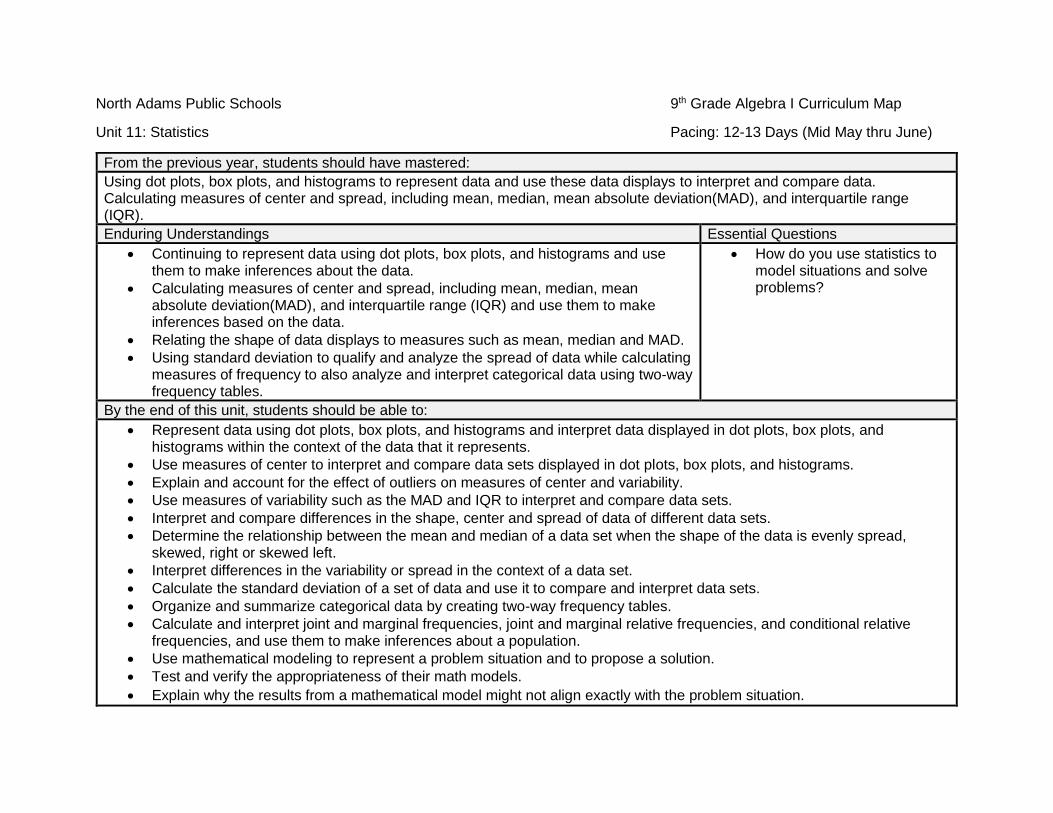
Unit 11: Statistics Pacing: 12-13 Days (Mid May thru June)
From the previous year, students should have mastered:
Using dot plots, box plots, and histograms to represent data and use these data displays to interpret and compare data. Calculating measures of center and spread, including mean, median, mean absolute deviation(MAD), and interquartile range (IQR).
Enduring Understandings Essential Questions
Continuing to represent data using dot plots, box plots, and histograms and use them to make inferences about the data.
Calculating measures of center and spread, including mean, median, mean absolute deviation(MAD), and interquartile range (IQR) and use them to make inferences based on the data.
Relating the shape of data displays to measures such as mean, median and MAD.
Using standard deviation to qualify and analyze the spread of data while calculating measures of frequency to also analyze and interpret categorical data using two-way frequency tables.
How do you use statistics to model situations and solve problems?
By the end of this unit, students should be able to:
Represent data using dot plots, box plots, and histograms and interpret data displayed in dot plots, box plots, and histograms within the context of the data that it represents.
Use measures of center to interpret and compare data sets displayed in dot plots, box plots, and histograms.
Explain and account for the effect of outliers on measures of center and variability.
Use measures of variability such as the MAD and IQR to interpret and compare data sets.
Interpret and compare differences in the shape, center and spread of data of different data sets.
Determine the relationship between the mean and median of a data set when the shape of the data is evenly spread, skewed, right or skewed left.
Interpret differences in the variability or spread in the context of a data set.
Calculate the standard deviation of a set of data and use it to compare and interpret data sets.
Organize and summarize categorical data by creating two-way frequency tables.
Calculate and interpret joint and marginal frequencies, joint and marginal relative frequencies, and conditional relative frequencies, and use them to make inferences about a population.
Use mathematical modeling to represent a problem situation and to propose a solution.
Test and verify the appropriateness of their math models.
Explain why the results from a mathematical model might not align exactly with the problem situation.
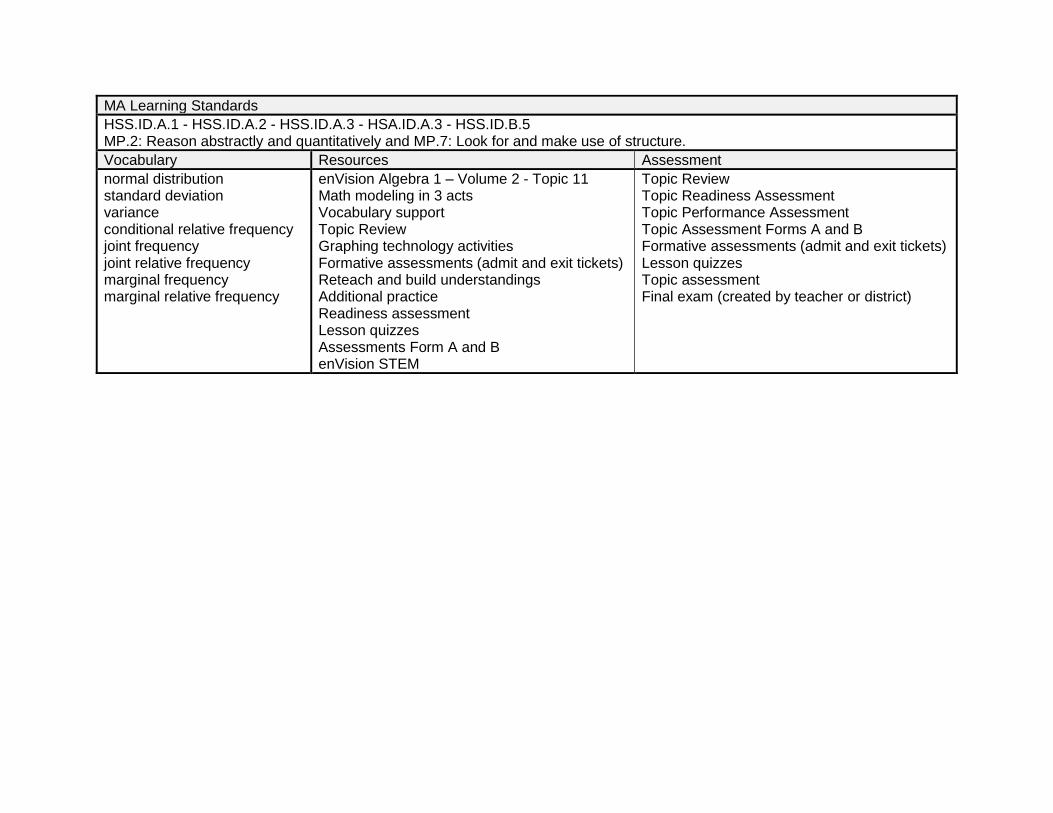
MA Learning Standards
HSS.ID.A.1 - HSS.ID.A.2 - HSS.ID.A.3 - HSA.ID.A.3 - HSS.ID.B.5 MP.2: Reason abstractly and quantitatively and MP.7: Look for and make use of structure.
Vocabulary Resources Assessment
normal distribution standard deviation variance conditional relative frequency joint frequency joint relative frequency marginal frequency marginal relative frequency
enVision Algebra 1 – Volume 2 - Topic 11 Math modeling in 3 acts Vocabulary support Topic Review Graphing technology activities Formative assessments (admit and exit tickets) Reteach and build understandings Additional practice Readiness assessment Lesson quizzes Assessments Form A and B enVision STEM
Topic Review Topic Readiness Assessment Topic Performance Assessment Topic Assessment Forms A and B Formative assessments (admit and exit tickets) Lesson quizzes Topic assessment Final exam (created by teacher or district)
![CHAPTER 5 THE ALLARD REGULARITY THEOREMmaths-proceedings.anu.edu.au/.../CMAProcVol3-Chapter5.pdfCHAPTER 5 THE ALLARD REGULARITY THEOREM Here we discuss Allard's ([AWl]) regularity](https://img.pdfslide.net/doc/110x75/5fb2cc5e95482068621741eb/chapter-5-the-allard-regularity-theoremmaths-chapter-5-the-allard-regularity-theorem.jpg)