Embed Size (px)
Citation preview

North America Credit Markets Update – 4Q 2020
Dec. 1, 2020
Nicole SerinoAssociate, Credit Markets [email protected]
Abhik DebnathLead Analyst, [email protected]
Sudeep KeshHead of Credit Markets [email protected]
Yucheng ZhengAssociate, North America Credit [email protected]
Evan GunterDirector, Ratings Performance [email protected]

Key Takeaways
– Financing conditions remain accommodative, with spreads easing down to pre-COVID levels, giving a strong push to issuance levels so far in 2020.
– There has been a defiant decline in COVID-19- related rating changes in recent months but downward pressure on ratings remains for sectors most vulnerable to COVID-19 shocks such as media and entertainment, retail, consumer services, automotive and transportation.
– Low borrowing costs have helped companies refinance/repay their near-term debt maturities, but in doing so, have increased leverage.
– The one-year transition for the period September 2019 – September 2020, from ‘CCC/CC’ rating category to ‘D’ has reached 48.1%, reaching an all-time high (last higher in 1981 at 29.3%).
– Both the continued high number of defaults as well as the effect of compressing spreads on entities that need liquidity has led to a drop in weakest links in recent months, but the tally remains well above pre-pandemic levels.
Spreads By Rating Categories
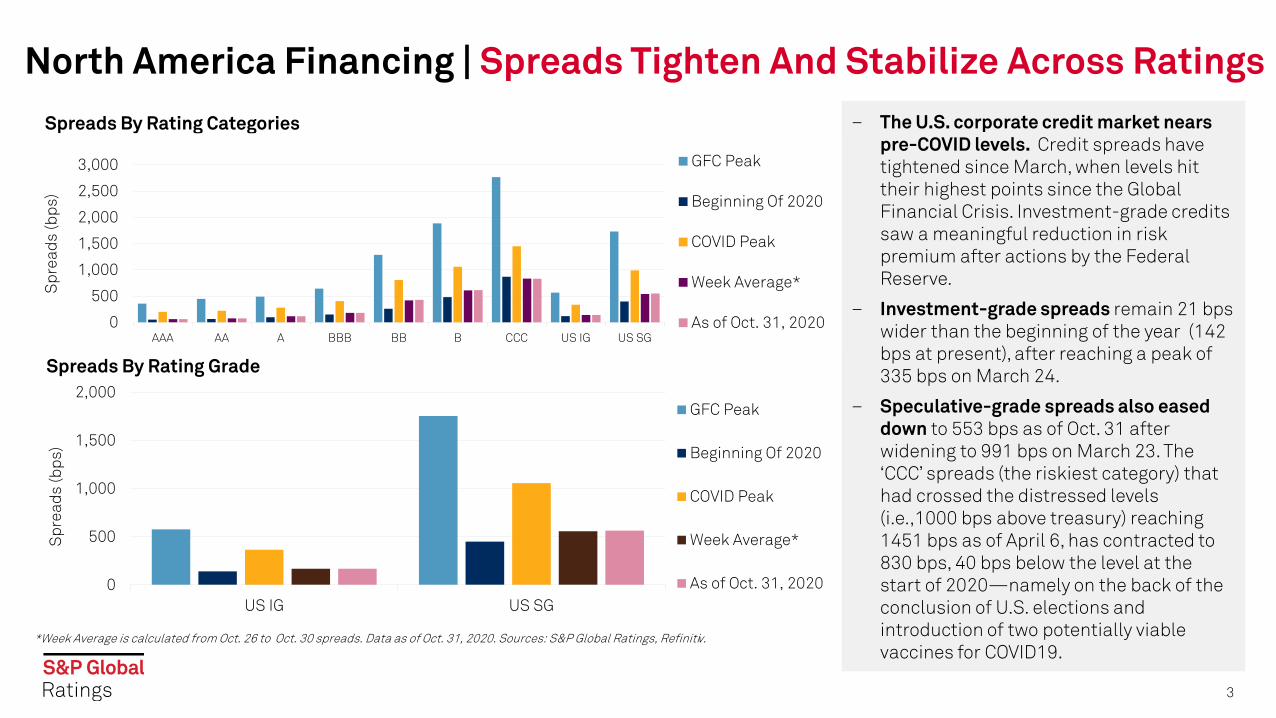
North America Financing | Spreads Tighten And Stabilize Across Ratings
3
Spreads By Rating Grade
*Week Average is calculated from Oct. 26 to Oct. 30 spreads. Data as of Oct. 31, 2020. Sources: S&P Global Ratings, Refinitiv.
– The U.S. corporate credit market nears pre-COVID levels. Credit spreads have tightened since March, when levels hit their highest points since the Global Financial Crisis. Investment-grade credits saw a meaningful reduction in risk premium after actions by the Federal Reserve.
– Investment-grade spreads remain 21 bps wider than the beginning of the year (142 bps at present), after reaching a peak of 335 bps on March 24.
– Speculative-grade spreads also eased down to 553 bps as of Oct. 31 after widening to 991 bps on March 23. The ‘CCC’ spreads (the riskiest category) that had crossed the distressed levels (i.e.,1000 bps above treasury) reaching 1451 bps as of April 6, has contracted to 830 bps, 40 bps below the level at the start of 2020—namely on the back of the conclusion of U.S. elections and introduction of two potentially viable vaccines for COVID19.
0
500
1,000
1,500
2,000
2,500
3,000
AAA AA A BBB BB B CCC US IG US SG
Spr
eads
(bps
)
GFC Peak
Beginning Of 2020
COVID Peak
Week Average*
As of Oct. 31, 2020
0
500
1,000
1,500
2,000
US IG US SG
Spr
eads
(bps
)
GFC Peak
Beginning Of 2020
COVID Peak
Week Average*
As of Oct. 31, 2020
Financial and Nonfinancial New Bond Issuance
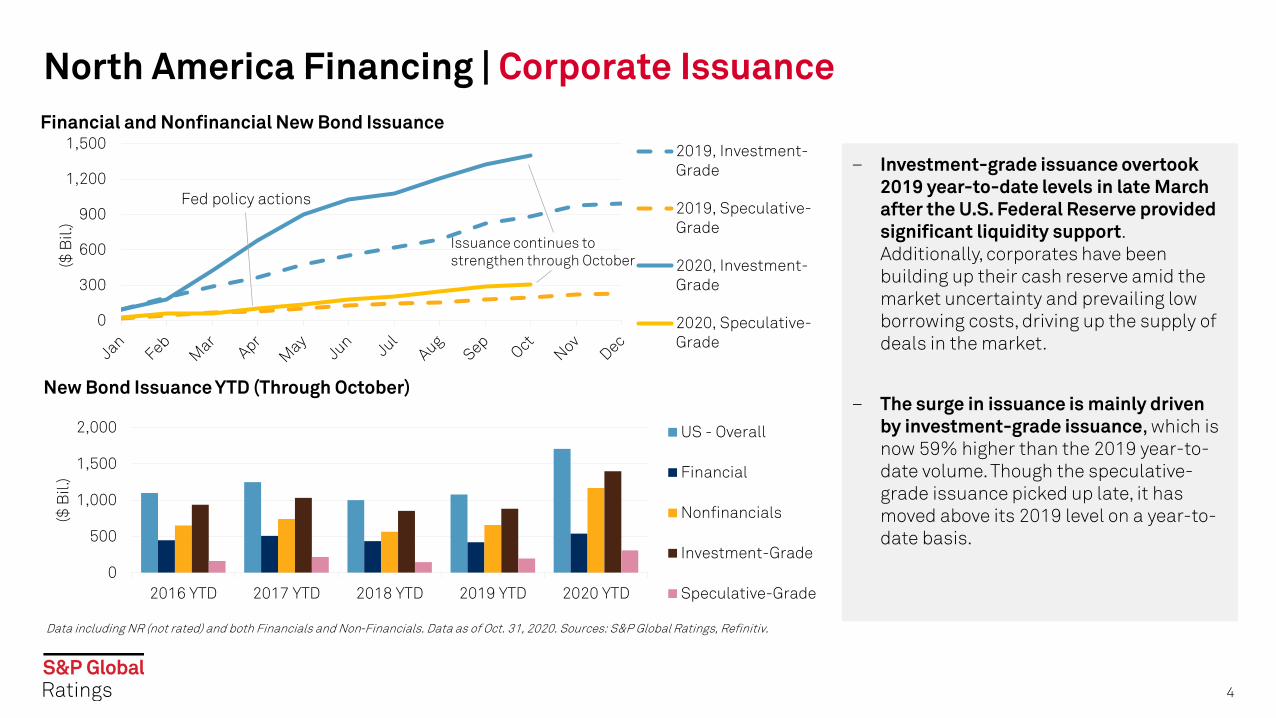
North America Financing | Corporate Issuance
4
New Bond Issuance YTD (Through October)
Data including NR (not rated) and both Financials and Non-Financials. Data as of Oct. 31, 2020. Sources: S&P Global Ratings, Refinitiv.
– Investment-grade issuance overtook 2019 year-to-date levels in late March after the U.S. Federal Reserve provided significant liquidity support. Additionally, corporates have been building up their cash reserve amid the market uncertainty and prevailing low borrowing costs, driving up the supply of deals in the market.
– The surge in issuance is mainly driven by investment-grade issuance, which is now 59% higher than the 2019 year-to-date volume. Though the speculative-grade issuance picked up late, it has moved above its 2019 level on a year-to-date basis.
0
300
600
900
1,200
1,500
($ B
il.)
2019, Investment-Grade
2019, Speculative-Grade
2020, Investment-Grade
2020, Speculative-Grade
Fed policy actions
Issuance continues to strengthen through October
0
500
1,000
1,500
2,000
2016 YTD 2017 YTD 2018 YTD 2019 YTD 2020 YTD
($ B
il.)
US - Overall
Financial
Nonfinancials
Investment-Grade
Speculative-Grade

2020 North American Corporate Issuance Remains Well Above Previous Years’ Levels
Corporate Issuance| North America
5
Data as of Oct. 31, 2020. Sources: S&P Global Ratings, Refinitiv. Note: Corporate data includes financial and nonfinancial companies and excludes sovereign
0
300
600
900
1,200
1,500
1,800
($ B
il.)
2009 2015 2016 2017 2018 2019 2020

Issue Date Maturity Date Issuer Country Sector Market Place S&P Issue-
Rating Security Description CCYIssuance (US $ Million)
11/14/2000 11/17/2020 Tyco International Ltd. Bermuda Capital Goods U.S. Private B+ Zero Cpn Cont Conv Con due '20 US 3003.68
12/9/2015 12/14/2020 Visa Inc. U.S. Financial Institution U.S. Public A+ 2.200% Global Notes due '20 US 2997.45
3/8/2018 12/16/2020 Goldman Sachs Group Inc. U.S. Financial Institution Euro Public BBB+ Mdm-Trm Fl Nts due '20 EUR 2462
10/29/2015 11/3/2020 Microsoft Corp. U.S. High Technology U.S. Public AAA 2.000% Global Notes due '20 US 2248.2
11/30/2015 12/7/2020 Wells Fargo & Co. U.S. Financial Institution U.S. Public A 2.550% Global MTNs due '20 US 2097.75
10/31/2013 11/6/2020 IBM Corp. U.S. High Technology U.S. Public AA- 1.875% Global Bonds due '20 EUR 2029.43
3/22/2017 12/27/2020 Goldman Sachs Group Inc. U.S. Financial Institution U.S. Public BBB+ 2.600% Sr Unsecurd Nts due '20US 1748.79
12/7/2015 12/14/2020 Toronto-Dominion Bank Canada Financial Institution U.S. Public AA- 2.500% Global MTNs due '20 US 1746.24
11/4/2010 11/15/2020 The Dow Chemical Co. U.S. CP&ES U.S. Public BBB- 4.250% Global Notes due '20 US 1745.19
12/10/2015 12/21/2020Schlumberger Holdings Corp.
U.S. Oil & Gas EURO/144A AA- 3.000% Senior Notes due '20 US 1596.38
10/23/2012 11/15/2020 Plains Expl & Prodn Co. U.S. Oil & Gas U.S. Public B 6.500% Senior Notes due '20 US 1500
11/14/2018 11/15/2020 Dowdupont Inc. U.S. CP&ES U.S. Public A- 3.766% Global Notes due '20 US 1500
11/30/2010 12/15/2020American International Group
U.S. Insurance U.S. Public A- 6.400% Global Notes due '20 US 1496.12
12/10/2010 12/15/2020 Novelis Inc. U.S. Metals EURO/144A B 8.750% Sr Unsecurd Nts due '20US 1400
9/2/2015 12/16/2020 Royal Bank Of Canada Canada Financial Institution EURO/144A NR 0.500% Gtd Sec Bonds due '20 EUR 1397.35
CP&ES – Chemicals, packaging and environmental services, Metals – Metals, mining and steel. Data as of Oct. 31, 2020 and excludes Sovereign. Pink means speculative-grade rating , blue means investment-grade rating, and grey means NR (not rated). Data is for foreign currency only without perpetuals. Sources: S&P Global Ratings, Refinitiv.
Maturing Debt | North America Financial And Nonfinancial Top 15 Deals Set To Mature Through October 2020
6

2020 Downgrades/Upgrades | Top 20 By Debt Amount (YTD)
7
Data as of Oct. 31 2020, exclude Sovereign, and includes only latest rating changes. Pink means speculative-grade rating and blue means investment-grade rating. Source: S&P Global Ratings. * Indicates Fallen Angel defined as an issuer downgraded from investment grade to speculative grade. # Indicates Rising Star defined as an issuer upgraded to investment grade from speculative grade.
Rating Date Issuer Country Sector Rating To Rating From Action Type Debt Amount (US $ Mil)
7/22/2020 Wells Fargo & Co. U.S. Financial Institutions BBB+ A- Downgrade 215064
3/25/2020 Ford Motor Co.* U.S. Automotive BB+ BBB- Downgrade 113862
5/8/2020 AbbVie Inc. U.S. Health Care BBB+ A- Downgrade 75619
6/19/2020 Oracle Corp. U.S. High Technology A A+ Downgrade 71249
4/23/2020 Walt Disney Company (The) U.S. Media & Entertainment A- A Downgrade 62702
3/25/2020 Occidental Petroleum Corp.* U.S. Oil & Gas BB+ BBB Downgrade 43913
4/3/2020 Raytheon Technologies Corp U.S. Aerospace & Defense A- BBB+ Upgrade 43294
4/15/2020 Finastra Ltd. Cayman Islands High Technology CCC+ B- Downgrade 36029
2/14/2020 Kraft Heinz Company (The)* U.S. Consumer Products BB+ BBB- Downgrade 31539
10/30/2020 Albertsons Companies, Inc. U.S. Retail/Restaurants BB- B+ Upgrade 30442
2/5/2020 Merck & Co. Inc. U.S. Health Care AA- AA Downgrade 27460
3/16/2020 Exxon Mobil Corp. U.S. Oil & Gas AA AA+ Downgrade 24000
10/27/2020 Gilead Sciences, Inc. U.S. Health Care BBB+ A Downgrade 22750
4/1/2020 Sprint Corp. U.S. Telecommunications BB B Upgrade 20780
8/21/2020 Mediacom Communications Corp.# U.S. Telecommunications BBB BB+ Upgrade 20700
4/29/2020 Boeing Co. U.S. Aerospace & Defense BBB- BBB Downgrade 20698
5/8/2020 United Parcel Service Inc. U.S. Transportation A- A Downgrade 20694
4/8/2020 Hilton Worldwide Holdings Inc. U.S. Media & Entertainment BB BB+ Downgrade 19244
3/26/2020 Clarios Global LP Canada Automotive B B+ Downgrade 19028
10/30/2020 FirstEnergy Corp.* U.S. Utilities BB+ BBB Downgrade 18373

Ratings Summary

Rating Actions | Top 20 Rating Changes To 'CCC’ Category From ‘B-’ By Debt Amount (YTD)
9
CW- CreditWatch. OL- Outlook. CP&ES – Chemicals, packaging and environmental services. Debt volume includes subsidiaries. Note: Pink means speculative-grade rating. Data as of Oct. 31, 2020; includes sovereigns. Source: S&P Global Ratings.
Rating Date Issuer Country Sector Rating To Rating FromDebt Amount (US $ Mil)
4/15/2020 Finastra Ltd. Cayman Islands High Technology CCC+ B- $ 36,029 3/24/2020 Bombardier Inc. Canada Aerospace & Defense CCC+ B- $ 9,287 4/17/2020 First Quantum Minerals Ltd Canada Metals, Mining & Steel CCC+ B- $ 6,000 7/21/2020 Clear Channel Outdoor Holdings Inc. U.S. Media & Entertainment CCC+ B- $ 5,835 4/27/2020 Hertz Global Holdings Inc. U.S. Transportation CCC- B- $ 5,050 5/14/2020 Nabors Industries Ltd Bermuda Oil & Gas CCC+ B- $ 3,725 4/10/2020 GTT Communications, Inc. U.S. Telecommunications CCC+ B- $ 3,415 4/8/2020 Advantage Solutions Inc. U.S. Consumer Products CCC+ B- $ 3,345 4/8/2020 Varsity Brands Holding Co Inc. U.S. Consumer Products CCC+ B- $ 2,800 3/27/2020 CDS Group Canada Media & Entertainment CCC- B- $ 2,745 9/4/2020 Cengage Learning Holdings II Inc. U.S. Media & Entertainment CCC+ B- $ 2,580 4/30/2020 SM Energy Company U.S. Oil & Gas CC B- $ 2,300 9/4/2020 McGraw-Hill Education, Inc. U.S. Media & Entertainment CCC+ B- $ 2,125 1/3/2020 Aveanna Healthcare LLC U.S. Health Care CCC+ B- $ 2,091 8/19/2020 Wesco Aircraft Holdings Inc. U.S. Aerospace & Defense CCC+ B- $ 2,075 4/23/2020 FXI Holdings, Inc. U.S. CP&ES CCC+ B- $ 2,075 4/8/2020 Helix Acquisition Holdings, Inc. U.S. Capital Goods CCC+ B- $ 2,055 4/17/2020 Life Time, Inc. U.S. Media & Entertainment CCC+ B- $ 1,984 6/12/2020 AVSC Holding Corp. U.S. Media & Entertainment CCC B- $ 1,980 4/23/2020 Syniverse Holdings, Inc. U.S. Telecommunications CCC+ B- $ 1,922

North America | COVID-19 / Oil-Related Rating Actions
10
– The number of rating actions, including downgrades, has continued to stabilize so far in the fourth quarter—rating actions in October are less than one tenth of the levels seen in April.
– The composition of rating actions has undergone changes since the beginning of the pandemic, as the majority of rating actions from June to October are downgrades, resolving the CreditWatch negative and negative outlook placements in the first and second quarters. The proportion of downgrades has widened to 69% of total rating actions in October from 54% in April.
Note: Data includes Sovereign. Data from Feb. 3, 2020 to Oct. 31, 2020. Source: S&P Global Ratings.
COVID-19 / Oil Price Rating Actions By Month
0
50
100
150
200
250
300
350
400
Downgrade Downgrade + CW Change OL Change CreditWatch Negative

COVID-19 / Oil Price Rating Actions By Sector
North America | The Energy Sector Continues To Lead Downgrades Since February
11
NBFI –Non-banking financial institutions. Note: Data includes Sovereign. Data from Feb. 3, 2020 to Oct. 31, 2020. Source: S&P Global Ratings.
0
20
40
60
80
100
120
Downgrades Outlook / CreditWatch Revisions

0 50 100 150 200 250 300
SovereignAerospace & Defense
AutomotiveBank
TransportationMetals, Mining & Steel
TelecommunicationsForest
Oil & GasNonBank Financial Institutions
Retail/RestaurantsCP&ES
Home/Real EstateInsurance
Capital GoodsHealth care
UtilitiesHigh Technology
Consumer ProductsMedia & Entertainment
AAA AA A BBB BB B CCC & Lower
About 73% Of The North American Nonfinancial Corporates Are Rated Speculative-grade, Compared With 32% Of Financial Services
North America | Rating Distribution
12
CP&ES – Chemicals, packaging and environmental services, Forest – Forest products and building materials. Data as of Oct. 31, 2020. Source: S&P Global Ratings.

Downgrade Potential | Outlook And CreditWatch Distribution By Sector
13
– In North America, downgrade potential remains high as COVID-19-induced economic downturn continues to weigh on business conditions.
– By sector, oil and gas still has the largest proportion of issuers with negative outlooks, while the auto, media, lodging, and transportation sectors have the largest percentage on CreditWatch negative.
– Globally, potential downgrades reached their all-time high in July at 1,365, above their previous record of 1028 during the 2009 subprime crisis. The tally has moderated in October to 1,270.
CP&ES – Chemicals, packaging and environmental services, Retail – Retail/restaurants, Forest – Forest products and building materials, Home/Re – Homebuilders / real estate companies. Data as of Oct. 31, 2020 and exclude sovereign. Media and entertainment sector includes leisure and lodging. Source: S&P Global Ratings.
0
10
20
30
40
50
60
70
Negative CreditWatch% Negative Outlook%

North America | Downgrade Potential By Sector
14
– Echoing the global trends, North American sectors including oil and gas, auto, media, and lodging face the highest downgrade risk in the present time.
These sectors have seen:
– Volatile market conditions affecting their business conditions (auto, oil and gas, lodging, as well as retail).
– Structural dislocation in the auto sector before the pandemic.
– Effects of travel bans and social distancing measures on the business prospects of issuers in leisure, tourism and travel sectors.
CP&ES – Chemicals, packaging and environmental services, Retail – Retail/restaurants, Forest – Forest products and building materials, Home/Re – Homebuilders / real estate companies. Data as of Oct. 31, 2020 and include sectors with more than five issuers only; excludes Sovereign. Source: S&P Global Ratings.
64%60%
59%51%51%
48%48%
45%44%
39%37%
36%32%
25%24%
17%17%17%
38%
20%
24%
31%
23%
20%
16%
26%
20%
22%
12%
21%
18%
21%
16%
10%
13%
9%
0% 20% 40% 60% 80%
Oil & Gas (59)Automotive (32)
Media/entert (159)Retail (59)
Capital goods (71)Aerospace/defense (24)
Transportation (31)Consumer products (112)
CP&ES (51)Metals/mining/steel (26)
Forest (28)Financial institutions (56)
Health care (50)Telecommunications (17)
Utilities (40)Home/RE (22)
High technology (32)Insurance (22)
Current Negative Bias (Oct. 31, 2020) 5-Year Averages

All Sectors In North America Are Experiencing Higher Than Average Downgrade Potential Except High Technology and Sovereigns
Corporate Issuance| Current Vs. Historic Downgrade Potential
15
Media and entertainment sector includes issuers in Leisure and lodging businesses. Long-term bias calculates average since Jan. 31, 1990. Data as of Oct. 31, 2020. Source: S&P Global Ratings.
Aerospace & Defense
Automotive
Capital Goods
Chemicals, Packaging & Environmental Services Consumer Products
Financial Institutions Forest Products & Building MaterialsHealth Care
High TechnologyHomebuilders/Real Estate Co. Insurance
Oil & Gas Media & Entertainment
Metals, Mining & Steel
Retail/Restaurants
Sovereign
Telecommunications
Transportation
Utilities
0%
10%
20%
30%
40%
50%
60%
70%
0% 5% 10% 15% 20% 25% 30%
Cu
rren
t n
egat
ive
bia
s (%
)
Long-term negative bias (%)

020406080100
02468
10
Potential Fallen Angels Count (Left) Debt Amount Affected ($ Bil.)
Rating Actions | Fallen Angels and Potential Fallen Angels
16
* Data as of Oct. 31, 2020. Source: S&P Global Ratings.
.
- The number of issuers downgraded from investment grade to speculative grade in North America has reached 24, the highest tally since 2016.
– The average number of potential fallen angels (issuers rated ‘BBB-’ by S&P Global Ratings with negative outlooks or ratings on CreditWatch with negative implications) is at historical high level, surpassing the 2009 levels. The financial sector continues to lead potential fallen angels in North America, reflecting exposure to their weakened clients.
– For more information, see “Credit Trends: Potential Fallen Angels Decrease As Immediate Downgrade Risks Recede,” published Oct. 30, 2020.
0
20
40
60
Fallen Angels Average Potential Fallen Angel

Rating Actions | Corporate Fallen Angels With Highest Debt
17
Data as of Oct. 31, 2020. Pink means speculative-grade rating and blue means investment-grade rating. Source: S&P Global Ratings.
Date Issuer To From Sector Country Rated debt amount ($ Mil.)
5/5/2005 General Motors Corp. BB BBB- Automotive U.S. $ 291,800 3/25/2020 Ford Motor Co. BB+ BBB- Automotive U.S. $ 113,862 9/15/2008 Lehman Brothers Holdings Inc. SD A Financial Institutions U.S. $ 79,455 3/25/2020 Occidental Petroleum Corp. BB+ BBB Oil & Gas U.S. $ 43,913 6/12/2009 CIT Group, Inc. BB- BBB- Financial Institutions U.S. $ 38,191 2/14/2020 Kraft Heinz Company (The) BB+ BBB- Consumer Products U.S. $ 31,539 5/10/2002 WorldCom Inc. BB BBB Telecommunications U.S. $ 30,000 9/15/2008 Washington Mutual, Inc. BB- BBB- Financial Institutions U.S. $ 29,803 9/7/2016 EMC Corp. BB+ A High Technology U.S. $ 27,125 5/2/2008 Countrywide Financial Corp. BB+ BBB+ Financial Institutions U.S. $ 26,360 2/12/2016 Freeport-McMoRan Inc. BB BBB- Metals, Mining & Steel U.S. $ 25,812 4/1/2011 CenturyLink, Inc. BB BBB- Telecommunications U.S. $ 21,644 12/2/2002 El Paso Corp. BB BBB Utility U.S. $ 21,171 2/7/1991 Chrysler Corp. BB+ BBB- Automotive U.S. $ 20,600 5/1/2008 Sprint Nextel Corp. BB BBB- Telecommunications U.S. $ 19,585 4/30/2014 Navient Inc. BB BBB- Financial Institutions U.S. $ 18,846 10/30/2020 FirstEnergy Corp. BB+ BBB Utility U.S. $ 18,373 1/7/2019 PG&E Corp. B BBB- Utility U.S. $ 17,525 8/3/2004 AT&T Corp. BB+ BBB Telecommunications U.S. $ 17,010 6/16/2014 Williams Companies Inc. (The) BB+ BBB Utility U.S. $ 16,821

Rating Actions | Weakest Links and Default Rates
18
– The number of North American weakest links (issuers rated ‘B-’ or lower by S&P Global Ratings with negative outlooks or ratings on CreditWatch with negative implications) has been decreasing since June but remains well above pre-crisis levels.
– The elevated number of weakest links since the onset of the pandemic has led to a spike in speculative-grade default rates.
– As weakest links typically default at a rate 8x that of speculative-grade companies, we expect the number of defaults to continue to rise as companies remain under significant revenue and earnings pressures triggered by the economic recession and global pandemic.
– For more information, see “Default Rates Continue To Climb As Weakest Links Remain Elevated” published Nov 23, 2020.
Default Rates as of October 2020. Weakest links and speculative-grade data as of Oct. 31, 2020. Sources: S&P Global Ratings and S&P Global Market Intelligence’s CreditPro®.
North America Weakest Links Narrowed Since June As Number Of Defaults Increase
0%
5%
10%
15%
20%
25%
30%
0
50
100
150
200
250
300
350
400
450
500
Weakest Links Counts (Left)
Weakest Links Share Of Speculative-Grade Population (Right)
North America 12-Month-Trailing Speculative -Grade Default Rate (Right)

Rating BBB- BB+ BB BB- B+ B B- CCC/C DBBB- 80.9 5.5 2.5 0.5 1.5 0.5 0.5 0.0 0.0BB+ 3.6 66.1 13.7 6.0 3.6 0.0 0.0 0.0 0.6BB 0.5 3.9 64.7 11.6 8.7 3.4 1.9 0.0 0.0BB- 0.0 0.4 6.2 56.4 15.4 7.5 2.6 2.6 2.6B+ 0.0 0.0 0.0 4.0 45.6 21.8 8.1 3.6 2.8B 0.0 0.0 0.0 0.4 3.8 51.2 23.6 9.3 2.1B- 0.0 0.0 0.0 0.2 0.2 2.5 55.8 25.3 5.8CCC/C 0.0 0.0 0.0 0.0 0.0 0.6 3.2 37.0 46.8
Rating BBB- BB+ BB BB- B+ B B- CCC/C DBBB- 85.6 5.0 1.5 0.5 1.5 0.5 0.0 0.0 0.0BB+ 1.8 69.9 14.1 5.5 2.5 0.0 0.0 0.0 0.6BB 0.5 3.3 66.4 11.4 8.1 3.3 1.9 0.0 0.0BB- 0.0 0.5 5.5 59.4 17.8 5.9 1.8 1.8 2.7B+ 0.0 0.0 0.0 4.0 47.4 22.9 8.7 4.0 2.0B 0.0 0.0 0.0 0.2 3.3 54.0 23.4 8.8 1.5B- 0.0 0.0 0.0 0.2 0.2 2.5 58.6 25.1 5.5CCC/C 0.0 0.0 0.0 0.0 0.0 0.6 1.9 42.8 45.9
January 2020 to October 2020 Transitions
Ratings Transitions | Transitions Rates
19
October 2019 to October 2020 Transitions
Pink covers the downward transitions. Transition Rates as of October 2020. Source: S&P Global Market Intelligence’s CreditPro®.
– One-year ratings transitions are higher than their historical averages and are highest at the lower-end of the ratings spectrum.
– This is particularly visible in one-year transition rates from ‘B’ to ‘B-’ , which are 23.6% compared to its long-term average of 9.3%.
One Year Transitions Since 1981
Rating BBB- BB+ BB BB- B+ B B- CCC/C DBBB- 73.5 4.6 2.4 0.9 0.5 0.2 0.2 0.2 0.2BB+ 10.6 66.5 6.5 3.0 1.3 0.7 0.3 0.3 0.3BB 2.2 8.7 66.0 8.3 2.8 1.1 0.5 0.5 0.7BB- 0.4 1.7 8.7 64.6 8.3 3.3 0.9 0.8 1.0B+ 0.1 0.3 1.3 7.1 64.6 9.0 2.6 1.9 2.1B 0.0 0.1 0.3 1.0 7.0 62.8 9.3 4.5 3.4B- 0.1 0.1 0.1 0.5 1.9 9.1 55.4 13.0 7.3CCC/C 0.1 0.0 0.1 0.4 1.1 3.2 7.1 44.0 29.7

U.S. Nonfinancials | $4 Trillion In Debt Matures Through 2025
20
– Maturities now peak in 2025, with $980 billion scheduled to mature.
– New issuance helped lift 2025 maturities by $235 billion since beginning of 2020.
– Nonfinancial companies refinanced, paid down, or otherwise reduced 15% of debt maturing in 2021-2022, since beginning of 2020.
Note: ’1/1/2020' shows FY 2020 debt maturity total. '7/1/2020' shows debt maturing in the 2nd half of the year. '10/1/2020' shows debt maturing in 4Q 2020. Includes bonds, loans, and revolving credit facilities that are rated by S&P Global Ratings on the respective report date. Foreign currencies are converted to USD on the respective report period date. Sources: S&P Global Ratings, Refinitiv.
U.S. Nonfinancial Corporate Maturity Wall
0
200
400
600
800
1000
1200
2020* 2021 2022 2023 2024 2025
(Bil
. $)
As of 1/1/2020 As of 7/1/2020 As of 10/1/2020

U.S. Nonfinancials | $1.8 Trillion In Speculative-Grade Corporate Debt Matures Through 2025
21
– Nonfinancial companies refinanced, paid down, or otherwise reduced 18% of speculative-grade debt maturing in 2021-2022, since beginning of 2020.
– Maturities now peak in 2025, with $536 billion scheduled to mature.
– New issuance helped lift 2025 maturities by 28% (or $117 billion).
Note: '1/1/2020' shows FY 2020 debt maturity total. '7/1/2020' shows debt maturing in the 2nd half of the year. '10/1/2020' shows debt maturing in 4Q 2020. Includes bonds, loans, and revolving credit facilities that are rated by S&P Global Ratings on the respective report date. Foreign currencies are converted to USD on the respective report period date. Sources: S&P Global Ratings, Refinitiv.
U.S. Speculative-Grade Nonfinancial Corporate Maturity Wall
0
100
200
300
400
500
600
2020* 2021 2022 2023 2024 2025
(Bil
. $)
As of 1/1/2020 As of 7/1/2020 As of 10/1/2020
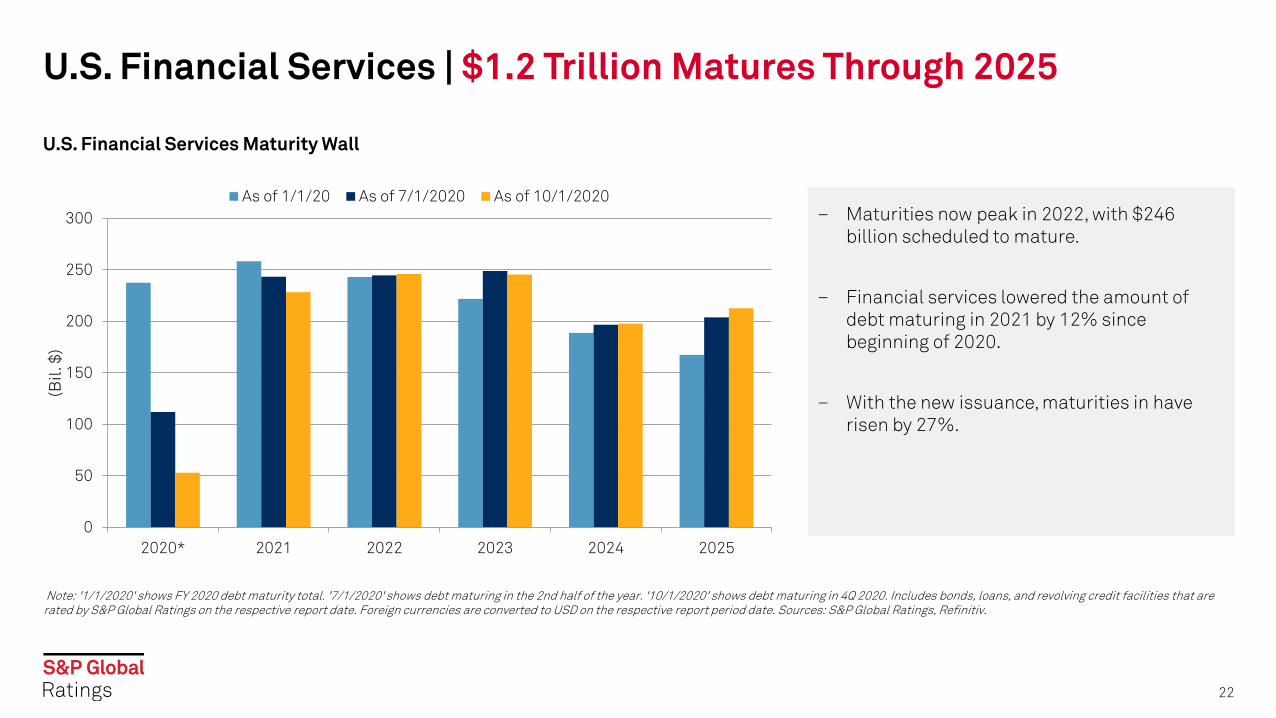
U.S. Financial Services | $1.2 Trillion Matures Through 2025
22
– Maturities now peak in 2022, with $246 billion scheduled to mature.
– Financial services lowered the amount of debt maturing in 2021 by 12% since beginning of 2020.
– With the new issuance, maturities in have risen by 27%.
Note: '1/1/2020' shows FY 2020 debt maturity total. '7/1/2020' shows debt maturing in the 2nd half of the year. '10/1/2020' shows debt maturing in 4Q 2020. Includes bonds, loans, and revolving credit facilities that are rated by S&P Global Ratings on the respective report date. Foreign currencies are converted to USD on the respective report period date. Sources: S&P Global Ratings, Refinitiv.
U.S. Financial Services Maturity Wall
0
50
100
150
200
250
300
2020* 2021 2022 2023 2024 2025
(Bil
. $)
As of 1/1/20 As of 7/1/2020 As of 10/1/2020

Related Research
COVID-19 And Shape Of Recovery | Latest Research
– Key Takeaways From Our Articles, Nov. 25, 2020
– COVID-19- And Oil Price-Related Public Rating Actions On Corporations, Sovereigns, International Public Finance, And Project Finance To Date, Nov. 24, 2020
– Default Rates Continue To Climb As Weakest Links Remain Elevated, Nov. 23, 2020
– The U.S. Speculative-Grade Corporate Default Rate Could Rise To 9% By September 2021, Nov. 23, 2020
– Oil And Gas Leads 2020 Global Corporate Defaults, Reflecting Sector Challenges, Nov. 20, 2020
– COVID-19 Impact: Key Takeaways From Our Articles, Nov. 18, 2020
– The U.S. Distress Ratio Eases As Downgrade Potential Remains Elevated, Nov. 12, 2020
– Risky Credits: 'CCC' Category Ratings Remain Nearly Double Pre-Pandemic Levels, Nov. 6, 2020
– Potential Fallen Angels Decrease As Immediate Downgrade Risks Recede, Oct. 30, 2020
– Global Financing Conditions: Bond Issuance Is Expected To Finish 2020 Up 16% And Decline In 2021, Oct. 26, 2020
24

25
Copyright © 2020 by Standard & Poor's Financial Services LLC. All rights reserved.
No content (including ratings, credit-related analyses and data, valuations, model, software or other application or output therefrom) or any part thereof (Content) may be modified, reverse engineered, reproduced or distributed in any form by any means, or stored in a database or retrieval system, without the prior written permission of Standard & Poor's Financial Services LLC or its affiliates (collectively, S&P). The Content shall not be used for any unlawful or unauthorized purposes. S&P and any third-party providers, as well as their directors, officers, shareholders, employees or agents (collectively S&P Parties) do not guarantee the accuracy, completeness, timeliness or availability of the Content. S&P Parties are not responsible for any errors or omissions (negligent or otherwise), regardless of the cause, for the results obtained from the use of the Content, or for the security or maintenance of any data input by the user. The Content is provided on an "as is" basis. S&P PARTIES DISCLAIM ANY AND ALL EXPRESS OR IMPLIED WARRANTIES, INCLUDING, BUT NOT LIMITED TO, ANY WARRANTIES OF MERCHANTABILITY OR FITNESS FOR A PARTICULAR PURPOSE OR USE, FREEDOM FROM BUGS, SOFTWARE ERRORS OR DEFECTS, THAT THE CONTENT'S FUNCTIONING WILL BE UNINTERRUPTED, OR THAT THE CONTENT WILL OPERATE WITH ANY SOFTWARE OR HARDWARE CONFIGURATION. In no event shall S&P Parties be liable to any party for any direct, indirect, incidental, exemplary, compensatory, punitive, special or consequential damages, costs, expenses, legal fees, or losses (including, without limitation, lost income or lost profits and opportunity costs or losses caused by negligence) in connection with any use of the Content even if advised of the possibility of such damages.
Credit-related and other analyses, including ratings, and statements in the Content are statements of opinion as of the date they are expressed and not statements of fact. S&P's opinions, analyses, and rating acknowledgment decisions (described below) are not recommendations to purchase, hold, or sell any securities or to make any investment decisions, and do not address the suitability of any security. S&P assumes no obligation to update the Content following publication in any form or format. The Content should not be relied on and is not a substitute for the skill, judgment and experience of the user, its management, employees, advisors and/or clients when making investment and other business decisions. S&P does not act as a fiduciary or an investment advisor except where registered as such. While S&P has obtained information from sources it believes to be reliable, S&P does not perform an audit and undertakes no duty of due diligence or independent verification of any information it receives. Rating-related publications may be published for a variety of reasons that are not necessarily dependent on action by rating committees, including, but not limited to, the publication of a periodic update on a credit rating and related analyses.
To the extent that regulatory authorities allow a rating agency to acknowledge in one jurisdiction a rating issued in another jurisdiction for certain regulatory purposes, S&P reserves the right to assign, withdraw, or suspend such acknowledgement at any time and in its sole discretion. S&P Parties disclaim any duty whatsoever arising out of the assignment, withdrawal, or suspension of an acknowledgment as well as any liability for any damage alleged to have been suffered on account thereof.
S&P keeps certain activities of its business units separate from each other in order to preserve the independence and objectivity of their respective activities. As a result, certain business units of S&P may have information that is not available to other S&P business units. S&P has established policies and procedures to maintain the confidentiality of certain nonpublic information received in connection with each analytical process.
S&P may receive compensation for its ratings and certain analyses, normally from issuers or underwriters of securities or from obligors. S&P reserves the right to disseminate its opinions and analyses. S&P's public ratings and analyses are made available on its Web sites, www.standardandpoors.com (free of charge), and www.spcapitaliq.com (subscription) and may be distributed through other means, including via S&P publications and third-party redistributors. Additional information about our ratings fees is available at www.standardandpoors.com/usratingsfees.
Australia: S&P Global Ratings Australia Pty Ltd holds Australian financial services license number 337565 under the Corporations Act 2001. S&P Global Ratings' credit ratings and related research are not intended for and must not be distributed to any person in Australia other than a wholesale client (as defined in Chapter 7 of the Corporations Act).
STANDARD & POOR'S, S&P and RATINGSDIRECT are registered trademarks of Standard & Poor's Financial Services LLC.
spglobal.com/ratings