Embed Size (px)
Citation preview

© 2014 Platts, McGraw Hill Financial. All rights reserved.
Natural Gas Market Update 2015 LDC/SCC ConferenceFredericksburg, VA
Chris Foster
October 7, 2015
Restrictions on Use: You may use the prices, indexes, assessments and other related information (collectively, “Data”) in this presentation only for your personal use. You may not publish, reproduce, distribute, retransmit, resell, create any derivative work from and/or otherwise provide access to Data or any portion thereof to any person (either within or outside your company including, but not limited to, via or as part of any internal electronic system or Internet site), firm or entity. Disclaimer: Platts, its affiliates and all of their third-party licensors disclaim any and all representations and warranties, express or implied, including, but not limited to, any warranties of merchantability or fitness for a particular purpose or use as to the data, or the results obtained by its use or as to the performance thereof. Limitation of Liability: In no event whatsoever shall Platts, its affiliates or their third-party licensors be liable for any indirect, special, incidental, punitive or consequential damages, including but not limited to loss of profits, trading losses, or lost time or goodwill, even if they have been advised of the possibility of such damages, whether in contract, tort, strict liability or otherwise. The Data is provided on an “as is” basis and your use of the Data is at your own risk. Copyright © 2013 by Platts, McGraw Hill Financial, Inc. All rights reserved. No portion of this publication may be photocopied, reproduced, retransmitted, put into a computer system or otherwise redistributed without prior authorization from Platts. Platts is a trademark of McGraw Hill Financial.
Today’s Agenda
US Supply Outlook Impact of Collapse in the Btu Gap Producer Efficiency Gains Financial Stress in the Oil Patch Canadian Imports
Northeast Focus Outlook for Northeast Production Pipeline Infrastructure Projects Demand Growth in VA/Southeast VA Pricing Outlook
US Demand Outlook Power Burn Industrial Mex Exports LNG Exports
Bullish or Bearish: Final Conclusions 2
US Supply Outlook

Tightening Btu Gap
$0.00
$5.00
$10.00
$15.00
$20.00
$25.00
$/M
MB
tu E
qu
ival
en
t
WTI Brent Mont Belvieu - NonTET HH CAPP

Tightening Value Gap: Why It Matters for Natural Gas Markets
Reduced Supply Growth- Diminishing NGL/crude value uplift with associated gas.- Fewer $ from US banks/international players to fund producer
drilling activities. Reduced Demand Growth
- US exports (refined products, condensate, NGLs, poly-olefins, LNG/Mexico).
- Lessened incentive for fuel oil conversions/GTLs/nat. gas vehicles, ships, rail.
- Reduced US manufacturing cost advantage and slower industrial growth.
- More difficult price environment for Canadian oil sands: supply (production) and demand (nat. gas/power/C5+).
5
Bullish or Bearish: Which one grows faster/further going forward?

0%
10%
20%
30%
40%
50%
60%
70%
80%
IRRs: July 2014 vs. Sep 2015July'14 Sep' 15
Lower Crude/NGL Prices: Lower Returns
Source: BENTEK
6
August 2015 Price Assumptions: Gas = 12 month forward average curve for each regional pricing point (range $1.78 - $2.93/Mcf)Oil = 12 month forward average WTI +/- differential (range $37.14 - $52.57/barrel)NGLs = weighted average $/barrel, 12-mo forward average Mt. Belvieu prices (range $16.97 - $22.30/barrel)

Producers Quickly Respond to $60/bbl
7
0
500
1000
1500
2000
2500
$0
$20
$40
$60
$80
$100
$120
# o
f ac
tive
rig
s
WTI
($
/bb
l)
Rig Activity v. US Oil Prices
WTI Active Rigs
Source: Bentek, Platts, RigData ,data as of August 7, 2015

Huge Well Backlog Aiding Growth
8Source: : Rig Data May15; OH DNR Feb’15; PA DEP Mar’15
NE PA Dry
Well Inventory
(1,425 wells)
~2,500 Wells in Inventory
19 Bcf/d of ‘Trapped’
Production
Wet Marcellus/Utica
Well Inventory
(1,059 wells)

Producers continue to focus on core acreage to grow production
65%
70%
75%
80%
85%
90%
0
50
100
150
200
250
300
350
400
450
% C
ore
# W
ells
Percentage of Wells Drilled in Core
EF Total Core Total % Core
Source: Bentek, Rig Data, data as of May 2015 Core Counties Include: De Witt, Dimmit, Gonzales, Karnes, La Salle, McMullen and Webb

Remaining rigs drill faster and produce more
Source: RigData, Bentek
0
5
10
15
20
25
30
35
40
45
50
0
100
200
300
400
500
600
700
Anadarko Bakken DJ Eagle Ford Permian
# o
f d
ays
to d
rill
IP R
ate
s (b
/d)
IP Rates and Drill Times by Basin (2010 v. 2014)
2010 IP 2014 IP 2010 Drill Time 2014 Drill Time
10

Producers realizing an average of 15% reduction in drilling costs
11
*Data sample comprised of 20+ Producers
$0.0
$1.0
$2.0
$3.0
$4.0
$5.0
$6.0
$7.0
$8.0
$9.0
$10.0
Williston Permian Marcellus Eagle Ford DJ
$ m
illio
n/w
ell
Average Well Cost by Basin (2014 v. 2015)
2014 Average Q1 2015 Average
Source: Bentek, producer presentations
↓15%↓19%
↓9% ↓16%
↓14%

154%
63%
22%/69%
Utica Dry$2.99
Haynesville$3.07
MarcellusDry
Source: BENTEK
Arkoma-Wood
$3.65
$2.11
Green River
$3.68
Dry Gas Play
Half-cycle Natural Gas Break-Evens
$4.66
$3.35Barnett
Fayetteville
$4.35 Piceance
$2.07
$4.22Montney
Duvernay
August 2015 Price Assumptions: Gas = 12 month forward average curve for each regional pricing point (range $1.78 - $2.93/Mcf)Oil = 12 month forward average WTI +/- differential (range $37.14 - $52.57/barrel)NGLs = weighted average $/barrel, 12-mo forward average Mt. Belvieu prices (range $16.97 - $22.30/barrel)
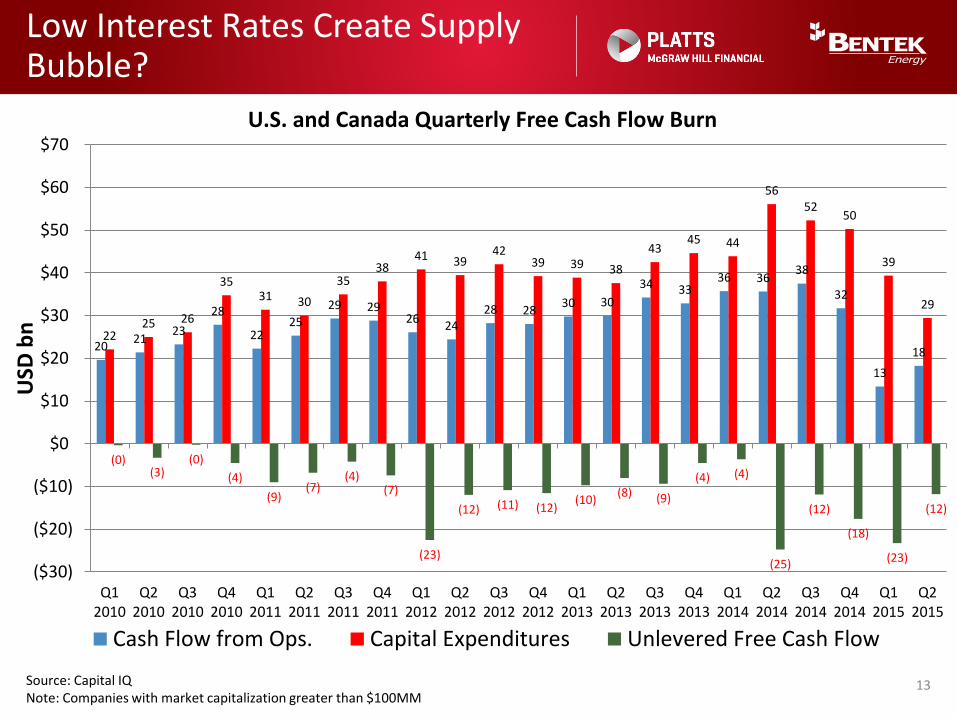
Low Interest Rates Create Supply Bubble?
13Source: Capital IQNote: Companies with market capitalization greater than $100MM
2021
23
28
2225
29 2926
2428 28
30 30
34 3336 36
38
32
13
1822
25 26
35 31 30
35 38
41 39 42
39 39 38
43 45 44
56 52
50
39
29
(0)(3)
(0)
(4)
(9)(7)
(4)(7)
(23)
(12) (11) (12)(10)
(8) (9)
(4) (4)
(25)
(12)
(18)
(23)
(12)
($30)
($20)
($10)
$0
$10
$20
$30
$40
$50
$60
$70
Q12010
Q22010
Q32010
Q42010
Q12011
Q22011
Q32011
Q42011
Q12012
Q22012
Q32012
Q42012
Q12013
Q22013
Q32013
Q42013
Q12014
Q22014
Q32014
Q42014
Q12015
Q22015
USD
bn
U.S. and Canada Quarterly Free Cash Flow Burn
Cash Flow from Ops. Capital Expenditures Unlevered Free Cash Flow
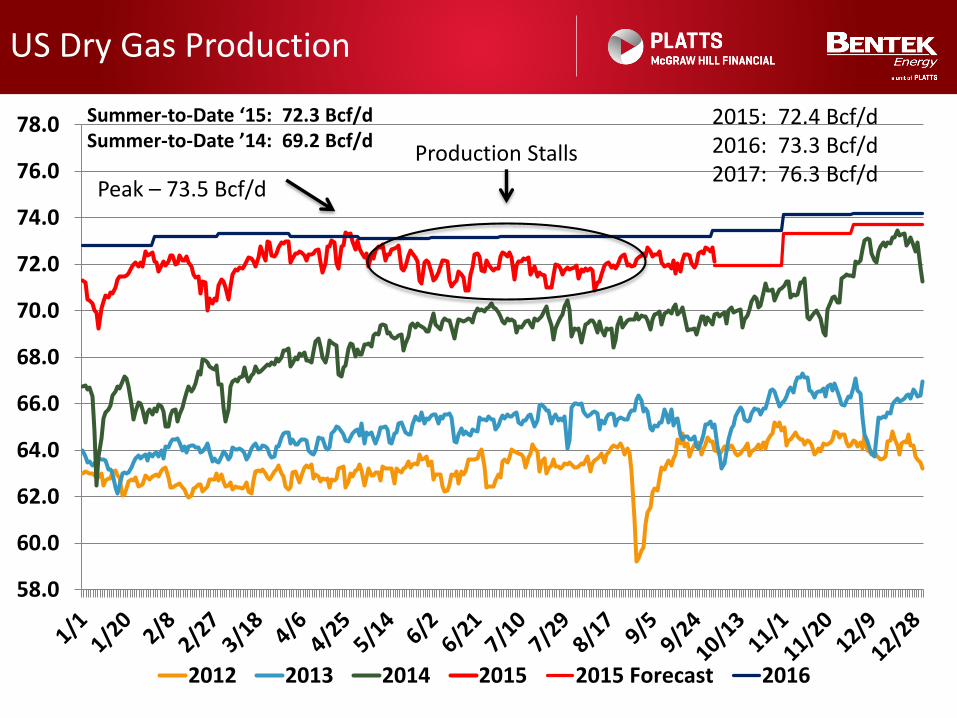
US Dry Gas Production
58.0
60.0
62.0
64.0
66.0
68.0
70.0
72.0
74.0
76.0
78.0
2012 2013 2014 2015 2015 Forecast 2016
Summer-to-Date ‘15: 72.3 Bcf/d Summer-to-Date ’14: 69.2 Bcf/d
Peak – 73.5 Bcf/d
Production Stalls
2015: 72.4 Bcf/d2016: 73.3 Bcf/d2017: 76.3 Bcf/d
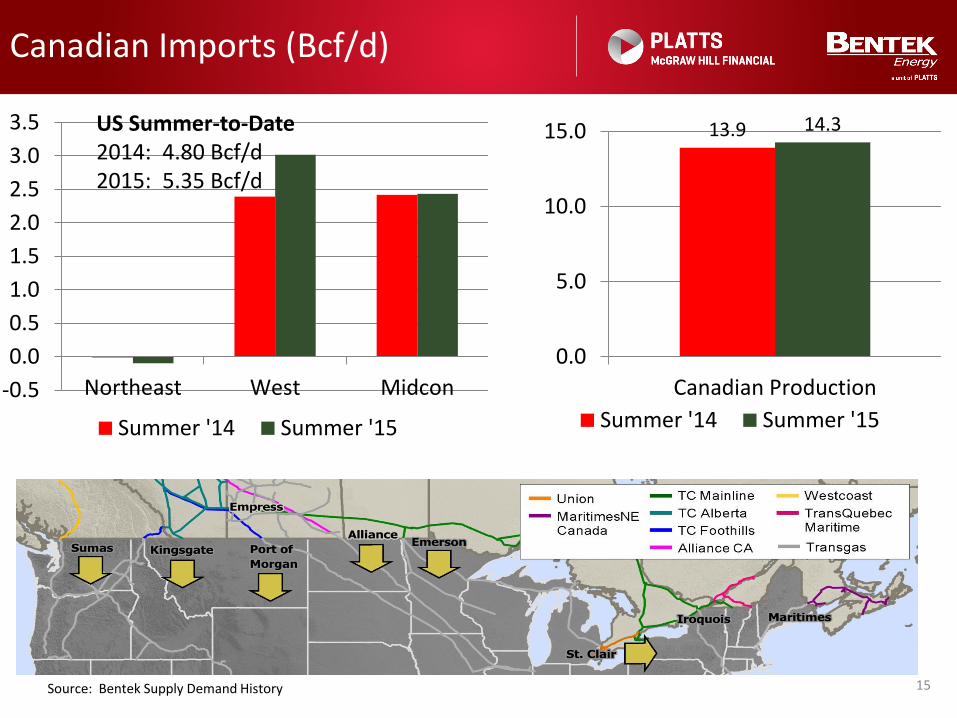
Canadian Imports (Bcf/d)
-0.5
0.0
0.5
1.0
1.5
2.0
2.5
3.0
3.5
Northeast West Midcon
Summer '14 Summer '15
15Source: Bentek Supply Demand History
US Summer-to-Date2014: 4.80 Bcf/d2015: 5.35 Bcf/d
13.9 14.3
0.0
5.0
10.0
15.0
Canadian Production
Summer '14 Summer '15

Northeast Focus

Northeast Production Driving US Production Growth
0%
5%
10%
15%
20%
25%
30%
0
10
20
30
40
50
60
70
80
Bcf
/d
Production
Rest of US Northeast % of Northeast
(5)
-
5
10
15
2011 2012 2013 2014 2015
Bcf
/d
Northeast Net flows
17

Northeast Stagnates Too
18
-
1
2
3
4
5
6
7
8
9
10
Bcf
/d
App OH NE PA Dry
NE PA Dry Production Peaks Last Winter at
9 Bcf/dNortheast producers
choke more than 1 Bcf/d of gas due to low prices
Another winter ramp in store??
Transco Leidy Line Maintenance

Northeast Capacity Additions
Project Name Est. ISD Capacity Status
REX Zone 3 East-to-West 7/1/2015 1,200 Operating
TETCO Uniontown to Gas City Expansion 8/1/2015 425 Operating
TETCO OPEN Ohio Pipeline Energy Network Project 9/15/2015 550 Partial Service
TCO East Side Expansion Project 9/1/2015 312 Under Construction
Transco Virginia Southside Expansion 9/1/2015 270 Operating
ANR Sulphur Springs Expansion (Formerly Glen Karn) 11/1/2015 133 Under Construction
NFG Northern Access 2015 Expansion 11/1/2015 140 Under Construction
NFG Tuscarora Lateral 11/1/2015 69 Under Construction
TGP Niagara Expansion 11/1/2015 158 Under Construction
TGP Broad Run Flexibility Project 11/1/2015 590 Under Construction
NFG Line N West Side Expansion and Modernization 11/1/2015 175 Under Construction
Transco Leidy Southeast Expansion 12/1/2015 525 Under Construction
Total 4,547 19
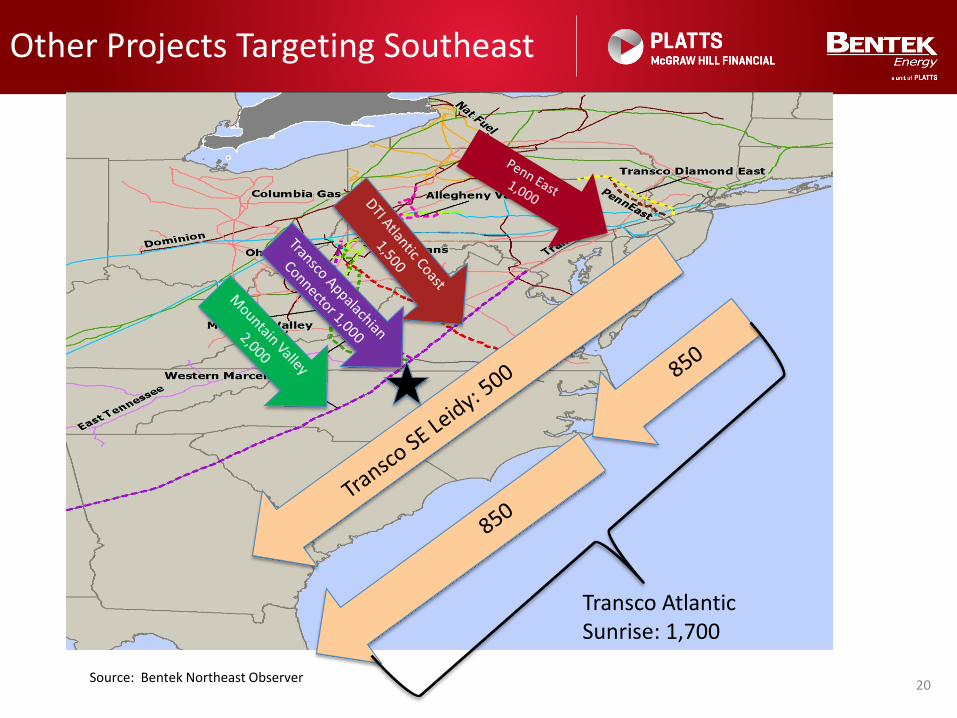
Other Projects Targeting Southeast
20Source: Bentek Northeast Observer
Transco Atlantic Sunrise: 1,700

Southeast Demand (Bcf/d)
21
0.0
0.5
1.0
1.5
2.0
2.5
3.0
3.5
4.0
2009 2010 2011 2012 2013 2014 2015
NC SC VA
Source: Bentek Pipeline Flow Data
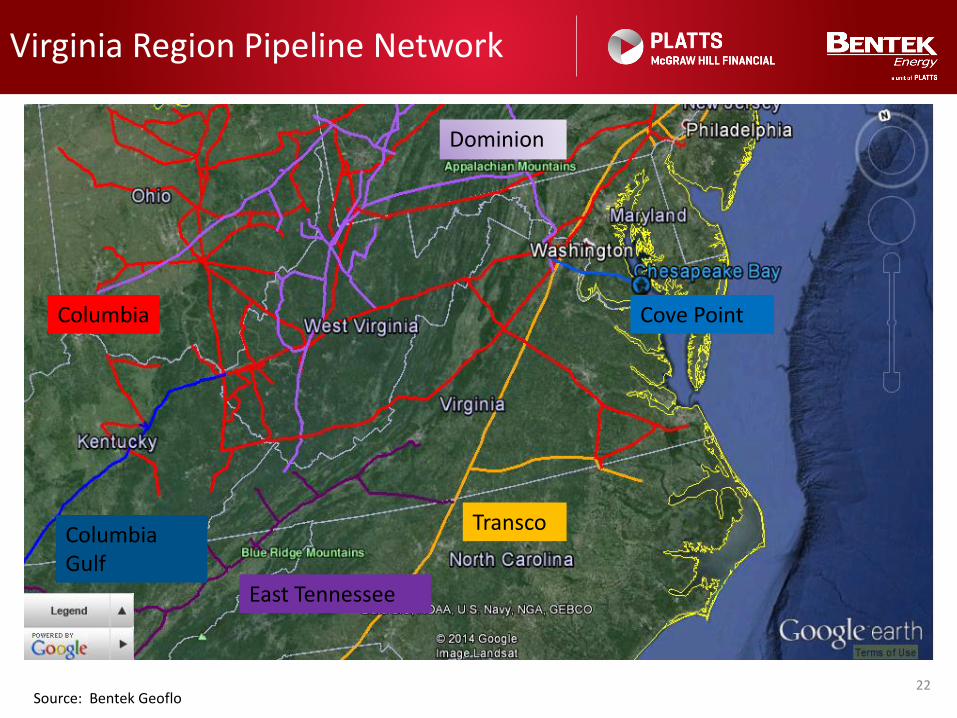
Virginia Region Pipeline Network
22Source: Bentek Geoflo
Transco
Cove Point
East Tennessee
Dominion
Columbia Gulf
Columbia

VA Deliveries by Pipeline (Bcf/d)
0.0
0.5
1.0
1.5
2.0
2.5
Columbia Gas Transco Dominion Cove Point East Tennessee
Bentek Pipeline Flow Data 23
Columbia Gas: 38%Transco: 28%Dominion: 26%Cove Point: 6%East Tenn: 2%

VA Demand Sector (Bcf/d)
0.0
0.5
1.0
1.5
2.0
2.5
LDCs/ResCom/Ind Power
Bentek Pipeline Flow Data 24
LDC/Ind/Rescom: 56%Power: 44%
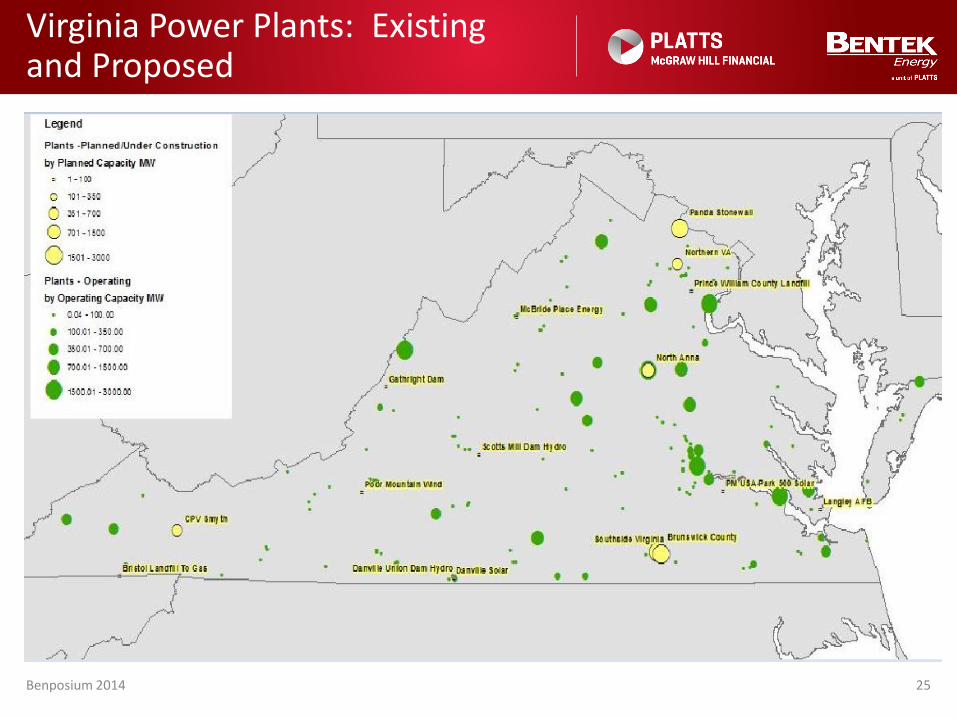
Virginia Power Plants: Existing and Proposed
25Benposium 2014
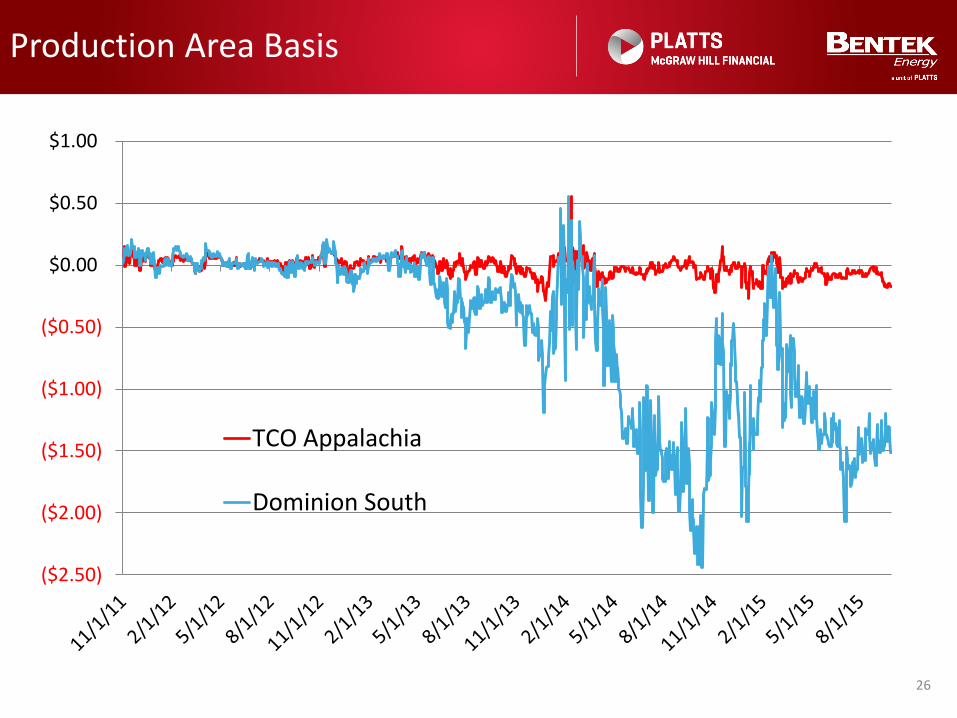
Production Area Basis
26
($2.50)
($2.00)
($1.50)
($1.00)
($0.50)
$0.00
$0.50
$1.00
TCO Appalachia
Dominion South

Production Area Basis
27Source: Bentek Northeast Observer
0
500
1,000
1,500
2,000
2,500
3,000
3,500
4,000
4,500
5,000
DTI Receipts
DTI Production DTI Interconnect
0
1,000
2,000
3,000
4,000
5,000
6,000TCO Receipts
TCO Production TCO Interconnect
Dom Receipts grow 2.5 Bcf/d since Jan. 2013
TCO Receipts Flat Since Jan 2013

Transco: Bad Deal for Consumers?
28
($2.50)
($2.00)
($1.50)
($1.00)
($0.50)
$0.00
$0.50
$1.00
$1.50
$2.00
$2.50
Transco Z5 Transco Zn6 NY Transco Zn6 xNY

NE PA Dry Production Constrained Until 2017-18
0
2
4
6
8
10
12
14
16
18
20
Bcf
/d
NE PA Dry Production vs Pipeline Capacity
NE PA and Central Dry Pipeline Takeaway Pipeline Takeaway High Case
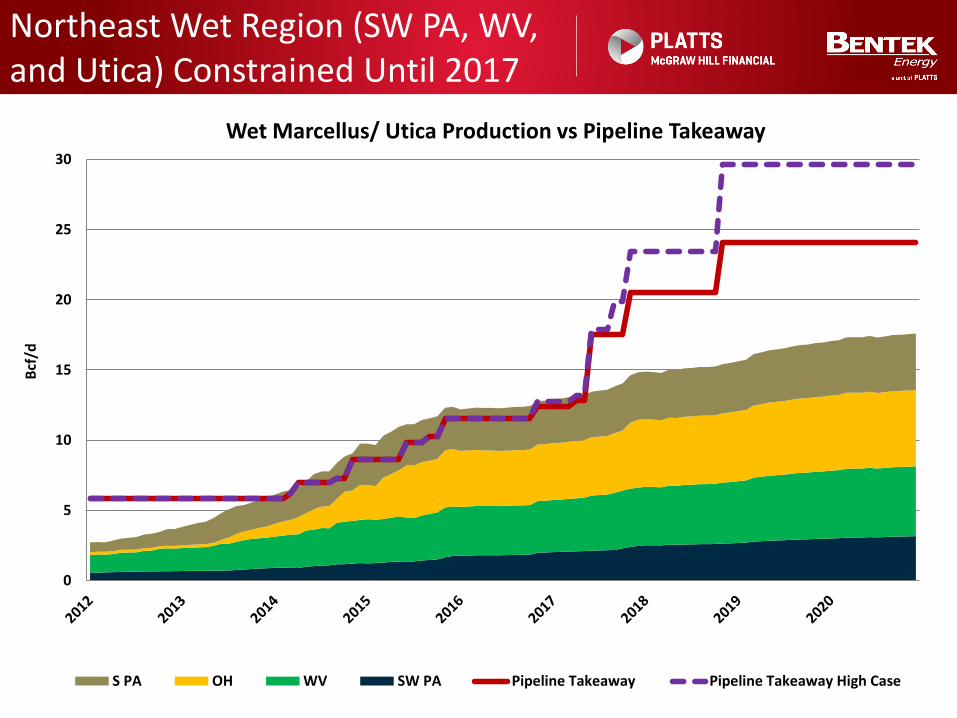
Northeast Wet Region (SW PA, WV, and Utica) Constrained Until 2017
0
5
10
15
20
25
30
Bcf
/d
Wet Marcellus/ Utica Production vs Pipeline Takeaway
S PA OH WV SW PA Pipeline Takeaway Pipeline Takeaway High Case

US Demand Outlook

Power Burn Testing 2012 Levels
10
15
20
25
30
35
40
45
1-Apr 1-May 1-Jun 1-Jul 1-Aug 1-Sep 1-Oct
Bcf
/d
5 yr range 2012 2014 2015 forecast
32
Power Burn Season to date:Versus 2014: +4.3 Bcf/d Versus 2012: -0.4 Bcf/d

Future Northeast Power Burn Driven by Changes in Generation Fleet
33
-
5,000
10,000
15,000
20,000
25,000
30,000
35,000
40,000
2008 2009 2010 2011 2012 2013 2014 2015 2016 2017
MW
Gas New Builds
Non-NE New Gas Plants NE New Gas Plants
Source: Bentek’s NA Power Plant Databank

Increased Efficiencies and Renewables Offsetting Growth in Power Burn
34Source: Bentek Supply Demand History

US Industrial Demand (Bcf/d)
0.0
1.0
2.0
3.0
4.0
5.0
6.0
Northeast Southeast Texas Midcon West
Summer '14 Summer '15
35Source: Bentek Supply Demand History
US Summer-to-Date2014: 19.42 Bcf/d2015: 19.07 Bcf/d
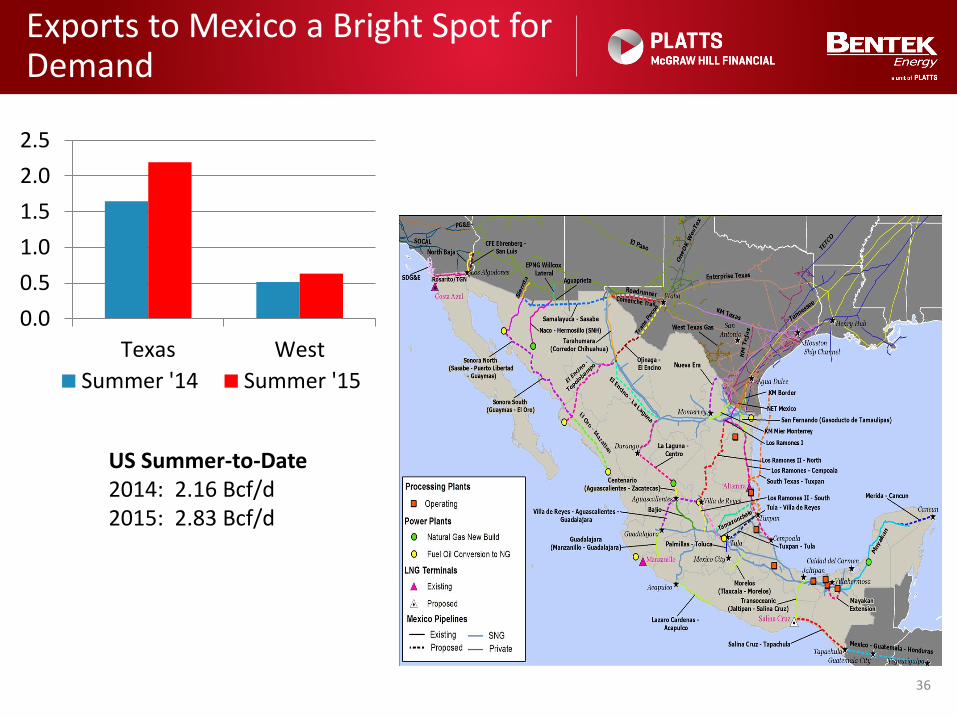
Exports to Mexico a Bright Spot for Demand
36
0.0
0.5
1.0
1.5
2.0
2.5
Texas West
Summer '14 Summer '15
US Summer-to-Date2014: 2.16 Bcf/d2015: 2.83 Bcf/d

47 Bcf/d of proposed capacity…
• BENTEK expects 10.1 Bcf/d to get built
LNG Exports could reach 6 Bcf/d in 2020
Benposium 201537
East Coast Export Terminals:Cove Point – 1 Bcf/d
Gulf Coast Liquefaction Capacity:Sabine Pass T1-5 3.5– Bcf/d
Freeport LNG T1-3 – 2.1 Bcf/d Cameron T1-3 – 2.1 Bcf/d
Corpus Christi T1-2 – 1.4 Bcf/d
Bentek LNG Exports Forecast
02468
1012
Bcf
/d
Base US LNG Capacity
Sabine Pass T12 Sabine Pass T2 Sabine Pass T3
Sabine Pass T4 Sabine Pass T5 Freeport LNG T1
Freeport LNG T2 Freeport LNG T3 Cameron LNG T1
Cameron LNG T2 Cameron LNG T3 Cove Point T1
Corpus Christi T1 Corpus Christi T2
Source: Bentek

Global LNG Prices Also Signal Lack Of Demand
$0
$5
$10
$15
$20
$25
$M
MB
tu
Henry Hub JKM NBP
38
FUKUSHIMA

Storage Outlook
39Source: Bentek CellCAST
0
500
1000
1500
2000
2500
3000
3500
4000
4500
Bcf
US Natural Gas Inventories
Five Year Range US Inventory History US Inventory Forecast

Markets eliminate inefficiencies/move to the mean.
Economic growth moves to more normal levels.
Environmental issues continue to plague coal and
nuclear making natural gas the clear fuel of choice.
US best place to invest in incremental supplies and
is the marginal cost supplier.
Prices move to variable cost spreads Natural gas moves to variable transport differentials
LNG/crude/LPG prices reflect variable shipping rates
Conclusion: Btu Gap moves to reflect variable spreads
The Btu Gap: Where Does It Go From Here?
40

Conclusion: Bearish Short Term/Bullish Long Term
• US Demand Growth Accelerating. Gains Critical Mass in 2017 – Power Burn demand will increase due to
economics/environmental concerns, but conservation, efficiencies and renewables offset.
– Industrial renaissance tempered, but material.– Mexican exports on the rise.– LNG exports expectations reduced, but still significant.
• Increased Production is Needed to Meet Growing Demand– Higher prices needed to allow producers to earn a return.– Higher prices needed for banks to loan money.– Producer efficiency gains will continue, but movement away
from core areas and higher service company costs will offset these gains to some degree.
• Northeast will continue to fuel production growth and pipeline expansions. Northeast basis strengthens as capacity constraints alleviated. Weaker basis values move southward.
Benposium 2014 41

Thank You!
BENTEK is an energy market analytics company focused on the natural gas, oil, and liquids markets and related energy sectors.
Chris [email protected]
Contract Chris at 212/904-6915 or contact any Bentek Analyst at 303/988-1320
DISCLAIMER. THIS REPORT IS FURNISHED ON AN “AS IS”BASIS. BENTEK DOES NOT WARRANT THE ACCURACY OR CORRECTNESS OF THE REPORT OR THE INFORMATION CONTAINED THEREIN. BENTEK MAKES NO WARRANTY, EXPRESS OR IMPLIED, AS TO THE USE OF ANY INFORMATION CONTAINED IN THIS REPORT IN CONNECTION WITH TRADING OF COMMODITIES, EQUITIES, FUTURES, OPTIONS OR ANY OTHER USE. BENTEK MAKES NO EXPRESS OR IMPLIED WARRANTIES AND EXPRESSLY DISCLAIMS ALL WARRANTIES OF MERCHANT- ABILITY OR FITNESS FOR A PARTICULAR PURPOSE.RELEASE AND LIMITATION OF LIABILITY: IN NO EVENT SHALL BENTEK BE LIABLE FOR ANY DIRECT, INDIRECT, SPECIAL, INCIDENTAL, OR CONSEQUENTIAL DAMAGES (INCLUDING LOST PROFIT) ARISING OUT OF OR RELATED TO THE ACCURACY OR CORRECTNESS OF THIS REPORT OR THE INFORMATION CONTAINED THEREIN,WHETHER BASED ON WARRANTY, CONTRACT, TORT OR ANY OTHER LEGAL THEORY.