Embed Size (px)
Citation preview
North American Production: Upheaval in Manufacturing and the Landscape by 2015
Tracy HandlerNorth American Production Analyst
Copyright © 2009 IHS Global Insight. All Rights Reserved. AUTOMOTIVE CONFERENCE
Emerging from the Crisis
• What does the North American production landscape look like in 2015?
• Where are the gains and losses?
• Will capacity become a constraint in North America by 2015?
• What segments see the most growth?
• Which manufacturers are prepared to weather the storm?
Copyright © 2009 IHS Global Insight. All Rights Reserved. AUTOMOTIVE CONFERENCE
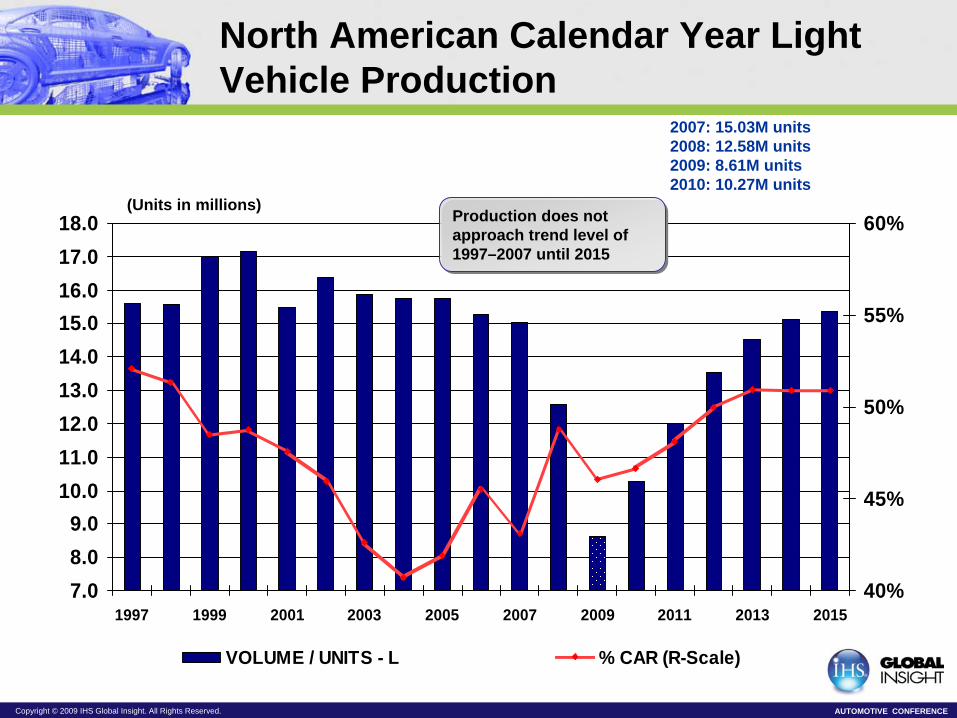
North American Calendar Year Light Vehicle Production
7.08.09.0
10.011.012.013.014.015.016.017.018.0
1997 1999 2001 2003 2005 2007 2009 2011 2013 201540%
45%
50%
55%
60%
VOLUME / UNITS - L % CAR (R-Scale)
2007: 15.03M units2008: 12.58M units2009: 8.61M units2010: 10.27M units
(Units in millions)Production does not approach trend level of 1997–2007 until 2015
Production does not approach trend level of 1997–2007 until 2015
Copyright © 2009 IHS Global Insight. All Rights Reserved. AUTOMOTIVE CONFERENCE
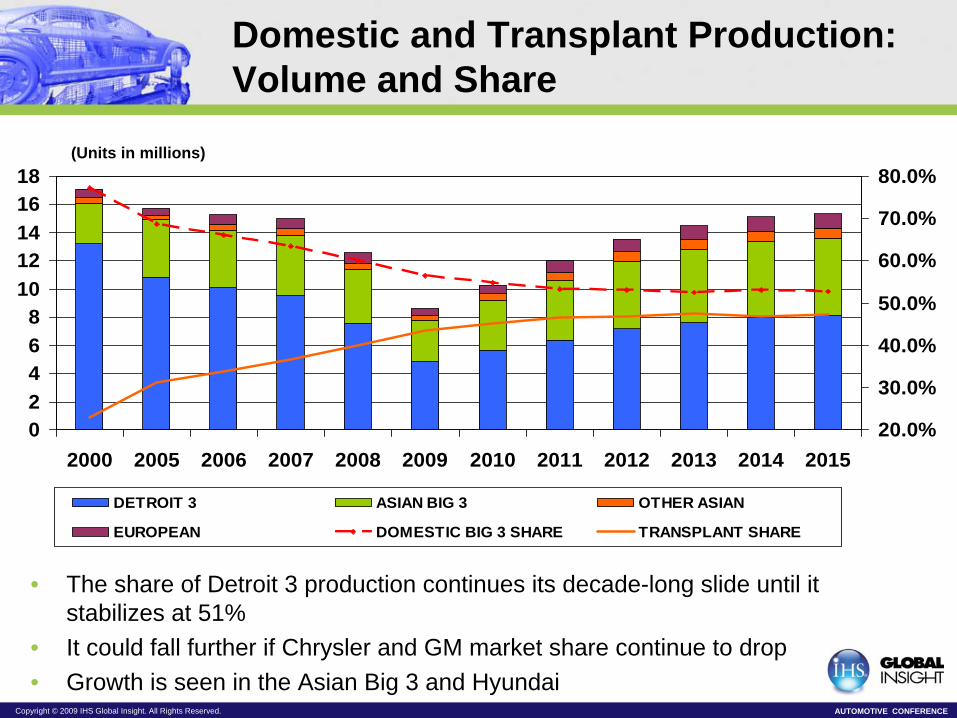
Domestic and Transplant Production: Volume and Share
02468
1012141618
2000 2005 2006 2007 2008 2009 2010 2011 2012 2013 2014 201520.0%
30.0%
40.0%
50.0%
60.0%
70.0%
80.0%
DETROIT 3 ASIAN BIG 3 OTHER ASIAN
EUROPEAN DOMESTIC BIG 3 SHARE TRANSPLANT SHARE
(Units in millions)
• The share of Detroit 3 production continues its decade-long slide until it stabilizes at 51%
• It could fall further if Chrysler and GM market share continue to drop• Growth is seen in the Asian Big 3 and Hyundai
Copyright © 2009 IHS Global Insight. All Rights Reserved. AUTOMOTIVE CONFERENCE
Where does North American Production Go from Here?
• Production in 2009 is half what it was in 2000
• Growth will be slow:– Will level off by 2015
– Fifteen million units will be a really good year
– As break-even points have decreased, profit will be seen sooner
• The split between cars and trucks will stabilize at 51% cars as the manufacturers meet fuel economy regulations
Copyright © 2009 IHS Global Insight. All Rights Reserved. AUTOMOTIVE CONFERENCE
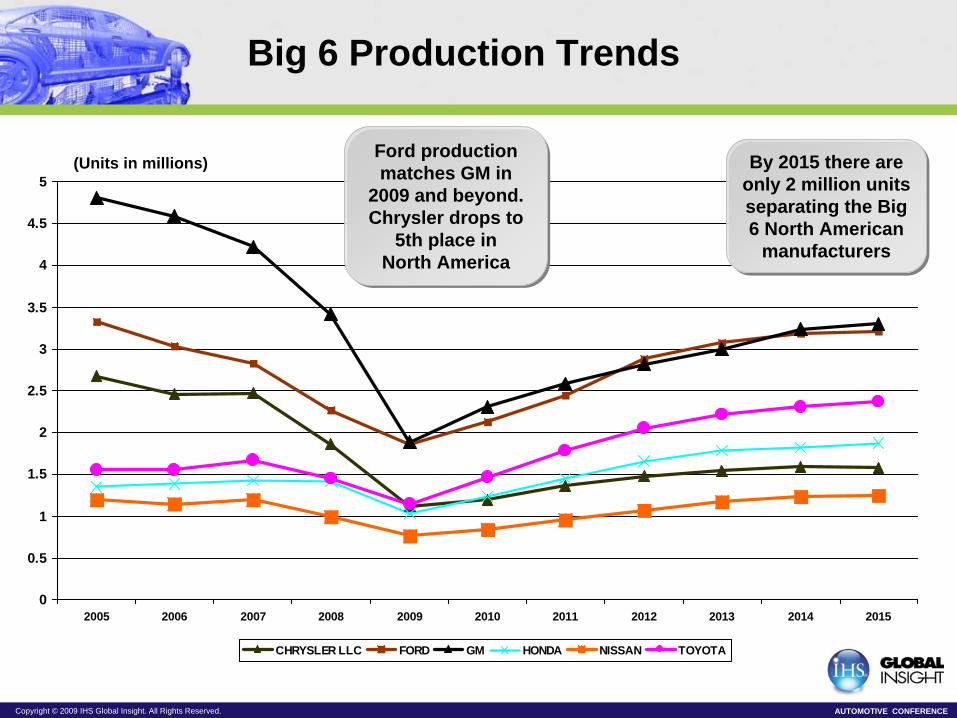
Big 6 Production Trends
0
0.5
1
1.5
2
2.5
3
3.5
4
4.5
5
2005 2006 2007 2008 2009 2010 2011 2012 2013 2014 2015
CHRYSLER LLC FORD GM HONDA NISSAN TOYOTA
(Units in millions) Ford production matches GM in
2009 and beyond. Chrysler drops to
5th place in North America
Ford production matches GM in
2009 and beyond.Chrysler drops to
5th place in North America
By 2015 there are only 2 million units separating the Big 6 North American
manufacturers
By 2015 there are only 2 million units separating the Big 6 North American
manufacturers
Copyright © 2009 IHS Global Insight. All Rights Reserved. AUTOMOTIVE CONFERENCE
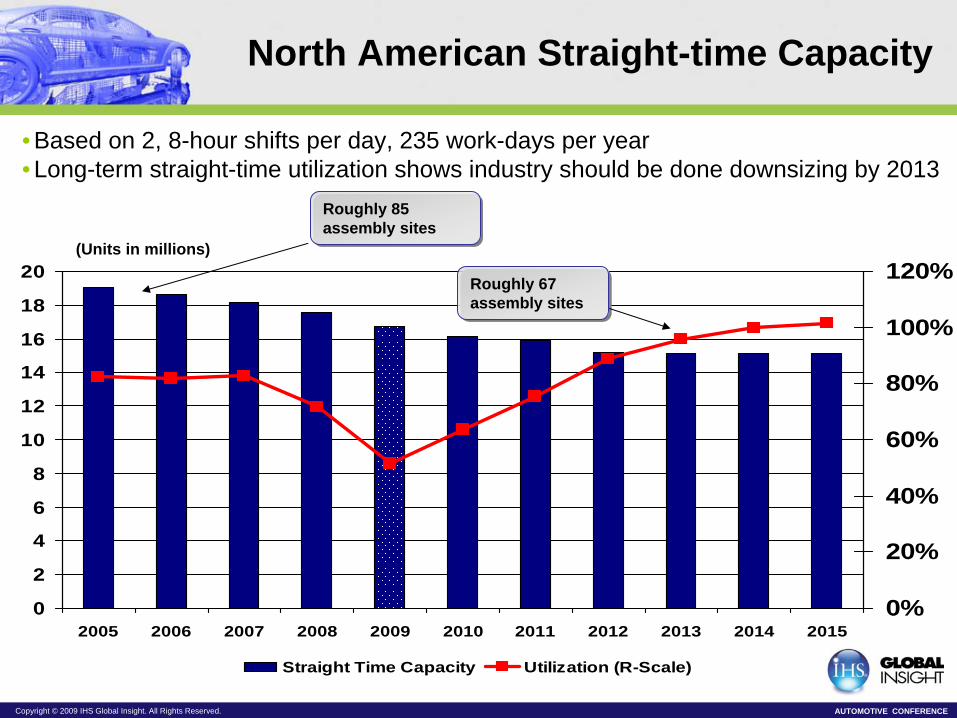
(Units in millions)
North American Straight-time Capacity
0
2
4
6
8
10
12
14
16
18
20
2005 2006 2007 2008 2009 2010 2011 2012 2013 2014 20150%
20%
40%
60%
80%
100%
120%
Straight Time Capacity Utilization (R-Scale)
Roughly 85 assembly sites Roughly 85 assembly sites
Roughly 67 assembly sites Roughly 67 assembly sites
• Based on 2, 8-hour shifts per day, 235 work-days per year• Long-term straight-time utilization shows industry should be done downsizing by 2013
Copyright © 2009 IHS Global Insight. All Rights Reserved. AUTOMOTIVE CONFERENCE
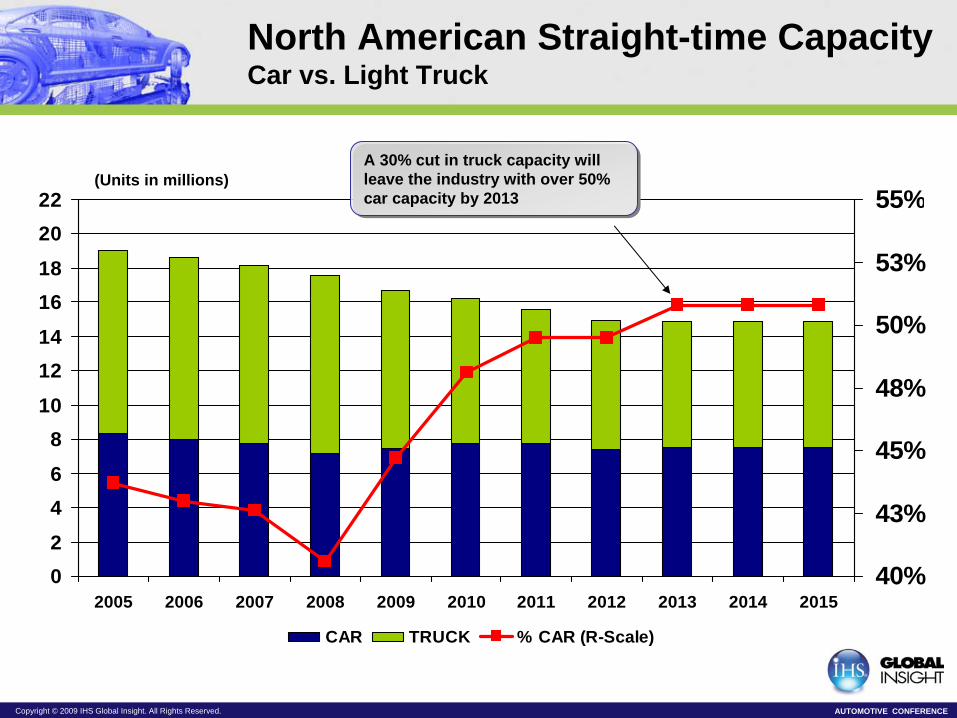
(Units in millions)
North American Straight-time Capacity Car vs. Light Truck
02
46
810
1214
1618
2022
2005 2006 2007 2008 2009 2010 2011 2012 2013 2014 201540%
43%
45%
48%
50%
53%
55%
CAR TRUCK % CAR (R-Scale)
A 30% cut in truck capacity will leave the industry with over 50% car capacity by 2013
A 30% cut in truck capacity will leave the industry with over 50% car capacity by 2013
Copyright © 2009 IHS Global Insight. All Rights Reserved. AUTOMOTIVE CONFERENCE
0
2
4
6
8
10
12
14
16
18
20
2005 2006 2007 2008 2009 2010 2011 2012 2013 2014 20150%
20%
40%
60%
80%
100%
120%
Adjusted Capacity Utilization (R-Scale)
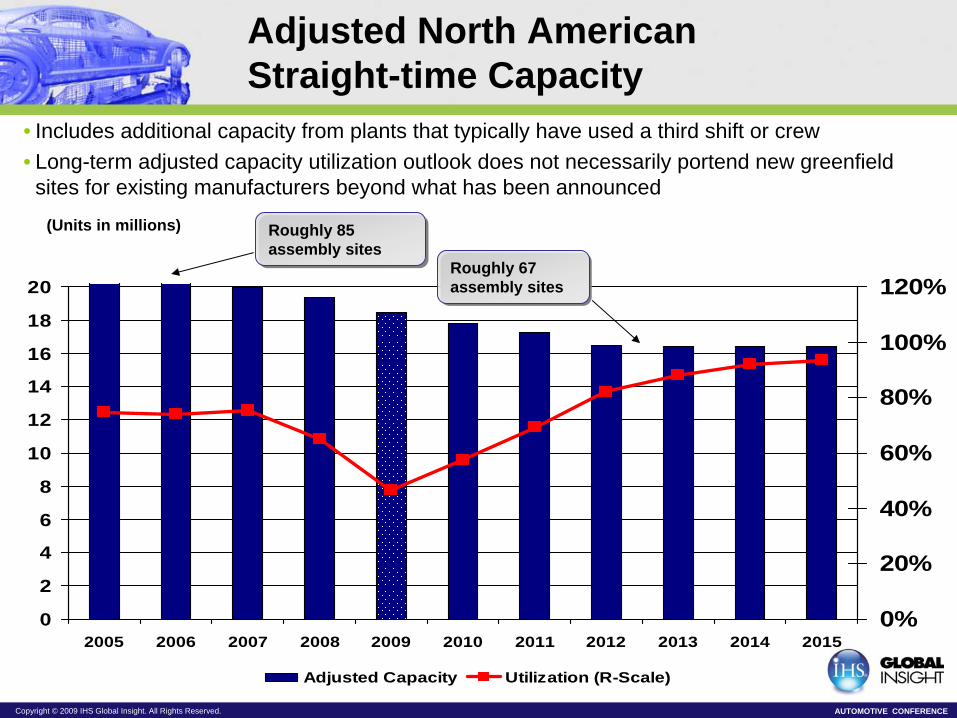
(Units in millions)
Adjusted North American Straight-time Capacity
• Includes additional capacity from plants that typically have used a third shift or crew• Long-term adjusted capacity utilization outlook does not necessarily portend new greenfield
sites for existing manufacturers beyond what has been announced
Roughly 85 assembly sites Roughly 85 assembly sites
Roughly 67 assembly sites Roughly 67 assembly sites
Copyright © 2009 IHS Global Insight. All Rights Reserved. AUTOMOTIVE CONFERENCE
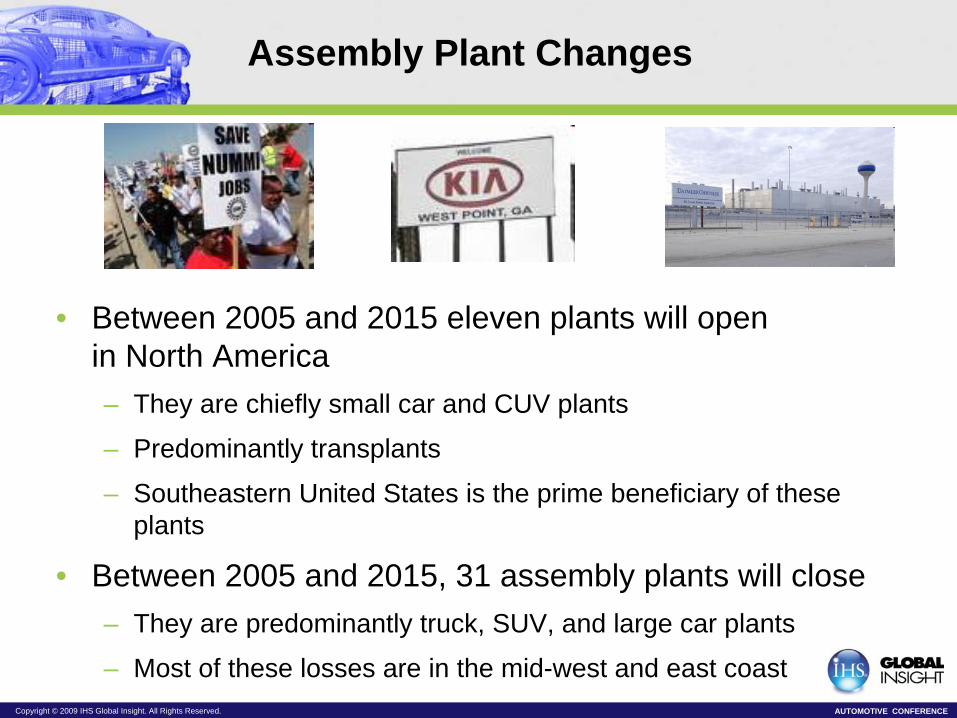
Assembly Plant Changes
• Between 2005 and 2015 eleven plants will open in North America– They are chiefly small car and CUV plants
– Predominantly transplants
– Southeastern United States is the prime beneficiary of these plants
• Between 2005 and 2015, 31 assembly plants will close– They are predominantly truck, SUV, and large car plants
– Most of these losses are in the mid-west and east coast
Copyright © 2009 IHS Global Insight. All Rights Reserved. AUTOMOTIVE CONFERENCE
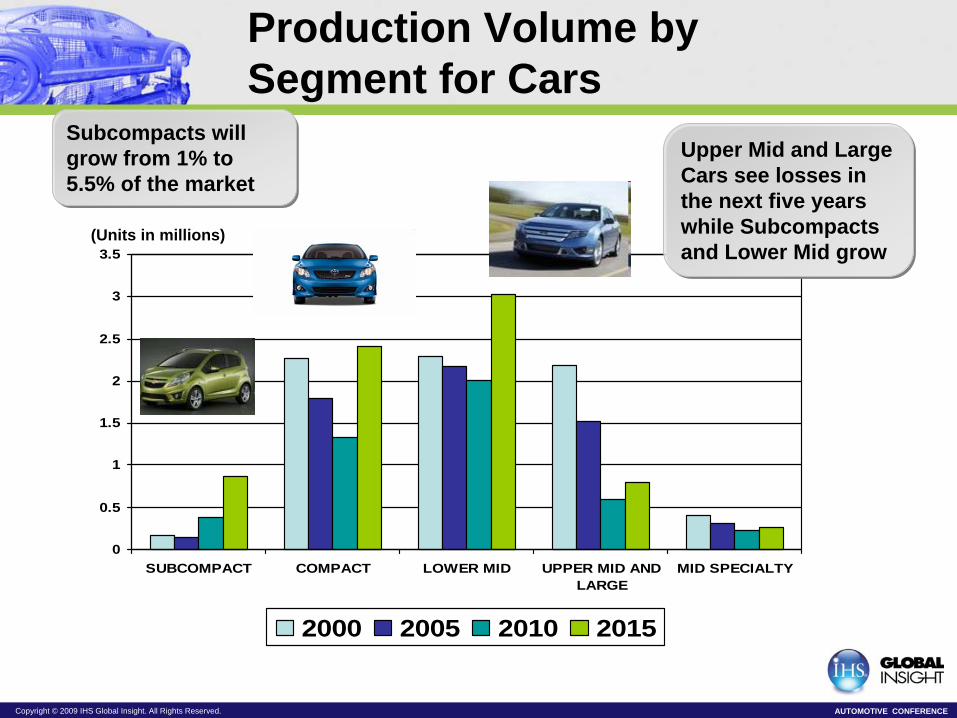
0
0.5
1
1.5
2
2.5
3
3.5
SUBCOMPACT COMPACT LOWER MID UPPER MID ANDLARGE
MID SPECIALTY
2000 2005 2010 2015
Upper Mid and Large Cars see losses in the next five years while Subcompacts and Lower Mid grow
Upper Mid and Large Cars see losses in the next five years while Subcompacts and Lower Mid grow
(Units in millions)
Production Volume by Segment for Cars
Subcompacts will grow from 1% to 5.5% of the market
Subcompacts will grow from 1% to 5.5% of the market
Copyright © 2009 IHS Global Insight. All Rights Reserved. AUTOMOTIVE CONFERENCE
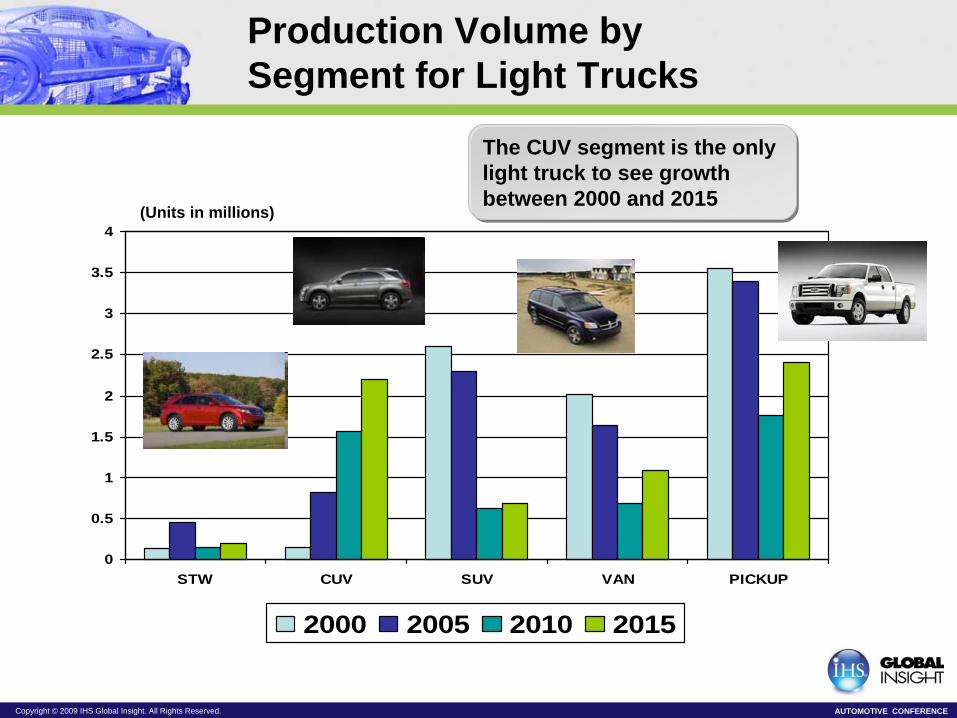
(Units in millions)
0
0.5
1
1.5
2
2.5
3
3.5
4
STW CUV SUV VAN PICKUP
2000 2005 2010 2015
The CUV segment is the only light truck to see growth between 2000 and 2015
The CUV segment is the only light truck to see growth between 2000 and 2015
Production Volume by Segment for Light Trucks
Copyright © 2009 IHS Global Insight. All Rights Reserved. AUTOMOTIVE CONFERENCE
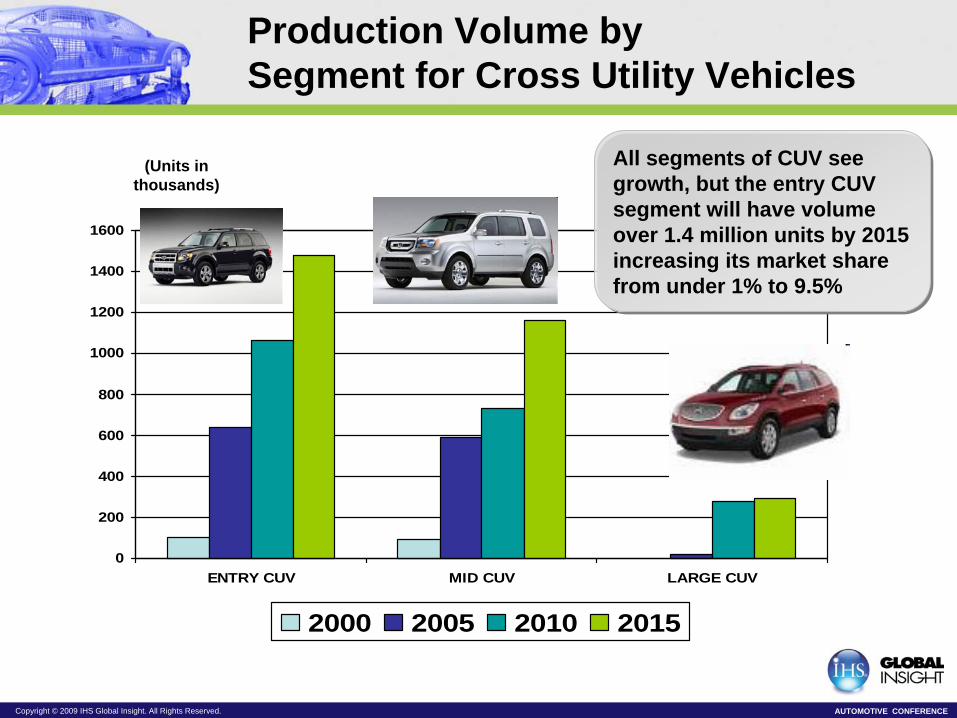
(Units in thousands)
0
200
400
600
800
1000
1200
1400
1600
ENTRY CUV MID CUV LARGE CUV
2000 2005 2010 2015
All segments of CUV see growth, but the entry CUV segment will have volume over 1.4 million units by 2015 increasing its market share from under 1% to 9.5%
All segments of CUV see growth, but the entry CUV segment will have volume over 1.4 million units by 2015 increasing its market share from under 1% to 9.5%
Production Volume by Segment for Cross Utility Vehicles
Copyright © 2009 IHS Global Insight. All Rights Reserved. AUTOMOTIVE CONFERENCE
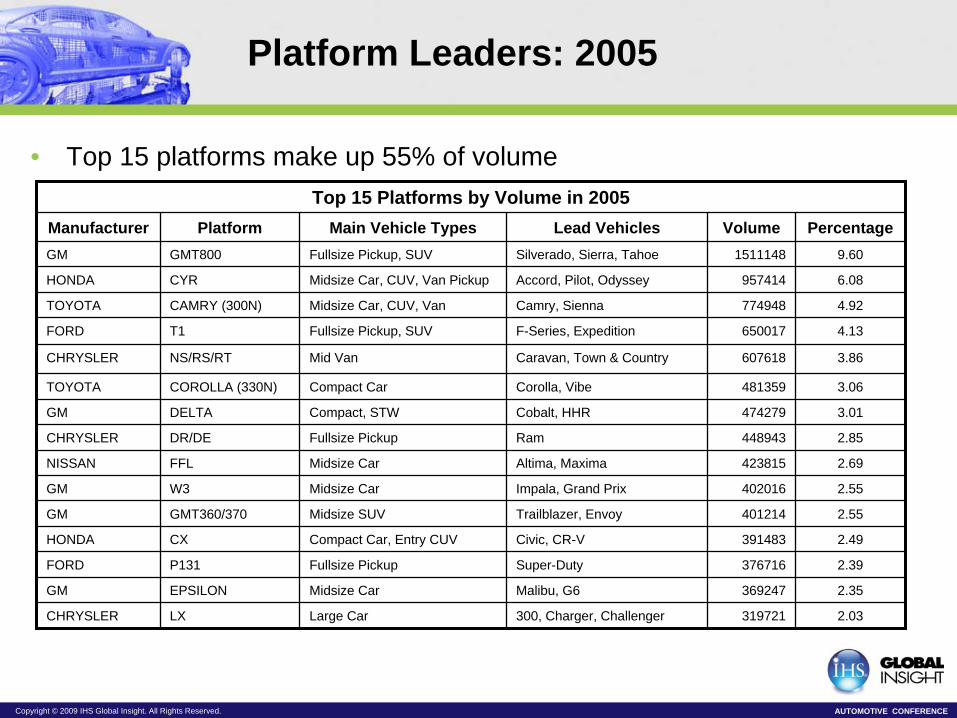
Platform Leaders: 2005
• Top 15 platforms make up 55% of volumeTop 15 Platforms by Volume in 2005
Manufacturer Platform Main Vehicle Types Lead Vehicles Volume PercentageGM GMT800 Fullsize Pickup, SUV Silverado, Sierra, Tahoe 1511148 9.60
HONDA CYR Midsize Car, CUV, Van Pickup Accord, Pilot, Odyssey 957414 6.08
TOYOTA CAMRY (300N) Midsize Car, CUV, Van Camry, Sienna 774948 4.92
FORD T1 Fullsize Pickup, SUV F-Series, Expedition 650017 4.13
CHRYSLER NS/RS/RT Mid Van Caravan, Town & Country 607618 3.86
TOYOTA COROLLA (330N) Compact Car Corolla, Vibe 481359 3.06
GM DELTA Compact, STW Cobalt, HHR 474279 3.01
CHRYSLER DR/DE Fullsize Pickup Ram 448943 2.85
NISSAN FFL Midsize Car Altima, Maxima 423815 2.69
GM W3 Midsize Car Impala, Grand Prix 402016 2.55
GM GMT360/370 Midsize SUV Trailblazer, Envoy 401214 2.55
HONDA CX Compact Car, Entry CUV Civic, CR-V 391483 2.49
FORD P131 Fullsize Pickup Super-Duty 376716 2.39
GM EPSILON Midsize Car Malibu, G6 369247 2.35
CHRYSLER LX Large Car 300, Charger, Challenger 319721 2.03
Copyright © 2009 IHS Global Insight. All Rights Reserved. AUTOMOTIVE CONFERENCE
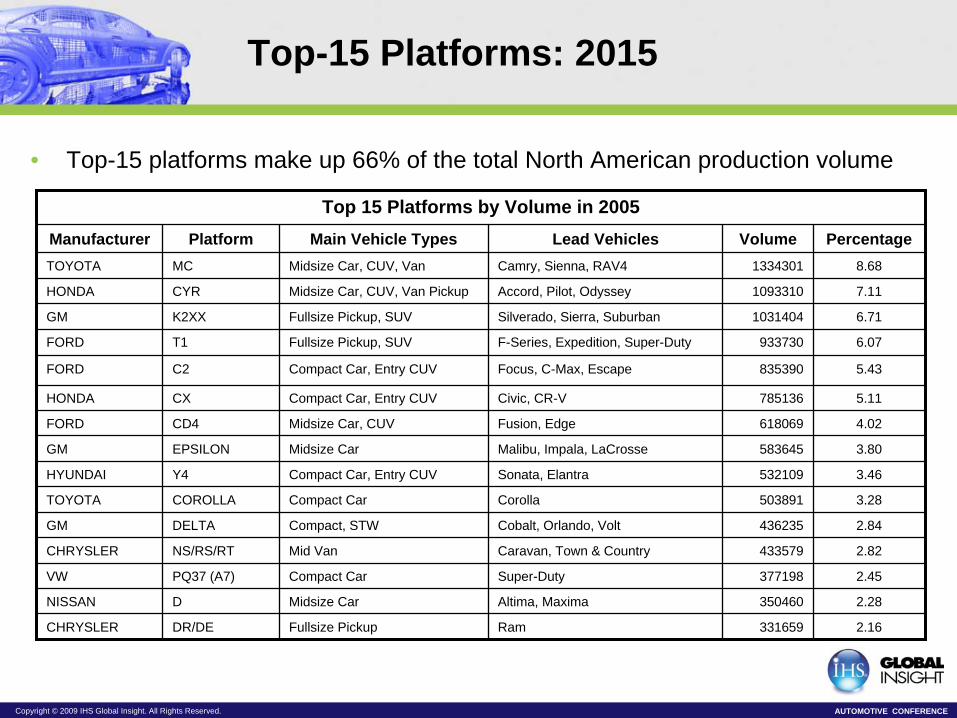
Top-15 Platforms: 2015
• Top-15 platforms make up 66% of the total North American production volume
Top 15 Platforms by Volume in 2005Manufacturer Platform Main Vehicle Types Lead Vehicles Volume PercentageTOYOTA MC Midsize Car, CUV, Van Camry, Sienna, RAV4 1334301 8.68
HONDA CYR Midsize Car, CUV, Van Pickup Accord, Pilot, Odyssey 1093310 7.11
GM K2XX Fullsize Pickup, SUV Silverado, Sierra, Suburban 1031404 6.71
FORD T1 Fullsize Pickup, SUV F-Series, Expedition, Super-Duty 933730 6.07
FORD C2 Compact Car, Entry CUV Focus, C-Max, Escape 835390 5.43
HONDA CX Compact Car, Entry CUV Civic, CR-V 785136 5.11
FORD CD4 Midsize Car, CUV Fusion, Edge 618069 4.02
GM EPSILON Midsize Car Malibu, Impala, LaCrosse 583645 3.80
HYUNDAI Y4 Compact Car, Entry CUV Sonata, Elantra 532109 3.46
TOYOTA COROLLA Compact Car Corolla 503891 3.28
GM DELTA Compact, STW Cobalt, Orlando, Volt 436235 2.84
CHRYSLER NS/RS/RT Mid Van Caravan, Town & Country 433579 2.82
VW PQ37 (A7) Compact Car Super-Duty 377198 2.45
NISSAN D Midsize Car Altima, Maxima 350460 2.28
CHRYSLER DR/DE Fullsize Pickup Ram 331659 2.16
Copyright © 2009 IHS Global Insight. All Rights Reserved. AUTOMOTIVE CONFERENCE
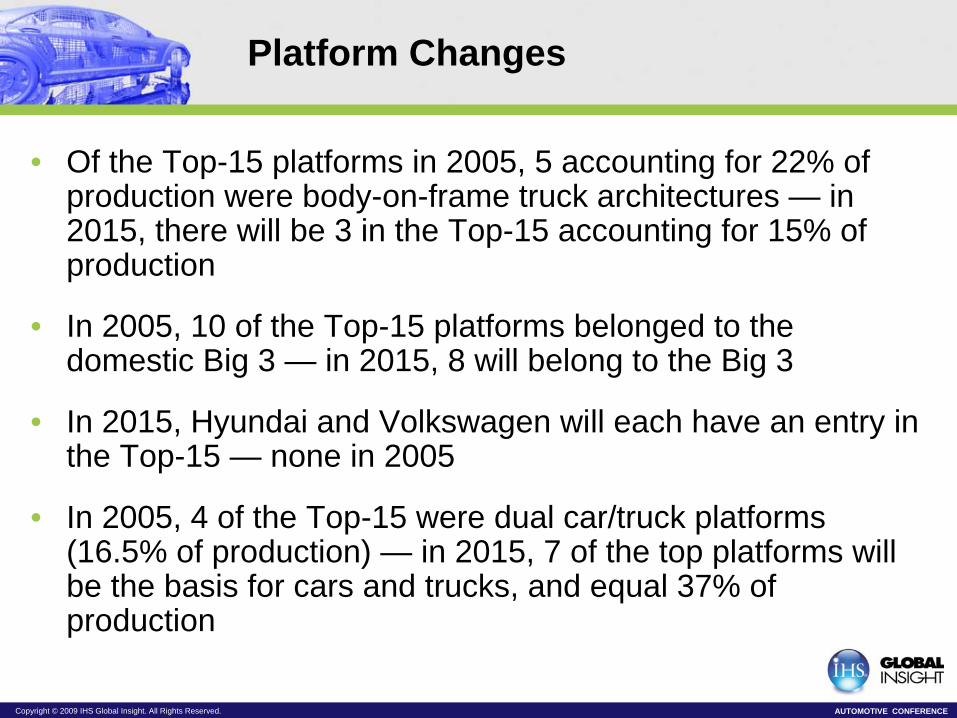
Platform Changes
• Of the Top-15 platforms in 2005, 5 accounting for 22% of production were body-on-frame truck architectures — in 2015, there will be 3 in the Top-15 accounting for 15% of production
• In 2005, 10 of the Top-15 platforms belonged to the domestic Big 3 — in 2015, 8 will belong to the Big 3
• In 2015, Hyundai and Volkswagen will each have an entry in the Top-15 — none in 2005
• In 2005, 4 of the Top-15 were dual car/truck platforms (16.5% of production) — in 2015, 7 of the top platforms will be the basis for cars and trucks, and equal 37% of production
Copyright © 2009 IHS Global Insight. All Rights Reserved. AUTOMOTIVE CONFERENCE
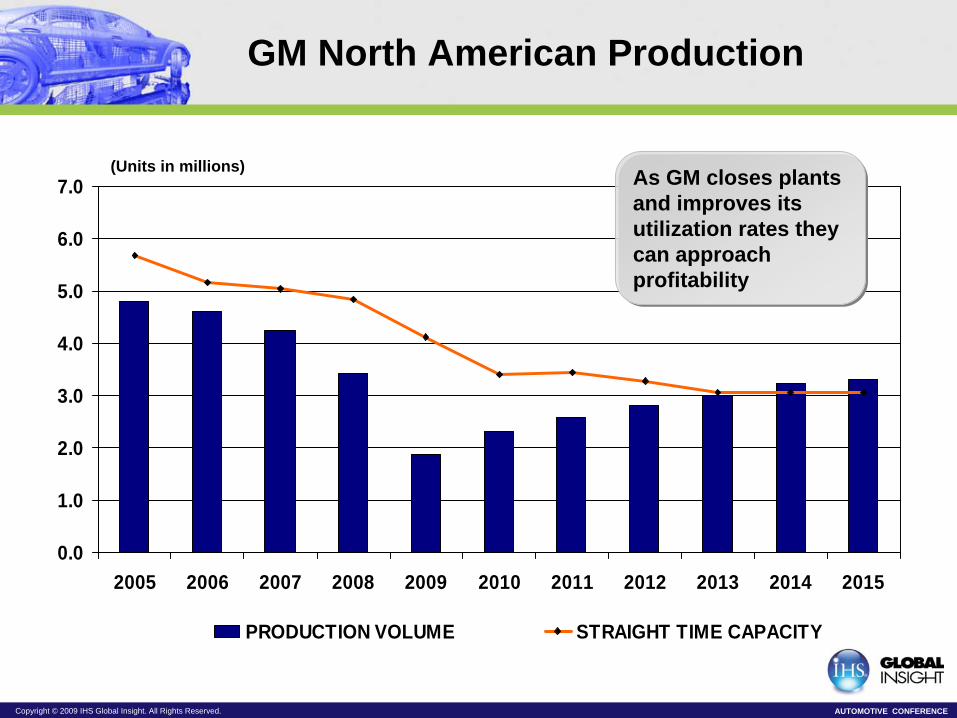
GM North American Production
0.0
1.0
2.0
3.0
4.0
5.0
6.0
7.0
2005 2006 2007 2008 2009 2010 2011 2012 2013 2014 2015
PRODUCTION VOLUME STRAIGHT TIME CAPACITY
(Units in millions)As GM closes plants and improves its utilization rates they can approach profitability
As GM closes plants and improves its utilization rates they can approach profitability
Copyright © 2009 IHS Global Insight. All Rights Reserved. AUTOMOTIVE CONFERENCE
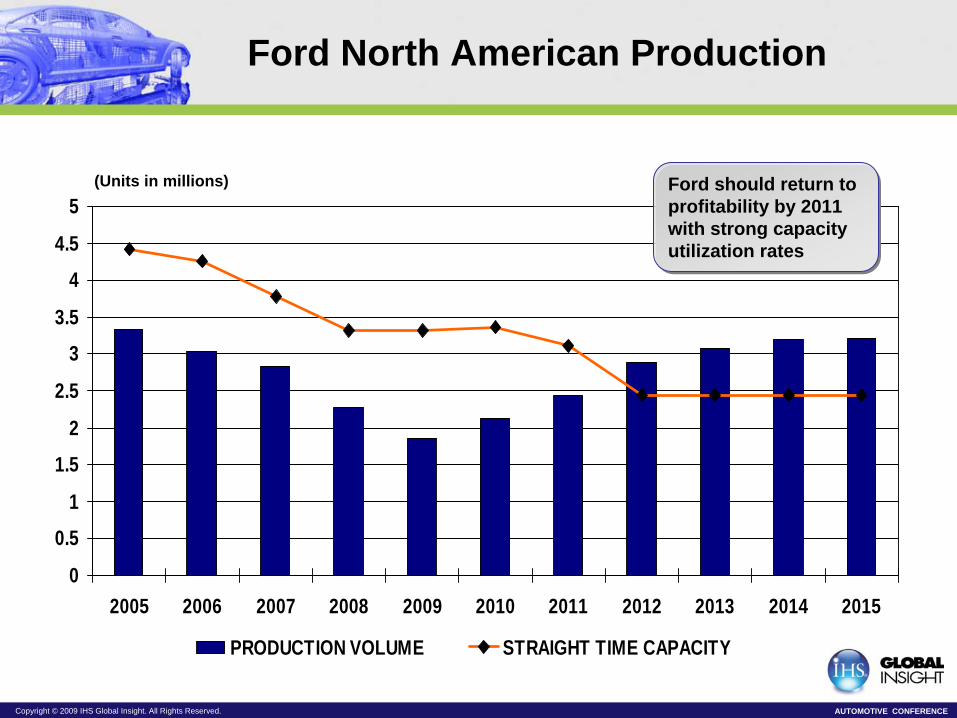
Ford North American Production
0
0.5
1
1.5
2
2.5
3
3.5
4
4.5
5
2005 2006 2007 2008 2009 2010 2011 2012 2013 2014 2015
PRODUCTION VOLUME STRAIGHT TIME CAPACITY
(Units in millions) Ford should return to profitability by 2011 with strong capacity utilization rates
Ford should return to profitability by 2011 with strong capacity utilization rates
Copyright © 2009 IHS Global Insight. All Rights Reserved. AUTOMOTIVE CONFERENCE
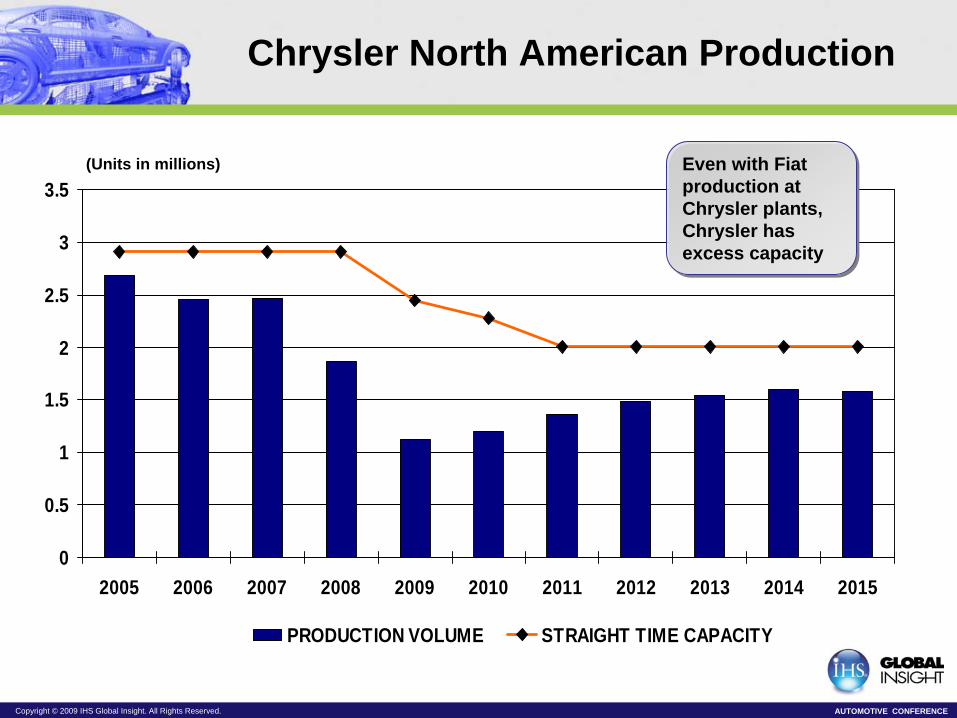
Chrysler North American Production
0
0.5
1
1.5
2
2.5
3
3.5
2005 2006 2007 2008 2009 2010 2011 2012 2013 2014 2015
PRODUCTION VOLUME STRAIGHT TIME CAPACITY
(Units in millions) Even with Fiat production at Chrysler plants, Chrysler has excess capacity
Even with Fiat production at Chrysler plants, Chrysler has excess capacity
Copyright © 2009 IHS Global Insight. All Rights Reserved. AUTOMOTIVE CONFERENCE
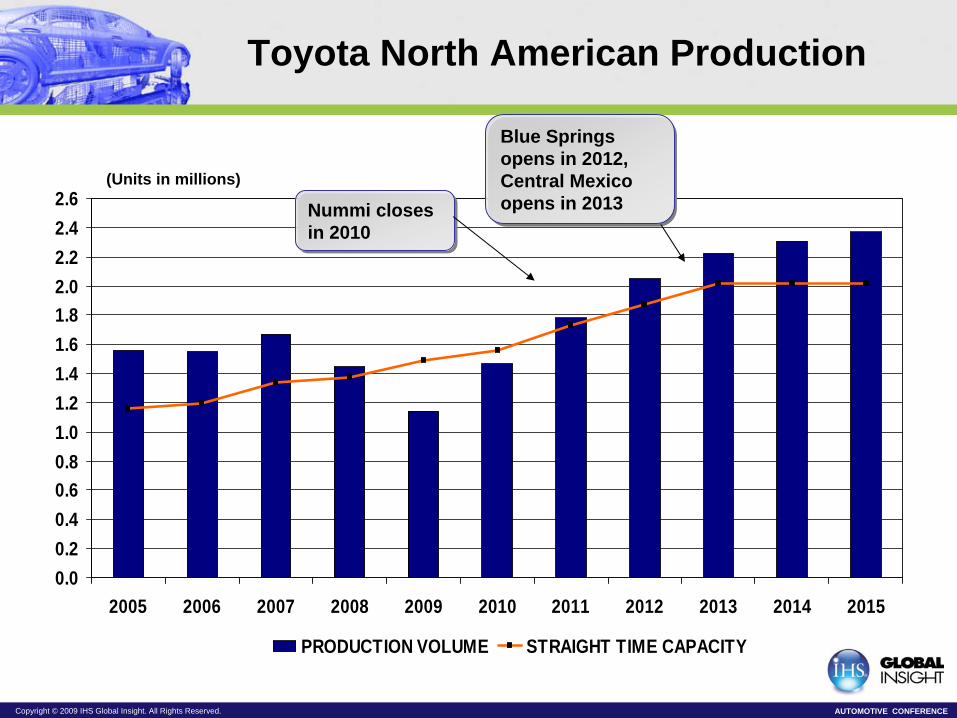
Toyota North American Production
0.00.20.40.60.81.01.21.41.61.82.02.22.42.6
2005 2006 2007 2008 2009 2010 2011 2012 2013 2014 2015
PRODUCTION VOLUME STRAIGHT TIME CAPACITY
(Units in millions)
Blue Springs opens in 2012, Central Mexico opens in 2013
Blue Springs opens in 2012, Central Mexico opens in 2013Nummi closes
in 2010 Nummi closes in 2010
Copyright © 2009 IHS Global Insight. All Rights Reserved. AUTOMOTIVE CONFERENCE
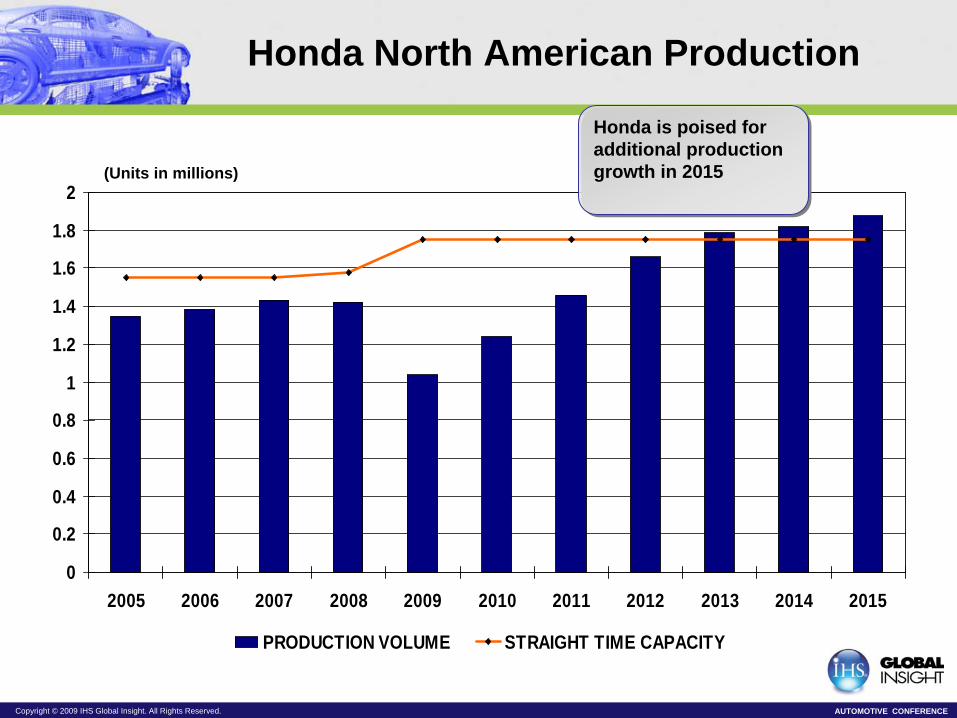
Honda North American Production
0
0.2
0.4
0.6
0.8
1
1.2
1.4
1.6
1.8
2
2005 2006 2007 2008 2009 2010 2011 2012 2013 2014 2015
PRODUCTION VOLUME STRAIGHT TIME CAPACITY
(Units in millions)
Honda is poised for additional production growth in 2015
Honda is poised for additional production growth in 2015
Copyright © 2009 IHS Global Insight. All Rights Reserved. AUTOMOTIVE CONFERENCE
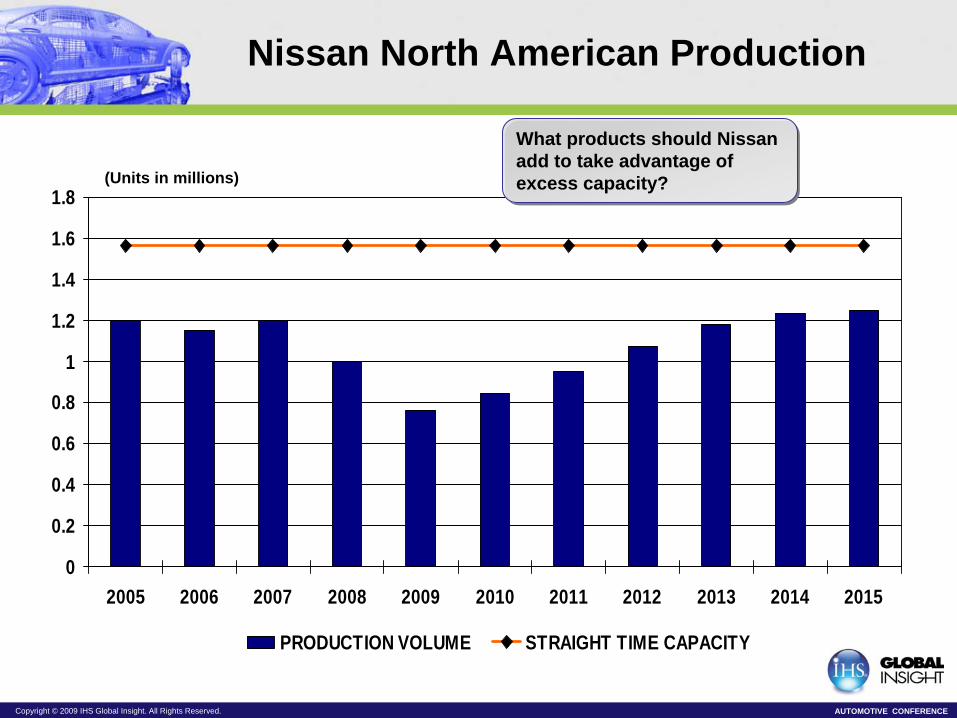
Nissan North American Production
0
0.2
0.4
0.6
0.8
1
1.2
1.4
1.6
1.8
2005 2006 2007 2008 2009 2010 2011 2012 2013 2014 2015
PRODUCTION VOLUME STRAIGHT TIME CAPACITY
(Units in millions)
What products should Nissan add to take advantage of excess capacity?
What products should Nissan add to take advantage of excess capacity?
Copyright © 2009 IHS Global Insight. All Rights Reserved. AUTOMOTIVE CONFERENCE
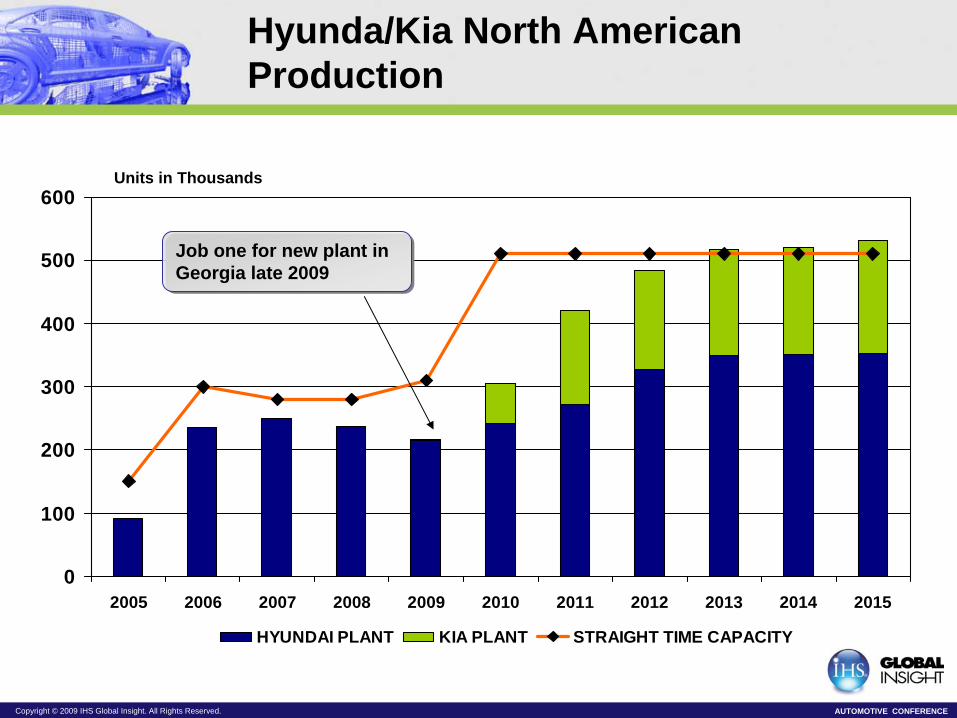
Hyunda/Kia North American Production
0
100
200
300
400
500
600
2005 2006 2007 2008 2009 2010 2011 2012 2013 2014 2015
HYUNDAI PLANT KIA PLANT STRAIGHT TIME CAPACITY
Units in Thousands
Job one for new plant in Georgia late 2009 Job one for new plant in Georgia late 2009
Copyright © 2009 IHS Global Insight. All Rights Reserved. AUTOMOTIVE CONFERENCE
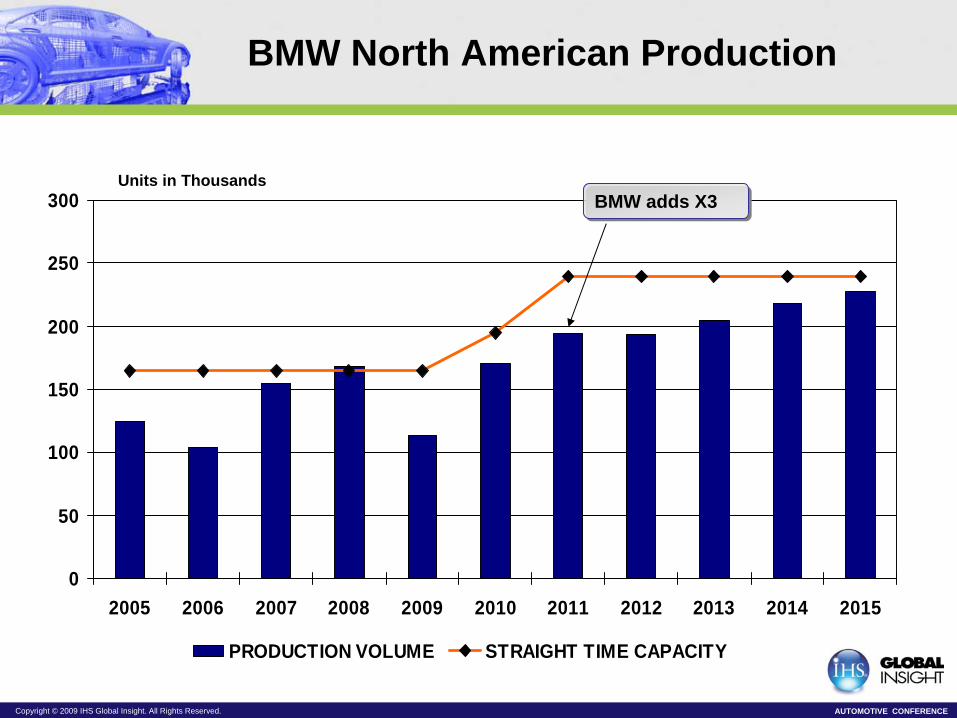
BMW North American Production
0
50
100
150
200
250
300
2005 2006 2007 2008 2009 2010 2011 2012 2013 2014 2015
PRODUCTION VOLUME STRAIGHT TIME CAPACITY
BMW adds X3BMW adds X3Units in Thousands
Copyright © 2009 IHS Global Insight. All Rights Reserved. AUTOMOTIVE CONFERENCE
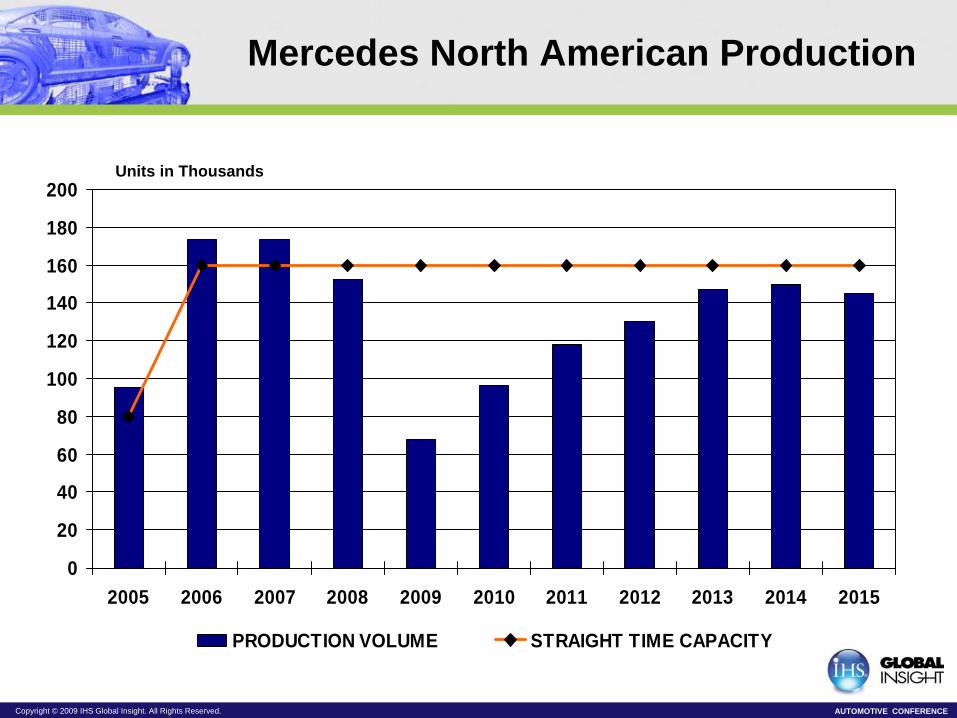
Mercedes North American Production
0
20
40
60
80
100
120
140
160
180
200
2005 2006 2007 2008 2009 2010 2011 2012 2013 2014 2015
PRODUCTION VOLUME STRAIGHT TIME CAPACITY
Units in Thousands
Copyright © 2009 IHS Global Insight. All Rights Reserved. AUTOMOTIVE CONFERENCE
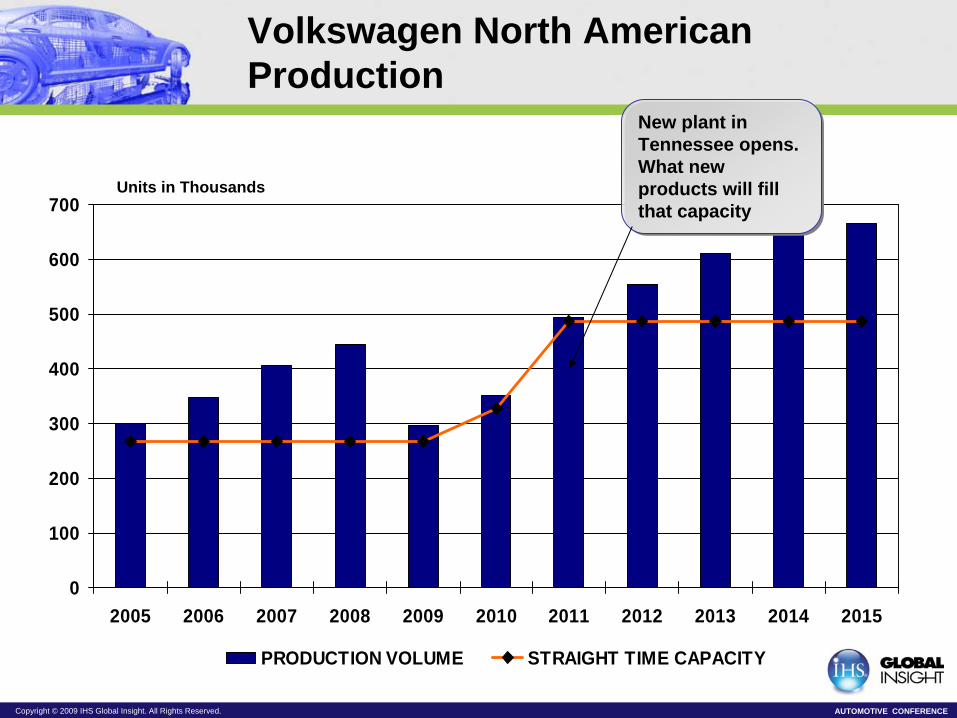
Volkswagen North American Production
0
100
200
300
400
500
600
700
2005 2006 2007 2008 2009 2010 2011 2012 2013 2014 2015
PRODUCTION VOLUME STRAIGHT TIME CAPACITY
New plant in Tennessee opens. What new products will fill that capacity
New plant in Tennessee opens. What new products will fill that capacity
Units in Thousands
Copyright © 2009 IHS Global Insight. All Rights Reserved. AUTOMOTIVE CONFERENCE
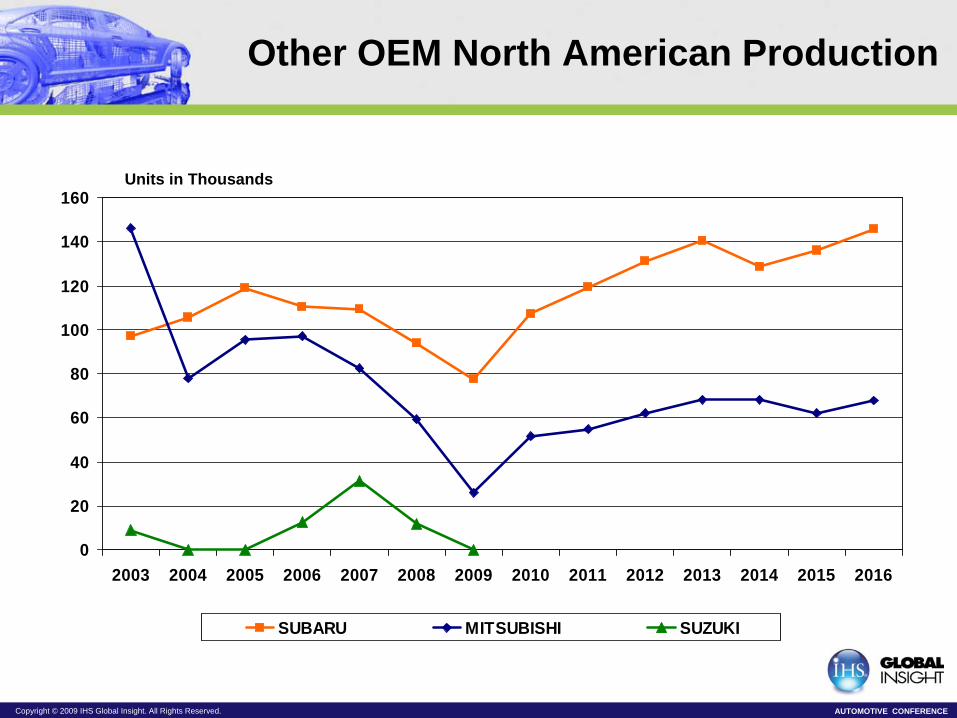
Other OEM North American Production
0
20
40
60
80
100
120
140
160
2003 2004 2005 2006 2007 2008 2009 2010 2011 2012 2013 2014 2015 2016
SUBARU MITSUBISHI SUZUKI
Units in Thousands
Copyright © 2009 IHS Global Insight. All Rights Reserved. AUTOMOTIVE CONFERENCE
Conclusions
• The key word for North American production in 2015 is “Smaller”
– A smaller production share for the Domestic 3
– The smaller segment sizes, whether cars or CUVs will be emphasized
– Capacity will be smaller as plants close and no new plants are needed
– Production will be smaller than the peak of 2000, but will stabilize at 15 million units
Copyright © 2009 IHS Global Insight. All Rights Reserved. AUTOMOTIVE CONFERENCE
Implications
• In order to take advantage of the smaller North American production landscape suppliers must
– Work with the transplants
– Focus on small cars and CUV’s
– Concentrate on the top platforms
– Ride out the storm until 2013 when production capacity is right-sized
– Don’t expect any new assembly plants soon