Embed Size (px)
Citation preview

Al MonacoPresident & Chief Executive OfficerAl MonacoPresident & Chief Executive Officer
North America’s Energy Infrastructure RenaissanceCIBC Whistler Institutional Investor Conference
January 23, 2014
North America’s Energy Infrastructure RenaissanceCIBC Whistler Institutional Investor Conference
January 23, 2014
Legal Notice
This presentation includes certain forward looking information (FLI) to provide Enbridge shareholdersand potential investors with information about Enbridge and management’s assessment of its futureplans and operations, which may not be appropriate for other purposes. FLI is typically identified bywords such as “anticipate”, “expect”, “project”, “estimate”, “forecast”, “plan”, “intend”, “target”, “believe”and similar words suggesting future outcomes or statements regarding an outlook. Although we believethat our FLI is reasonable based on the information available today and processes used to prepare it,such statements are not guarantees of future performance and you are cautioned against placing unduereliance on FLI. By its nature, FLI involves a variety of assumptions, risks, uncertainties and otherfactors which may cause actual results, levels of activity and achievements to differ materially from thoseexpressed or implied in our FLI. Material assumptions include assumptions about: the expected supplyand demand for crude oil, natural gas and natural gas liquids; prices of crude oil, natural gas and naturalgas liquids; expected exchange rates; inflation; interest rates; the availability and price of labour andpipeline construction materials; operational reliability; anticipated in-service dates and weather.
Our FLI is subject to risks and uncertainties pertaining to operating performance, regulatory parameters,weather, economic conditions, exchange rates, interest rates and commodity prices, including but notlimited to those discussed more extensively in our filings with Canadian and US securities regulators.The impact of any one risk, uncertainty or factor on any particular FLI is not determinable with certaintyas these are interdependent and our future course of action depends on management’s assessment ofall information available at the relevant time. Except to the extent required by law, we assume noobligation to publicly update or revise any FLI, whether as a result of new information, future events orotherwise. All FLI in this presentation is expressly qualified in its entirety by these cautionary statements.
This presentation will make reference to certain financial measures, such as adjusted net income, whichare not recognized under GAAP. Reconciliations to the most closely related GAAP measures areincluded in the earnings release and also in the Management Discussion and Analysis posted to thewebsite.
2

Enbridge Infrastructure Asset Base
Norman Wells
ZamaFort McMurray
Portland
Casper
Montreal
Salt Lake City
Patoka
Cushing
Houston
Superior
Clearbrook
EdmontonHardisty
Toronto
Chicago
Liquids Pipelines
Edmonton
Fort St. John
Houston
Chicago
15%
Gas
Sarnia
2012 Adjusted Earnings
Liquids Pipelines
67%
Power, International, & Energy Services
7%
Gas26%
Toronto
Edmonton
Wind Power Generation
Waste Heat RecoverySolar Power Generation
Geothermal Power GenerationPower Transmission
Power, International & Energy ServicesPower, International & Energy Services 3

North American Regional Pricing Disparities
4
Asia
$86
$89
$111
AlbertaLight
WCS
Bakken Light
Brent
Maya
Pricing Based on Q4 2013 - Daily Average(USD per barrel)
$83$107
$101
LLS
$98
WTI
$117
Light Crude
Heavy Crude
*Brent price is a landed price on US East Coast/ US Gulf Coast. Assumed tanker freight cost of US$2.00 per bbl.
*
$66

North American Crude Oil Supply Growth: 2013 – 2025
5
Bakken
Eagle Ford
Permian Basin
OtherNiobrara
Oil Sands
0.0
0.5
1.0
1.5
2.0
2.5
3.0
3.5
4.0
Heavy Light
Cardium, Viking, Duvernay
Sources: Enbridge Internal Forecast and External Forecasts
+ 7 MMbpd by 2025MMbpd

Source: StatsCan, EIA, Enbridge Internal Forecasts
Light Markets• East Coast• Eastern PADD II• PADD III
Heavy Markets• PADD II• PADD III
North American Crude Oil Demand
6

Providing New Market Access (Heavy & Light)
7
Norman Wells
Zama
Edmonton
Fort McMurray
Portland
Seattle
Casper
Montreal
Salt Lake City
Patoka
Cushing
Superior
Chicago
Clearbrook
Regina
Flanagan
Hardisty
ToledoSarnia
Buffalo
Houston
St. James
CromerSt. John
+600 kbpd Heavy
+80 kbpd Heavy
+250 kbpd Light
+50 kbpdHeavy
+300 kbpd Light
Western USGCAccess ($6.4B)
Eastern Access ($2.7B)
Light Oil Market Access ($6.3B)
+50 kbpdLight
Incremental Market Access Volumes
+ ~1.0 MMbpd of Heavy+ ~0.7 MMbpd of Light
+50 kbpdLight
Nanticoke+250 kbpd Heavy
7

New Market Access – Under Development
8
MontrealGretna
Regina
Hardisty
Kerrobert
Toledo
Buffalo
Edmonton
Fort McMurray
Cromer
Cushing
Patoka
Clearbrook
Sarnia
Chicago/ Flanagan
WoodRiver
Asia Pacific/West Coast Refinery Markets
Eastern U.S. Gulf Coast Refinery Markets
Canadian/U.S. East Coast Refinery Markets
Houston
St. JamesPort Arthur

Regional Infrastructure – Alberta Oil Sands
NTD: Secured capital does not align with LRP (2013 – 2017)- Fort Hills and Norlite should be classified as unsecured?
Edmonton
AlbertaAlbertaCheechamTerminal
Kirby Lake Terminal
Athabasca Terminal
Cenovus(Christina Lake)
AOC(Hangingstone)
JACOS(Hangingstone)
Suncor(MacKay River) Suncor
(Firebag)
Imperial Oil(Kearl)
Norealis Terminal
Husky(Sunrise)
Hardisty
FHELP(Fort Hills)
ConocoPhillips(Surmont)
Statoil(Leismer)
Nexen(Long Lake)
Total Secured Capital = $6.0 B** Excluding ~$1B of projects that came into service in 2012
9
Wood Buffalo PipelineWaupisoo PipelineAthabasca PipelineWoodland PipelineNorealis PipelineAthabasca Twin PipelineWoodland Pipeline ExtensionWood Buffalo ExtensionNorlite Diluent PipelineSouthern Lights Pipeline

Canadian Midstream
10
• Commercially Secured: $1.1B
– Cabin Phases 1 & 2
– Peace River Arch Gathering
• Potential Opportunities: $4.5B
– Cabin expansion phases (3–6)
– Peace River Arch expansion
– Montney, Duvernay and other Deep Basin infrastructure
– Regional condensate & NGL pipelines & processing infrastructure
Horn River Montney Duvernay
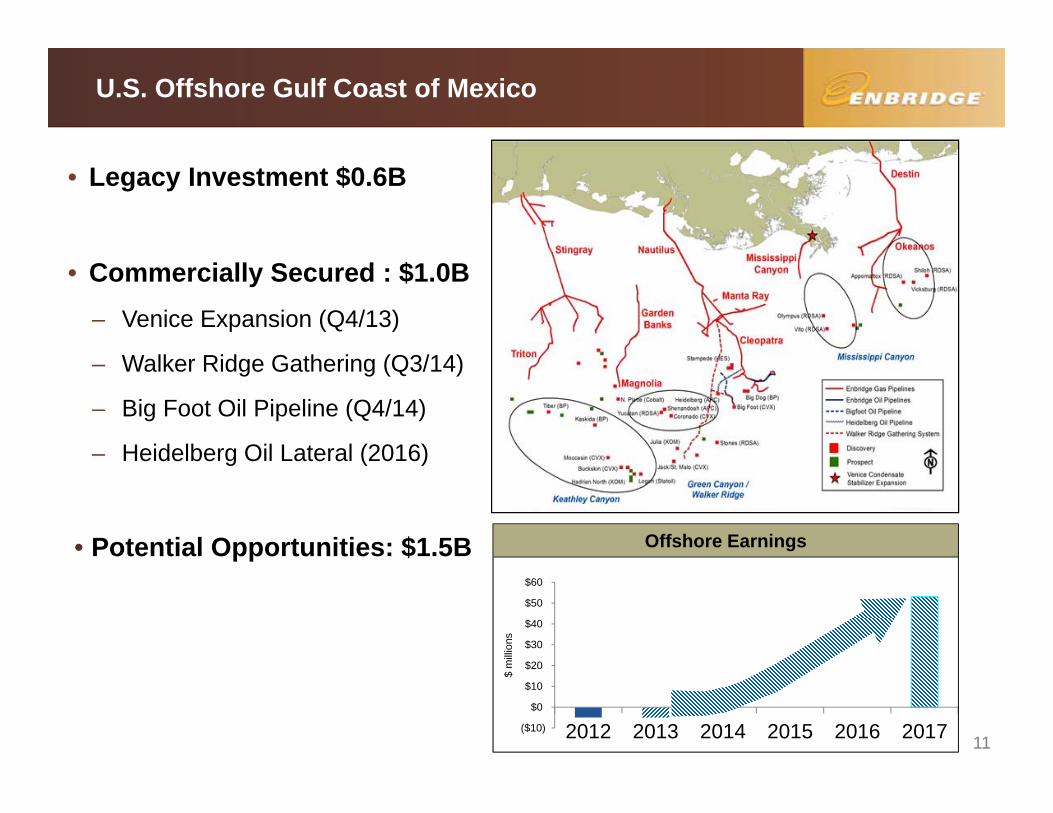
U.S. Offshore Gulf Coast of Mexico
11
• Legacy Investment $0.6B
• Commercially Secured : $1.0B– Venice Expansion (Q4/13)
– Walker Ridge Gathering (Q3/14)
– Big Foot Oil Pipeline (Q4/14)
– Heidelberg Oil Lateral (2016)
• Potential Opportunities: $1.5B Offshore Earnings
($10)
$0
$10
$20
$30
$40
$50
$60
2012 2013 2014 2015 2016 2017
$ m
illio
ns

Gas Distribution
12Total Secured Capital = $0.7 B
System Reinforcement Project

Power Generation & Transmission
13
Transmission Focus Areas
0
500
1,000
2013 2017
MW
Transmission Capacity
0
1,000
2,000
3,000
2013 2017
MW
Power Generation Capacity
CDN U.S.
Solar 100 MW 50 MW
Wind 1,302 MW 360 MW
Geothermal ‐ 23 MW
Waste Heat 30 MW ‐
Power Generation Focus Areas
Total Secured Capital = $1.5 B
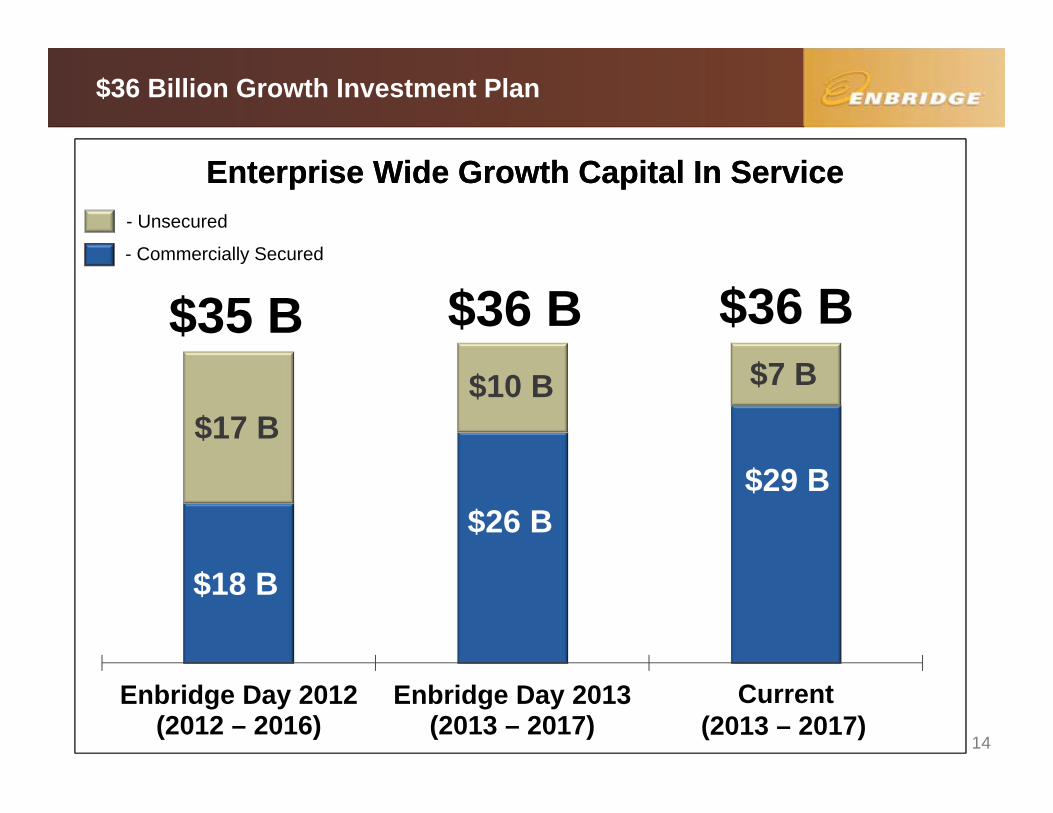
$36 Billion Growth Investment Plan
14
- Unsecured
- Commercially Secured
Enterprise Wide Growth Capital In ServiceEnterprise Wide Growth Capital In Service
Enbridge Day 2012 (2012 – 2016)
Enbridge Day 2013 (2013 – 2017)
Current
$17 B
$18 B
$36 B$10 B $7 B
$26 B$29 B
$36 B$35 B
(2013 – 2017)

Industry Leading EPS & DPS Outlook
15
2012 2017
An Industry Leading DPSGrowth Outlook (smoother)
2012 2017
An Industry Leading EPS* Growth Outlook (but lumpy)
* Adjusted earnings are non-GAAP measures. For more information on non-GAAP measures please refer to disclosure in news release.
• Tilted Return Projects
• New Growth Platforms
• Sponsored Vehicle Drop Downs
• EPS Growth
• Surplus Cash Flow

Summary
16
• Record portfolio of attractive investment opportunities
• Commercial and financial risk tightly managed
• Access to multiple low cost funding alternatives
• Highly visible industry leading growth including significant embedded post 2017 organic growth
Attractive investments low cost of capital
Industry leading growth
Substantial Valuation Upside