Embed Size (px)
Citation preview

North Carolina Clean Energy PlanStakeholder Workshop #1
North Carolina Department of Environmental QualityFebruary 25, 2019

Process PlanDepartment of Environmental Quality

Executive Order No. 80North Carolina’s Commitment to Address Climate Change and
Transition to a Clean Energy Economy• Recognizes that climate change is affecting the
health and welfare of our residents, economy, environment and our natural and built infrastructure.
• Recognizes that we must take an active role in combatting climate change and make our state more resilient to its impacts.
• Calls for clean energy technology innovations, workforce development, and a modern, smart electric grid to grow the state’s economy while making North Carolina a national leader in clean energy solutions.
• Recognizes that we can protect our communities, grow our economy, and ensure a healthy environment at the same time.

Governor Cooper’s Executive Order 80:
4
• Acknowledges North Carolina’s leadership in technology innovation, research and development, and skilled workforce to promote clean energy technology solutions.
• Calls for market innovations that drive economic expansion and job creation.
• Sees an opportunity to produce a smart, resilient, and a modern electric grid while balancing reliability, cost, economic growth, equity, and environmental and public health impacts.
https://governor.nc.gov/documents/executive-order-no-80-north-carolinas-commitment-address-climate-change-and-transition

DEQ Directive
5
• Develop a North Carolina Clean Energy Plan that fosters and encourages:• Utilization of clean energy resources and innovative technologies,
and• Integration of these resources to facilitate the development of a
modern and resilient electric grid.• Collaborate with stakeholders to increase the utilization of clean energy
technologies, energy efficiency measures, and clean transportation solutions.
• Submit the plan to the Governor by October 1, 2019.
Clean Energy Plan Development Process
6
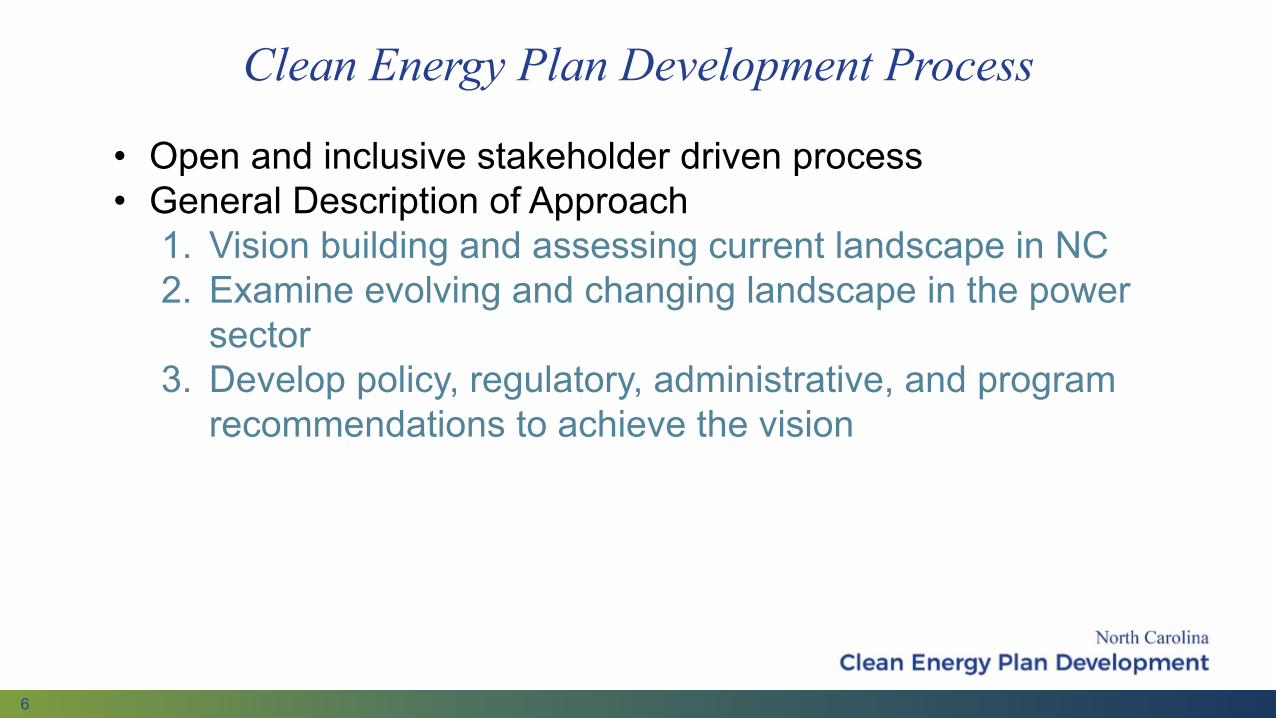
• Open and inclusive stakeholder driven process • General Description of Approach
1. Vision building and assessing current landscape in NC2. Examine evolving and changing landscape in the power
sector3. Develop policy, regulatory, administrative, and program
recommendations to achieve the vision

Public Engagement Methods
7
Method 1. Facilitated Workshops, Raleigh- Technical guidance and facilitation provided by Regulatory
Assistance Project (RAP) and Rocky Mountain Institute (RMI)- Limited seating to accommodate diverse stakeholder participation- Request to Participate form required
Method 2. Regional Listening Sessions- Open to all
Method 3. Combined with Other Statewide Events
Method 4. Online Input
https://deq.nc.gov/cleanenergy
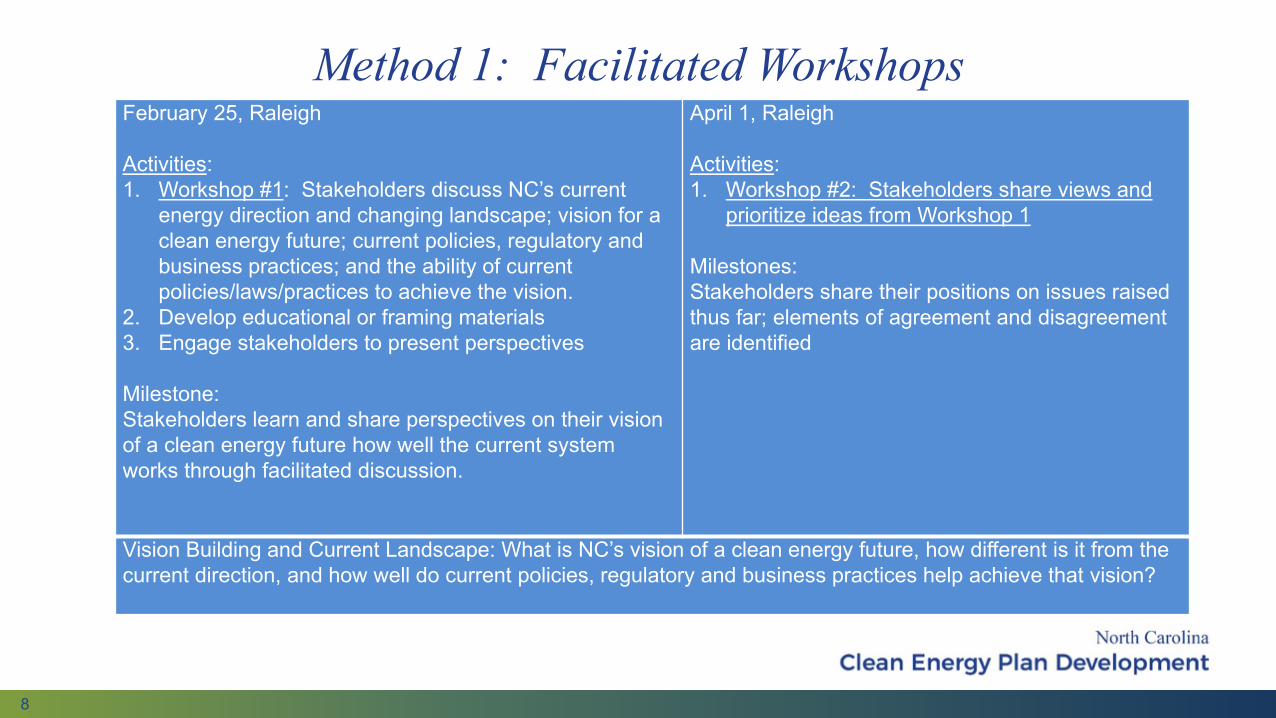
Method 1: Facilitated Workshops
8
February 25, Raleigh
Activities:1. Workshop #1: Stakeholders discuss NC’s current
energy direction and changing landscape; vision for a clean energy future; current policies, regulatory and business practices; and the ability of current policies/laws/practices to achieve the vision.
2. Develop educational or framing materials 3. Engage stakeholders to present perspectives
Milestone:Stakeholders learn and share perspectives on their vision of a clean energy future how well the current system works through facilitated discussion.
April 1, Raleigh
Activities:1. Workshop #2: Stakeholders share views and
prioritize ideas from Workshop 1
Milestones:Stakeholders share their positions on issues raised thus far; elements of agreement and disagreement are identified
Vision Building and Current Landscape: What is NC’s vision of a clean energy future, how different is it from the current direction, and how well do current policies, regulatory and business practices help achieve that vision?
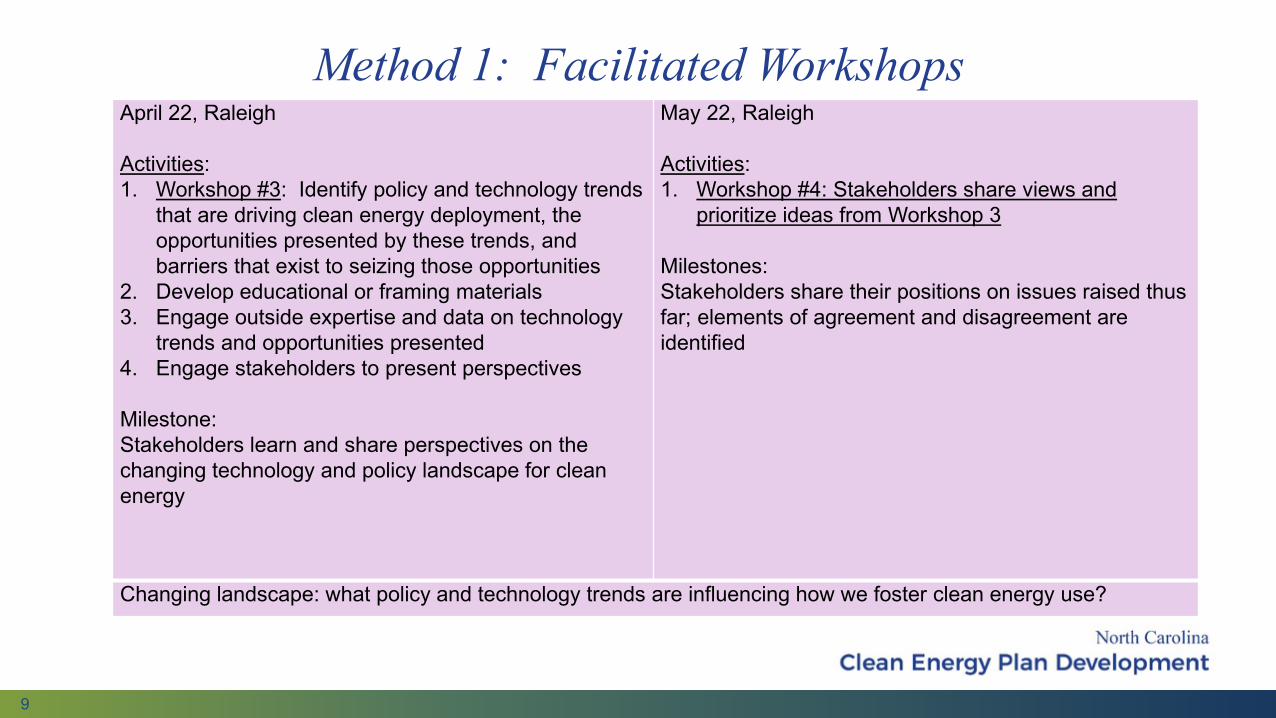
Method 1: Facilitated Workshops
9
April 22, Raleigh
Activities:1. Workshop #3: Identify policy and technology trends
that are driving clean energy deployment, the opportunities presented by these trends, and barriers that exist to seizing those opportunities
2. Develop educational or framing materials 3. Engage outside expertise and data on technology
trends and opportunities presented4. Engage stakeholders to present perspectives
Milestone:Stakeholders learn and share perspectives on the changing technology and policy landscape for clean energy
May 22, Raleigh
Activities:1. Workshop #4: Stakeholders share views and
prioritize ideas from Workshop 3
Milestones:Stakeholders share their positions on issues raised thus far; elements of agreement and disagreement are identified
Changing landscape: what policy and technology trends are influencing how we foster clean energy use?

Method 1: Facilitated Workshops
10
June 26, Raleigh
Activities:1. Workshop #5: Stakeholders identify areas of policy
or regulation that need to be developed or updated to overcome rules or practices that prevent NC from achieving the clean energy vision.
2. Develop educational or framing materials 3. Engage outside expertise on policy and regulation 4. Engage stakeholders to present perspectives
Milestones:Stakeholders better understand the suite of possible options for achieving NC’s clean energy vision.
July 24, Raleigh
Activities:1. Workshop #6: Stakeholders share views and
prioritize ideas from Workshop 5
Milestones: stakeholders share their positions on key elements of NC’s Clean Energy Plan; elements of agreement and disagreement are identified
Recommendations: What policy or regulatory actions should be taken to achieve the clean energy vision?

Method 2: Regional Listening Sessions
11
• Statewide outreach events will be organized in metropolitan and rural areas to collect information and provide input on this effort.
• Attendees will be shown pre-recorded segments of the facilitated workshops and asked specific questions to obtain feedback.
• All stakeholders are welcome to attend.Sessions scheduled from March –May in:
Charlotte AshevilleRocky Mount WilmingtonHickory FayettevilleElizabeth City Wilmington
Dates and locations posted at https://deq.nc.gov/cleanenergy

Method 3: Other Statewide Events
12
• Short presentations or organized events will be held at other planned conferences, events or meetings.
• Audience feedback will be obtained.
April 302019 State Energy Conference
North Carolina State University, Raleigh

Method 4: Online Input
13
• The online public comment period for the N.C. Clean Energy Plan will run from February 25 - July 24, 2019
• Public will be invited to submit written comments related to achieving the stated vision.
• Public may also submit responses to online questions corresponding to facilitated workshop events.

Anticipated Timeline
14
• Jan. 2019 – Feb. 2019: Strategy Development and Technical Analysis Planning
• Feb. 2019 – July 2019: Workshops and Listening Sessions
• June 2019 – July 2019: Draft plan development
• Aug. 2019: Public comment on draft plan
• Sep. 2019: Revised plan reviewed and approved by the Climate Council
• Oct. 1, 2019: Final plan submitted to the Governor

Contacts• Technical and Plan Development
Sushma [email protected]
• Administrative, Website, and CommunicationSharon [email protected]

Objectives
Enable stakeholders to engage with others in the room and share perspectives on their vision for North Carolina’s clean, reliable, and affordable and equitable energy future
Review the current state of North Carolina's electricity system, including the state's current and expected generation mix, existing regulations and policies, and the markets and programs available to support clean energy technologies and related economic growth opportunities
Build a shared understanding of what regulatory and policy structures are supporting procurement of clean energy resources and which are not
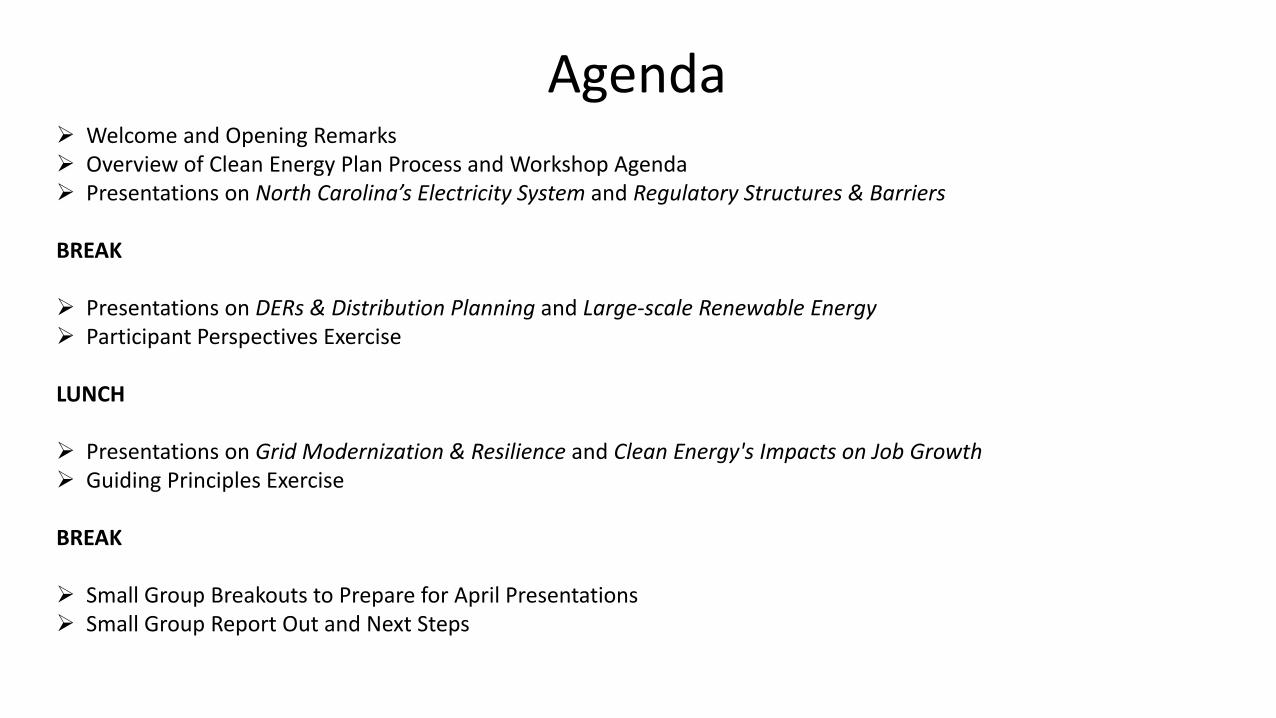
Agenda Welcome and Opening Remarks Overview of Clean Energy Plan Process and Workshop Agenda Presentations on North Carolina’s Electricity System and Regulatory Structures & Barriers
BREAK
Presentations on DERs & Distribution Planning and Large-scale Renewable Energy Participant Perspectives Exercise
LUNCH
Presentations on Grid Modernization & Resilience and Clean Energy's Impacts on Job Growth Guiding Principles Exercise
BREAK
Small Group Breakouts to Prepare for April Presentations Small Group Report Out and Next Steps
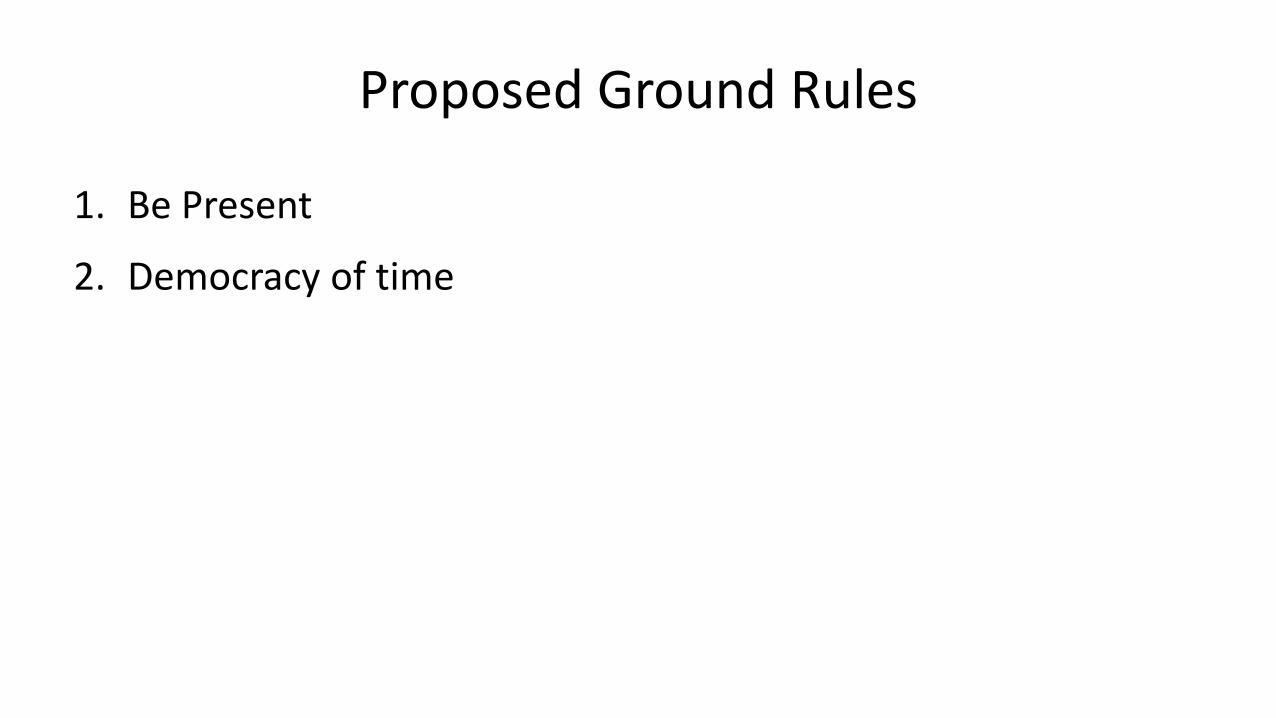
Proposed Ground Rules
1. Be Present
2. Democracy of time

Check In
In one sentence, what would make this process successful?
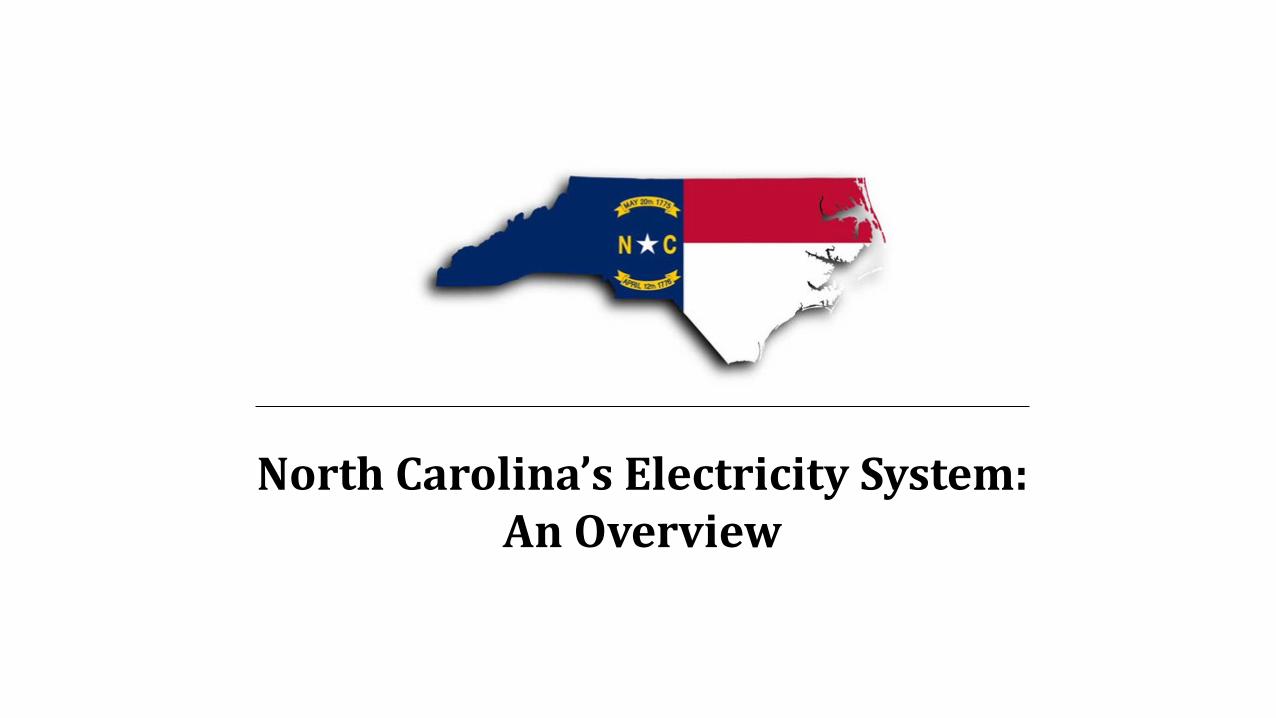
North Carolina’s Electricity System:An Overview

Generation Trends, 2000 - 2017
0
10,000
20,000
30,000
40,000
50,000
60,000
70,000
80,000
90,000
2000 2001 2002 2003 2004 2005 2006 2006 2007 2008 2009 2010 2011 2012 2013 2014 2015 2016 2017
Thou
sand
s
North Carolina Net Generation(thousand MWh)
Coal Hydroelectric Natural gas Nuclear Wood + biomass Solar + Wind
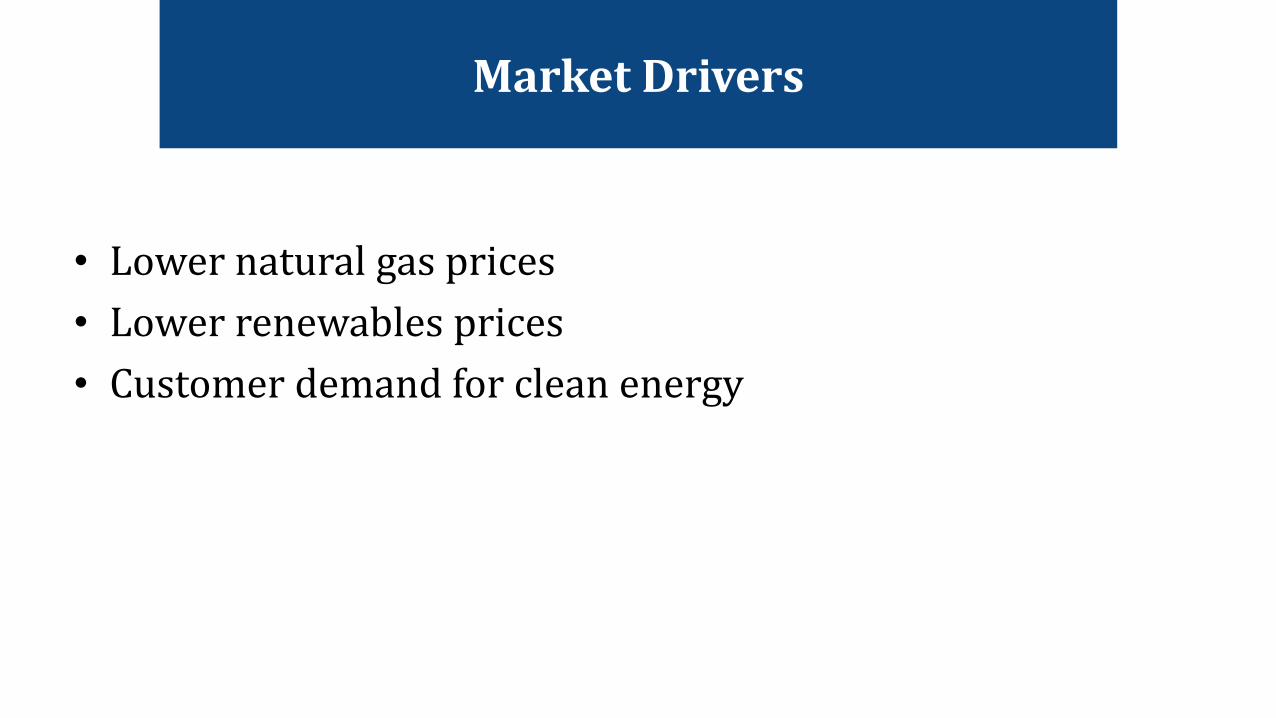
Market Drivers
• Lower natural gas prices• Lower renewables prices• Customer demand for clean energy

Market Drivers: Example
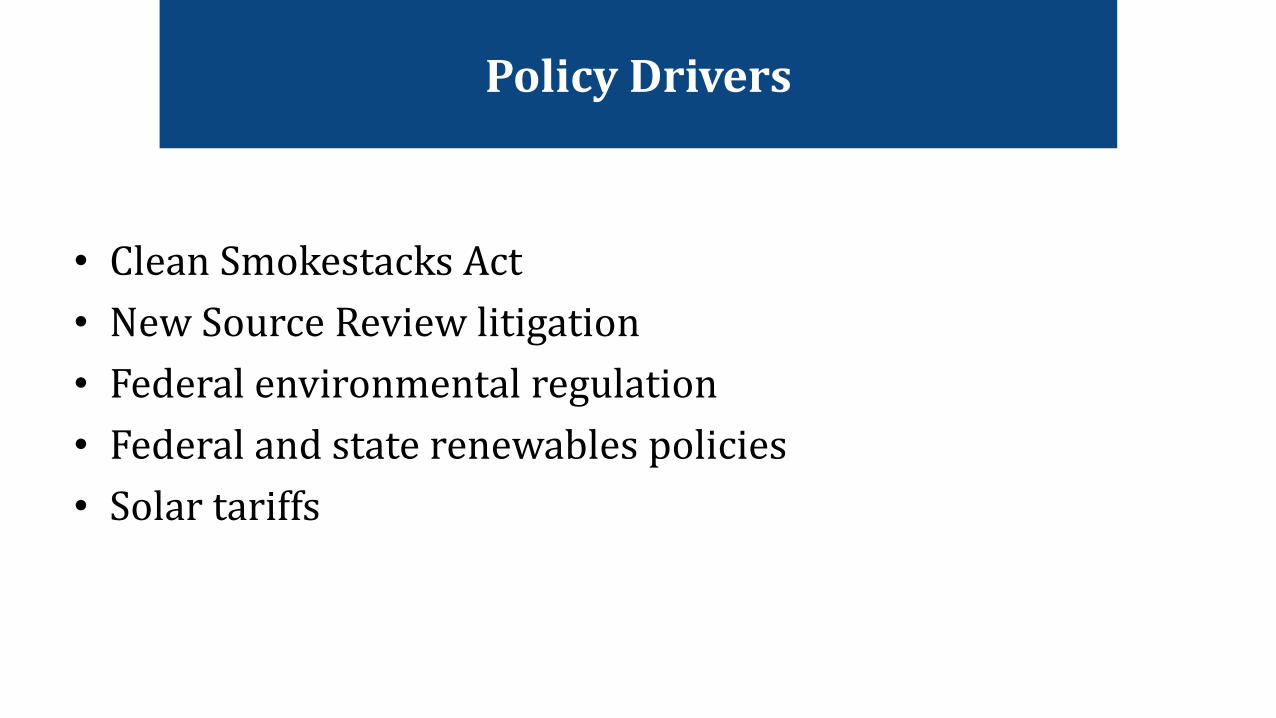
Policy Drivers
• Clean Smokestacks Act• New Source Review litigation• Federal environmental regulation• Federal and state renewables policies• Solar tariffs

Emissions Trends, 2000 - 2017
Source: EIA
0
10,000
20,000
30,000
40,000
50,000
60,000
70,000
80,000
90,000
0
100,000
200,000
300,000
400,000
500,000
600,000
Met
ric T
ons
Shor
t Ton
s
North Carolina Power Sector Emissions
Sulfur dioxide (short tons) Nitrogen oxide (short tons) Carbon dioxide (metric tons)
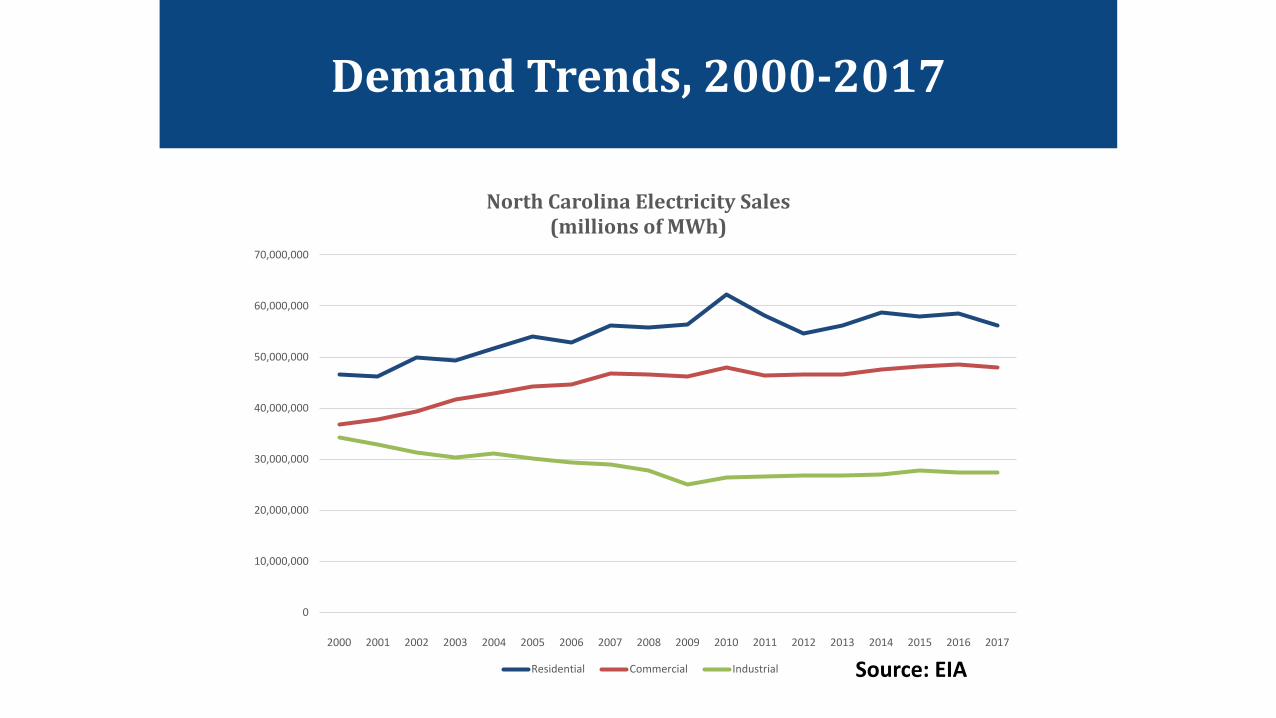
Demand Trends, 2000-2017
Source: EIA
0
10,000,000
20,000,000
30,000,000
40,000,000
50,000,000
60,000,000
70,000,000
2000 2001 2002 2003 2004 2005 2006 2007 2008 2009 2010 2011 2012 2013 2014 2015 2016 2017
North Carolina Electricity Sales (millions of MWh)
Residential Commercial Industrial

Energy Efficiency
Source: EIA

NC Electricity Rates and Bills
• Average residential rates: 10.94 cents/kWh (#41 in the US)• Average residential consumption: 1,042 kWh/month (#12
in the US)• Average monthly bill: $114 (#25 in the US)

Where are we Headed?

2017-2040: BAU
0
2,000
4,000
6,000
8,000
10,000
12,000
14,000
2017 2025 2030 2035 2040
North Carolina Capacity Projections
Coal Hydroelectric Natural gas - CC Natural gas - CT
Nuclear Wind Solar Wood + biomass

2017-2040: BAU
0
2,000
4,000
6,000
8,000
10,000
12,000
14,000
Coal Hydroelectric Natural gas - CC Natural gas - CT Nuclear Wind Solar Wood + biomass
North Carolina Capacity Projections
2017 2025 2030 2035 2040
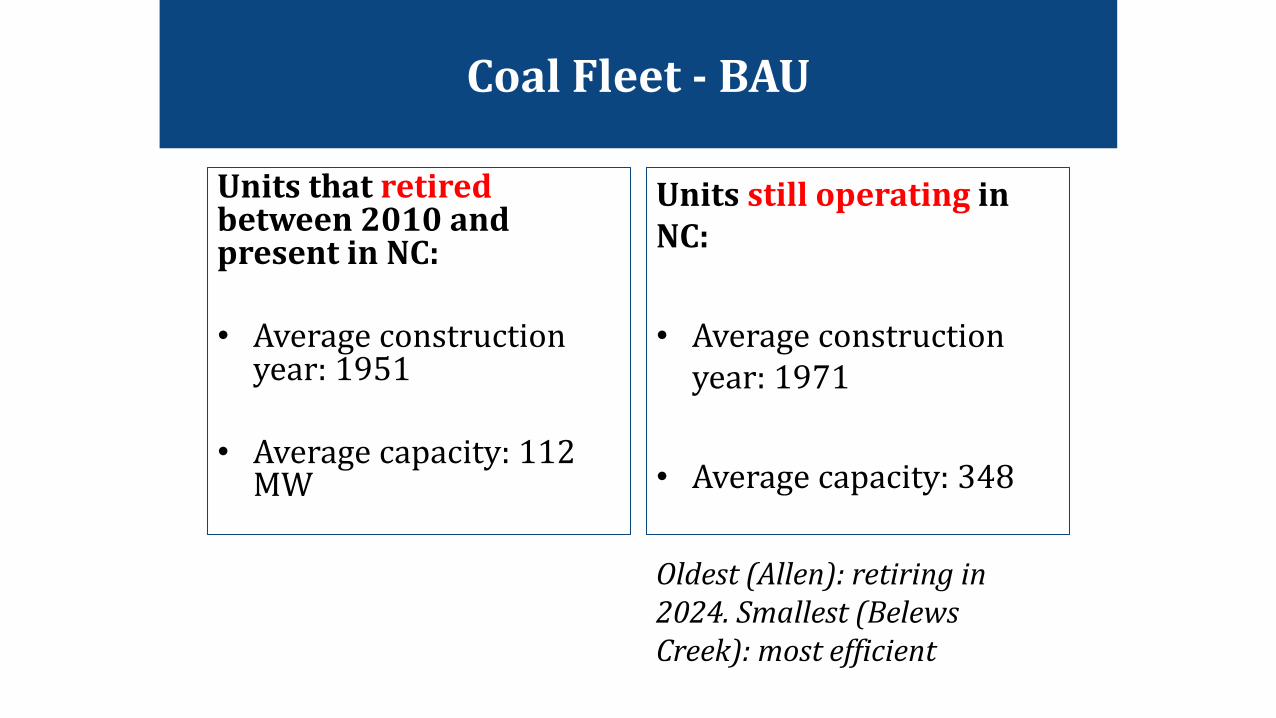
Coal Fleet - BAU
Units that retiredbetween 2010 and present in NC:
• Average construction year: 1951
• Average capacity: 112 MW
Units still operating in NC:
• Average construction year: 1971
• Average capacity: 348
Oldest (Allen): retiring in 2024. Smallest (BelewsCreek): most efficient

Nuclear Fleet - BAU

Renewables - BAU
• HB 589 – 2,660 MW over 45 months• Ongoing RPS compliance
“[I]nvesting in wind inside of DEP’s footprint may be challenging in the short term, primarily due to a lack of suitable sites, permitting challenges, and more modest capital cost declines relative to other renewable technologies like solar.” – 2018 IRP

Storage – BAU
North Carolina Projected Storage Capacity
Technology 2017 2025 2030 2035 2040Battery Storage 1 246 291 291 291Pumped Storage 68 68 68 68 68

Three Trends to Watch in Electricity
Customer-Sited Solar & Storage
Big Data & The Internet of Things
Performance-Based Ratemaking

Clean Energy Plan Stakeholder Workshop
Regulatory Structures and Barriers
Jonas MonastUniversity of North Carolina School of Law
Feb. 25, 2019

Source: carolinacountry.com

N.C. Electric Power Providers
Duke Energy Carolinas
• 1.5 million customers
• Summer generation capacity: 12.8 GW
• 2.5 million customers (~1.8 million in N.C.)
• Summer generation capacity: 19.6 GW
Duke Energy Progress
Electric Cooperatives• 1 million
customers• 26 member
cooperatives• NCEMC owns
1.4 GW and purchases 2.1 GW
Municipal Systems
• 70 NC communities (500,000 customers)
Dominion
• 120,000 customers in NC
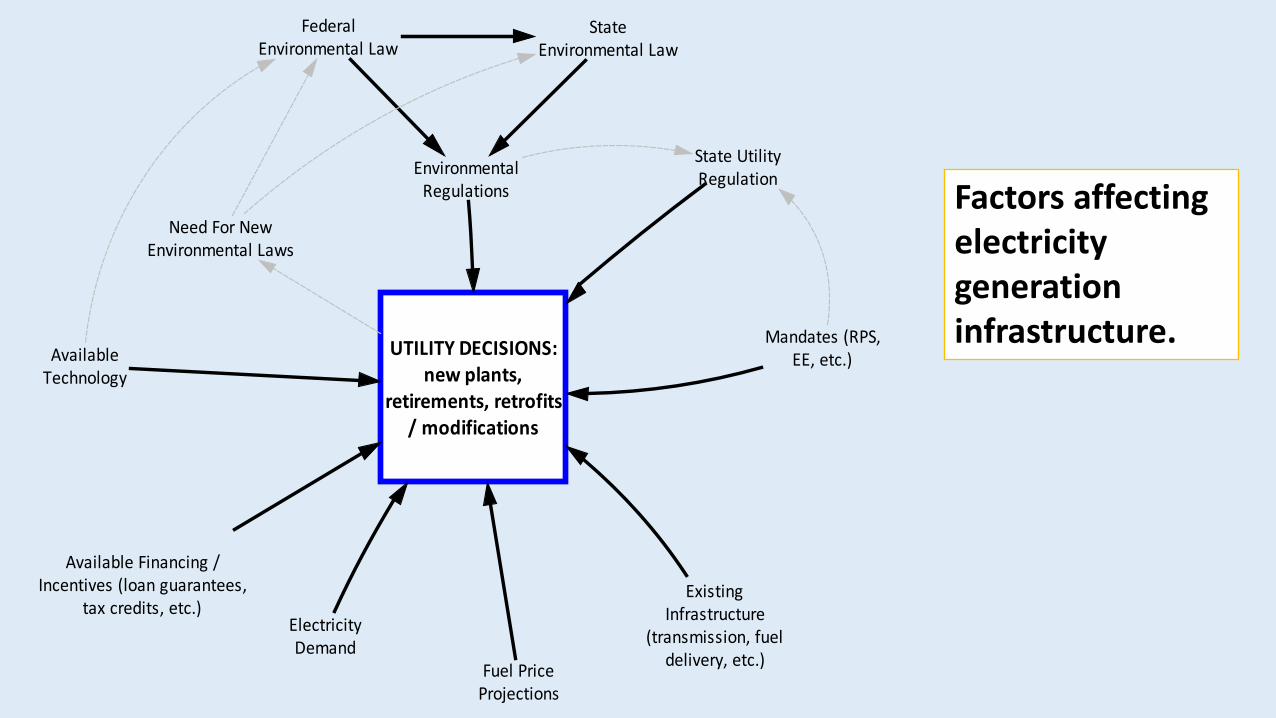
UTILITY DECISIONS:new plants,
retirements, retrofits/ modifications
ExistingInfrastructure
(transmission, fueldelivery, etc.)Fuel Price
Projections
ElectricityDemand
AvailableTechnology
FederalEnvironmental Law
EnvironmentalRegulations
StateEnvironmental Law
Mandates (RPS,EE, etc.)
State UtilityRegulation
Available Financing /Incentives (loan guarantees,
tax credits, etc.)
Need For NewEnvironmental Laws
Factors affecting electricity generation infrastructure.
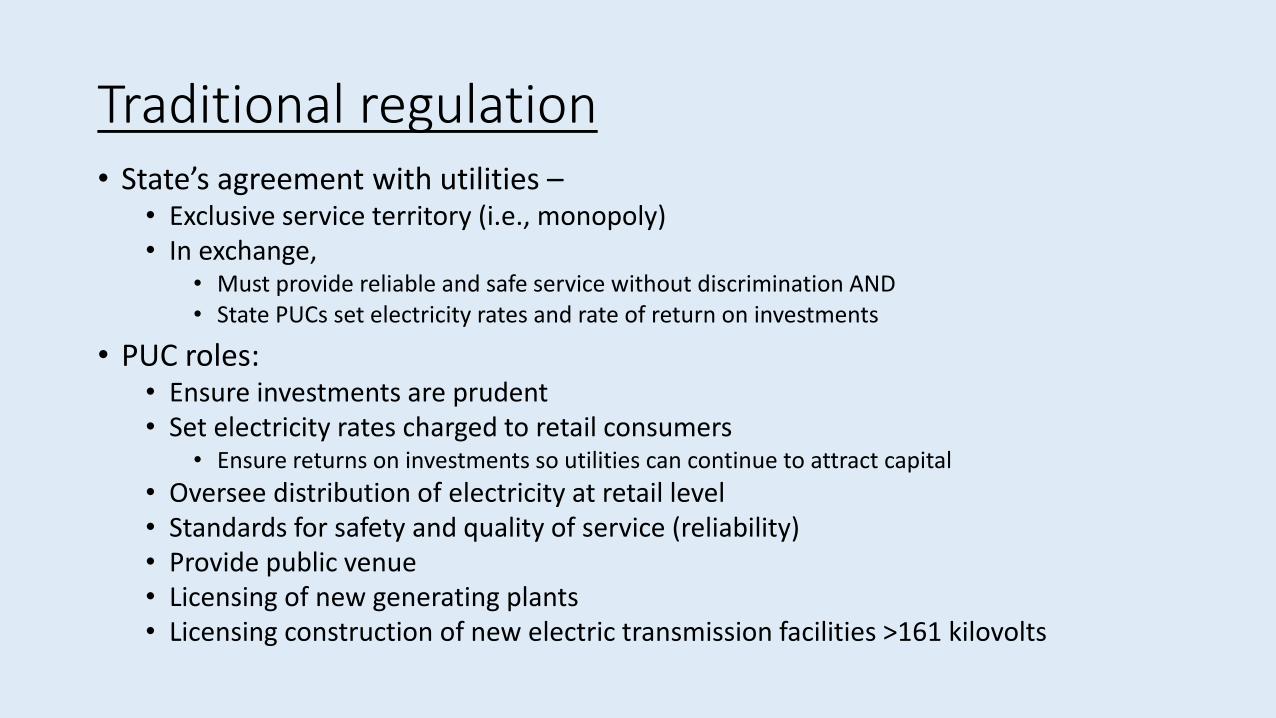
Traditional regulation• State’s agreement with utilities –
• Exclusive service territory (i.e., monopoly) • In exchange,
• Must provide reliable and safe service without discrimination AND• State PUCs set electricity rates and rate of return on investments
• PUC roles:• Ensure investments are prudent• Set electricity rates charged to retail consumers
• Ensure returns on investments so utilities can continue to attract capital• Oversee distribution of electricity at retail level• Standards for safety and quality of service (reliability)• Provide public venue• Licensing of new generating plants • Licensing construction of new electric transmission facilities >161 kilovolts

PUC Structure and Process
• NCUC• NC PUC is an independent body
• 7 Commissioners• Public staff (consumer advocate)• PUC hears rate cases• Investor-owned utilities submit annual IRPs (integrated resource plans)
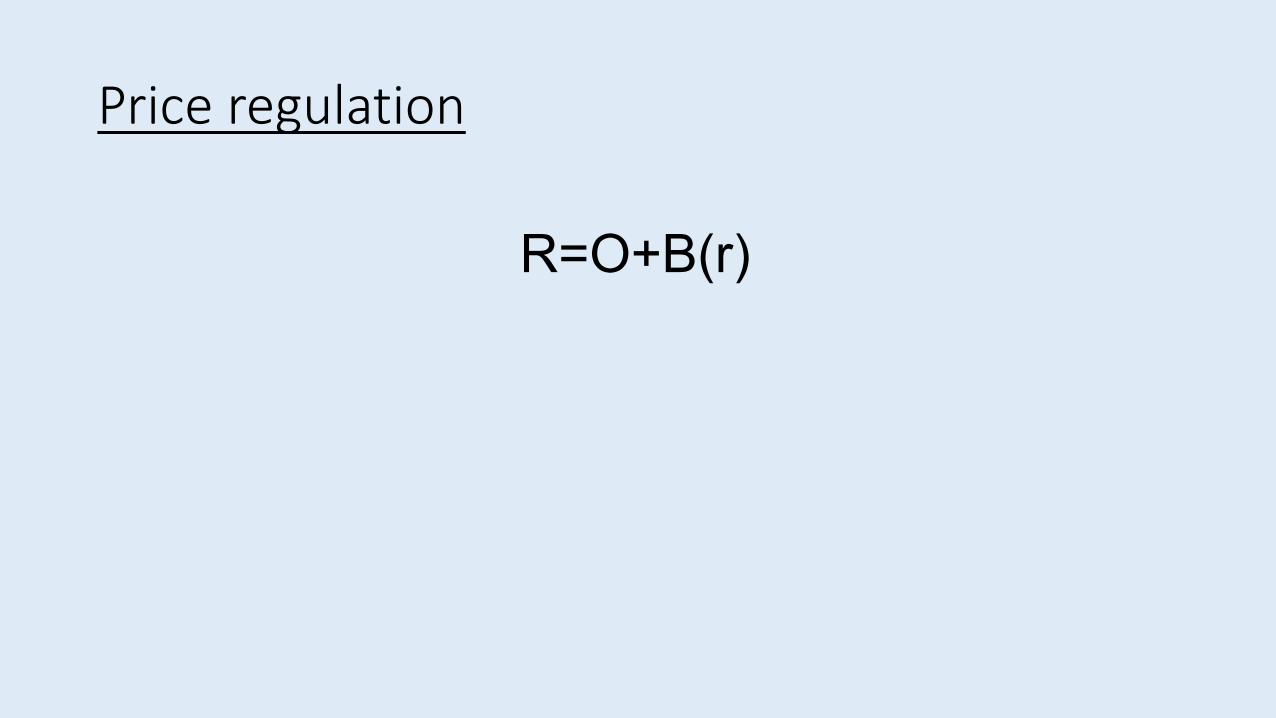
Price regulation
R=O+B(r)

Price regulation
R=O+B(r)
Revenue

Price regulation
R=O+B(r)
Revenue
Operating Expenses (variable)• Ex. - Fuel costs

Price regulation
R=O+B(r)
Revenue
Operating Expenses (variable)• Ex. - Fuel costs• Labor
Rate Base (fixed costs)• Capital costs• (Book refers to
this as (V-D), p182)

Price regulation
R=O+B(r)
Revenue
Operating Expenses (variable)• Ex. - Fuel costs• Labor
Rate Base (fixed costs)• Capital costs
Rate of Return

Policies Impacting Clean Energy Investments
• PURPA• HB 589• Environmental regulations• Market competition

Distributed Energy Resources & Distribution Planning
Steve Kalland Executive Director
NC Clean Energy Technology [email protected]

Major ProgramAreas:• Renewable Energy• Clean Power & Energy
Efficiency• CleanTransportation• GreenBuilding• EconomicDevelopment• EnergyPolicy• Workforce Development• Education & Outreach
MissionThe North Carolina Clean Energy Technology Center advances
a sustainable energy economy by educating, demonstrating andproviding support for clean energy technologies, practices, andpolicies.
https://nccleantech.ncsu.edu

Distributed EnergyResources• Distributed Energy Resources (“DER”) – Small electrical generators
connected to the distribution system at lower voltage levels, typically under 10 MW but generally smaller, not usually scheduled by anRTO or ISO and often located close to customers’premises
Examples of DERinclude:• SolarPV• Combined Heat & Power• EnergyStorage• Small-Scale Wind• Microgrids• DemandResponse• Electric Vehicles
Source: NARUC Manual on DER Rate Design & Compensation
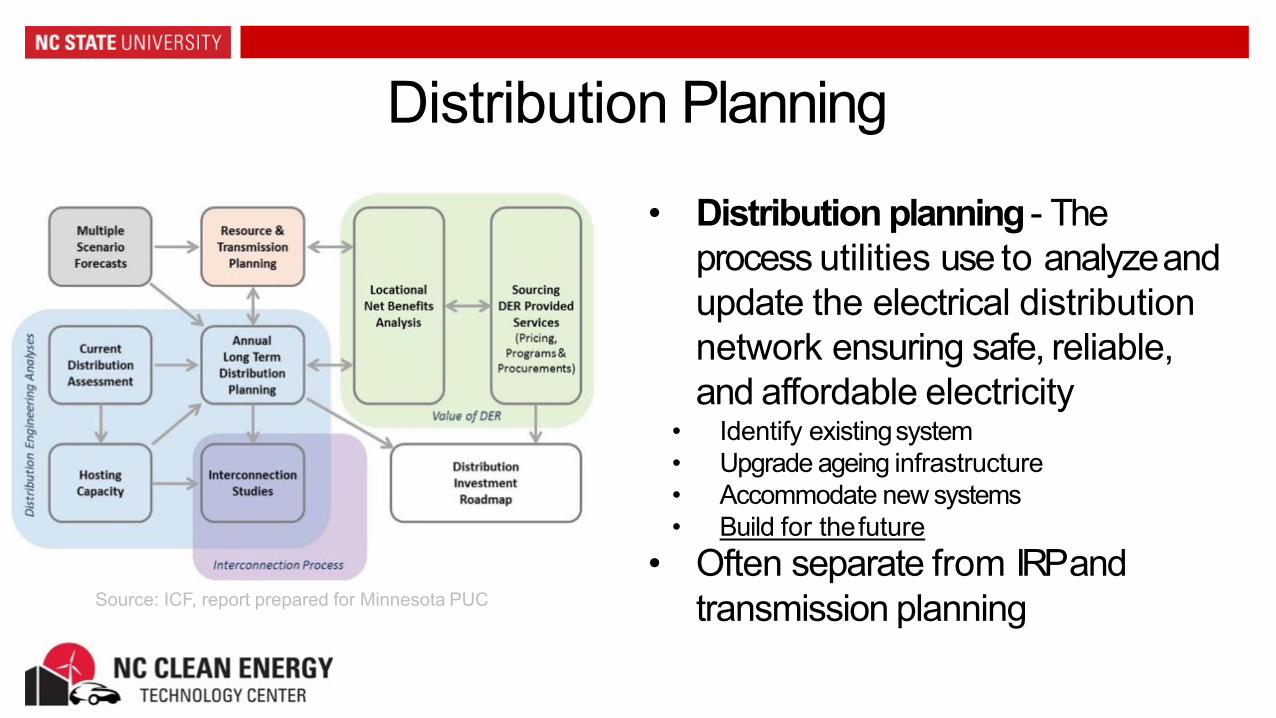
Distribution Planning
• Distribution planning - The process utilities use to analyzeand update the electrical distribution network ensuring safe, reliable, and affordable electricity
• Identify existingsystem• Upgrade ageing infrastructure• Accommodate new systems• Build for thefuture
• Often separate from IRP and transmission planningSource: ICF, report prepared for Minnesota PUC

Value of DER to North CarolinaGridDER can represent an important “non-wires” alternative• Customer-sited renewable energy
production• Energy storage for peakdemand• Energy resilience for critical
infrastructure• Ancillary services; voltage support,
frequency response
Source: IPS solar
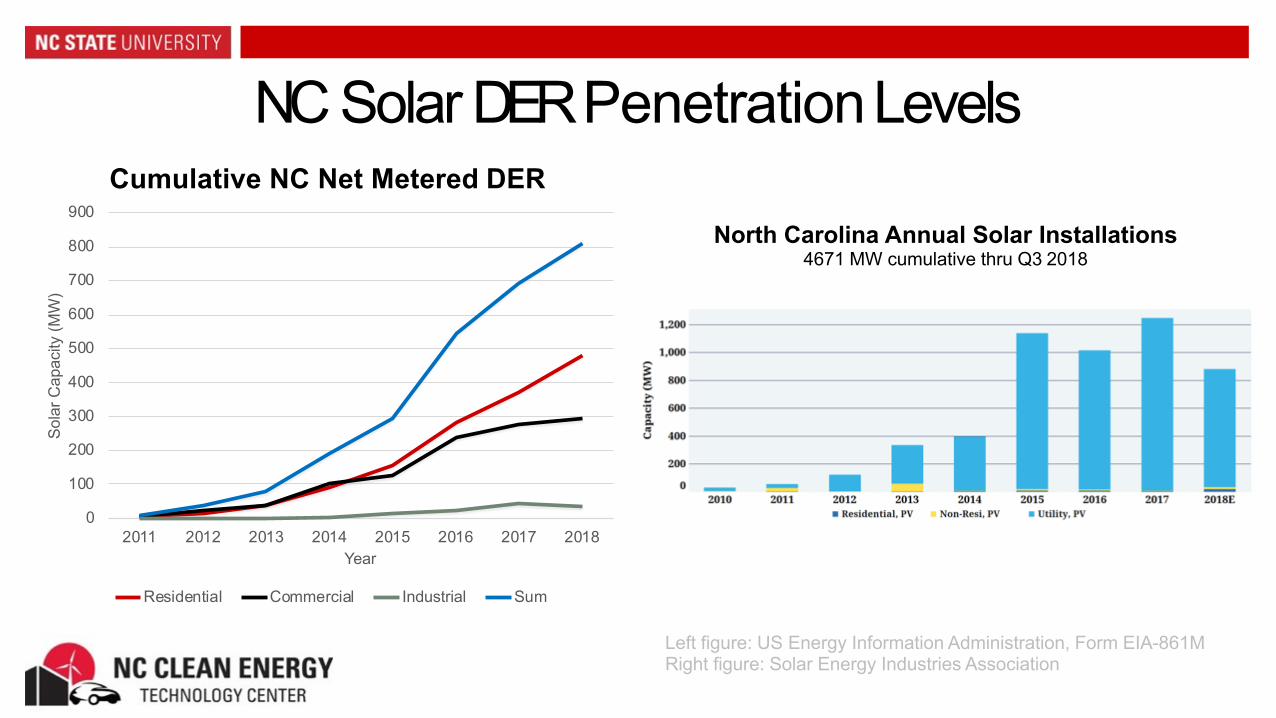
NC Solar DER PenetrationLevels
Left figure: US Energy Information Administration, Form EIA-861M Right figure: Solar Energy Industries Association
North Carolina Annual Solar Installations4671 MW cumulative thru Q3 2018
0
100
200
300
400
500
600
700
800
900
2011 2012 2013 2014 2015 2016 2017 2018
Sola
rCap
acity
(MW
)
Year
Cumulative NC Net Metered DER
Residential Commercial Industrial Sum

Policies Supporting DER in NC• Business Energy Investment Tax Credit – Federal ITC of 30% in 2019,
reducing to 10% in 2022• 35% state ITC expired at the end of 2015
• Public Utility Regulatory Policies Act (PURPA) Standard Offer – Standard avoided cost rates for small renewable and CHP generators up to 1 MW (was available for systems up to 5 MW prior to enactment of HB589 (2017))
• NC Renewable Energy and Energy Efficiency Portfolio Standard (REPS)• Investor-owned utilities required to achieve 12.5% renewables by2021• Municipal utilities & co-ops required toachieve 10% by 2018

Policies Supporting DER in NC• Net Metering – NC investor-owned utilities offer full retail netmetering for
renewable energy consumed on site, allowable to 1 MW (NEG forfeited at end of 12 month netting period) (Most COOP & Muni’s don’t offer net metering, some offer net billing)
• Property tax abatement – 80% abatement on the property’s added value for PVsolar
• Duke Energy Solar Rebate – HB 589 directed Duke to offer rebates for residential, business, and non-profits (The program has been fully committed for the residential and businessrebates in less than 2 weeks each of the yearsoffered)

Other Factors Assisting DERGrowth
• Declining cost of solarPV• Increasing cost of electricity• Customer interest in renewable
energy, CHP, and other DER technologies
• Homeowners: Independence, reliability, bill savings, andsustainability
• Cities: Local climate & sustainabilitycommitment, resiliency, andcost
• Companies/Businesses: Sustainability goals, financial advantages, reliability
Source: US Energy Information Administration, Form EIA-861M
US Installed DER (2016)

Limiting Factors Affecting DER Growth inNC• Low avoided cost rates based on peaker methodology• Lower PURPA standard offer size limit, contract length, and capacity credits• Interconnection queue and fees• Policy uncertainty
• Lack of clear energy storagepolicies• Net metering uncertainty• Lack of regulatory clarity for EV chargingstations• Tax credit expiration & rebatecap
• Homeowner association restrictions on solar installation
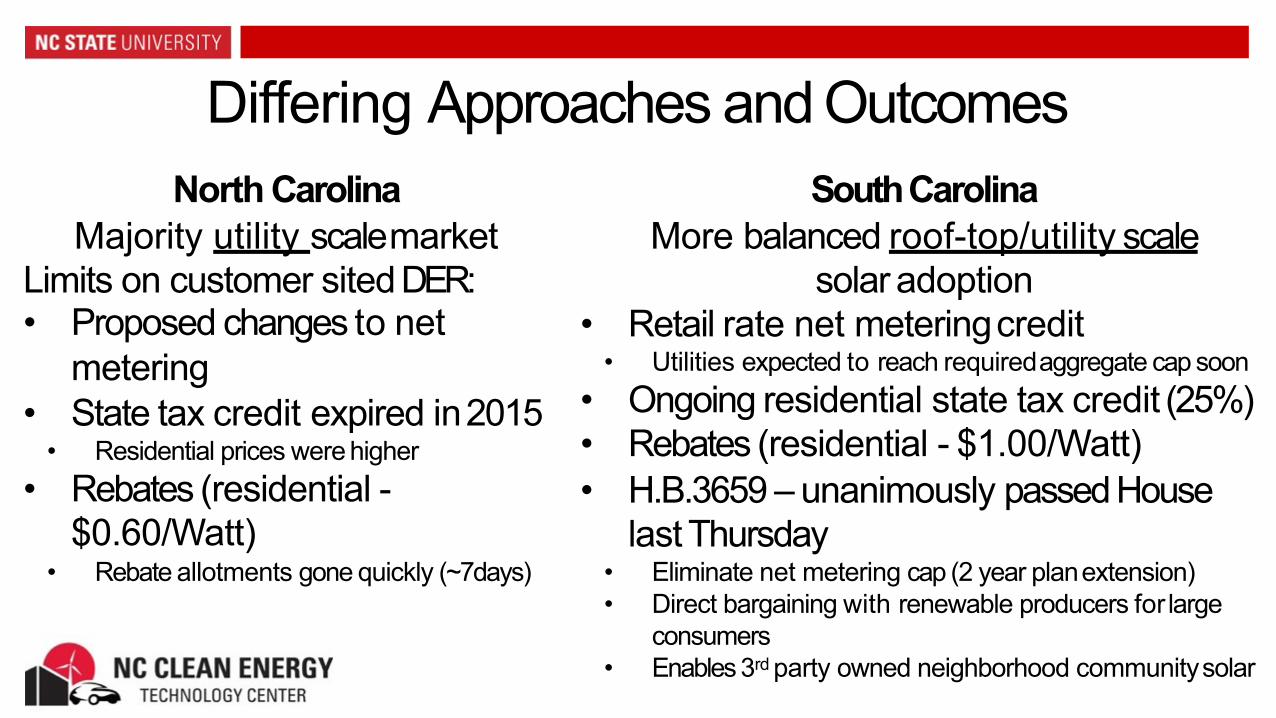
Differing Approaches and OutcomesSouthCarolina
More balanced roof-top/utility scale solar adoption
• Retail rate net meteringcredit• Utilities expected to reach requiredaggregate cap soon
• Ongoing residential state tax credit (25%)• Rebates (residential - $1.00/Watt)• H.B.3659 – unanimously passed House
last Thursday• Eliminate net metering cap (2 year planextension)• Direct bargaining with renewable producers for large
consumers• Enables 3rd party owned neighborhood communitysolar
North CarolinaMajority utility scalemarket
Limits on customer sitedDER:• Proposed changes to net
metering• State tax credit expired in2015
• Residential prices were higher• Rebates (residential -
$0.60/Watt)• Rebate allotments gone quickly (~7days)

DER Interconnection Process• The North Carolina Utilities Commission
adopted interconnection standards for distributed generation in 2005*
• Updated in 2008 and 2015: AdoptedFERC-like requirements
• Process:1. File Request & Pay fee (>20kWQueue)2. Documentation submittal & Engineering3. Interconnection Agreement (>20kW)4. Construction5. Testing6. Connection
Requirements differ by generator size andvoltage:• < 20 kW - Inverter simplifiedprocess• 20 kW-2 MW – Fast track eligible• > 2 MW (or fast track disqualified systems)–
Study on grid impactrequired
Fast Track Eligibility for Inverter-BasedSystems
LineVoltage
Fast Track Eligibility Regardless of Location
Fast Track Eligibility on a Mainline2and≤ 2.5 ElectricalCircuit Miles from Substation3
< 5 kV ≤100kW ≤500kW
≥ 5 kV & < 15 kV ≤1MW ≤2MW
≥ 15 kV & < 35 kV ≤2MW ≤2MW*Exempting municipalities and coops

Queue Issues (Utility Scale)• Queue length issues
• “First in first out” method led to large number of filings toobtain a better position
• Large number of applications(100’s/year)• Long wait for approval
• Changes to queue• Increased engineers reviewing submissions• Implementation/increase of fee toreduce
place holder filings• Extension of system reviewtime• Priority for swine waste toenergy projects• Current open Docket on changesto
interconnect
Source: DEP Docket E-100, Sub 101Afiling

NC Distribution PlanningProgressNC electrical grid ischanging:• Net additions of DER growingfaster
than centralized generation• Competitive Procurement of
Renewable Energy requirements (CPRE)
• questions regarding PURPAcompliance• Energy storage study completed• Duke Study identified transmission
regions constrained by additionallarge scale DERgeneration
Responses to these changes:Duke’s proposed Grid Improvement plan includes (DERrelevant):
• Smart meter installation (Approved)• Integrated system operations planning (ISOP)• EV pilot program – charging rebate programs,
infrastructure development• Energy storage program – deferring line
investments and increasingreliability• T&D – system upgrades/improvements that
could enable DER wherenecessary• Customer data sharing and accesschanges
• Ongoing process requiring Utilities Commissionapproval

Data AccessRules• Customer Energy Usage Data:
• Commission Rule R8-51 - Requires investor-owned utilities to providebilling information upon request, nothing requiring release to 3rd parties
• Docket E-100 Sub147 directed utilities to provide information on release of data to 3rdparty
• Grid modernization report referenced Green Button organization•Docket E-100 Sub 161 newly opened to address rule making around customer data access as requested by the PublicStaff
• System-WideData:• No existing rules in NC requiring utilities to provide access tosystem data• Data transparency at this level in many other states is highly supportive to DERand
ensures installations at themost valuable grid locations
Source: ACEEE State and Local Policy Database & energy.gov

KeyObservations• DER will continue to expand both in NC and the US, offering opportunities and
presenting hurdles• Can provide a competitive energy market, keeping costsdown• Can increase reliability, resilience, and grid balancing• Complicates grid infrastructure andmanagement• Can reduced carbon intensity of electricity
• Distribution system planning would enable more accurate location valuationof all DERresources
• Timing of the interconnection process is hindering deployment of DER and potentially economicdevelopment
• Greater transparency in distribution system planning has supported morecost effective DER deployment in otherstates
• Many DER stakeholders are actively asking for transparency

North Carolina’s electricity system as it is now…
Stakholder Perspectives

Robert Cox, Ph.D.EPIC Assistant Director
Topic 5: Grid Modernization and Resilience

What is Grid Modernization?
Greater RESILIENCE to hazards of all types
Improved RELIABILITY for everyday operations
Enhanced SECURITY from an increasing and evolving number of threats
Additional AFFORDABILITY to maintain our economic prosperity
Superior FLEXIBILITY to respond to the variability and uncertainty of conditions at one or more timescales, including a range of energy futures
Increased SUSTAINABILITY through energy-efficient and renewable resources
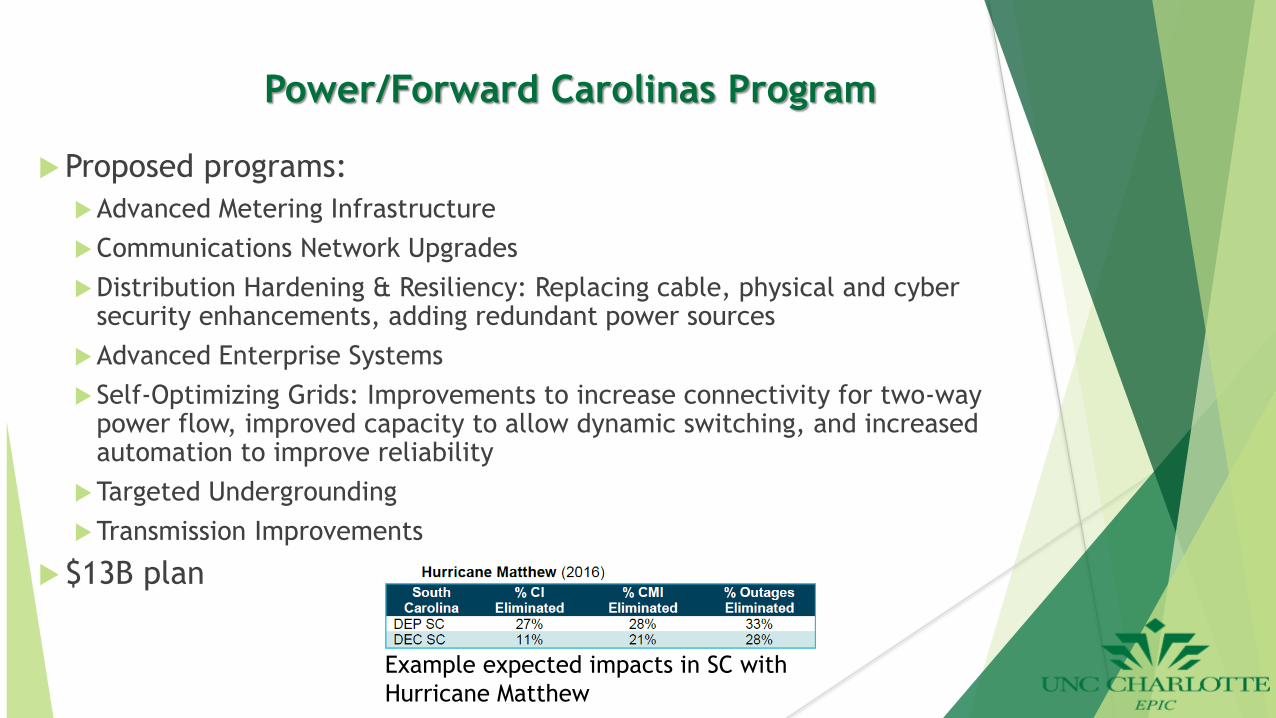
Power/Forward Carolinas Program
Proposed programs:Advanced Metering InfrastructureCommunications Network UpgradesDistribution Hardening & Resiliency: Replacing cable, physical and cyber
security enhancements, adding redundant power sourcesAdvanced Enterprise SystemsSelf-Optimizing Grids: Improvements to increase connectivity for two-way
power flow, improved capacity to allow dynamic switching, and increased automation to improve reliability
Targeted Undergrounding Transmission Improvements
$13B plan
Example expected impacts in SC with Hurricane Matthew
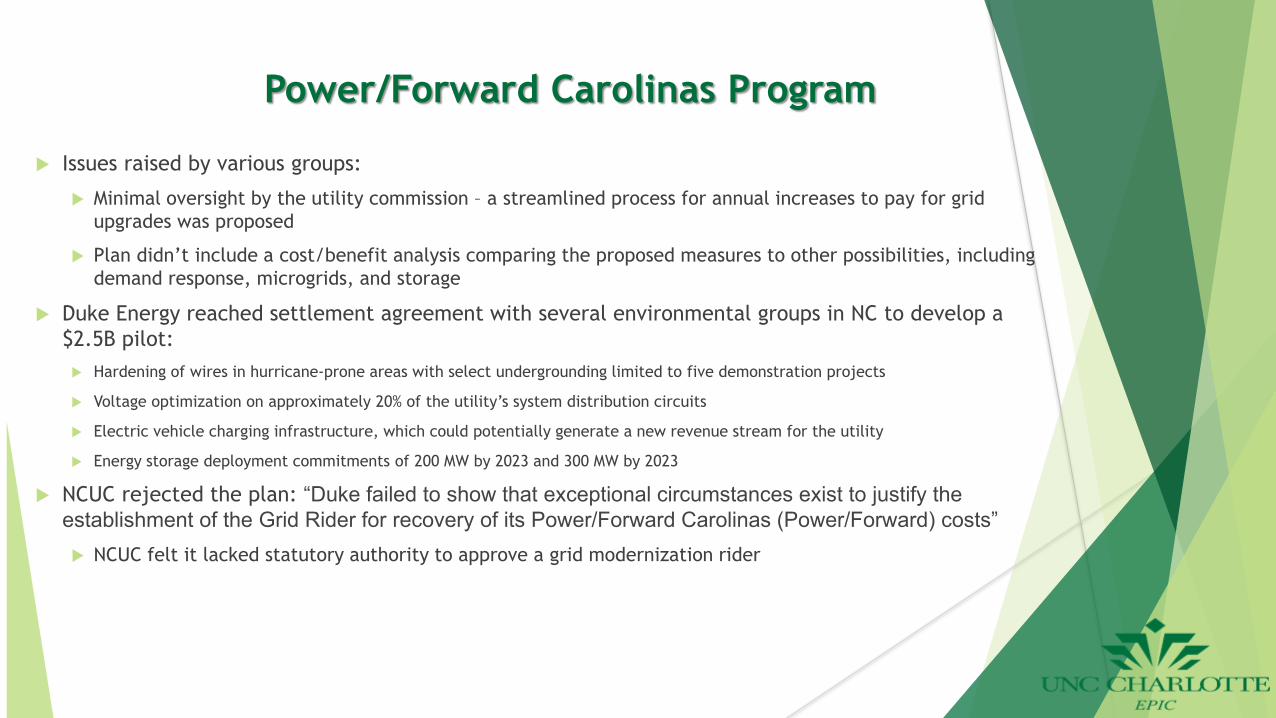
Power/Forward Carolinas Program
Issues raised by various groups:
Minimal oversight by the utility commission – a streamlined process for annual increases to pay for grid upgrades was proposed
Plan didn’t include a cost/benefit analysis comparing the proposed measures to other possibilities, including demand response, microgrids, and storage
Duke Energy reached settlement agreement with several environmental groups in NC to develop a $2.5B pilot: Hardening of wires in hurricane-prone areas with select undergrounding limited to five demonstration projects
Voltage optimization on approximately 20% of the utility’s system distribution circuits
Electric vehicle charging infrastructure, which could potentially generate a new revenue stream for the utility
Energy storage deployment commitments of 200 MW by 2023 and 300 MW by 2023
NCUC rejected the plan: “Duke failed to show that exceptional circumstances exist to justify the establishment of the Grid Rider for recovery of its Power/Forward Carolinas (Power/Forward) costs” NCUC felt it lacked statutory authority to approve a grid modernization rider
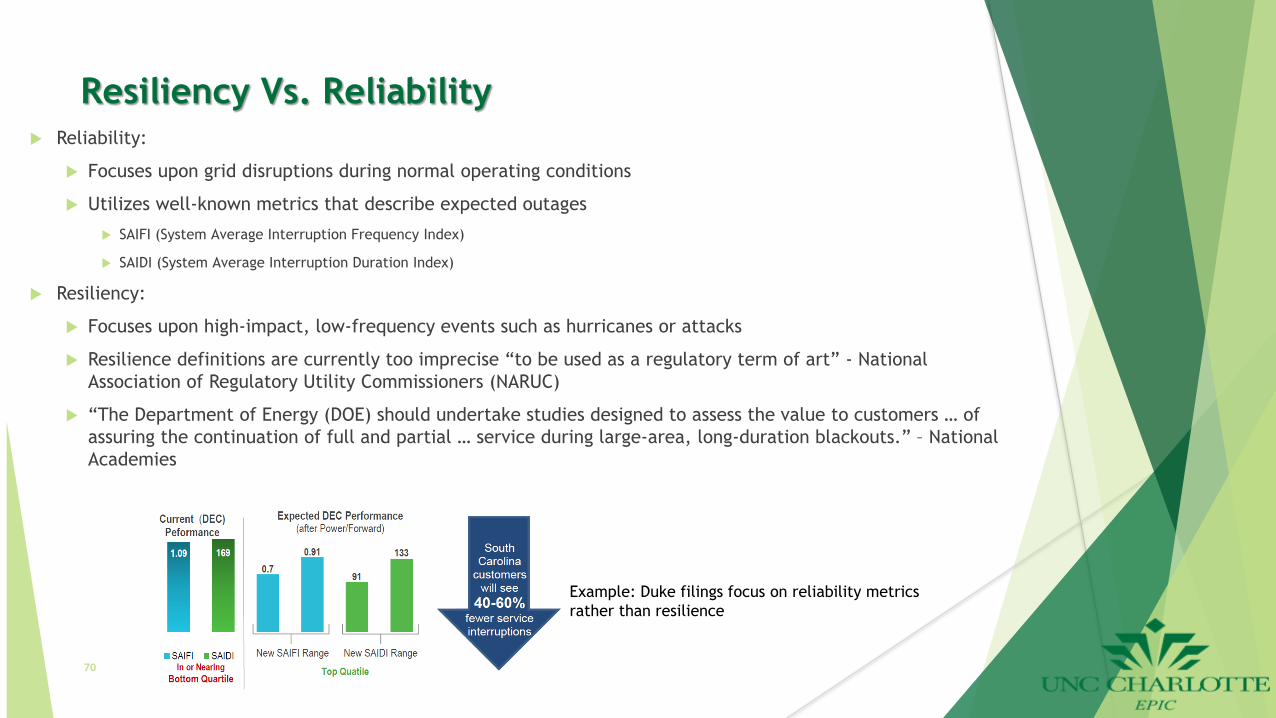
Resiliency Vs. Reliability Reliability:
Focuses upon grid disruptions during normal operating conditions
Utilizes well-known metrics that describe expected outages
SAIFI (System Average Interruption Frequency Index)
SAIDI (System Average Interruption Duration Index)
Resiliency:
Focuses upon high-impact, low-frequency events such as hurricanes or attacks
Resilience definitions are currently too imprecise “to be used as a regulatory term of art” - National Association of Regulatory Utility Commissioners (NARUC)
“The Department of Energy (DOE) should undertake studies designed to assess the value to customers … of assuring the continuation of full and partial … service during large-area, long-duration blackouts.” – National Academies
70
Example: Duke filings focus on reliability metrics rather than resilience
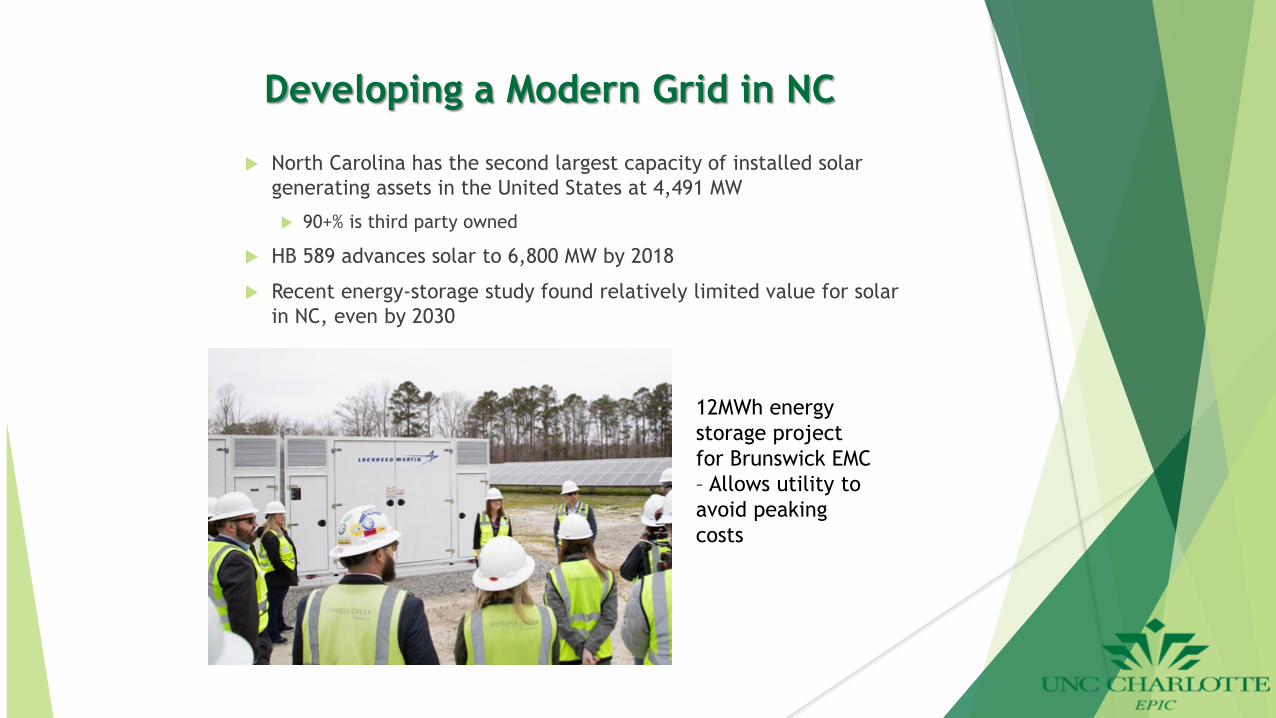
Developing a Modern Grid in NC
North Carolina has the second largest capacity of installed solar generating assets in the United States at 4,491 MW
90+% is third party owned
HB 589 advances solar to 6,800 MW by 2018
Recent energy-storage study found relatively limited value for solar in NC, even by 2030
12MWh energy storage project for Brunswick EMC – Allows utility to avoid peaking costs

Developing a Modern Grid
Storage is generally cost effective today for one of two reasons: Demand charge reduction in areas with high demand charges Where there is a viable market for the grid services they can provide
Resiliency can change the game for PV + energy storage: Example: Puerto Rico after Maria was described as “an epidemic of broken generators”
and diesel supply issues But, how do businesses and communities value the resiliency benefits?
NC has led the way in the development of PV for two reasons: Favorable implementation of PURPA Favorable renewable energy portfolio standard
Third-party asset owners don’t have incentive to add the energy storage in NC We risk falling behind Major area needing investigation – UNCC has partnered with third-party asset owners to
address this challenge in application for DOE ASSIST program
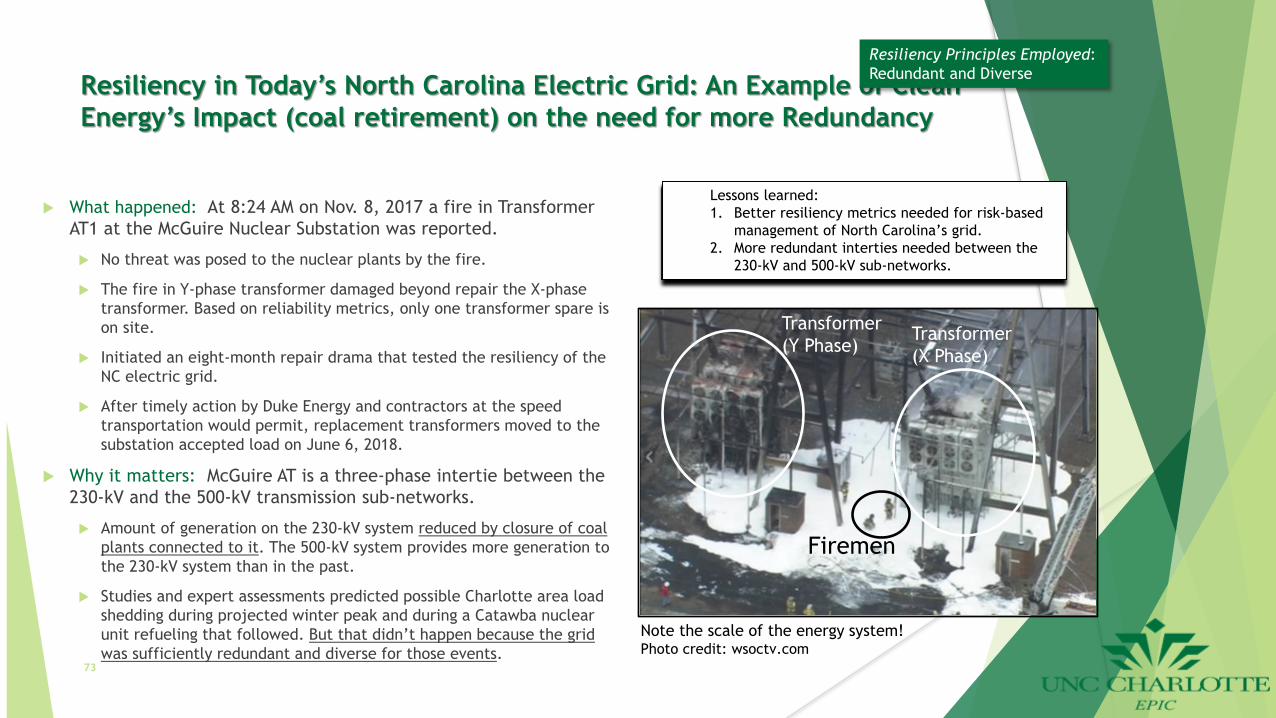
Resiliency in Today’s North Carolina Electric Grid: An Example of Clean Energy’s Impact (coal retirement) on the need for more Redundancy
What happened: At 8:24 AM on Nov. 8, 2017 a fire in Transformer AT1 at the McGuire Nuclear Substation was reported.
No threat was posed to the nuclear plants by the fire.
The fire in Y-phase transformer damaged beyond repair the X-phase transformer. Based on reliability metrics, only one transformer spare is on site.
Initiated an eight-month repair drama that tested the resiliency of the NC electric grid.
After timely action by Duke Energy and contractors at the speed transportation would permit, replacement transformers moved to the substation accepted load on June 6, 2018.
Why it matters: McGuire AT is a three-phase intertie between the 230-kV and the 500-kV transmission sub-networks.
Amount of generation on the 230-kV system reduced by closure of coal plants connected to it. The 500-kV system provides more generation to the 230-kV system than in the past.
Studies and expert assessments predicted possible Charlotte area load shedding during projected winter peak and during a Catawba nuclear unit refueling that followed. But that didn’t happen because the grid was sufficiently redundant and diverse for those events.
73
Note the scale of the energy system!Photo credit: wsoctv.com
Firemen
Transformer(X Phase)
Transformer(Y Phase)
Lessons learned: 1. Better resiliency metrics needed for risk-based
management of North Carolina’s grid.2. More redundant interties needed between the
230-kV and 500-kV sub-networks.
Resiliency Principles Employed: Redundant and Diverse

Resiliency in Tomorrow’s North Carolina Electric Grid: An Example of Clean Energy (PV + storage) contributing to improved service in Hot Springs, NC
What’s proposed: A microgrid that can island when the grid service is disrupted.
2 MW Solar + 4 MW/4 MWh Battery energy storage
Safe and coordinated transitions to island mode.
With islanding mode Hot Springs will have back-up power from a flexible and agile microgrid.
Economically and socially important to a community fed by single distribution feeder prone to being cut off from the grid.
Supports deferral of the future Asheville CT unit by freeing up generation capacity to serve winter peak.
Why it matters: Organizing NC’s 6800 MW of solar with storage, advanced relaying, self-optimizing distribution, etc. could enable a higher level of grid resiliency than ever before.
What could stop it?
Regulatory approval. Awaiting Certificate of Public Convenience and Necessity from NCUC
Economics. “We’re looking for these sorts of use cases where storage can be a more cost-effective solution, or in the case of the Hot Springs microgrid the only real solution.” Zachary Kuznar, Duke Energy’s director, CHP, microgrid and energy storage development 74
The North Carolina town, which has about 620 customers, is served by a single, 10-mile long, high-voltage line that subjects Hot Springs to “long-duration outage events due to its location in rugged mountain terrain” in adverse weather, says Jonathan Landy, a Duke business development manager.
By John Downey – Senior Staff Writer, Charlotte Business Journal
Resiliency Principles Employed: Flexible, Resourceful, and Agile

Current Issues
Resiliency, which deals with high-impact, low-frequency events, is difficult to accurately value
Resiliency investment does not fall neatly into the current IRP Process
We need to change the process and thinking around resiliency
The cost to society for weather-related outages is $25 to $70 billion (Congressional Research Service, 2012)
The cost to utilities to recover from Hurricane Katrina was less than $1B
Missing Link: The relationship between grid modernization and the resulting economic and social value of avoided lost economic output, reduced societal disruption, and reduced individual harm
75

Approaching Modernization Moving Forward
Need to address modernization efforts as an insurance policy for society overall, rather than through the traditional lens of utility cost-recovery for added generation and transmission
Resiliency metrics must consider the value of various investments:
Grid hardening
Redundancy and Adaptability
Decentralized resources enabled by the trend to clean energy alternatives: Renewable generation and storage
Microgrids for critical or hard to serve customers
Some regulatory / policy recommendations:
Follow the example of four states that already recognize nuclear as clean energy (Connecticut, Illinois, New Jersey, and New York). Pennsylvania is considering becoming the fifth state by including nuclear generation in their Alternative Energy Portfolio Standard. This will reduce pressure to close zero-carbon-emitting nuclear generation for reasons that are causing coal plants to decommission, which has negatively impacted grid resiliency.
Incentivize independent developers of PV + Storage projects similarly to independent PV developers who invested private capital to make North Carolina second in the nation in PV capacity.
Legislate authority for NCUC to authorize grid modernization riders.76

www.rti.orgRTI International is a registered trademark and a trade name of Research Triangle Institute.
Photo by njaj. Published on 18 July 2013. From freedigitalphotos.net
Economic and Rate Impact Analysis of Clean Energy Development in North Carolina
2017 Update
Jeffrey PetrusaCenter for Environmental, Technology and Energy Economics
February 25, 2019

Background
In 2007, North Carolina established the Renewable Energy and Energy Efficiency Portfolio Standard (REPS), the first of its kind in the Southeast.
REPS requires electric power suppliers to meet a increasing amount of retail consumers energy demand through a combination of renewable energy resources and reduced energy consumption.
RTI International performed an independent analysis of the economic impacts of clean energy development in NC associated with the REPS.

Objectives
Retrospective Economic Impact Analysis – Years 2007 to 2016– Analyze changes in consumer, utility and government spending.– Estimate the direct and indirect economic impacts of clean energy
development in North Carolina since 2007.

Key Findings
Total economic impact in NC from clean energy between 2007 and 2016 was $19.9 billion.
Approximately $10 billion investment in clean energy development over the same time period.
State incentives for clean energy was $611.7 million.
Clean energy development contributed $12.2 billion to gross state product between 2007 and 2016.
Supported 126,440 annual (FTE) full-time equivalents, in employment.

Economic Impact Methodology
Data Collection
•$$ in Renewables•$$ in Energy Efficiency
IMPLAN Model
•INPUT/OUT model of the regional economy
Economy-wide Impacts
•Direct impacts•Induced impacts•Indirect impacts

Clean Energy Investment in North Carolina, 2007-2016
Total clean energy investment = $10 billion Total state incentives = $612 million (~5% of investment)
$0.0
$500.0
$1,000.0
$1,500.0
$2,000.0
$2,500.0
$3,000.0
Inve
stm
ent
Ince
ntiv
es
Inve
stm
ent
Ince
ntiv
es
Inve
stm
ent
Ince
ntiv
es
Inve
stm
ent
Ince
ntiv
es
Inve
stm
ent
Ince
ntiv
es
Inve
stm
ent
Ince
ntiv
es
Inve
stm
ent
Ince
ntiv
es
Inve
stm
ent
Ince
ntiv
es
Inve
stm
ent
Ince
ntiv
es
Inve
stm
ent
Ince
ntiv
es
2007 2008 2009 2010 2011 2012 2013 2014 2015 2016
Mill
ion
(201
3$)
Renewable Energy Investment Energy Efficiency Investment State Incentives

Direct Spending in Clean Energy Development by Technology, 2007–2016
Solar photovoltaic, 84%
Biomass, 7%
Wind, 4%
Landfill gas, 2%Biogas fuel cell, 1%
Hydro, 1%
Solar thermal, 1%
Geothermal, 0%
Passive solar, 0%
Other, 3%
Renewable Energy Direct Investment = $8.8 billion

Distribution of Renewable Energy Projects Valued at > $1 Million across North Carolina Counties
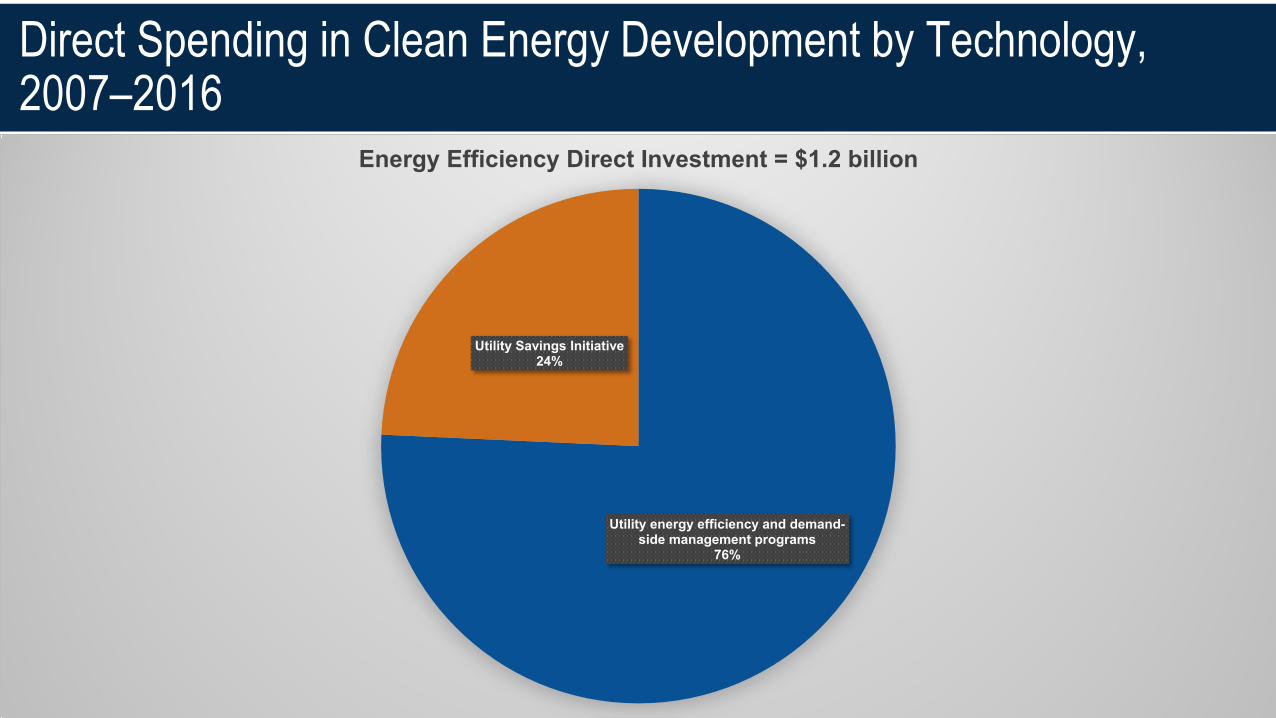
Direct Spending in Clean Energy Development by Technology, 2007–2016
Utility energy efficiency and demand-side management programs
76%
Utility Savings Initiative24%
Energy Efficiency Direct Investment = $1.2 billion
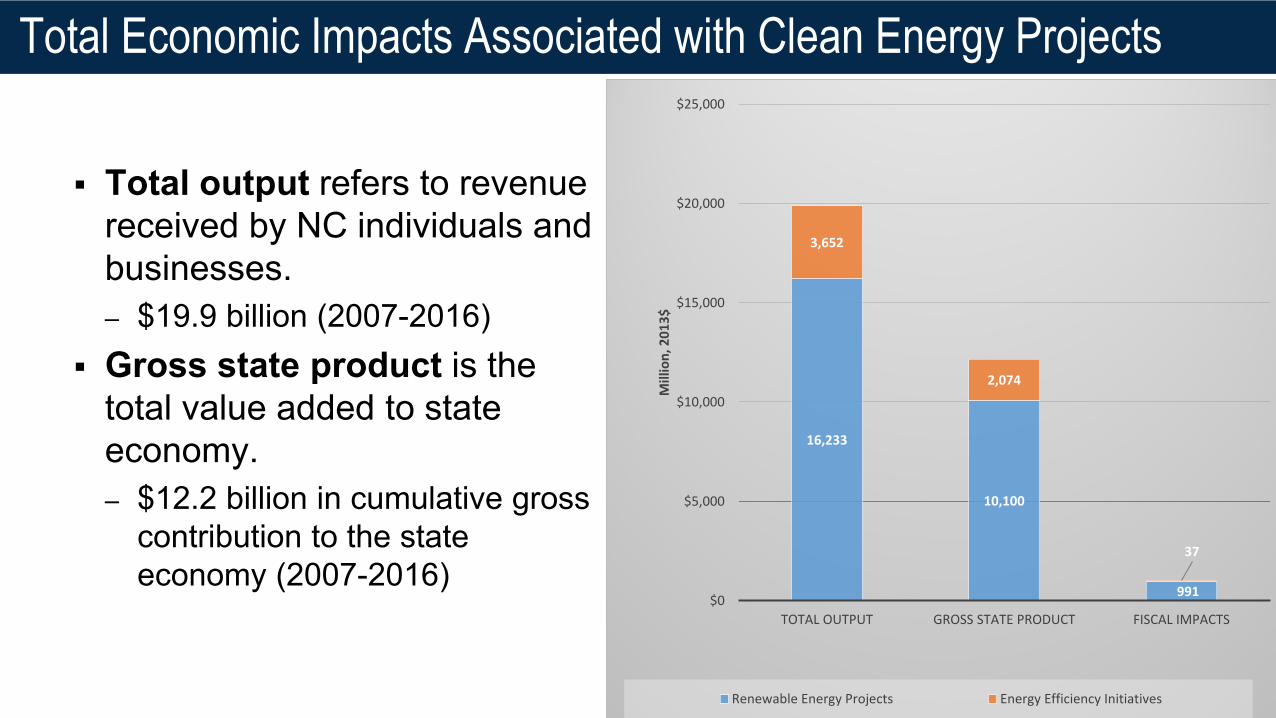
Total Economic Impacts Associated with Clean Energy Projects
Total output refers to revenue received by NC individuals and businesses. – $19.9 billion (2007-2016)
Gross state product is the total value added to state economy.– $12.2 billion in cumulative gross
contribution to the state economy (2007-2016)
16,233
10,100
991
3,652
2,074
37
$0
$5,000
$10,000
$15,000
$20,000
$25,000
TOTAL OUTPUT GROSS STATE PRODUCT FISCAL IMPACTS
Mill
ion,
201
3$
Renewable Energy Projects Energy Efficiency Initiatives

Employment Impacts, 2007-2016
Employment impacts approximate the number of FTEs required to support the RE and EE investments.
126,440 cumulative FTEs resulting from the cumulative clean energy investment in NC.
FTE is equivalent to one person working full time for a year.
Includes employment in:– Energy industries; and– supporting industries (e.g. service,
manufacturing, EPC, transport, hospitality, etc.)
98,801
27,639
0
20,000
40,000
60,000
80,000
100,000
120,000
140,000
Empl
oym
ent (
Full-
Tim
e Eq
uiva
lent
s)
Renewable Energy Projects Energy Efficiency Initiatives

Employment Impacts in Detail
53,250
5,152
58,402
51,117
22,617
73,734
-5,565-130
-5,695
-20,000
0
20,000
40,000
60,000
80,000
100,000
120,000
140,000
RENEWABLE ENERGY ENERGY EFFICIENCY TOTAL
Empl
oym
ent (
Full-
Tim
e Eq
uiva
lent
s)
Direct Secondary Direct - Govt Spending

Employment Impacts and Considerations What is the professional skill-level required?
– What's the mix high vs. low skilled employment across the state?– What’s the spatial distribution of employment across the state?– Are there state or local policy options that promote higher paying jobs in economically
disadvantaged areas?
What labor pools are filling these jobs?– Existing labor force in the renewable energy industries (expanding job responsibilities for
existing employees)– Employed workers from other industries (employment shifts, net zero increase in total
employment)– Unemployed (net increase in total employment but at what skill-level).
How are the relationships between output and employment changing over time?– Production processes may change in response to the energy efficiency initiatives, changing the
relationships between output and employment.
The ratio of in-state to out-of-state employment for may have changed over the last decade – actual employment impacts for NC may be higher or lower than modeled estimates.

More Information
Jeffrey PetrusaSenior EconomistCenter for Environmental, Technology and Energy EconomicsRTI International

Guiding Principles
What do you and/or your organization see as the most important values for the electricity system to uphold and promote going forward?
April Presentations
• 15-minute presentations addressing five key questions • Maximum of 8 slides that will be printed as handouts• Presentations should:
– Explain who was in the group and process for collaborating– Describe your shared understanding of the answers to these
questions; but if there’s not a consensus, explain the points of disagreement (or divergent opinions)

Questions for April Presentation
1. What are the group’s three priority goals for participating in the Clean Energy Plan process?
2. What are some motivating factors for you, your organization, or the people your organization represents that you would like the state representatives and/or other stakeholders to understand better?
3. What is your vision of a clean energy future for North Carolina? (please state this in 1-2 sentences)
4. What three features of the existing system do you see as challenges to deployment of clean energy resources that should be addressed going forward?
5. What three features of the existing system do you want to ensure are maintained going forward to support deployment of clean energy resources?

Stakeholder Groups
1. Businesses and Corporations2. Manufacturing Interests3. Residents and Consumer Advocates4. Environmental Justice Groups5. Utilities6. Environmental Groups7. Higher Education8. Local Governments9. Distributed Energy Resource & Renewable Energy Providers and
Advocates

Group Report Outs• Groups should discuss:
– What is the best way for us as individuals to reach agreement on these questions (or map our differing perspectives)?
– How can we best coordinate between now and the April meeting?– Who will be responsible for organizing group calls or meetings, creating
the slide deck, and presenting in the April meeting (can have three different people present)?
• At the end of this session, groups will report out on three questions:– Who is in your group? Who is your group’s main point of contact?– What is important to your group that we’ll hear more about in April?– What are you excited to hear from other groups in April?

Check Out
Fill in the blanks:“To achieve XX (value), we need to…”