Embed Size (px)
Citation preview

For Immediate Release: January 26, 2021For More Information, Contact: David Rhoades/919.814.4611
North Carolina’s December Employment Figures Released
RALEIGH — The state’s seasonally adjusted December unemployment rate was 6.2 percent,remaining unchanged from November’s revised rate. The national rate remained unchanged at 6.7percent.
North Carolina’s December 2020 unemployment rate increased 2.6 percentage points from a year ago.The number of people employed increased 27,571 over the month to 4,702,115 and decreased 215,063over the year. The number of people unemployed decreased 630 over the month to 310,675 andincreased 124,552 over the year.
Seasonally adjusted Total Nonfarm industry employment, as gathered through the monthlyestablishment survey, increased 33,600 to 4,403,200 in December. Major industries experiencingincreases were Trade, Transportation & Utilities, 13,700; Professional & Business Services, 11,700;Manufacturing, 4,500; Education & Health Services, 1,900; Financial Activities, 1,800; Government,1,700; Information, 900; and Other Services, 300. Major industries experiencing decreases wereLeisure & Hospitality Services, 2,800; and Mining & Logging, 100. Construction employmentremained unchanged.
Seasonally Adjusted Unemployment Rates since December 2019
Dec2019
Jan2020
Feb2020
Mar2020
Apr2020
May2020
Jun2020
Jul2020
Aug2020
Sep2020
Oct2020
Nov2020
Dec2020
N.C. 3.6 3.6 3.6 4.3 12.9 12.8 7.5 8.5 6.5 7.2 6.2 6.2 6.2
U.S. 3.6 3.5 3.5 4.4 14.8 13.3 11.1 10.2 8.4 7.8 6.9 6.7 6.7
Please note: 2019 numbers have undergone annual revision
Since December 2019, Total Nonfarm jobs decreased 190,700 with the Total Private sector decreasingby 162,800 and Government decreasing by 27,900. Major industries experiencing increases wereProfessional & Business Services, 10,500; Trade, Transportation & Utilities, 10,200; and FinancialActivities, 1,000. Major industries experiencing decreases were Leisure & Hospitality Services,110,100; Manufacturing, 31,500; Education & Health Services, 29,900; Government, 27,900;Construction, 4,700; Information, 4,100; Other Services, 4,100; and Mining & Logging, 100.
The next unemployment update is scheduled for Wednesday, February 3, 2021 when the countyunemployment rates for December 2020 will be released.
These data can be accessed on the Commerce website at https://d4.nccommerce.com/

December 2020 November 2020 December 2019
NumericChange
PercentChange
NumericChange
PercentChange
(Local Area Unemployment Statistics)
Smoothed Seasonally Adjusted
Labor Force 5,012,790 4,985,849 5,103,301 26,941 0.5 -90,511 -1.8
Employed 4,702,115 4,674,544 4,917,178 27,571 0.6 -215,063 -4.4
Unemployed 310,675 311,305 186,123 -630 -0.2 124,552 66.9
Unemployment Rate 6.2 6.2 3.6 0.0 xxx 2.6 xxx
Not Seasonally Adjusted
Labor Force 4,978,718 4,985,837 5,070,827 -7,119 -0.1 -92,109 -1.8
Employed 4,681,331 4,684,947 4,902,572 -3,616 -0.1 -221,241 -4.5
Unemployed 297,387 300,890 168,255 -3,503 -1.2 129,132 76.7
Unemployment Rate 6.0 6.0 3.3 0.0 xxx 2.7 xxx
(Current Population Survey)
Seasonally Adjusted
Labor Force 160,567,000 160,536,000 164,579,000 31,000 < 0.1 xxx xxx
Employed 149,830,000 149,809,000 158,735,000 21,000 < 0.1 xxx xxx
Unemployed 10,736,000 10,728,000 5,844,000 8,000 0.1 xxx xxx
Unemployment Rate 6.7 6.7 3.6 0.0 xxx xxx xxx
Not Seasonally Adjusted
Labor Force 160,017,000 160,468,000 164,007,000 -451,000 -0.3 xxx xxx
Employed 149,613,000 150,203,000 158,504,000 -590,000 -0.4 xxx xxx
Unemployed 10,404,000 10,264,000 5,503,000 140,000 1.4 xxx xxx
Unemployment Rate 6.5 6.4 3.4 0.1 xxx xxx xxx
*Effective January 2020, updated US population estimates are used in the national labor force estimates.
The annual population adjustments affect the comparability of national labor force estimates over time.
2020 estimates for the current month are preliminary. Estimates for the previous month have undergone monthly revision.
2019 estimates have undergone annual revision.
United States
Month Ago Year Ago
North Carolina
North Carolina data is embargoed until 10:00 A.M. Tuesday, January 26, 2021
December 2020 November 2020 December 2019NumericChange
PercentChange
NumericChange
PercentChange
(Current Employment Statistics)
Seasonally Adjusted
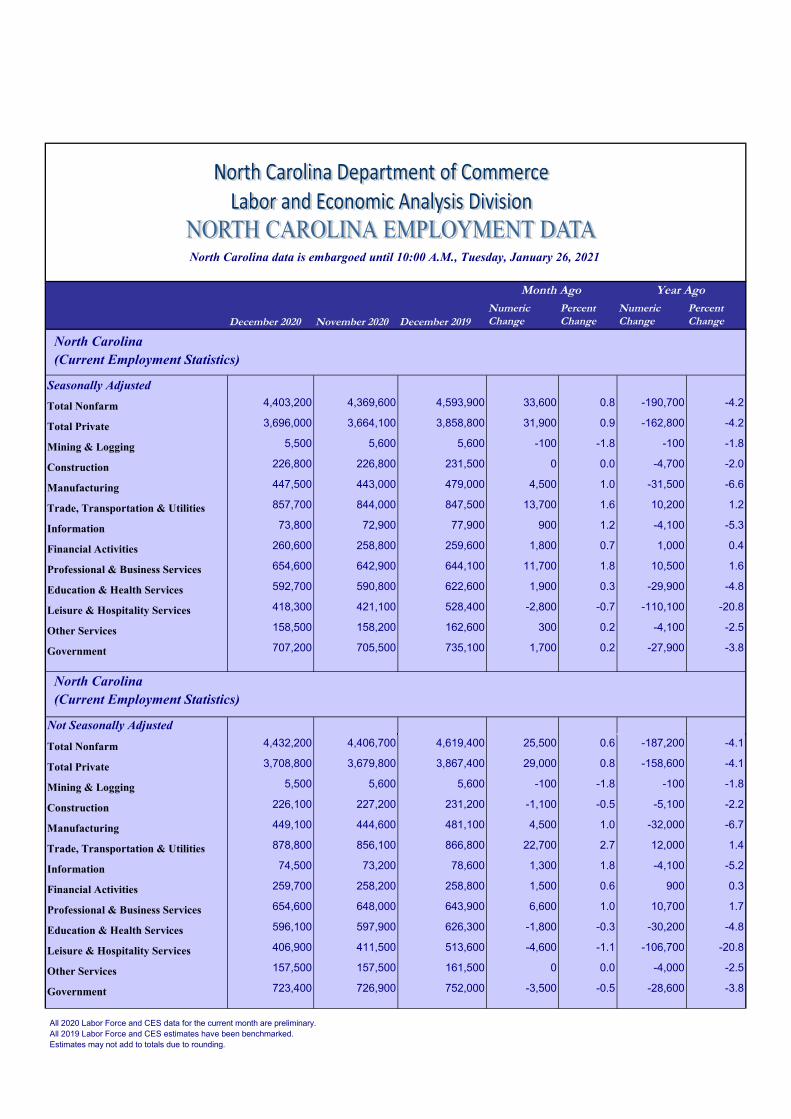
Total Nonfarm 4,403,200 4,369,600 4,593,900 33,600 0.8 -190,700 -4.2
Total Private 3,696,000 3,664,100 3,858,800 31,900 0.9 -162,800 -4.2
Mining & Logging 5,500 5,600 5,600 -100 -1.8 -100 -1.8
Construction 226,800 226,800 231,500 0 0.0 -4,700 -2.0
Manufacturing 447,500 443,000 479,000 4,500 1.0 -31,500 -6.6
Trade, Transportation & Utilities 857,700 844,000 847,500 13,700 1.6 10,200 1.2
Information 73,800 72,900 77,900 900 1.2 -4,100 -5.3
Financial Activities 260,600 258,800 259,600 1,800 0.7 1,000 0.4
Professional & Business Services 654,600 642,900 644,100 11,700 1.8 10,500 1.6
Education & Health Services 592,700 590,800 622,600 1,900 0.3 -29,900 -4.8
Leisure & Hospitality Services 418,300 421,100 528,400 -2,800 -0.7 -110,100 -20.8
Other Services 158,500 158,200 162,600 300 0.2 -4,100 -2.5
Government 707,200 705,500 735,100 1,700 0.2 -27,900 -3.8
(Current Employment Statistics)
Not Seasonally Adjusted
Total Nonfarm 4,432,200 4,406,700 4,619,400 25,500 0.6 -187,200 -4.1
Total Private 3,708,800 3,679,800 3,867,400 29,000 0.8 -158,600 -4.1
Mining & Logging 5,500 5,600 5,600 -100 -1.8 -100 -1.8
Construction 226,100 227,200 231,200 -1,100 -0.5 -5,100 -2.2
Manufacturing 449,100 444,600 481,100 4,500 1.0 -32,000 -6.7
Trade, Transportation & Utilities 878,800 856,100 866,800 22,700 2.7 12,000 1.4
Information 74,500 73,200 78,600 1,300 1.8 -4,100 -5.2
Financial Activities 259,700 258,200 258,800 1,500 0.6 900 0.3
Professional & Business Services 654,600 648,000 643,900 6,600 1.0 10,700 1.7
Education & Health Services 596,100 597,900 626,300 -1,800 -0.3 -30,200 -4.8
Leisure & Hospitality Services 406,900 411,500 513,600 -4,600 -1.1 -106,700 -20.8
Other Services 157,500 157,500 161,500 0 0.0 -4,000 -2.5
Government 723,400 726,900 752,000 -3,500 -0.5 -28,600 -3.8
All 2020 Labor Force and CES data for the current month are preliminary.
All 2019 Labor Force and CES estimates have been benchmarked.
Estimates may not add to totals due to rounding.
North Carolina
North Carolina
Month Ago Year Ago
North Carolina data is embargoed until 10:00 A.M., Tuesday, January 26, 2021

Accessing Data
The data presented in this press release, as well as historical data, can be accessed from NCCommerce’s Demand Driven Data Delivery (“D4”) system:https://d4.nccommerce.com/LausSelection.aspxhttps://d4.nccommerce.com/CesSelection.aspx
Technical Notes
This release presents labor force and unemployment estimates from the Local Area UnemploymentStatistics (LAUS) program. Also presented are nonfarm payroll employment estimates from theCurrent Employment Statistics (CES) program. The LAUS and CES programs are both federal-statecooperative endeavors.
Labor force and unemployment--from the LAUS program
Definitions. The labor force and unemployment estimates are based on the same concepts anddefinitions as those used for the official national estimates obtained from the Current PopulationSurvey (CPS), a sample survey of households that is conducted for the Bureau of Labor Statistics(BLS) by the U.S. Census Bureau. The LAUS program measures employment and unemployment ona place-of-residence basis. The universe for each is the civilian noninstitutional population 16 yearsof age and over. Employed persons are those who did any work at all for pay or profit inthe reference week (the week including the 12th of the month) or worked 15 hours or more withoutpay in a family business or farm, plus those not working who had a job from which they weretemporarily absent, whether or not paid, for such reasons as bad weather, labor-management dispute,illness, or vacation. Unemployed persons are those who were not employed during the referenceweek (based on the definition above), had actively looked for a job sometime in the 4-week periodending with the reference week, and were currently available for work; persons on lay-off expectingrecall need not be looking for work to be counted as unemployed. The labor force is the sum ofemployed and unemployed persons. The unemployment rate is the number of unemployed as apercent of the labor force.
Method of estimation. Statewide estimates are produced using an estimation algorithmadministered by the BLS. This method, which underwent substantial enhancement at the beginningof 2015, utilizes data from several sources, including the CPS, the CES, and state unemploymentinsurance (UI) programs. Each month, census division estimates are controlled to national totals, andstate estimates are then controlled to their respective division totals. Substate estimates are controlledto their respective state totals. For more information about LAUS estimation procedures, see the BLSwebsite at https://www.bls.gov/opub/hom/lau/calculation.htm
Revisions. Labor force and unemployment data for the previous month reflect adjustmentsmade in each subsequent month, while data for prior years reflect adjustments made at the end ofeach year. The monthly revisions incorporate updated model inputs, while the annually revisedestimates reflect updated population data from the U.S. Census Bureau, any revisions in the otherdata sources, and model reestimation. In most years, historical data for the most recent five years(both seasonally adjusted and not seasonally adjusted) are revised near the beginning of eachcalendar year, prior to the release of January estimates.

Seasonal adjustment. The LAUS program introduced smoothed seasonally adjusted(SSA) estimates in January 2010. These are seasonally-adjusted data that have incorporated a long-run trend smoothing procedure, resulting in estimates that are less volatile than those previouslyproduced. The estimates are smoothed using a filtering procedure, based on moving averages, toremove the irregular fluctuations from the seasonally-adjusted series, leaving the trend. The sameprocess is used on both historical and current year estimates. For more information about thesmoothing technique, see the BLS website at https://www.bls.gov/lau/lauseas.htm.
Area definitions. The substate area data published in this release reflect the delineations thatwere issued by the U.S. Office of Management and Budget on April 10, 2018. A detailed list of thegeographic definitions is available online at www.bls.gov/lau/lausmsa.htm.
Employment--from the CES program
Definitions. Employment data refer to persons on establishment payrolls who receive pay forany part of the pay period that includes the 12th of the month. Persons are counted at their place ofwork rather than at their place of residence; those appearing on more than one payroll are counted oneach payroll. Industries are classified on the basis of their principal activity in accordance with the2017 version of the North American Industry Classification System.
Method of estimation. CES State and Area employment data are produced using severalestimation procedures. Where possible these data are produced using a "weighted link relative"estimation technique in which a ratio of current-month weighted employment to that of the previous-month weighted employment is computed from a sample of establishments reporting for bothmonths. The estimates of employment for the current month are then obtained by multiplying theseratios by the previous month’s employment estimates. The weighted link relative technique isutilized for data series where the sample size meets certain statistical criteria.
For some employment series, relatively small sample sizes limit the reliability of the weighted link-relative estimates. In these cases, BLS uses the CES small domain model (SDM) to generateemployment estimates. The SDM combines the direct sample estimates (described above) andforecasts of historical (benchmarked) data to decrease the volatility of the estimates. For moredetailed information about the CES small domain model, refer to the BLS Handbook of Methods.
Annual revisions. Employment estimates are adjusted annually to a complete count of jobs,called benchmarks, derived principally from tax reports that are submitted by employers who arecovered under state unemployment insurance (UI) laws. The benchmark information is used to adjustthe monthly estimates between the new benchmark and the preceding one and also to establish thelevel of employment for the new benchmark month. Thus, the benchmarking process establishes thelevel of employment, and the sample is used to measure the month-to-month changes in the level forthe subsequent months. Information on recent benchmark revisions is available online atwww.bls.gov/web/laus/benchmark.pdf.
Seasonal adjustment. Payroll employment data are seasonally adjusted at the statewidesupersector level. In some states, the seasonally adjusted payroll employment total is computed byaggregating the independently adjusted supersector series. In other states, the seasonally adjustedpayroll employment total is independently adjusted. Revisions of historical data for the most recent 5years are made once a year, coincident with annual benchmark adjustments.

Reliability of the estimates
The estimates presented in this release are based on sample surveys, administrative data, andmodeling and, thus, are subject to sampling and other types of errors. Sampling error is a measure ofsampling variability—that is, variation that occurs by chance because a sample rather than the entirepopulation is surveyed. Survey data also are subject to nonsampling errors, such as those which canbe introduced into the data collection and processing operations. Estimates not directly derived fromsample surveys are subject to additional errors resulting from the specific estimation processes used.Model-based error measures for seasonally adjusted and not seasonally adjusted data and for over-the-month and over-the-year changes to LAUS estimates are available online atwww.bls.gov/lau/lastderr.htm. Measures of sampling error for state CES data at the total nonfarmand supersector levels are available online at www.bls.gov/sae/790stderr.htm.
Release Dates
The next unemployment update is scheduled for Wednesday, February 3, 2021 when the countyunemployment rates for December 2020 will be released.
The complete data release schedule for 2020 can be accessed here:
https://www.nccommerce.com/documents/release-dates-unemployment-rates

L a b o r & E c o n o m i c A n a l y s i s | N o r t h C a r o l i n a D e p a r t m e n t o f C o m m e r c e | 1 o f 2
Labor Market ConditionsNorth Carolina December
2 0 2 0The North Carolina seasonally adjusted unemployment rate was 6.2 percent in December, remaining unchanged from November’s revised rate and growing 2.6 percentage points from December 2019. Over the month, the number of persons unemployed decreased by 630 (0.2%). The civilian labor force grew by 26,941 (0.5%) to 5,012,790.
Nationally, December’s unemployment rate was 6.7 percent. The number of persons unemployed was 10,736,000, while the civilian labor force was 160,567,000.
Seasonally adjusted Total Nonfarm industry employment (4,403,200) increased 33,600 (0.8%) since November 2020 and fell 190,700 (4.2%) since December 2019. Private sector employment increased 31,900 (0.9%) over the month and decreased 162,800 (4.2%) over the year.
Of the major industries for which payroll data are seasonally adjusted, Trade, Transportation, & Utilities (13,700; 1.6%) had the largest over-the-month increase in jobs, followed by Professional & Business Services (11,700; 1.8%), Manufacturing (4,500; 1.0%), Education & Health Services (1,900; 0.3%), Financial Activities (1,800; 0.7%), Government (1,700; 0.2%), Information (900; 1.2%), and Other Services (300; 0.2%). Leisure & Hospitality Services (2,800; 0.7%) reported the largest over-the-month decrease, followed by Mining & Logging (100; 1.8%). Construction remained unchanged over the month.
Since December 2019, Professional & Business Services (10,500; 1.6%) reported the largest jobs increase over the year, followed by Trade, Transportation, & Utilities (10,200; 1.2%), and Financial Activities (1,000; 0.4%). Leisure & Hospitality Services (110,100; 20.8%) reported the largest over-the-year decrease, followed by Manufacturing (31,500; 6.6%), Education & Health Services (29,900; 4.8%), Government (27,900; 3.8%), Construction (4,700; 2.0%), Information (4,100; 5.3%), Other Services (4,100; 2.5%), and Mining & Logging (100; 1.8%). Note: It is important to note that industry employment estimates are subject to large seasonal patterns. Seasonal adjustment factors are applied to the data. However, these factors may not be fully capturing the seasonal trend. Therefore, when interpreting the changes in industry employment, it is advisable to focus on over-the-year changes in both the seasonally adjusted and not seasonally adjusted series.
Changes in Employment by NAICS IndustriesDecember 2019 Compared to December 2020(Seasonally Adjusted)
United States/North Carolina Unemployment RatesDecember 2019–December 2020(Seasonally Adjusted)
North Carolina Total Nonfarm EmploymentDecember 2019–December 2020(Seasonally Adjusted)
3.6 3.5 3.54.4
14.8
13.3
11.110.2
8.47.8
6.9 6.7 6.7
3.6 3.6 3.64.3
12.9 12.8
7.58.5
6.57.2
6.2 6.2 6.2
0.0
5.0
10.0
15.0
Dec.2019
Jan.2020
Feb.2020
March2020
April2020
May2020
June2020
July2020
Aug.2020
Sept.2020
Oct.2020
Nov.2020
Dec.2020
Per
cen
t
United States North Carolina
3,900
4,000
4,100
4,200
4,300
4,400
4,500
4,600
4,700
Dec.2019
Jan.2020
Feb.2020
March2020
April2020
May2020
June2020
July2020
Aug.2020
Sept.2020
Oct.2020
Nov.2020
Dec.2020
In T
hous
ands
-4.7
-31.5
+10.2
-4.1
+1.0
+10.5-29.9
-110.1
-4.1
-27.9
0
100
200
300
400
500
600
700
800
900
1,000
Construction Manufacturing Trade,Transportation,
& Utilities
Information FinancialActivities
Professional& Business
Services
Education &Health
Services
Leisure &HospitalityServices
Other Services Government
In T
hous
ands
Dec-19 Dec-20
N o t e : N o r t h C a r o l i n a 2 0 2 0 c u r r e n t m o n t h e s t i m a t e s a r e p r e l i m i n a r y , w h i l e p r e v i o u s m o n t h e s t i m a t e s a r e r e v i s e d . N o r t h C a r o l i n a 2 0 1 9 e s t i m a t e s h a v e u n d e r g o n e a n n u a l r e v i s i o n .
L a b o r & E c o n o m i c A n a l y s i s | N o r t h C a r o l i n a D e p a r t m e n t o f C o m m e r c e | 2 o f 2
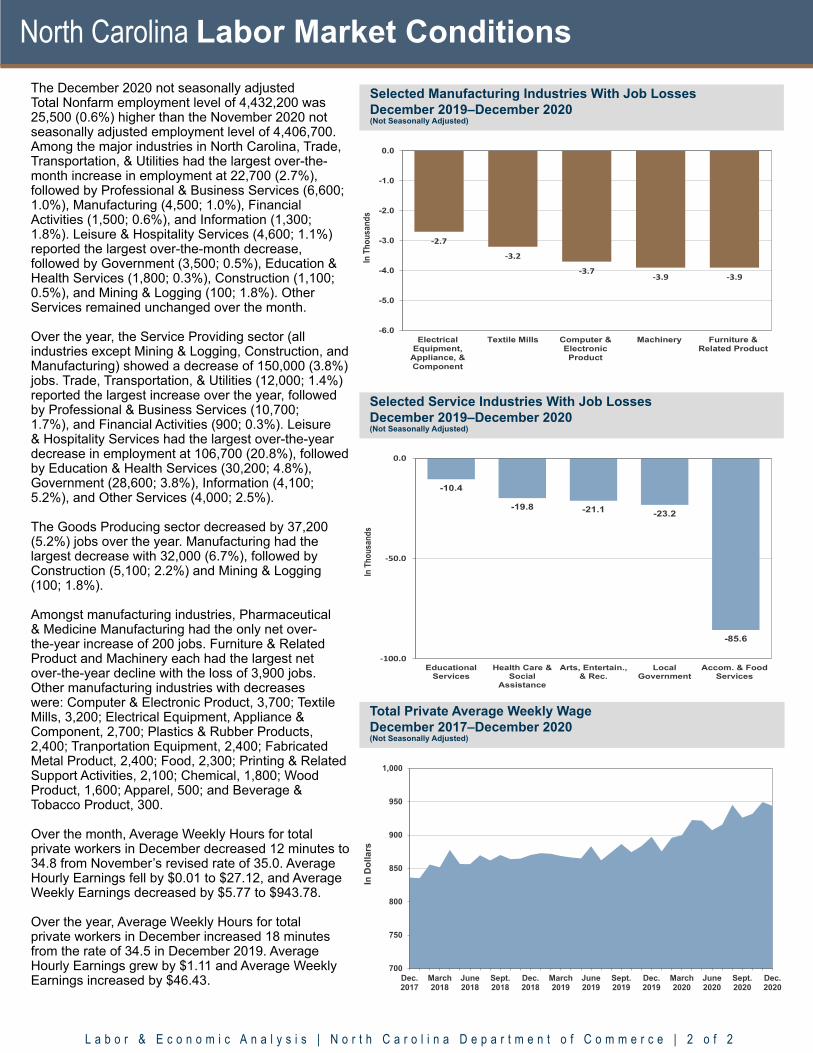
North Carolina Labor Market ConditionsThe December 2020 not seasonally adjusted Total Nonfarm employment level of 4,432,200 was 25,500 (0.6%) higher than the November 2020 not seasonally adjusted employment level of 4,406,700. Among the major industries in North Carolina, Trade, Transportation, & Utilities had the largest over-the-month increase in employment at 22,700 (2.7%), followed by Professional & Business Services (6,600; 1.0%), Manufacturing (4,500; 1.0%), Financial Activities (1,500; 0.6%), and Information (1,300; 1.8%). Leisure & Hospitality Services (4,600; 1.1%) reported the largest over-the-month decrease, followed by Government (3,500; 0.5%), Education & Health Services (1,800; 0.3%), Construction (1,100; 0.5%), and Mining & Logging (100; 1.8%). Other Services remained unchanged over the month.
Over the year, the Service Providing sector (all industries except Mining & Logging, Construction, and Manufacturing) showed a decrease of 150,000 (3.8%) jobs. Trade, Transportation, & Utilities (12,000; 1.4%) reported the largest increase over the year, followed by Professional & Business Services (10,700; 1.7%), and Financial Activities (900; 0.3%). Leisure & Hospitality Services had the largest over-the-year decrease in employment at 106,700 (20.8%), followed by Education & Health Services (30,200; 4.8%), Government (28,600; 3.8%), Information (4,100; 5.2%), and Other Services (4,000; 2.5%).
The Goods Producing sector decreased by 37,200 (5.2%) jobs over the year. Manufacturing had the largest decrease with 32,000 (6.7%), followed by Construction (5,100; 2.2%) and Mining & Logging (100; 1.8%).
Amongst manufacturing industries, Pharmaceutical & Medicine Manufacturing had the only net over-the-year increase of 200 jobs. Furniture & Related Product and Machinery each had the largest net over-the-year decline with the loss of 3,900 jobs. Other manufacturing industries with decreases were: Computer & Electronic Product, 3,700; Textile Mills, 3,200; Electrical Equipment, Appliance & Component, 2,700; Plastics & Rubber Products, 2,400; Tranportation Equipment, 2,400; Fabricated Metal Product, 2,400; Food, 2,300; Printing & Related Support Activities, 2,100; Chemical, 1,800; Wood Product, 1,600; Apparel, 500; and Beverage & Tobacco Product, 300.
Over the month, Average Weekly Hours for total private workers in December decreased 12 minutes to 34.8 from November’s revised rate of 35.0. Average Hourly Earnings fell by $0.01 to $27.12, and Average Weekly Earnings decreased by $5.77 to $943.78.
Over the year, Average Weekly Hours for total private workers in December increased 18 minutes from the rate of 34.5 in December 2019. Average Hourly Earnings grew by $1.11 and Average Weekly Earnings increased by $46.43.
Selected Manufacturing Industries With Job LossesDecember 2019–December 2020(Not Seasonally Adjusted)
Selected Service Industries With Job LossesDecember 2019–December 2020(Not Seasonally Adjusted)
700
750
800
850
900
950
1,000
Dec.2017
March2018
June2018
Sept.2018
Dec.2018
March2019
June2019
Sept.2019
Dec.2019
March2020
June2020
Sept.2020
Dec.2020
In D
olla
rs
Total Private Average Weekly WageDecember 2017–December 2020(Not Seasonally Adjusted)
-2.7
-3.2
-3.7-3.9 -3.9
-6.0
-5.0
-4.0
-3.0
-2.0
-1.0
0.0
ElectricalEquipment,
Appliance, &Component
Textile Mills Computer &ElectronicProduct
Machinery Furniture &Related Product
In T
hous
ands
-10.4
-19.8 -21.1 -23.2
-85.6
-100.0
-50.0
0.0
EducationalServices
Health Care &Social
Assistance
Arts, Entertain.,& Rec.
LocalGovernment
Accom. & FoodServices
In T
hous
ands