Embed Size (px)
Citation preview

North Central Research StationForest Service—U.S. Department of Agriculture
1992 Folwell AvenueSt. Paul, Minnesota 55108
Manuscript approved for publication May 1, 20012001
FOREWORD
Forest Inventory and Analysis (FIA) is a continuing endeavor mandated byCongress in the Forest and Rangeland Renewable Resources Planning Act of1974 and the McSweeney-McNary Forest Research Act of 1928. FIA’s pri-mary objective is to determine the extent, condition, volume, growth, anddepletions of timber on the Nation’s forest land. Before 1999, all inventorieswere conducted on a periodic basis. With the passage of the 1998 Farm Bill,FIA is required to collect data on 20 percent of the plots annually withineach State. This kind of up-to-date information is essential to frame realisticforest policies and programs. USDA Forest Service regional research stationsare responsible for conducting these inventories and publishing summaryreports for individual States.
In addition to published reports, the Forest Service can also provide portionsof the data collected in each inventory to those interested in further analysis.This report describes a standard format in which data can be obtained. Thisstandard format, referred to as the Forest Inventory and Analysis Database(FIADB) structure, was developed to provide users with as much data aspossible in a consistent manner among States. FIADB files can be obtainedfor any State inventory conducted after 1988 (Eastern U.S.) or 1994 (WesternU.S.). Files for many State inventories conducted before this time may alsobe available; however, some data fields may be empty or the items may havebeen collected or computed differently. Inventories begun after 1997 use acommon plot design nationwide, resulting in greater consistency among FIAunits than earlier inventories. Data field definitions note inconsistenciescaused by different sampling designs.
ACKNOWLEDGMENTS
The material in this manual is based on previous efforts to provide a uniformdatabase for multiple FIA units (Hansen et al. 1992, Woudenberg andFarrenkopf 1995). We also thank Stan Arner, Tom Frieswyk, Mark Hansen,Bruce Hiserote, Brian Johnston, Neil McKay, Roy Mita, Larry Royer, MarkRubey, and Shirley Waters for their valuable assistance.
2
CONTENTS
Chapter 1 — The FIA Database .................................................................................................. 3
Chapter 2 — FIA Sampling and Estimation Procedures .............................................................. 5 Remote Sensing ...................................................................................................................... 5 Ground Sampling ................................................................................................................... 5 Accuracy Standards ............................................................................................................... 6
Chapter 3 — Database Structure ............................................................................................... 7 Survey Table .......................................................................................................................... 7 County Table ......................................................................................................................... 10 Plot Table .............................................................................................................................. 11 Subplot Table ........................................................................................................................ 19 Condition Table ..................................................................................................................... 21 Tree Table ............................................................................................................................. 34 Seedling Table ....................................................................................................................... 46 Site Tree Table ...................................................................................................................... 48 Boundary Table ..................................................................................................................... 50
Chapter 4 — Algorithms for Summarizing Data ........................................................................ 53 Algorithms That Will Work on All Inventories ......................................................................... 53 Examples of SQL Statements That Will Work for All Inventories ............................................. 56 Algorithms That Will Work on Inventories Completed After 1999 ............................................ 60 Examples of SQL Statements That Will Work on Inventories Completed After 1999 ................ 62 Algorithms That can be Applied to the Second Inventory Cycle Completed After 1999 ............ 64 Examples of SQL Statements That can be Applied to the Second Inventory Cycle Completed After 1999 ................................................................................................. 64
Literature Cited ........................................................................................................................ 66
Appendix A - Index of Column Names ....................................................................................... 67Appendix B - FIADB Standard Presentation Tables ................................................................... 73Appendix C - State, Survey Unit, and County Codes ................................................................. 85Appendix D - Forest Type Codes and Names ............................................................................ 113Appendix E - National Forest Codes and Names....................................................................... 117Appendix F - Tree Species Codes, Names, and Occurrences ..................................................... 119Appendix G - Tree Species Group Codes .................................................................................. 129
The Forest Inventory and Analysis Database:Database Description and Users Manual Version 1.0
Patrick D. MilesForester
Forest Inventory and Analysis UnitNorth Central Research Station
Gary J. BrandResearch Forester
Forest Inventory and Analysis UnitNorth Central Research Station
Carol L. AlerichForester
Northeastern Research Station
Larry F. BednarStatistician
Pacific Northwest Research Station
Sharon W. WoudenbergSupervisory Forester
Rocky Mountain Research Station
Joseph F. GloverSupervisory Forester
Southern Research Station
and
Edward N. EzzellForester
Pacific Northwest Research Station
CHAPTER 1
THE FIA DATABASE
This manual describes a database that has auniform data structure for FIA inventoriesnationwide. Its creation is part of an ongoingeffort by FIA to produce consistent inventorydata and summaries nationwide. Specifically,the intent is to provide data to:
1) Produce standard FIA tables of timberresource statistics (see Appendix B),
2) Meet Resource Planning Act Assess-ment data requirements,
3) Provide users with a common sourcefor integrated FIA plot and tree data,and
4) Estimate changes in forest land areaand timber volume between successiveFIA inventories.
The FIA Database (FIADB) replaces two FIAregional databases, one for the Eastern States(Eastwide database) and the other for theWestern States (Westwide database), which aredocumented in separate manuals (Hansen etal. 1992, Woudenberg and Farrenkopf 1995). Anew national plot design provided the impetusfor replacing these two databases. FIA unitsadopted this design in all State inventoriesinitiated after 1997. An overview of the designis presented in Chapter 2.
Although specifically intended to store datacollected with the new design, the FIADB alsostores data from FIA inventories completedbefore the adoption of the national plot design.These older inventories are always included inthe database if they are the most recentlycompleted inventory in a State. Optionally, FIAunits may include data from other olderinventories. The level of data consistencyamong these older inventories varies depend-ing on when, where, and how the data werecollected and compiled. Generally, notes areprovided in Chapter 3 indicating when a dataelement differs among FIA units or betweensuccessive inventories. We have also notedwhen differences occur between these olderinventories and those conducted using thenew national plot design. We recommend thatusers contact the FIA unit that produced anyof these older inventories for additional details.
The database contains extensive data on forestarea attributes and on the status of live andstanding dead trees. However, it does notinclude all data collected and compiled by FIAunits. In particular, data on dead and downtrees, understory (non-tree) vegetation, andmany abiotic attributes are not included. Usersshould contact individual FIA units to see ifthese data are available.
Users needing estimates of change in seedlingdensity, forest land area, or timberland volumeshould note the following cautions. Tree listscontained in this database may be significantlytruncated on plots that sample very youngstands predominantly stocked with seedlings(trees less than 1 inch at the point of diametermeasure). Seedlings often are tallied in FIAinventories only to the extent necessary todetermine if some minimum number of themare present, which means that seedlings areoften underreported. The database is notdesigned to provide valid estimates of change inforest land area between successive inventoriesthat predate the new national plot design.Computations of various components of volumechange should carefully mimic the examplesgiven in Chapter 4.
Data for individual States are available throughthe Internet at: http://www.fs.fed.us. This isthe Internet address for the Forest Service’sNational Headquarters and should remainunchanged for the immediate future. From thispage, users should follow the links to “Pro-grams & Staffs,” “Research & Development,”“Headquarters R&D Staffs,” “Forest Inventoryand Analysis,” and finally “Online databases.”Users accessing the FIA Web site can eitherdownload the data as comma-delimited files inFIADB format or use a Web-based program togenerate their own customized reports.
Chapter 2 describes FIA sampling and estima-tion procedures and Chapter 3 provides de-tailed documentation of the database. Chapter4 presents algorithms on how to computeestimates of area; current timber volume;biomass; number of trees; and annual timbervolume growth, mortality, and removals.
3

4
CHAPTER 2
FIA SAMPLING AND ESTIMATION PROCEDURES
To understand the types of data available,FIADB users need a basic understanding ofFIA sampling and estimation procedures. Ageneral discussion of these sampling proce-dures follows. Before the new common sam-pling design, specific sampling methods variedamong FIA units and even among Stateswithin an FIA unit. Users who require addi-tional information about sampling proceduresfor a specific State should contact the groupresponsible for that State’s inventory. As newinventories are completed, the common sam-pling design being implemented will producegreater consistency in the compiled data.
Remote Sensing
Each State inventory begins with the interpre-tation of a remotely sensed sample that classi-fies the land by various remote sensingclasses. The total area of a sample comes fromoutside sources (usually Bureau of Censusreports). The remote sensing classifications arebased on land use (such as pasture, cropland,urban). For forested land, more detailedclasses are sometimes defined based on crite-ria such as forest type, volume per acre, standsize, stand density, ownership, and/or standage. Then, ground plots are measured toadjust the remote sensing sample for changessince its acquisition date and to correct anymisclassification. Ground plots also provideestimates that cannot be made from a re-motely sensed sample. The remote sensingclassification of these ground plots, togetherwith the area estimates from the remotesensing sample, is used to assign area expan-sion factors to all ground plots. These areaexpansion factors are used to weigh plot-levelestimates when computing estimates forselected strata of the population. Selectioncriteria for remote sensing classes and compu-tation of area expansion factors differ fromState to State. Users interested in the detailsof how these expansion factors were assignedto the ground plots for a particular Stateshould contact the appropriate FIA unit.
Ground Sampling
FIA plots are designed to cover a 1-acre samplearea; however, not all trees on the acre aremeasured. Recent inventories use a nationalstandard, fixed-radius plot layout for sampletree selection. Various arrangements of fixed-radius and variable-radius (prism) subplotswere used to select sample trees to measure inolder inventories. Ground plots may be newplots that have never been measured, orremeasurement plots that were measuredduring a previous inventory. For all plots,several observations are recorded for eachsample tree, including its diameter, species,and other measurements that enable theprediction of the tree’s volume, growth rate,and quality. These tree measurements form thebasis of the data on the tree records in theFIADB.
Some of the data items in the FIADB comedirectly from field measurements; others arecomputed from tree measurements. Net cubic-foot volume is a computed item. Each FIA unituses a volume equation to compute this volumebased on diameter, taken either at breastheight (DBH) or root collar (DRC), and othertree and/or stand attributes. Although equa-tions vary from State to State, they were alldesigned to estimate the same volume.
One important computed item is the treeexpansion factor. This item expresses thenumber of trees per acre that each sampledtree represents in the current inventory. It isthe inverse of the size of the plot the tree wassampled on. For example, if the plot designsamples trees under 5 inches DBH on a singlefixed-radius plot covering 1/100th acre, thisitem would have the value of 100 trees per acrefor a tree less than 5 inches DBH. If trees 5inches DBH and larger are sampled with ten37.5 BAF (English) prism points, as was com-mon with FIA plots in the Eastern U.S., theexpansion factor would depend on the DBH ofthe tree. Under such a sample, a 14.0-inch tree
5
would have an expansion factor of 3.51 treesper acre, again the inverse of the plot size1.
A national plot design was adopted in the mid-1990’s. Now all FIA units have implemented acommon sampling design consisting of four24.0-foot radius subplots (approximately1/24th acre) for trees at least 5 inches indiameter and four 6.8-foot radius microplots(approximately 1/300th acre) for smaller trees.Therefore, tree expansion factors are approxi-mately 6 for trees at least 5 inches in diameterand approximately 75 for the smaller trees.Subplot 1 is the center of the cluster with theother three subplots located 120 feet away atazimuths of 360°, 120°, and 240°, respectively.Another characteristic of the new design is themapping of differing forest conditions. Foresttype, stand-size class, stand density, standorigin, owner group, and reserve status define acondition. If two or more conditions occurwithin a plot, the boundary between them ismapped and the proportion of the plot in eachcondition is recorded.
The items in the COND table are estimates ofaverage attributes for the portion of the plot inthat condition. Previous inventories did notmap conditions. Instead, some attributes wereassigned the value determined for the plotcenter, or subplots were shifted so that they fellwithin the same stand as the plot center.
Computed expansion factors are needed toestimate growth, mortality, and removals.Growth can be estimated by measuring the treeat two times, by measuring growth rings on anincrement core, or by using a model. Themethod used, along with the sampling design,determines the value for the expansion factorsneeded to compute growth. Mortality can alsobe estimated from remeasured or new plots.With inventories that have remeasurementplots, mortality is based on trees that dieduring the remeasurement period. In caseswhere new plots provide estimates of mortality,mortality is estimated from either a mortalityprediction equation that predicts the probabil-ity that a tree will die over some time period, orfrom a field estimate of mortality based on the
1 The plot size of a 14.0-inch tree on a single 37.5BAF (English) prism plot would be:
(14.0 inches2 x π)/(37.5 ft2/acre x 22 x 12 inches2/1 ft2) = 0.0285 acres. The plot size of this tree on a10 point cluster would be 10 times this or 0.285acres, producing an expansion factor of 3.51.
measurement of dead trees and an estimate ofwhen they died. Depending on the inventorydesign, removals may be estimated from obser-vations of trees cut on either new or remeasuredplots.
We have tried with the FIADB to provide asconsistent data as possible from one State toanother. Therefore, although differences in fieldand estimation procedures do exist amongStates, the data in the FIADB for differentStates are compatible. Differences that do existare minor and should have little or no impacton most uses of these data. Consistency willincrease as inventories incorporating the newcommon sampling design are completed.
Accuracy Standards
Forest inventory plans are designed to meetsampling error standards for area, volume,growth, and removals provided in the ForestService Handbook (FSH 4809.11). These stan-dards, along with other guidelines, are aimed atobtaining comprehensive and comparableinformation on timber resources for all parts ofthe country. FIA inventories are commonlydesigned to meet the specified sampling errorsat the State level at the 67 percent confidencelimit (one standard error). The Forest ServiceHandbook mandates that the sampling error forarea cannot exceed 3 percent error per 1 millionacres of timberland. Five percent (Eastern U.S.)or 10 percent (Western U.S.) error per 1 billioncubic feet of growing stock on timberland isapplied to volume, removals, and net annualgrowth. Unlike the mandated sampling error forarea, sampling errors for volume, removals, andgrowth are only targets.
FIA inventories are extensive inventories thatprovide reliable estimates for large samplingareas. As data are subdivided into smaller andsmaller areas, such as a geographic unit or acounty, the sampling errors increase and thereliability of the estimates goes down. Forexample, a State with 5 million acres of timber-land would have a maximum allowable sam-pling error of 1.3 percent (3% x (1,000,000).5/(5,000,000).5), a geographic unit within thatState with 1 million acres of timberland wouldhave a 3.0 percent maximum allowable sam-pling error (3% x (1,000,000).5 / (1,000,000).5),and a county within that State with 100 thou-sand acres would have a 9.5 percent maximumallowable sampling error (3% x (1,000,000).5/(100,000).5) at the 67 percent confidence level.
6
CHAPTER 3
DATABASE STRUCTURE
The FIA Database is a relational databasestructured for the Oracle Database Manage-ment System. By the nature of the way FIAdata are collected and compiled, these Oracletables are hierarchical. This structure makes iteasy to produce flat files for customers who donot have access to, or the capability of, data-base management on their computer system.
There are nine tables in the FIA Database(SURVEY, COUNTY, PLOT, SUBPLOT, COND(condition), TREE, SEEDLING, SITETREE, andBOUNDARY). The SURVEY table providesinformation on where and when inventorieswere conducted. The COUNTY table is merelya lookup table for the county and unit names.The other seven tables closely reflect themanner in which data are collected on a fieldplot. A row in the PLOT table provides infor-mation relevant to the entire 1-acre plot. A rowin the SUBPLOT table describes the features ofa single subplot. A row in the COND tableprovides information on the discrete combina-tion of landscape attributes that define thecondition (a condition will have the same landuse, reserved status, ownership, forest type,stand-size class, stand origin, and standdensity). A row in the TREE table is used to
describe each tree over 1 inch in diameterfound on a subplot. A row in the SEEDLINGtable provides a count of the number of treesof a species found on a subplot that are lessthan 1 inch in diameter but at least 6 inchesin length for conifer species or at least 12inches in length for hardwood species. A rowin the SITETREE table provides information onone of the site trees collected to provide siteindex information for a condition. A row in theBOUNDARY table provides an approximatedescription of the demarcation line betweentwo conditions that occur on a single subplot.
For each column or variable in a table, there isa section that describes the unabbreviatedname and detailed description of the variable.Coded items also include a list of the codesand their meanings.
Users need to exercise caution when summa-rizing numeric variables with special values(usually a -1) assigned to designate missingvalues. For example, computing averages ofelevation, site index, or total height withoutaccounting for those entries coded as -1 willgive erroneous results.
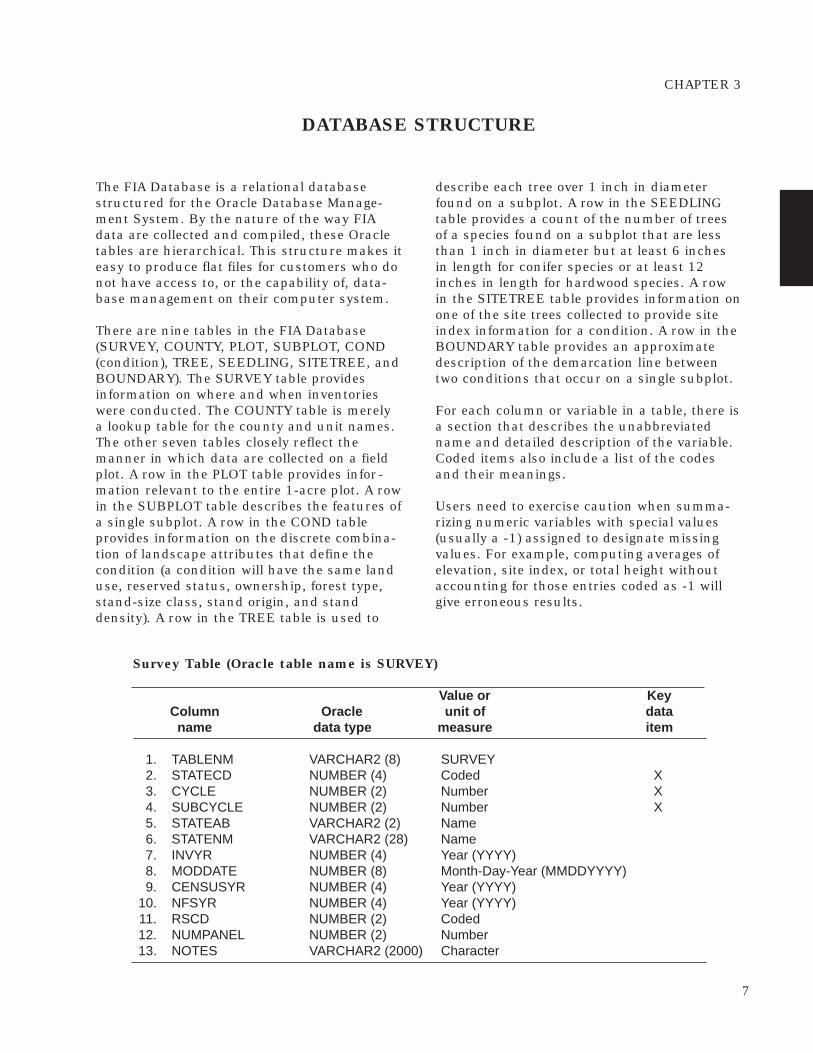
Survey Table (Oracle table name is SURVEY)
Value or Key Column Oracle unit of data name data type measure item
1. TABLENM VARCHAR2 (8) SURVEY2. STATECD NUMBER (4) Coded X3. CYCLE NUMBER (2) Number X4. SUBCYCLE NUMBER (2) Number X5. STATEAB VARCHAR2 (2) Name6. STATENM VARCHAR2 (28) Name7. INVYR NUMBER (4) Year (YYYY)8. MODDATE NUMBER (8) Month-Day-Year (MMDDYYYY)9. CENSUSYR NUMBER (4) Year (YYYY)
10. NFSYR NUMBER (4) Year (YYYY)11. RSCD NUMBER (2) Coded12. NUMPANEL NUMBER (2) Number13. NOTES VARCHAR2 (2000) Character
7
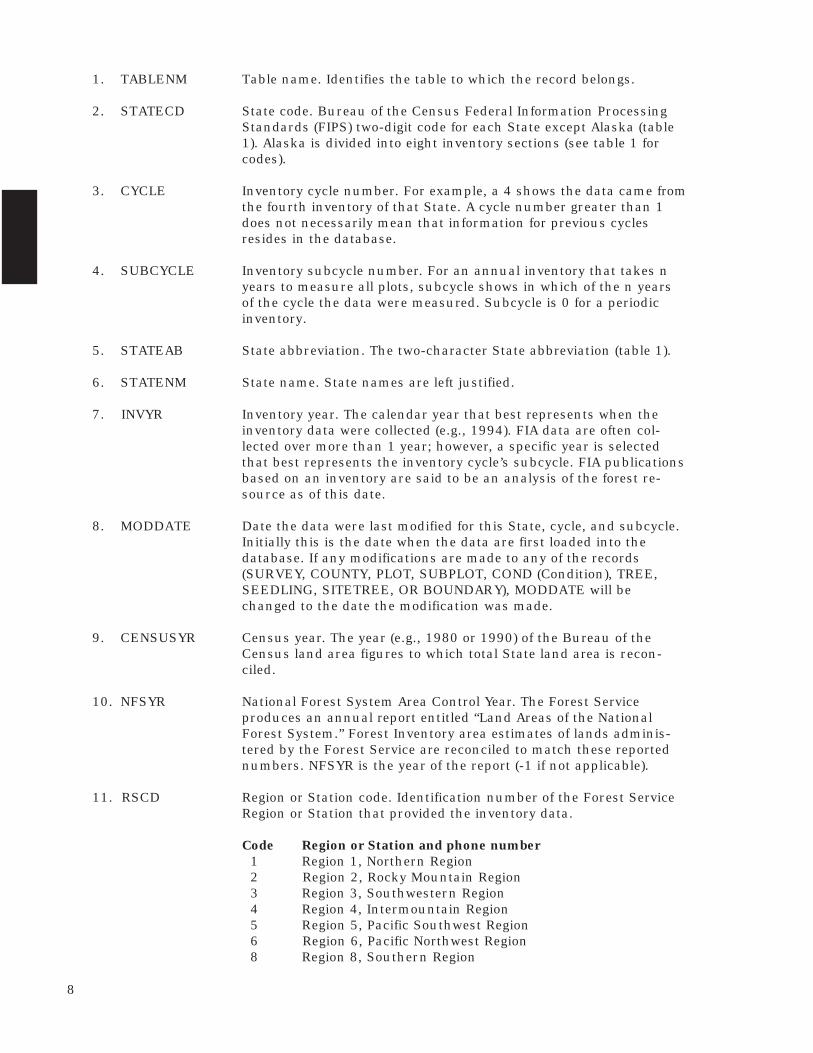
1. TABLENM Table name. Identifies the table to which the record belongs.
2. STATECD State code. Bureau of the Census Federal Information ProcessingStandards (FIPS) two-digit code for each State except Alaska (table1). Alaska is divided into eight inventory sections (see table 1 forcodes).
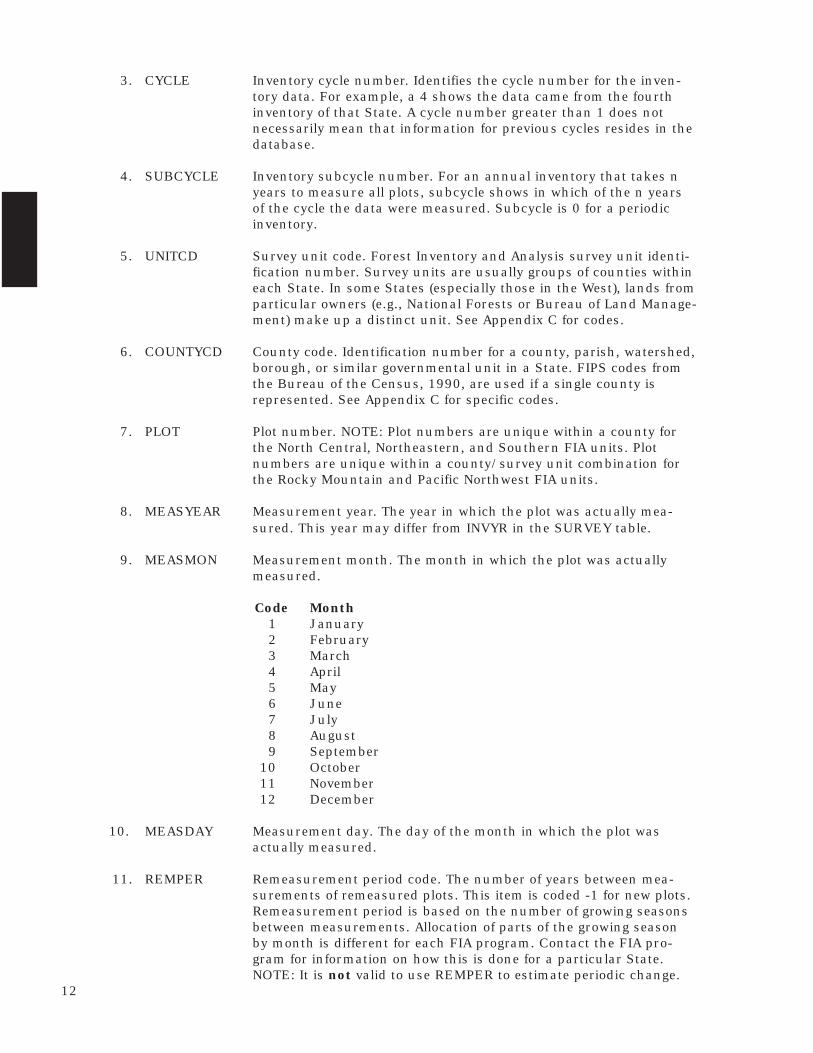
3. CYCLE Inventory cycle number. For example, a 4 shows the data came fromthe fourth inventory of that State. A cycle number greater than 1does not necessarily mean that information for previous cyclesresides in the database.
4. SUBCYCLE Inventory subcycle number. For an annual inventory that takes nyears to measure all plots, subcycle shows in which of the n yearsof the cycle the data were measured. Subcycle is 0 for a periodicinventory.
5. STATEAB State abbreviation. The two-character State abbreviation (table 1).
6. STATENM State name. State names are left justified.
7. INVYR Inventory year. The calendar year that best represents when theinventory data were collected (e.g., 1994). FIA data are often col-lected over more than 1 year; however, a specific year is selectedthat best represents the inventory cycle’s subcycle. FIA publicationsbased on an inventory are said to be an analysis of the forest re-source as of this date.
8. MODDATE Date the data were last modified for this State, cycle, and subcycle.Initially this is the date when the data are first loaded into thedatabase. If any modifications are made to any of the records(SURVEY, COUNTY, PLOT, SUBPLOT, COND (Condition), TREE,SEEDLING, SITETREE, OR BOUNDARY), MODDATE will bechanged to the date the modification was made.
9. CENSUSYR Census year. The year (e.g., 1980 or 1990) of the Bureau of theCensus land area figures to which total State land area is recon-ciled.
10. NFSYR National Forest System Area Control Year. The Forest Serviceproduces an annual report entitled “Land Areas of the NationalForest System.” Forest Inventory area estimates of lands adminis-tered by the Forest Service are reconciled to match these reportednumbers. NFSYR is the year of the report (-1 if not applicable).
11. RSCD Region or Station code. Identification number of the Forest ServiceRegion or Station that provided the inventory data.
Code Region or Station and phone number 1 Region 1, Northern Region 2 Region 2, Rocky Mountain Region 3 Region 3, Southwestern Region 4 Region 4, Intermountain Region 5 Region 5, Pacific Southwest Region 6 Region 6, Pacific Northwest Region 8 Region 8, Southern Region
8

9 Region 9, Eastern Region10 Region 10, Alaska Region22 Rocky Mountain Research Station, (801) 625-538823 North Central Research Station, (651) 649-513924 Northeastern Research Station, (610) 557-407526 Pacific Northwest Research Station, (503) 808-200027 Alaska - Pacific Northwest Research Station, (907) 271-258533 Southern Research Station, (828) 257-4350
12. NUMPANEL Number of panels. The number of years it will take to measure all of theplots on the base grid. Plots on the base grid are measured on a mul-tiple-year cycle with the intention of measuring 1/n (where n is thenumber of years in the cycle) of the plots (called a panel) every year. Theplots in any panel are chosen so they are uniformly distributed withinthe monitoring area.
13. NOTES An optional item where notes about the inventory may be stored.
Table 1.—Codes used for STATENM, STATEAB, and STATECD. Also listed is the Region orStation code (RSCD) of the FIA unit responsible for collecting data in that State.
STATENM STATEAB STATECD RSCD STATENM STATEAB STATECD RSCD
Alabama AL 01 33 Minnesota MN 27 23Alaska-section 1 AK 102 27 Mississippi MS 28 33Alaska-section 2 AK 202 27 Missouri MO 29 23Alaska-section 3 AK 302 27 Montana MT 30 22Alaska-section 4 AK 402 27 Nebraska NE 31 23Alaska-section 5 AK 502 27 Nevada NV 32 22Alaska-section 6 AK 602 27 New Hampshire NH 33 24Alaska-section 7 AK 702 27 New Jersey NJ 34 24Alaska-section 8 AK 802 27 New Mexico NM 35 22Arizona AZ 04 22 New York NY 36 24Arkansas AR 05 33 North Carolina NC 37 33California CA 06 26 North Dakota ND 38 23Colorado CO 08 22 Ohio OH 39 24Connecticut CT 09 24 Oklahoma OK 40 33Delaware DE 10 24 Oregon OR 41 26Florida FL 12 33 Pennsylvania PA 42 24Georgia GA 13 33 Rhode Island RI 44 24Hawaii HI 15 26 South Carolina SC 45 33Idaho ID 16 22 South Dakota SD 46 23Illinois IL 17 23 Tennessee TN 47 33Indiana IN 18 23 Texas TX 48 33Iowa IA 19 23 Utah UT 49 22Kansas KS 20 23 Vermont VT 50 24Kentucky KY 21 33 Virginia VA 51 33Louisiana LA 22 33 Washington WA 53 26Maine ME 23 24 West Virginia WV 54 24Maryland MD 24 24 Wisconsin WI 55 23Massachusetts MA 25 24 Wyoming WY 56 22Michigan MI 26 23
9
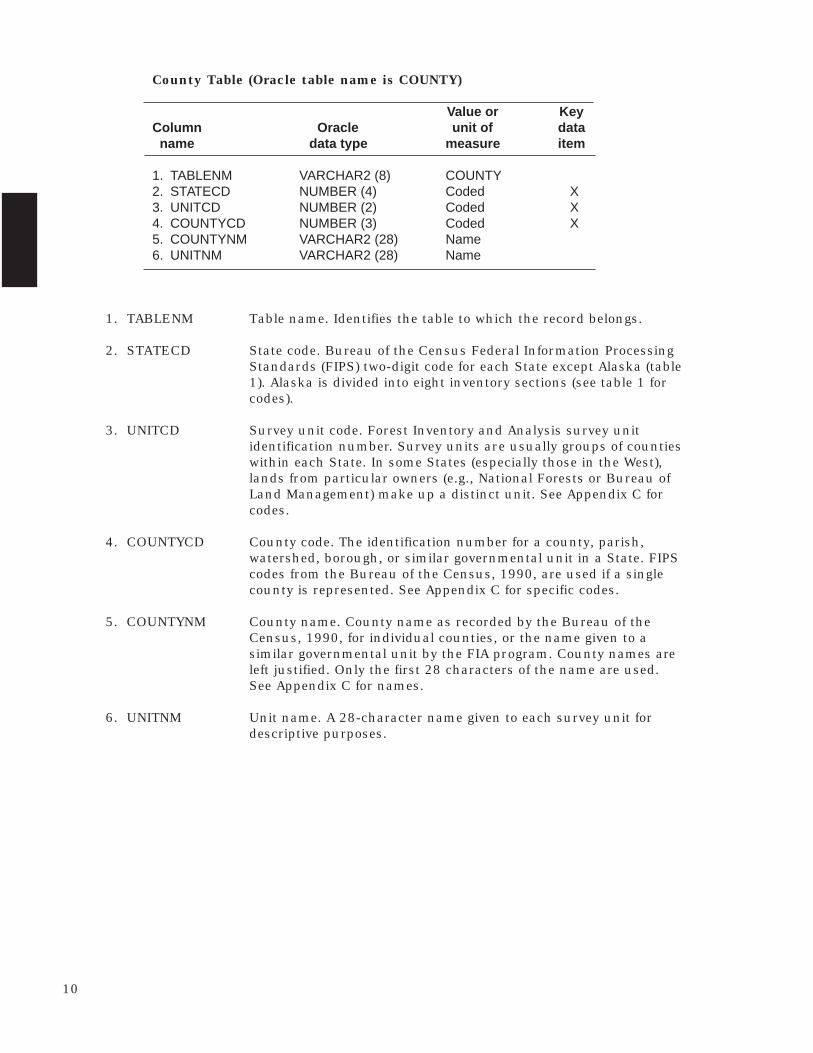
County Table (Oracle table name is COUNTY)
Value or KeyColumn Oracle unit of data name data type measure item
1. TABLENM VARCHAR2 (8) COUNTY2. STATECD NUMBER (4) Coded X3. UNITCD NUMBER (2) Coded X4. COUNTYCD NUMBER (3) Coded X5. COUNTYNM VARCHAR2 (28) Name6. UNITNM VARCHAR2 (28) Name
1. TABLENM Table name. Identifies the table to which the record belongs.
2. STATECD State code. Bureau of the Census Federal Information ProcessingStandards (FIPS) two-digit code for each State except Alaska (table1). Alaska is divided into eight inventory sections (see table 1 forcodes).
3. UNITCD Survey unit code. Forest Inventory and Analysis survey unitidentification number. Survey units are usually groups of countieswithin each State. In some States (especially those in the West),lands from particular owners (e.g., National Forests or Bureau ofLand Management) make up a distinct unit. See Appendix C forcodes.
4. COUNTYCD County code. The identification number for a county, parish,watershed, borough, or similar governmental unit in a State. FIPScodes from the Bureau of the Census, 1990, are used if a singlecounty is represented. See Appendix C for specific codes.
5. COUNTYNM County name. County name as recorded by the Bureau of theCensus, 1990, for individual counties, or the name given to asimilar governmental unit by the FIA program. County names areleft justified. Only the first 28 characters of the name are used.See Appendix C for names.
6. UNITNM Unit name. A 28-character name given to each survey unit fordescriptive purposes.
10
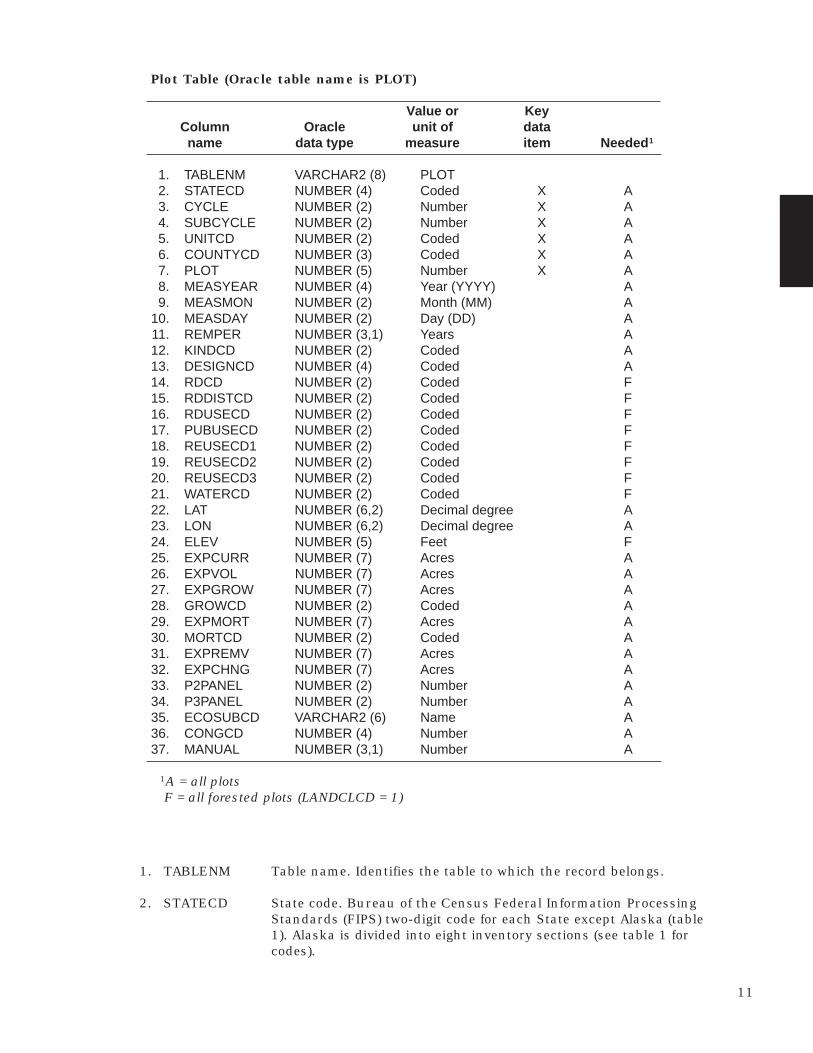
Plot Table (Oracle table name is PLOT)
Value or KeyColumn Oracle unit of dataname data type measure item Needed 1
1. TABLENM VARCHAR2 (8) PLOT2. STATECD NUMBER (4) Coded X A3. CYCLE NUMBER (2) Number X A4. SUBCYCLE NUMBER (2) Number X A5. UNITCD NUMBER (2) Coded X A6. COUNTYCD NUMBER (3) Coded X A7. PLOT NUMBER (5) Number X A8. MEASYEAR NUMBER (4) Year (YYYY) A9. MEASMON NUMBER (2) Month (MM) A
10. MEASDAY NUMBER (2) Day (DD) A11. REMPER NUMBER (3,1) Years A12. KINDCD NUMBER (2) Coded A13. DESIGNCD NUMBER (4) Coded A14. RDCD NUMBER (2) Coded F15. RDDISTCD NUMBER (2) Coded F16. RDUSECD NUMBER (2) Coded F17. PUBUSECD NUMBER (2) Coded F18. REUSECD1 NUMBER (2) Coded F19. REUSECD2 NUMBER (2) Coded F20. REUSECD3 NUMBER (2) Coded F21. WATERCD NUMBER (2) Coded F22. LAT NUMBER (6,2) Decimal degree A23. LON NUMBER (6,2) Decimal degree A24. ELEV NUMBER (5) Feet F25. EXPCURR NUMBER (7) Acres A26. EXPVOL NUMBER (7) Acres A27. EXPGROW NUMBER (7) Acres A28. GROWCD NUMBER (2) Coded A29. EXPMORT NUMBER (7) Acres A30. MORTCD NUMBER (2) Coded A31. EXPREMV NUMBER (7) Acres A32. EXPCHNG NUMBER (7) Acres A33. P2PANEL NUMBER (2) Number A34. P3PANEL NUMBER (2) Number A35. ECOSUBCD VARCHAR2 (6) Name A36. CONGCD NUMBER (4) Number A37. MANUAL NUMBER (3,1) Number A
1A = all plots F = all forested plots (LANDCLCD = 1)
1. TABLENM Table name. Identifies the table to which the record belongs.
2. STATECD State code. Bureau of the Census Federal Information ProcessingStandards (FIPS) two-digit code for each State except Alaska (table1). Alaska is divided into eight inventory sections (see table 1 forcodes).
11
3. CYCLE Inventory cycle number. Identifies the cycle number for the inven-tory data. For example, a 4 shows the data came from the fourthinventory of that State. A cycle number greater than 1 does notnecessarily mean that information for previous cycles resides in thedatabase.
4. SUBCYCLE Inventory subcycle number. For an annual inventory that takes nyears to measure all plots, subcycle shows in which of the n yearsof the cycle the data were measured. Subcycle is 0 for a periodicinventory.
5. UNITCD Survey unit code. Forest Inventory and Analysis survey unit identi-fication number. Survey units are usually groups of counties withineach State. In some States (especially those in the West), lands fromparticular owners (e.g., National Forests or Bureau of Land Manage-ment) make up a distinct unit. See Appendix C for codes.
6. COUNTYCD County code. Identification number for a county, parish, watershed,borough, or similar governmental unit in a State. FIPS codes fromthe Bureau of the Census, 1990, are used if a single county isrepresented. See Appendix C for specific codes.
7. PLOT Plot number. NOTE: Plot numbers are unique within a county forthe North Central, Northeastern, and Southern FIA units. Plotnumbers are unique within a county/survey unit combination forthe Rocky Mountain and Pacific Northwest FIA units.
8. MEASYEAR Measurement year. The year in which the plot was actually mea-sured. This year may differ from INVYR in the SURVEY table.
9. MEASMON Measurement month. The month in which the plot was actuallymeasured.
Code Month1 January2 February3 March4 April5 May6 June7 July8 August9 September
10 October11 November12 December
10. MEASDAY Measurement day. The day of the month in which the plot wasactually measured.
11. REMPER Remeasurement period code. The number of years between mea-surements of remeasured plots. This item is coded -1 for new plots.Remeasurement period is based on the number of growing seasonsbetween measurements. Allocation of parts of the growing seasonby month is different for each FIA program. Contact the FIA pro-gram for information on how this is done for a particular State.NOTE: It is not valid to use REMPER to estimate periodic change.
12
12. KINDCD Plot kind code. Indicates whether the plot is being measured forthe first time, had been measured in a previous cycle and isbeing remeasured, had been remeasured previously but couldnot be relocated and this is the replacement, or had been mea-sured in a previous cycle and data for this cycle are updated(estimated) with a model.
Code Plot kind1 New2 Remeasured3 Replacement4 Modeled
13. DESIGNCD Plot design code. Indicates the type of plot design used to collectthe data. Contact appropriate FIA program for specific codedefinitions.
Code Plot design 1 National FIA mapped plot design consisting of four
fixed-radius subplots100-199 Northeastern Station (NE)200-299 Southern Station (SRS)300-399 North Central Station (NC)400-499 Rocky Mountain Station (RM)500-599 Pacific Northwest Station (PNW)600-699 Alaska
14. RDCD Trail or road code. The type of trail or road that is closest to theplot and within 1 mile of plot center. If two or more roads are thesame distance away, the higher quality one is recorded. New in1999.
Code Type of trail or road0 None within 1 mile1 Paved road or highway2 Improved gravel road3 Improved dirt road4 Unimproved dirt or four-wheel drive road5 Human access trail primarily for recreational use
-1 Unavailable
15. RDDISTCD Code for distance to improved road. The distance from plot centerto the nearest improved road (trails or roads codes 1, 2, or 3) thatis maintained. New in 1999.
Code Horizontal distance1 100 ft or less2 101 ft to 300 ft3 301 ft to 500 ft4 501 ft to 1,000 ft5 1,001 ft to 1/2 mile6 1/2 to 1 mile7 1 to 3 miles8 3 to 5 miles9 Greater than 5 miles
-1 Unavailable
13
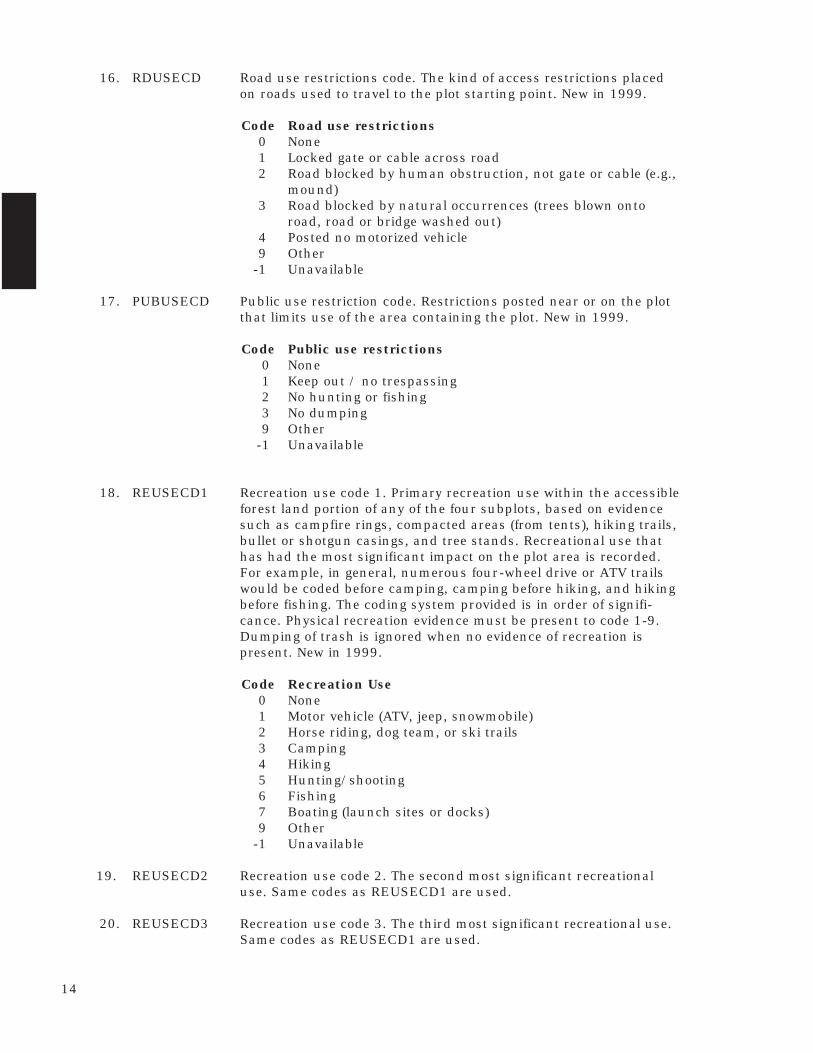
16. RDUSECD Road use restrictions code. The kind of access restrictions placedon roads used to travel to the plot starting point. New in 1999.
Code Road use restrictions0 None1 Locked gate or cable across road2 Road blocked by human obstruction, not gate or cable (e.g.,
mound)3 Road blocked by natural occurrences (trees blown onto
road, road or bridge washed out)4 Posted no motorized vehicle9 Other
-1 Unavailable
17. PUBUSECD Public use restriction code. Restrictions posted near or on the plotthat limits use of the area containing the plot. New in 1999.
Code Public use restrictions0 None1 Keep out / no trespassing2 No hunting or fishing3 No dumping9 Other
-1 Unavailable
18. REUSECD1 Recreation use code 1. Primary recreation use within the accessibleforest land portion of any of the four subplots, based on evidencesuch as campfire rings, compacted areas (from tents), hiking trails,bullet or shotgun casings, and tree stands. Recreational use thathas had the most significant impact on the plot area is recorded.For example, in general, numerous four-wheel drive or ATV trailswould be coded before camping, camping before hiking, and hikingbefore fishing. The coding system provided is in order of signifi-cance. Physical recreation evidence must be present to code 1-9.Dumping of trash is ignored when no evidence of recreation ispresent. New in 1999.
Code Recreation Use0 None1 Motor vehicle (ATV, jeep, snowmobile)2 Horse riding, dog team, or ski trails3 Camping4 Hiking5 Hunting/shooting6 Fishing7 Boating (launch sites or docks)9 Other
-1 Unavailable
19. REUSECD2 Recreation use code 2. The second most significant recreationaluse. Same codes as REUSECD1 are used.
20. REUSECD3 Recreation use code 3. The third most significant recreational use.Same codes as REUSECD1 are used.
14
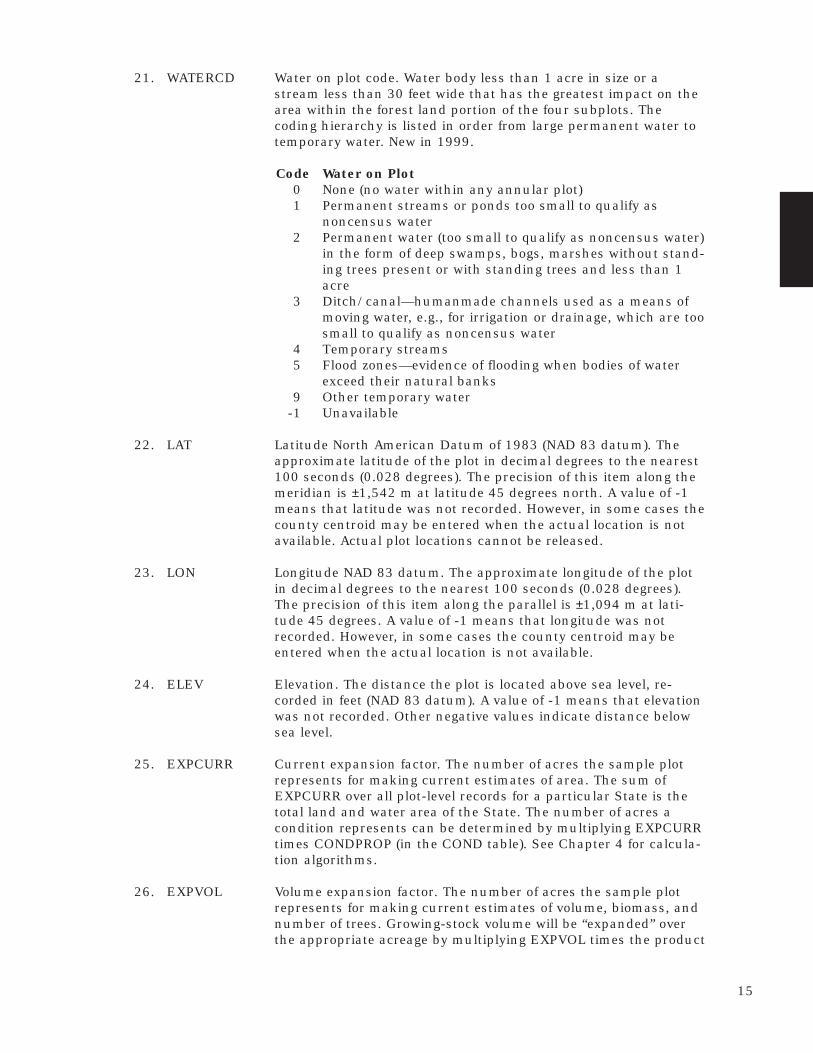
21. WATERCD Water on plot code. Water body less than 1 acre in size or astream less than 30 feet wide that has the greatest impact on thearea within the forest land portion of the four subplots. Thecoding hierarchy is listed in order from large permanent water totemporary water. New in 1999.
Code Water on Plot0 None (no water within any annular plot)1 Permanent streams or ponds too small to qualify as
noncensus water2 Permanent water (too small to qualify as noncensus water)
in the form of deep swamps, bogs, marshes without stand-ing trees present or with standing trees and less than 1acre
3 Ditch/canal—humanmade channels used as a means ofmoving water, e.g., for irrigation or drainage, which are toosmall to qualify as noncensus water
4 Temporary streams5 Flood zones—evidence of flooding when bodies of water
exceed their natural banks9 Other temporary water
-1 Unavailable
22. LAT Latitude North American Datum of 1983 (NAD 83 datum). Theapproximate latitude of the plot in decimal degrees to the nearest100 seconds (0.028 degrees). The precision of this item along themeridian is ±1,542 m at latitude 45 degrees north. A value of -1means that latitude was not recorded. However, in some cases thecounty centroid may be entered when the actual location is notavailable. Actual plot locations cannot be released.
23. LON Longitude NAD 83 datum. The approximate longitude of the plotin decimal degrees to the nearest 100 seconds (0.028 degrees).The precision of this item along the parallel is ±1,094 m at lati-tude 45 degrees. A value of -1 means that longitude was notrecorded. However, in some cases the county centroid may beentered when the actual location is not available.
24. ELEV Elevation. The distance the plot is located above sea level, re-corded in feet (NAD 83 datum). A value of -1 means that elevationwas not recorded. Other negative values indicate distance belowsea level.
25. EXPCURR Current expansion factor. The number of acres the sample plotrepresents for making current estimates of area. The sum ofEXPCURR over all plot-level records for a particular State is thetotal land and water area of the State. The number of acres acondition represents can be determined by multiplying EXPCURRtimes CONDPROP (in the COND table). See Chapter 4 for calcula-tion algorithms.
26. EXPVOL Volume expansion factor. The number of acres the sample plotrepresents for making current estimates of volume, biomass, andnumber of trees. Growing-stock volume will be “expanded” overthe appropriate acreage by multiplying EXPVOL times the product
15
of VOLCFNET (in the TREE table) and the trees per acre item(TPACURR in the TREE table). See Chapter 4 for calculationalgorithms.
27. EXPGROW Growth expansion factor. The number of acres the sample plotrepresents for estimating growth. Growth will be “expanded”over the appropriate acreage by multiplying EXPGROW timesthe product of the growth item (GROWCFGS, GROWBFSL, orGROWCFAL in the TREE table) and the growth trees per acreitem (TPAGROW in the TREE table). Total growth in a State iscalculated by summing these expanded estimates from all treeson all plots in a particular State in the FIADB. Some plots mayhave a value of zero in this field. For example, in a State whereboth remeasured and new plots exist for a cycle, growth esti-mates might only be based on remeasurement plots. Therefore,new plots would have a value of zero in EXPGROW. See Chap-ter 4 for calculation algorithms.
28. GROWCD Code for type of annual volume growth. Indicates how volumegrowth is estimated. Current annual growth is an estimate ofthe change in volume that occurred in a 1-year period endingwhen the plot was measured. Periodic annual growth is anestimate of the average annual change in volume occurringbetween two measurements, usually the current cycle andprevious cycle.
Code Type of annual volume growth1 Current annual2 Periodic annual
-1 Plot does not contribute to growth estimates
29. EXPMORT Mortality expansion factor. The number of acres the sampleplot represents for estimating mortality. Mortality will be“expanded” over the appropriate acreage by multiplyingEXPMORT times the product of the mortality item(MORTCFGS, MORTBFSL, or MORTCFAL in the TREE table)and the mortality trees per acre item (TPAMORT in the TREEtable). Total mortality in a State is calculated by summingthese expanded estimates from all trees on all plots in a par-ticular State in the FIADB. Some plots may have a value of zeroin this field. For example, in a State where both remeasuredand new plots exist for a cycle, mortality estimates might onlybe based on remeasurement plots. Therefore, new plots wouldhave a value of zero in EXPMORT. See Chapter 4 for calcula-tion algorithms.
30. MORTCD Code for type of annual mortality volume. Indicates how mor-tality volume is estimated. Current annual mortality is anestimate of the volume of trees dying during a 1-year periodending when the plot was measured. Periodic annual mortalityis an estimate of the average annual volume of trees dyingbetween two measurements, usually the current cycle andprevious cycle.
16

Code Type of annual mortality volume1 Current annual2 Periodic annual
-1 Plot does not contribute to mortality estimates
31. EXPREMV Removals expansion factor. The number of acres the sample plotrepresents for estimating removals. Removals will be “expanded”over the appropriate acreage by multiplying EXPREMV times theproduct of the removal item (REMVCFGS, REMVBFSL, orREMVCFAL in the TREE table) and the removal trees per acreitem (TPAREMV in the TREE table). In inventories where remov-als are only estimated on remeasurement plots, EXPREMV=0 fornew or temporary plots. See Chapter 4 for calculation algo-rithms.
32. EXPCHNG Periodic change expansion factor. The number of acres that thesample plot represents for estimating periodic area change.
33. P2PANEL Phase 2 panel number. Forest Inventory and Analysis panelnumber. This is recorded for inventories begun after 1998. Formost inventories begun before 1999, the value of P2PANEL isset to -1. Plots on the base grid are measured on a multiple-yearcycle with the intention of measuring 1/n (where n is the num-ber of years in the cycle) of the plots (called a panel) every year.The plots in any panel are chosen so they are uniformly distrib-uted within the monitoring area.
34. P3PANEL Phase 3 panel number. Forest Health Monitoring panel number.Forest Health Monitoring was designed to monitor, assess, andreport on long-term status, changes, and trends in forest eco-system health on a regional and national basis. Before 1999,FHM and FIA were distinct programs and the plots were notnecessarily co-located. FIA and FHM field plots are co-locatedfor inventories begun after 1998. The FHM suite of data is nowcollected on a subset of FIA plots and are referred to as phase 3data. Phase 3 data are collected on a 5-year cycle with one-fifthof the plots (called a panel) measured every year. The phase 3plots in any panel are chosen so they are uniformly distributedwithin the monitoring area. The value for P3PANEL ranges from0 to 5 for those plots where phase 3 data were collected. Thevalue of P3PANEL for all other plots is -1.
35. ECOSUBCD Ecological subsection code. An area of similar surficial geology,lithology, geomorphic process, soil groups, subregional climate,and potential natural communities. Subsection boundariesusually correspond with discrete changes in geomorphology.Subsection information is used for broad planning and assess-ment. Subsection codes may consist of up to six characters andwere developed by the Forest Service as part of the NationalHierarchical Framework of Ecological Units.
36. CONGCD Congressional District code. A territorial division of a State fromwhich a member of the U.S. House of Representatives is elected.There are 435 congressional districts in the United Statesapportioned to the States based on population; each Statereceives at least one congressional district. The Congressional
17

District code assigned to a plot (regardless of when it was mea-sured) is for the most recent Congress. CONGCD is a four-digitnumber. The first two digits are the State FIPS code and the lasttwo digits are the congressional district number. If a State hasonly one congressional district, the congressional district num-ber is 00.
37. MANUAL Field manual version. Version of the National Field Manual usedto describe procedures for collecting data on the plot. New in1999.
18
1. TABLENM Table name. Identifies the table to which the record belongs.
2. STATECD State code. Bureau of the Census Federal Information ProcessingStandards (FIPS) two-digit code for each State except Alaska(table 1). Alaska is divided into eight inventory sections (see table1 for codes).
3. CYCLE Inventory cycle number. Identifies the cycle number for theinventory data. For example, a 4 shows the data came from thefourth inventory of that State. A cycle number greater than 1 doesnot necessarily mean that information for previous cycles residesin the database.
4. SUBCYCLE Inventory subcycle number. For an annual inventory that takes nyears to measure all plots, subcycle shows in which of the n yearsof the cycle the data were measured. Subcycle is 0 for a periodicinventory.
5. UNITCD Survey unit code. Forest Inventory and Analysis survey unitidentification number. Survey units are usually groups of coun-ties within each State. In some States (especially those in theWest), lands from particular owners (e.g., National Forests orBureau of Land Management) make up a distinct unit. See Ap-pendix C for codes.
6. COUNTYCD County code. Identification number for a county, parish, water-shed, borough, or similar governmental unit in a State. FIPScodes from the Bureau of the Census, 1990, are used if a singlecounty is represented. See Appendix C for specific codes.
7. PLOT Plot number. NOTE: Plot numbers are unique within a county forthe North Central, Northeastern, and Southern FIA units. Plotnumbers are unique within a county/survey unit combination forthe Rocky Mountain and Pacific Northwest FIA units.
8. SUBP Subplot number. Number of the subplot.
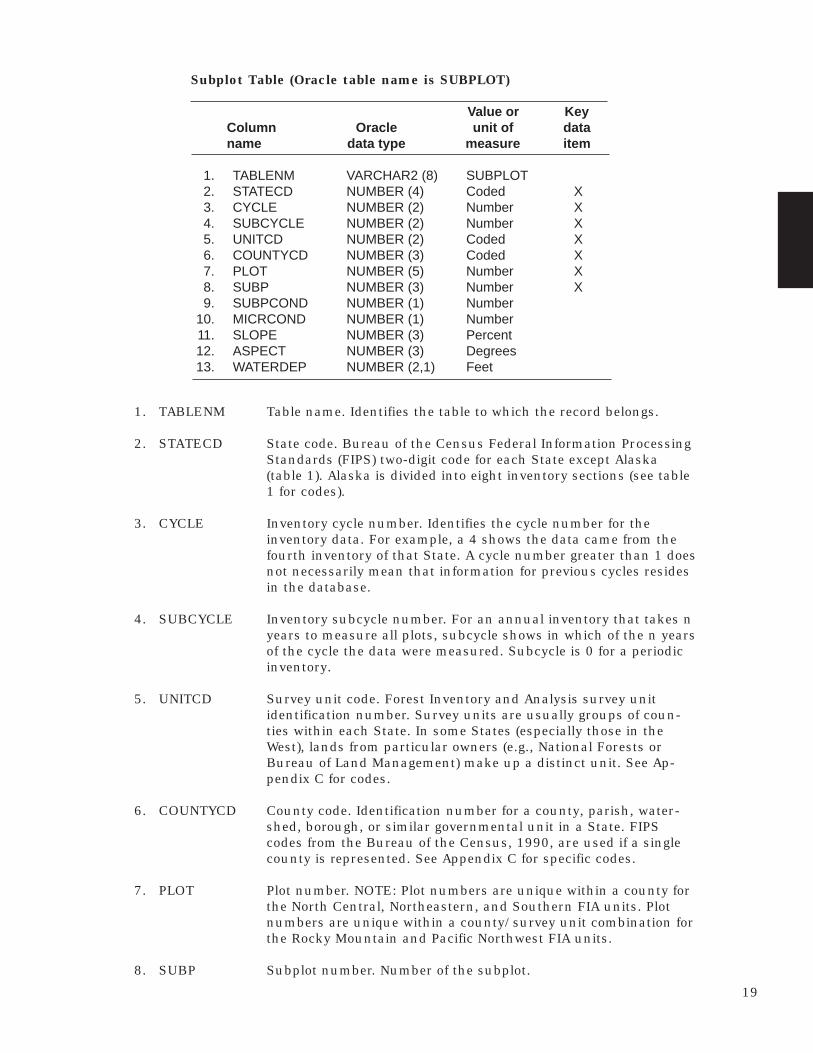
Subplot Table (Oracle table name is SUBPLOT)
Value or KeyColumn Oracle unit of dataname data type measure item
1. TABLENM VARCHAR2 (8) SUBPLOT2. STATECD NUMBER (4) Coded X3. CYCLE NUMBER (2) Number X4. SUBCYCLE NUMBER (2) Number X5. UNITCD NUMBER (2) Coded X6. COUNTYCD NUMBER (3) Coded X7. PLOT NUMBER (5) Number X8. SUBP NUMBER (3) Number X9. SUBPCOND NUMBER (1) Number
10. MICRCOND NUMBER (1) Number11. SLOPE NUMBER (3) Percent12. ASPECT NUMBER (3) Degrees13. WATERDEP NUMBER (2,1) Feet
19

20
9. SUBPCOND Subplot center condition. Condition number for the condition atthe center of the subplot.
10. MICRCOND Microplot center condition. Condition number for the condition atthe center of the microplot.
11. SLOPE Subplot slope. Average percent slope of the subplot. Valid valuesare 0 through 200. When slope is not recorded, this field contains-1.
12. ASPECT Subplot aspect. The direction of drainage for most of the subplot,in degrees from magnetic north. North is recorded as 360. Whenslope <5, there is no aspect and this item is set to zero. Forsubplots without a recorded aspect, this field contains -1.
13. WATERDEP Water or snow depth. The approximate depth (in feet) of water orsnow covering the subplot when data were collected (-1 if notcollected). New in 1999.
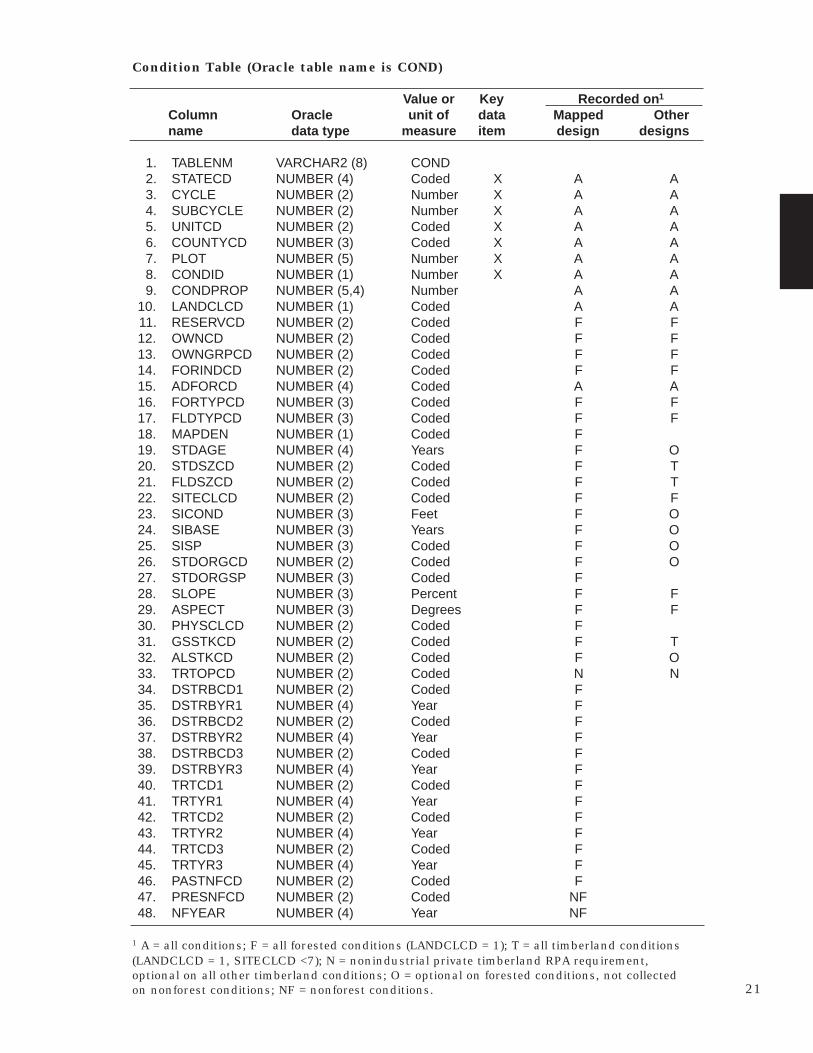
Condition Table (Oracle table name is COND)
Value or Key Recorded on 1
Column Oracle unit of data Mapped Othername data type measure item design designs
1. TABLENM VARCHAR2 (8) COND2. STATECD NUMBER (4) Coded X A A3. CYCLE NUMBER (2) Number X A A4. SUBCYCLE NUMBER (2) Number X A A5. UNITCD NUMBER (2) Coded X A A6. COUNTYCD NUMBER (3) Coded X A A7. PLOT NUMBER (5) Number X A A8. CONDID NUMBER (1) Number X A A9. CONDPROP NUMBER (5,4) Number A A
10. LANDCLCD NUMBER (1) Coded A A11. RESERVCD NUMBER (2) Coded F F12. OWNCD NUMBER (2) Coded F F13. OWNGRPCD NUMBER (2) Coded F F14. FORINDCD NUMBER (2) Coded F F15. ADFORCD NUMBER (4) Coded A A16. FORTYPCD NUMBER (3) Coded F F17. FLDTYPCD NUMBER (3) Coded F F18. MAPDEN NUMBER (1) Coded F19. STDAGE NUMBER (4) Years F O20. STDSZCD NUMBER (2) Coded F T21. FLDSZCD NUMBER (2) Coded F T22. SITECLCD NUMBER (2) Coded F F23. SICOND NUMBER (3) Feet F O24. SIBASE NUMBER (3) Years F O25. SISP NUMBER (3) Coded F O26. STDORGCD NUMBER (2) Coded F O27. STDORGSP NUMBER (3) Coded F28. SLOPE NUMBER (3) Percent F F29. ASPECT NUMBER (3) Degrees F F30. PHYSCLCD NUMBER (2) Coded F31. GSSTKCD NUMBER (2) Coded F T32. ALSTKCD NUMBER (2) Coded F O33. TRTOPCD NUMBER (2) Coded N N34. DSTRBCD1 NUMBER (2) Coded F35. DSTRBYR1 NUMBER (4) Year F36. DSTRBCD2 NUMBER (2) Coded F37. DSTRBYR2 NUMBER (4) Year F38. DSTRBCD3 NUMBER (2) Coded F39. DSTRBYR3 NUMBER (4) Year F40. TRTCD1 NUMBER (2) Coded F41. TRTYR1 NUMBER (4) Year F42. TRTCD2 NUMBER (2) Coded F43. TRTYR2 NUMBER (4) Year F44. TRTCD3 NUMBER (2) Coded F45. TRTYR3 NUMBER (4) Year F46. PASTNFCD NUMBER (2) Coded F47. PRESNFCD NUMBER (2) Coded NF48. NFYEAR NUMBER (4) Year NF
1 A = all conditions; F = all forested conditions (LANDCLCD = 1); T = all timberland conditions(LANDCLCD = 1, SITECLCD <7); N = nonindustrial private timberland RPA requirement,optional on all other timberland conditions; O = optional on forested conditions, not collectedon nonforest conditions; NF = nonforest conditions. 21
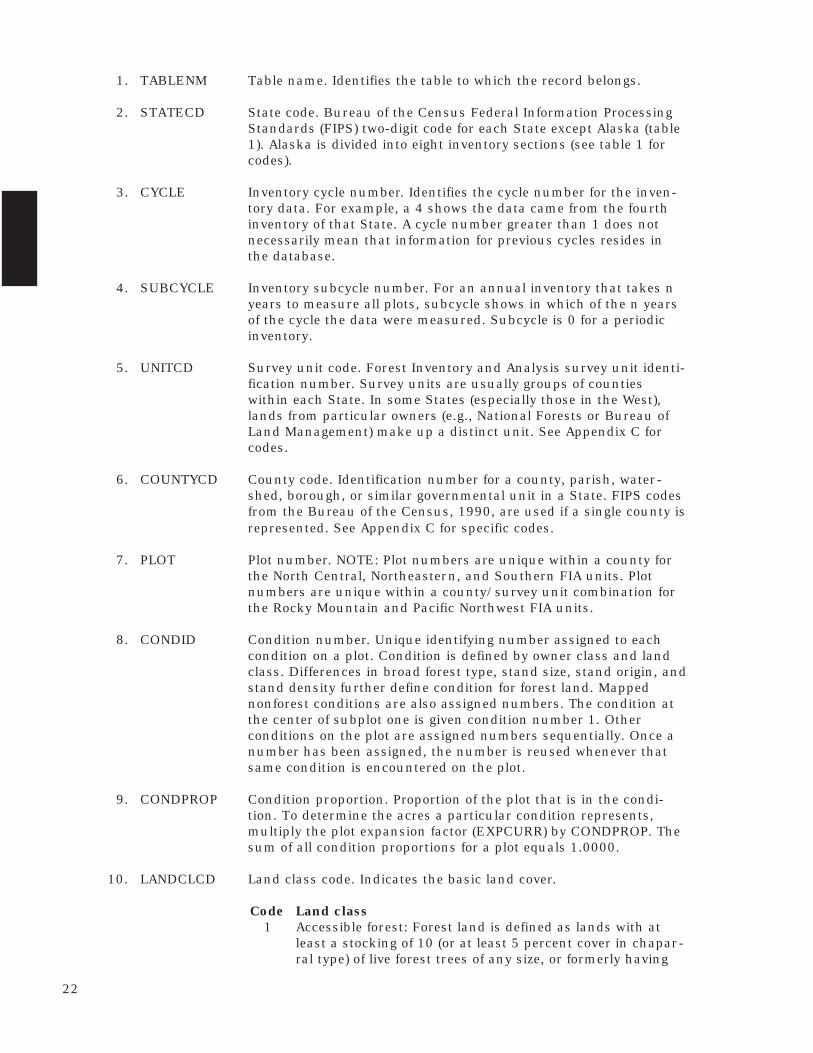
1. TABLENM Table name. Identifies the table to which the record belongs.
2. STATECD State code. Bureau of the Census Federal Information ProcessingStandards (FIPS) two-digit code for each State except Alaska (table1). Alaska is divided into eight inventory sections (see table 1 forcodes).
3. CYCLE Inventory cycle number. Identifies the cycle number for the inven-tory data. For example, a 4 shows the data came from the fourthinventory of that State. A cycle number greater than 1 does notnecessarily mean that information for previous cycles resides inthe database.
4. SUBCYCLE Inventory subcycle number. For an annual inventory that takes nyears to measure all plots, subcycle shows in which of the n yearsof the cycle the data were measured. Subcycle is 0 for a periodicinventory.
5. UNITCD Survey unit code. Forest Inventory and Analysis survey unit identi-fication number. Survey units are usually groups of countieswithin each State. In some States (especially those in the West),lands from particular owners (e.g., National Forests or Bureau ofLand Management) make up a distinct unit. See Appendix C forcodes.
6. COUNTYCD County code. Identification number for a county, parish, water-shed, borough, or similar governmental unit in a State. FIPS codesfrom the Bureau of the Census, 1990, are used if a single county isrepresented. See Appendix C for specific codes.
7. PLOT Plot number. NOTE: Plot numbers are unique within a county forthe North Central, Northeastern, and Southern FIA units. Plotnumbers are unique within a county/survey unit combination forthe Rocky Mountain and Pacific Northwest FIA units.
8. CONDID Condition number. Unique identifying number assigned to eachcondition on a plot. Condition is defined by owner class and landclass. Differences in broad forest type, stand size, stand origin, andstand density further define condition for forest land. Mappednonforest conditions are also assigned numbers. The condition atthe center of subplot one is given condition number 1. Otherconditions on the plot are assigned numbers sequentially. Once anumber has been assigned, the number is reused whenever thatsame condition is encountered on the plot.
9. CONDPROP Condition proportion. Proportion of the plot that is in the condi-tion. To determine the acres a particular condition represents,multiply the plot expansion factor (EXPCURR) by CONDPROP. Thesum of all condition proportions for a plot equals 1.0000.
10. LANDCLCD Land class code. Indicates the basic land cover.
Code Land class1 Accessible forest: Forest land is defined as lands with at
least a stocking of 10 (or at least 5 percent cover in chapar-ral type) of live forest trees of any size, or formerly having
22
such tree cover, and not currently developed for nonforestuse. The minimum area for classification of forest land isusually 1 acre with a minimum width of 120 feet stem-to-stem. Forested strips must be at least 120 feet wide for acontinuous length of at least 363 feet to meet the acrethreshold. Unimproved roads and trails, as well as clear-ings in forest areas are classified as forest if less than 120feet wide or smaller than 1 acre.
2 Nonforest: Land that has never supported forests or landformerly forested but now developed for uses such asagriculture (including Christmas tree plantations, or-chards, nurseries, and agroforestry), residences, com-merce, industry, city parks, or improved roads. If locatedwithin forest areas, unimproved roads and nonforestedstrips must be more than 120 feet wide. Clearings andother openings in a forest area must be more than 1 acreto qualify as nonforest land.
3 Noncensus water: Streams, sloughs, estuaries, andcanals between 30 and 200 feet, and lakes, reservoirs,and ponds between 1 and 4.5 acres in area. This defini-tion was used in the 1990 census and applied when thedata became available. Earlier inventories definednoncensus water differently.
4 Census water: Streams, sloughs, estuaries, and canalsmore than 200 feet wide, and lakes, reservoirs, and pondsmore than 4.5 acres in size (1990 Census definition).
5 Denied access: Access to the plot or a portion of the plotdenied by the legal owner or by an owner of land with theonly reasonable route to the plot.
6 Hazardous: Access prohibited due to dangerous situa-tions (cliffs, military reservations, strip mines, etc.).
7 Not in the sample: Outside the boundaries of the samplepopulation.
11. RESERVCD Reserved status class code. Reserved land is land that is with-drawn by law(s) prohibiting the management of the land for theproduction of wood products.Code Reserved status class
0 Not reserved1 Reserved
-1 Not recorded
12. OWNCD Owner class code. Indicates the class in which the landowner (atthe time of the inventory) belongs.
Code Owner class11 National Forest: Lands administered by USDA Forest
Service, National Forest System12 National Grassland13 Other Forest Service21 National Park Service: Lands administered by USDI
National Park Service22 Bureau of Land Management: Lands administered by
USDI Bureau of Land Management23 Fish and Wildlife Service24 Department of Defense/Energy
23

25 Other federal31 State32 Local (County, Municipal, etc.)33 Other non-federal public41 Corporate42 Non-governmental conservation/natural resources organi-
zation43 Unincorporated local partnership/association/club44 Native American (Indian)45 Individual46 Undifferentiated private (Used in counties where a more
specific ownership code might disclose information aboutan individual landowner)
-1 Not recorded
13. OWNGRPCD Ownership group class code. A broader group of landownerclasses.
Code Ownership group1 Forest Service (OWNCD 11, 12, 13)2 Other federal (OWNCD 21, 22, 23, 24, 25)3 State and local government (OWNCD 31, 32, 33)4 Private (OWNCD 41, 42, 43, 44, 45, 46)
-1 Not recorded
14. FORINDCD Private owner industrial status code. Indicates whether thelandowner owns and operates a primary wood processing plant. Aprimary wood processing plant is any commercial operation thatoriginates the primary processing of wood on a regular andcontinuing basis. Examples include: pulp or paper mill, sawmill,panel board mill, post or pole mill.
Code Private owner industrial status0 Not owned by a company with wood processing plant1 Owned by a company with wood processing plant
-1 Unavailable (Not collected or OWNCD=46)
15. ADFORCD Administrative forest code. Identifies the administrative unit(Forest Service Region and National Forest) in which the conditionis located. If the land is not administered by the Forest Service,the value for this variable is set to -1. The first two digits of thefour-digit code are for the Region number and the last two digitsare for the National Forest number. See Appendix E for a com-plete list of codes.
16. FORTYPCD Forest type code (derived by algorithm). The forest typing algo-rithm is a hierarchical procedure. The algorithm begins by com-paring the live tree stocking of softwoods and hardwoods andcontinues in a stepwise fashion comparing successively smallersubgroups of the preceding aggregation of initial types. Theaggregated initial type groups used at each step of the process arecalled combined type groups. Each initial type group can occur inmore than one of these combined groups. The stepwise progres-sion proceeds in most cases until a plurality of an initial typegroup is identified. In certain situations the algorithm may revertto the field call. Detailed types are listed in Appendix D. Informa-tion on how data are assigned to these types for a particular State
24
can be obtained by contacting the appropriate FIA unit.Nonstocked forest land has a live tree stocking <10. All forestconditions are assigned a forest type, and nonforest conditionsare assigned -1.
17. FLDTYPCD Code for forest type of the condition (assigned by the field crew).Forest type is based on the tree species or species groups forminga plurality of all live stocking. Detailed types are listed in Appen-dix D. Information on how data are assigned to these types for aparticular State can be obtained by contacting the appropriateFIA unit. Nonstocked forest land has a live tree stocking <10. Allforest conditions are assigned a forest type, and nonforest condi-tions are assigned -1.
18. MAPDEN Code for change in tree density. Codes other than 1 are used toindicate that tree density is the only factor differentiating twoconditions. New in 1999.
Code Change in tree density 1 Initial tree density 2 Density class 2 – different than initial density 3 Density class 3 – different than initial density and density
class 2
19. STDAGE Stand age. The average total age, to the nearest year, of the trees(plurality of all live trees not overtopped) in the predominantstand-size class of the condition, determined using local proce-dures. Age is difficult to measure and therefore stand age mayhave large measurement errors. Nonstocked stands are recordedas 0. If age is not available, -1 is recorded. Any inventory dated1995 or later will contain stand ages recorded to the nearestyear. For some older inventories, stand age was recorded in10-year classes for stands <100 years old, 20-year age classes forstands between 100 and 200 years, and 100-year age classes ifolder than 200 years. The value recorded is the midpoint of theage class.
20. STDSZCD Code for stand-size class derived by algorithm. A classification ofthe predominant (based on stocking) diameter class of live treeswithin the condition. Large diameter trees are at least 11.0inches diameter for hardwoods and at least 9.0 inches diameterfor softwoods. Medium diameter trees are at least 5.0 inchesdiameter but not as large as large diameter trees. Small diametertrees are less than 5.0 inches diameter.
Code Stand-size class1 Large diameter: Stands with an all live stocking of at least
10 (base 100); with more than 50 percent of the stockingin medium and large diameter trees; and with the stock-ing of large diameter trees equal to or greater than thestocking of medium diameter trees.
2 Medium diameter: Stands with an all live stocking of atleast 10 (base 100); with more than 50 percent of thestocking in medium and large diameter trees; and withthe stocking of large diameter trees less than the stockingof medium diameter trees.
25
3 Small diameter: Stands with an all live stocking value ofat least 10 (base 100) on which at least 50 percent ofthe stocking is in small diameter trees.
4 Chaparral: Forest land with all live stocking less than10 and at least 5 percent cover by species that make upchaparral communities.
5 Nonstocked: Forest land with all live stocking less than10.
-1 Not recorded.
21. FLDSZCD Code for stand-size class assigned by the field crew. A classifi-cation of the predominant (based on stocking) diameter class oflive trees within the condition.
Code Stand-size class0 Nonstocked: Meeting the definition of accessible land
and one of the following applies: 1) less than 10 percentstocked by trees of any size, and not classified as chap-arral, or 2) for forest types where stocking standards arenot available, less than 5 percent crown cover of trees ofany size.
1 1.0 - 4.9 inches: At least 10 percent stocking (or 5percent crown cover if stocking tables are not available)in trees of any size; and at least one-third of the crowncover is in trees less than 5.0 inches DBH/DRC.
2 5.0 - 8.9 inches (softwoods)/5.0 - 10.9 inches (hard-woods): At least 10 percent stocking (or 5 percent crowncover if stocking tables are not available) in trees of anysize; and at least one-third of the crown cover is in treesgreater than 5.0 inches DBH/DRC and the plurality ofthe crown cover is in softwoods 5.0 - 8.9 inches indiameter and/or hardwoods 5.0 - 10.9 in DBH, and forwestern woodland trees 5.0 - 8.9 inches in DRC.
3 9.0 - 19.9 inches (softwoods)/11.0 - 19.9 inches (hard-woods): At least 10 percent stocking (or 5 percent crowncover if stocking tables are not available) in trees of anysize; and at least one-third of the crown cover is in treesgreater than 5.0 inches DBH/DRC and the plurality ofthe crown cover is in softwoods 9.0 - 19.9 inches indiameter and/or hardwoods 11.0 - 19.9 inches in DBH,and for western woodland trees 9.0 - 19.9 inches inDRC.
4 20.0 - 39.9 inches: At least 10 percent stocking (or 5percent crown cover if stocking tables are not available)in trees of any size; and at least one-third of the crowncover is in trees greater than 5.0 inches DBH/DRC andthe plurality of the crown cover is in trees 20.0 - 39.9inches DBH.
5 40.0+ inches: At least 10 percent stocking (or 5 percentcrown cover if stocking tables are not available) in treesof any size; and at least one-third of the crown cover isin trees greater than 5.0 inches DBH/DRC and theplurality of the crown cover is in trees over 40.0+ inchesDBH.
6 Chaparral: Less than 10 percent stocking by trees ofany size, and greater than 5 percent crown cover of
26
species that make up chaparral communities.-1 Not recorded.
22. SITECLCD Site productivity class code. A classification of forest land in termsof inherent capacity to grow crops of industrial wood. Identifiesthe potential growth in cubic feet/acre/year and is based on theculmination of mean annual increment of fully stocked naturalstands.
Code Site productivity class(cubic feet/acre/year)
1 225+2 165-2243 120-1644 85-1195 50-846 20-497 0-19
-1 Not recorded
23. SICOND Site index. Site index (in feet) within the condition. If site index isnot available for the condition, a -1 is recorded.
24. SIBASE Site index base age. The base age (in years) of the site indexcurves used to derive site index. A -1 is recorded if there is no siteindex.
25. SISP Site index species code. The species upon which the site index isbased. If there is no SI or the species associated with SI is notknown, -1 is recorded.
26. STDORGCD Stand origin code. Method of stand regeneration for the trees inthe condition. An artificially regenerated stand is established byplanting or artificial seeding.
Code Stand origin0 Natural stands1 Clear evidence of artificial regeneration
-1 Not evaluated
27. STDORGSP Stand origin species code. The species code for the predominantartificially regenerated species (only when STDORGCD=1, –1otherwise).
28. SLOPE Slope. The average percent slope within the condition. Valid valuesare 0 through 200. Before 2000, the field crew measured condi-tion slope. Beginning in 2000, slope is collected on subplots butno longer collected for conditions. For plots taken after 2000, theslope from the subplot representing the greatest percentage of thecondition will be assigned as a surrogate. In the event that two ormore subplots represent the same amount of area in the condi-tion, the slope from the lower numbered subplot is used. Whenslope is not recorded or cannot be derived, this field contains -1.
29. ASPECT Aspect. The direction (in degrees) from magnetic north of drainagefor most of the condition, recorded as the azimuth of this direc-tion. North is recorded as 360. When slope is zero, there is no
27

aspect and this item is set to zero. Before 2000, the field crewmeasured condition aspect. Beginning in 2000, aspect is collectedon subplots but no longer collected for conditions. For plots takenafter 2000, the aspect from the subplot representing the greatestpercentage of the condition will be assigned as a surrogate. In theevent that two or more subplots represent the same percentage ofarea in the condition, the slope from the lower numbered subplotis used. For conditions without a recorded or derived aspect, thisfield contains -1.
30. PHYSCLCD Physiographic class code. The general effect of land form, topo-graphical position, and soil on moisture available to trees. New oradditional classes in 1999.
Code Physiographic classXeric sites (normally low or deficient in available moisture)
11 Dry Tops - Ridge tops with thin rock outcrops and consid-erable exposure to sun and wind.
12 Dry Slopes - Slopes with thin rock outcrops and consider-able exposure to sun and wind. Includes most mountain/steep slopes with a southern or western exposure.
13 Deep Sands - Sites with a deep, sandy surface subject torapid loss of moisture following precipitation. Typicalexamples include sand hills, ridges, and flats in the South,sites along the beach and shores of lakes and streams.
19 Other Xeric - All dry physiographic sites not describedabove.
Mesic sites (normally moderate but adequate availablemoisture)
21 Flatwoods - Flat or fairly level sites outside of flood plains.Excludes deep sands and wet, swampy sites.
22 Rolling Uplands - Hills and gently rolling, undulatingterrain and associated small streams. Excludes deepsands, all hydric sites, and streams with associated floodplains.
23 Moist Slopes and Coves - Moist slopes and coves withrelatively deep, fertile soils. Often these sites have a north-ern or eastern exposure and are partially shielded fromwind and sun. Includes moist mountain tops and saddles.
24 Narrow Flood Plains/Bottomlands - Flood plains andbottomlands less than 1/4 mile in width along rivers andstreams. These sites are normally well drained but aresubjected to occasional flooding during periods of heavy orextended precipitation. Includes associated levees,benches, and terraces within a 1-mile limit. Excludesswamps, sloughs, and bogs.
25 Broad Flood Plains/Bottomlands - Flood plains and bot-tomlands less than 1/4 mile or wider along rivers andstreams. These sites are normally well drained but aresubjected to occasional flooding during periods of heavy orextended precipitation. Includes associated levees,benches, and terraces within a 1/4-mile limit. Excludesswamps, sloughs, and bogs with year-round water prob-lems within the 1/4-mile limit.
29 Other Mesic - All moderately moist physiographic sites notdescribed above.
28

Hydric sites (normally abundant or overabundant mois-ture all year)
31 Swamps/Bogs - Low, wet, flat, forested areas usually quiteextensive that are flooded for long periods except duringperiods of extreme drought. Excludes cypress ponds andsmall drains.
32 Small Drains - Narrow, stream-like, wet strands of forestland often without a well-defined stream channel. Theseareas are poorly drained or flooded throughout most of theyear and drain the adjacent higher ground.
33 Bays and Wet Pocosins - Low, wet, boggy sites character-ized by peaty or organic soils. May be somewhat dryduring periods of extended drought. Examples includesites in the Lake States with lowland swamp conifers.
34 Beaver Ponds.35 Cypress Ponds.39 Other Hydric - All other hydric physiographic sites.-1 Unavailable.
31. GSSTKCD Growing-stock stocking code. Stocking of the condition by grow-ing-stock trees including seedlings.
Code Growing-stock stocking1 Overstocked (100+ %)2 Fully stocked (60 – 99%)3 Medium stocked (35 – 59%)4 Poorly stocked (10 – 34%)5 Nonstocked ( 0 – 9%)
-1 Unavailable
32. ALSTKCD All live stocking code. Stocking of the condition by live treesincluding seedlings. Data are in classes as listed for GSSTKCDabove. This variable may not be present for inventories usingolder designs.
33. TRTOPCD Treatment opportunity class code. Identifies the physical opportu-nity to improve stand conditions by applying management prac-tices. Determined only for timberland (SITECLCD 1-6). Thisvariable is mandatory for nonindustrial private lands AND maynot be available for other ownerships.
Code Treatment opportunity class
1 Regeneration without site preparation: The area is charac-terized by the absence of a manageable stand because ofinadequate stocking of growing stock. Growth will bemuch below the potential for the site if the area is leftalone. Prospects are not good for natural regeneration.Artificial regeneration will require little or no site prepara-tion.
2 Regeneration with site preparation: The area is character-ized by the absence of a manageable stand because ofinadequate stocking of growing stock. Growth will bemuch below the potential for the site if the area is leftalone. Either natural or artificial regeneration will requiresite preparation.
29
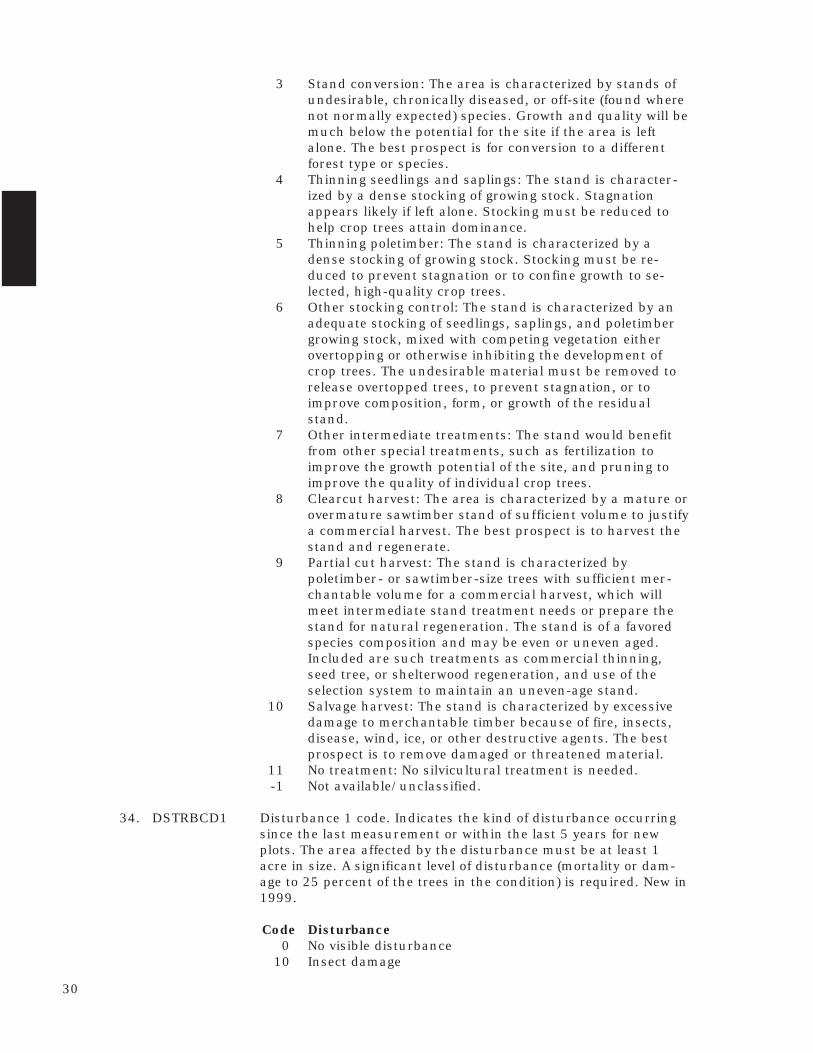
3 Stand conversion: The area is characterized by stands ofundesirable, chronically diseased, or off-site (found wherenot normally expected) species. Growth and quality will bemuch below the potential for the site if the area is leftalone. The best prospect is for conversion to a differentforest type or species.
4 Thinning seedlings and saplings: The stand is character-ized by a dense stocking of growing stock. Stagnationappears likely if left alone. Stocking must be reduced tohelp crop trees attain dominance.
5 Thinning poletimber: The stand is characterized by adense stocking of growing stock. Stocking must be re-duced to prevent stagnation or to confine growth to se-lected, high-quality crop trees.
6 Other stocking control: The stand is characterized by anadequate stocking of seedlings, saplings, and poletimbergrowing stock, mixed with competing vegetation eitherovertopping or otherwise inhibiting the development ofcrop trees. The undesirable material must be removed torelease overtopped trees, to prevent stagnation, or toimprove composition, form, or growth of the residualstand.
7 Other intermediate treatments: The stand would benefitfrom other special treatments, such as fertilization toimprove the growth potential of the site, and pruning toimprove the quality of individual crop trees.
8 Clearcut harvest: The area is characterized by a mature orovermature sawtimber stand of sufficient volume to justifya commercial harvest. The best prospect is to harvest thestand and regenerate.
9 Partial cut harvest: The stand is characterized bypoletimber- or sawtimber-size trees with sufficient mer-chantable volume for a commercial harvest, which willmeet intermediate stand treatment needs or prepare thestand for natural regeneration. The stand is of a favoredspecies composition and may be even or uneven aged.Included are such treatments as commercial thinning,seed tree, or shelterwood regeneration, and use of theselection system to maintain an uneven-age stand.
10 Salvage harvest: The stand is characterized by excessivedamage to merchantable timber because of fire, insects,disease, wind, ice, or other destructive agents. The bestprospect is to remove damaged or threatened material.
11 No treatment: No silvicultural treatment is needed.-1 Not available/unclassified.
34. DSTRBCD1 Disturbance 1 code. Indicates the kind of disturbance occurringsince the last measurement or within the last 5 years for newplots. The area affected by the disturbance must be at least 1acre in size. A significant level of disturbance (mortality or dam-age to 25 percent of the trees in the condition) is required. New in1999.
Code Disturbance0 No visible disturbance
10 Insect damage
30
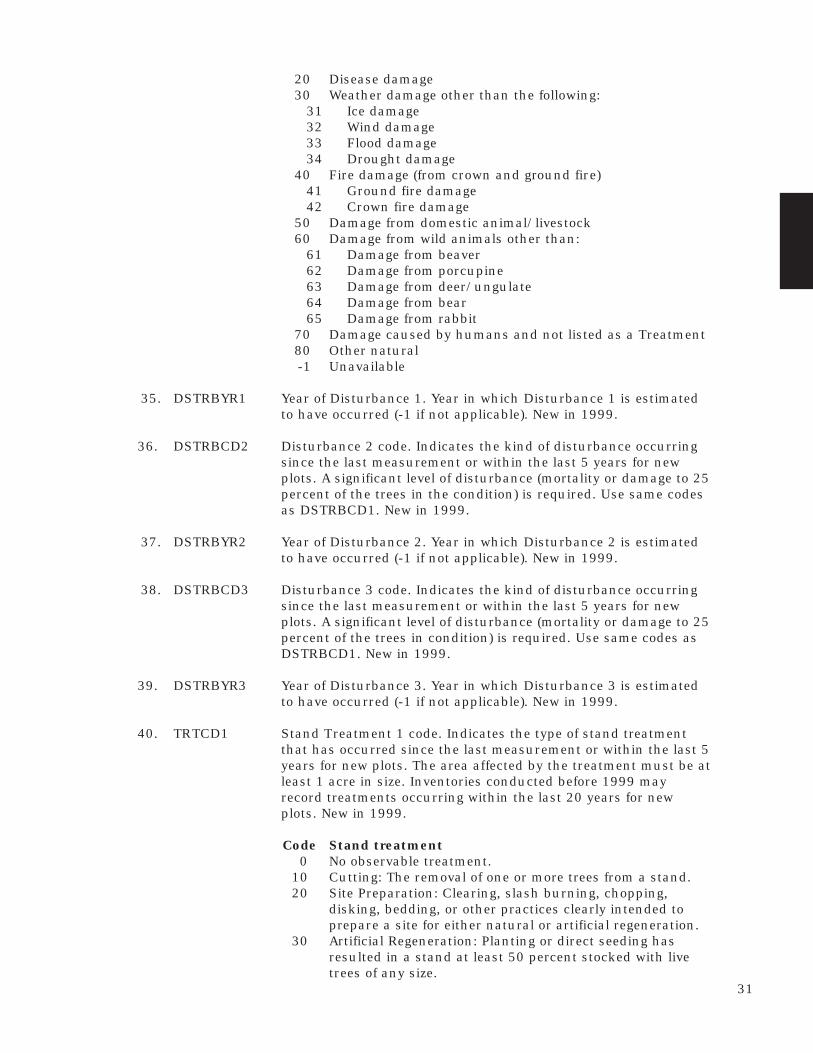
20 Disease damage30 Weather damage other than the following: 31 Ice damage
32 Wind damage33 Flood damage34 Drought damage
40 Fire damage (from crown and ground fire)41 Ground fire damage42 Crown fire damage
50 Damage from domestic animal/livestock60 Damage from wild animals other than:
61 Damage from beaver62 Damage from porcupine63 Damage from deer/ungulate64 Damage from bear65 Damage from rabbit
70 Damage caused by humans and not listed as a Treatment80 Other natural-1 Unavailable
35. DSTRBYR1 Year of Disturbance 1. Year in which Disturbance 1 is estimatedto have occurred (-1 if not applicable). New in 1999.
36. DSTRBCD2 Disturbance 2 code. Indicates the kind of disturbance occurringsince the last measurement or within the last 5 years for newplots. A significant level of disturbance (mortality or damage to 25percent of the trees in the condition) is required. Use same codesas DSTRBCD1. New in 1999.
37. DSTRBYR2 Year of Disturbance 2. Year in which Disturbance 2 is estimatedto have occurred (-1 if not applicable). New in 1999.
38. DSTRBCD3 Disturbance 3 code. Indicates the kind of disturbance occurringsince the last measurement or within the last 5 years for newplots. A significant level of disturbance (mortality or damage to 25percent of the trees in condition) is required. Use same codes asDSTRBCD1. New in 1999.
39. DSTRBYR3 Year of Disturbance 3. Year in which Disturbance 3 is estimatedto have occurred (-1 if not applicable). New in 1999.
40. TRTCD1 Stand Treatment 1 code. Indicates the type of stand treatmentthat has occurred since the last measurement or within the last 5years for new plots. The area affected by the treatment must be atleast 1 acre in size. Inventories conducted before 1999 mayrecord treatments occurring within the last 20 years for newplots. New in 1999.
Code Stand treatment0 No observable treatment.
10 Cutting: The removal of one or more trees from a stand.20 Site Preparation: Clearing, slash burning, chopping,
disking, bedding, or other practices clearly intended toprepare a site for either natural or artificial regeneration.
30 Artificial Regeneration: Planting or direct seeding hasresulted in a stand at least 50 percent stocked with livetrees of any size.
31
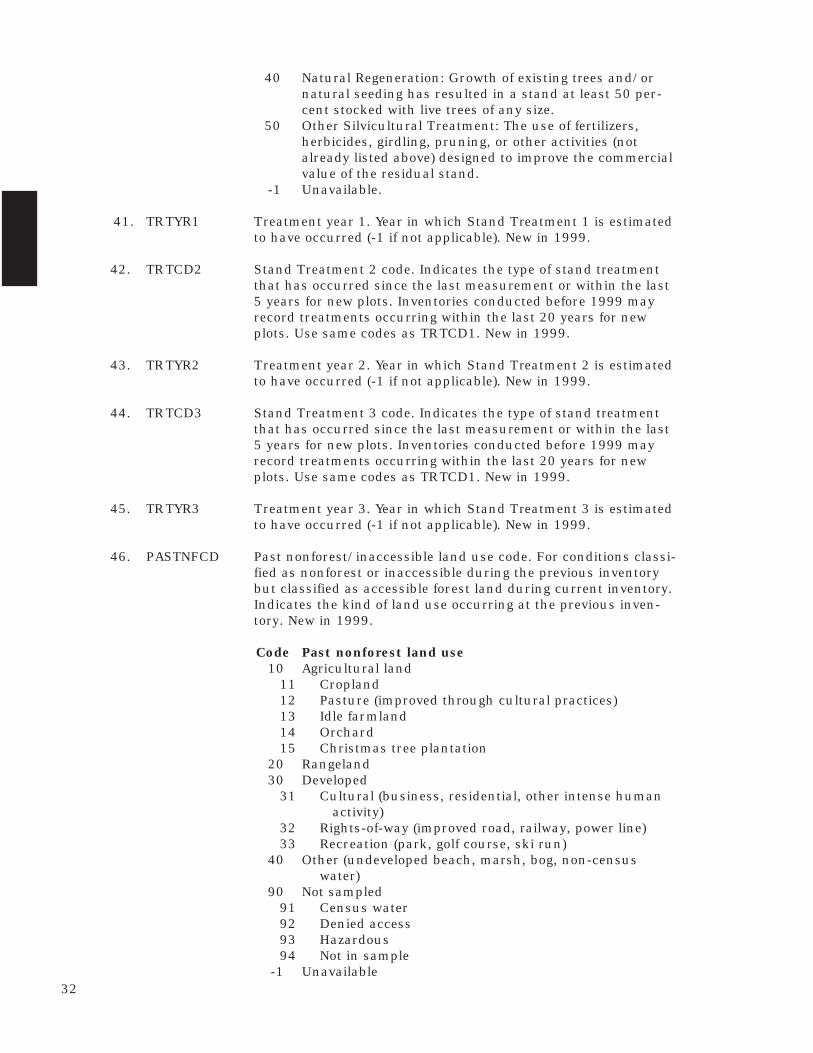
40 Natural Regeneration: Growth of existing trees and/ornatural seeding has resulted in a stand at least 50 per-cent stocked with live trees of any size.
50 Other Silvicultural Treatment: The use of fertilizers,herbicides, girdling, pruning, or other activities (notalready listed above) designed to improve the commercialvalue of the residual stand.
-1 Unavailable.
41. TRTYR1 Treatment year 1. Year in which Stand Treatment 1 is estimatedto have occurred (-1 if not applicable). New in 1999.
42. TRTCD2 Stand Treatment 2 code. Indicates the type of stand treatmentthat has occurred since the last measurement or within the last5 years for new plots. Inventories conducted before 1999 mayrecord treatments occurring within the last 20 years for newplots. Use same codes as TRTCD1. New in 1999.
43. TRTYR2 Treatment year 2. Year in which Stand Treatment 2 is estimatedto have occurred (-1 if not applicable). New in 1999.
44. TRTCD3 Stand Treatment 3 code. Indicates the type of stand treatmentthat has occurred since the last measurement or within the last5 years for new plots. Inventories conducted before 1999 mayrecord treatments occurring within the last 20 years for newplots. Use same codes as TRTCD1. New in 1999.
45. TRTYR3 Treatment year 3. Year in which Stand Treatment 3 is estimatedto have occurred (-1 if not applicable). New in 1999.
46. PASTNFCD Past nonforest/inaccessible land use code. For conditions classi-fied as nonforest or inaccessible during the previous inventorybut classified as accessible forest land during current inventory.Indicates the kind of land use occurring at the previous inven-tory. New in 1999.
Code Past nonforest land use10 Agricultural land
11 Cropland12 Pasture (improved through cultural practices)13 Idle farmland14 Orchard15 Christmas tree plantation
20 Rangeland30 Developed
31 Cultural (business, residential, other intense human activity)
32 Rights-of-way (improved road, railway, power line)33 Recreation (park, golf course, ski run)
40 Other (undeveloped beach, marsh, bog, non-censuswater)
90 Not sampled91 Census water92 Denied access93 Hazardous94 Not in sample
-1 Unavailable32

47. PRESNFCD Present nonforest land use code. Indicates the kind of land useoccurring now for conditions previously classified as forest butnow nonforest. Use same codes as PASTNFCD. New in 1999.
48. NFYEAR Nonforest year. An estimate of the year that a previously forestedcondition was converted to a nonforest condition (-1 if not appli-cable). New in 1999.
33
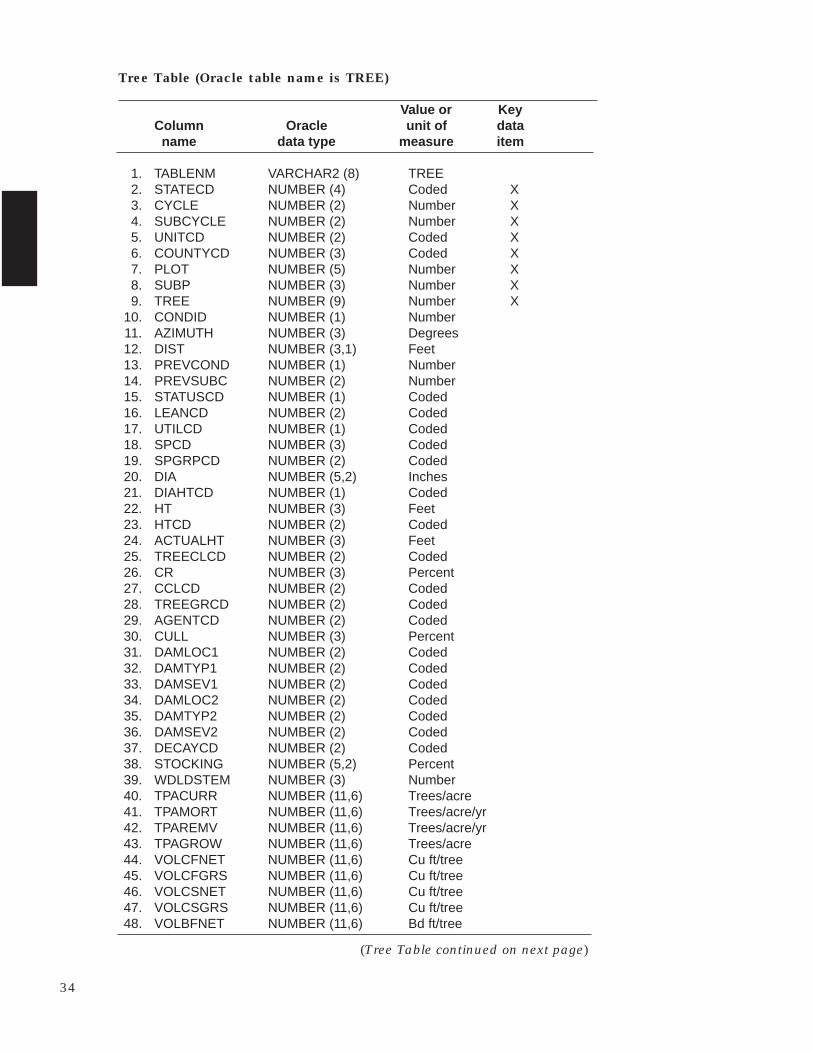
Tree Table (Oracle table name is TREE)
Value or KeyColumn Oracle unit of data name data type measure item
1. TABLENM VARCHAR2 (8) TREE2. STATECD NUMBER (4) Coded X3. CYCLE NUMBER (2) Number X4. SUBCYCLE NUMBER (2) Number X5. UNITCD NUMBER (2) Coded X6. COUNTYCD NUMBER (3) Coded X7. PLOT NUMBER (5) Number X8. SUBP NUMBER (3) Number X9. TREE NUMBER (9) Number X
10. CONDID NUMBER (1) Number11. AZIMUTH NUMBER (3) Degrees12. DIST NUMBER (3,1) Feet13. PREVCOND NUMBER (1) Number14. PREVSUBC NUMBER (2) Number15. STATUSCD NUMBER (1) Coded16. LEANCD NUMBER (2) Coded17. UTILCD NUMBER (1) Coded18. SPCD NUMBER (3) Coded19. SPGRPCD NUMBER (2) Coded20. DIA NUMBER (5,2) Inches21. DIAHTCD NUMBER (1) Coded22. HT NUMBER (3) Feet23. HTCD NUMBER (2) Coded24. ACTUALHT NUMBER (3) Feet25. TREECLCD NUMBER (2) Coded26. CR NUMBER (3) Percent27. CCLCD NUMBER (2) Coded28. TREEGRCD NUMBER (2) Coded29. AGENTCD NUMBER (2) Coded30. CULL NUMBER (3) Percent31. DAMLOC1 NUMBER (2) Coded32. DAMTYP1 NUMBER (2) Coded33. DAMSEV1 NUMBER (2) Coded34. DAMLOC2 NUMBER (2) Coded35. DAMTYP2 NUMBER (2) Coded36. DAMSEV2 NUMBER (2) Coded37. DECAYCD NUMBER (2) Coded38. STOCKING NUMBER (5,2) Percent39. WDLDSTEM NUMBER (3) Number40. TPACURR NUMBER (11,6) Trees/acre41. TPAMORT NUMBER (11,6) Trees/acre/yr42. TPAREMV NUMBER (11,6) Trees/acre/yr43. TPAGROW NUMBER (11,6) Trees/acre44. VOLCFNET NUMBER (11,6) Cu ft/tree45. VOLCFGRS NUMBER (11,6) Cu ft/tree46. VOLCSNET NUMBER (11,6) Cu ft/tree47. VOLCSGRS NUMBER (11,6) Cu ft/tree48. VOLBFNET NUMBER (11,6) Bd ft/tree
(Tree Table continued on next page)
34
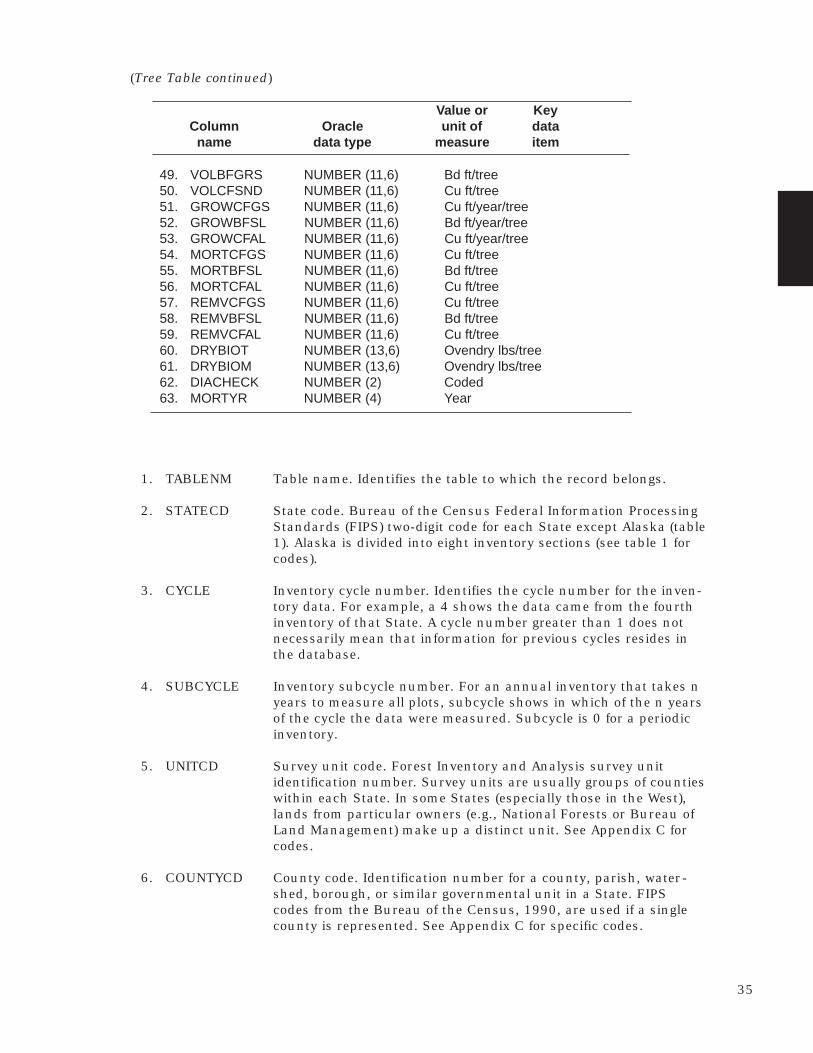
49. VOLBFGRS NUMBER (11,6) Bd ft/tree50. VOLCFSND NUMBER (11,6) Cu ft/tree51. GROWCFGS NUMBER (11,6) Cu ft/year/tree52. GROWBFSL NUMBER (11,6) Bd ft/year/tree53. GROWCFAL NUMBER (11,6) Cu ft/year/tree54. MORTCFGS NUMBER (11,6) Cu ft/tree55. MORTBFSL NUMBER (11,6) Bd ft/tree56. MORTCFAL NUMBER (11,6) Cu ft/tree57. REMVCFGS NUMBER (11,6) Cu ft/tree58. REMVBFSL NUMBER (11,6) Bd ft/tree59. REMVCFAL NUMBER (11,6) Cu ft/tree60. DRYBIOT NUMBER (13,6) Ovendry lbs/tree61. DRYBIOM NUMBER (13,6) Ovendry lbs/tree62. DIACHECK NUMBER (2) Coded63. MORTYR NUMBER (4) Year
(Tree Table continued)
Value or KeyColumn Oracle unit of data name data type measure item
1. TABLENM Table name. Identifies the table to which the record belongs.
2. STATECD State code. Bureau of the Census Federal Information ProcessingStandards (FIPS) two-digit code for each State except Alaska (table1). Alaska is divided into eight inventory sections (see table 1 forcodes).
3. CYCLE Inventory cycle number. Identifies the cycle number for the inven-tory data. For example, a 4 shows the data came from the fourthinventory of that State. A cycle number greater than 1 does notnecessarily mean that information for previous cycles resides inthe database.
4. SUBCYCLE Inventory subcycle number. For an annual inventory that takes nyears to measure all plots, subcycle shows in which of the n yearsof the cycle the data were measured. Subcycle is 0 for a periodicinventory.
5. UNITCD Survey unit code. Forest Inventory and Analysis survey unitidentification number. Survey units are usually groups of countieswithin each State. In some States (especially those in the West),lands from particular owners (e.g., National Forests or Bureau ofLand Management) make up a distinct unit. See Appendix C forcodes.
6. COUNTYCD County code. Identification number for a county, parish, water-shed, borough, or similar governmental unit in a State. FIPScodes from the Bureau of the Census, 1990, are used if a singlecounty is represented. See Appendix C for specific codes.
35
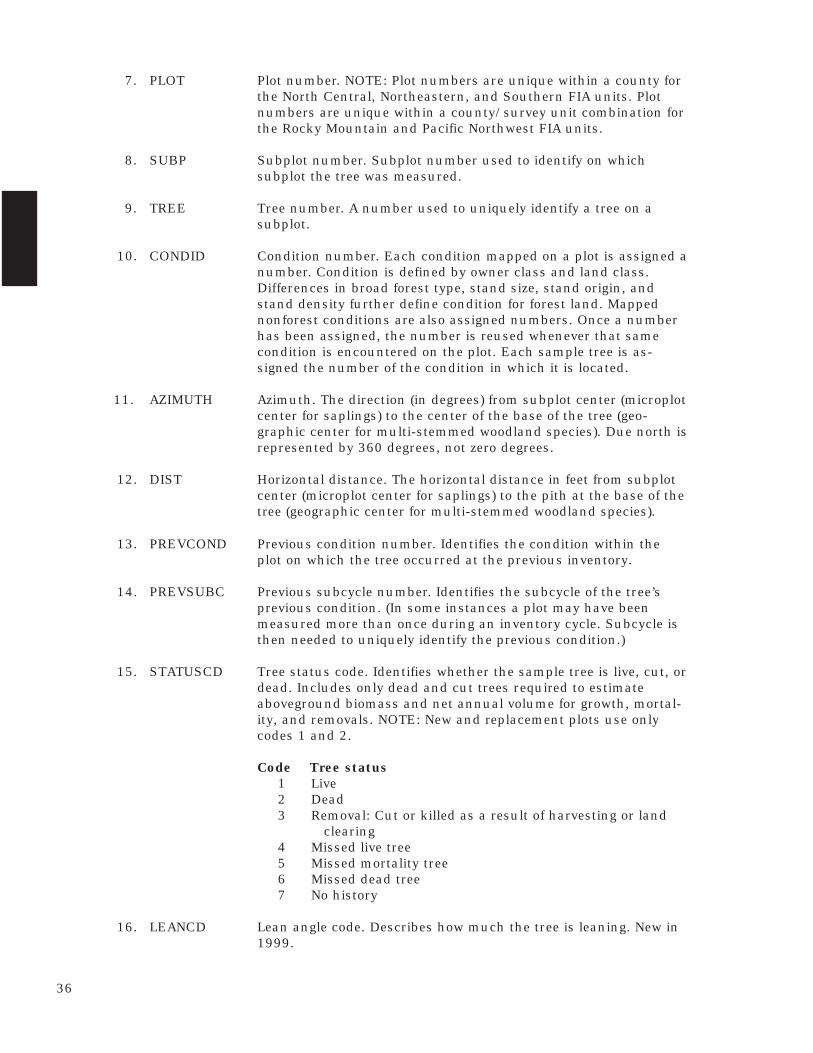
7. PLOT Plot number. NOTE: Plot numbers are unique within a county forthe North Central, Northeastern, and Southern FIA units. Plotnumbers are unique within a county/survey unit combination forthe Rocky Mountain and Pacific Northwest FIA units.
8. SUBP Subplot number. Subplot number used to identify on whichsubplot the tree was measured.
9. TREE Tree number. A number used to uniquely identify a tree on asubplot.
10. CONDID Condition number. Each condition mapped on a plot is assigned anumber. Condition is defined by owner class and land class.Differences in broad forest type, stand size, stand origin, andstand density further define condition for forest land. Mappednonforest conditions are also assigned numbers. Once a numberhas been assigned, the number is reused whenever that samecondition is encountered on the plot. Each sample tree is as-signed the number of the condition in which it is located.
11. AZIMUTH Azimuth. The direction (in degrees) from subplot center (microplotcenter for saplings) to the center of the base of the tree (geo-graphic center for multi-stemmed woodland species). Due north isrepresented by 360 degrees, not zero degrees.
12. DIST Horizontal distance. The horizontal distance in feet from subplotcenter (microplot center for saplings) to the pith at the base of thetree (geographic center for multi-stemmed woodland species).
13. PREVCOND Previous condition number. Identifies the condition within theplot on which the tree occurred at the previous inventory.
14. PREVSUBC Previous subcycle number. Identifies the subcycle of the tree’sprevious condition. (In some instances a plot may have beenmeasured more than once during an inventory cycle. Subcycle isthen needed to uniquely identify the previous condition.)
15. STATUSCD Tree status code. Identifies whether the sample tree is live, cut, ordead. Includes only dead and cut trees required to estimateaboveground biomass and net annual volume for growth, mortal-ity, and removals. NOTE: New and replacement plots use onlycodes 1 and 2.
Code Tree status1 Live2 Dead3 Removal: Cut or killed as a result of harvesting or land
clearing4 Missed live tree5 Missed mortality tree6 Missed dead tree7 No history
16. LEANCD Lean angle code. Describes how much the tree is leaning. New in1999.
36
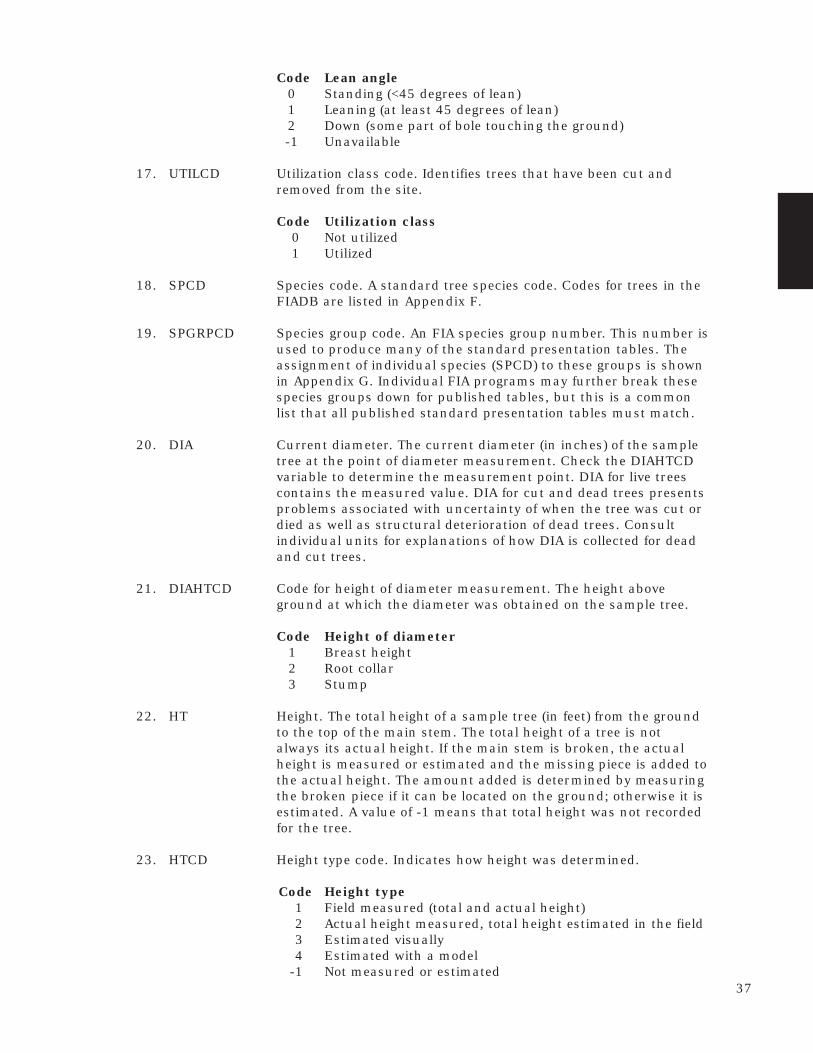
Code Lean angle0 Standing (<45 degrees of lean)1 Leaning (at least 45 degrees of lean)2 Down (some part of bole touching the ground)-1 Unavailable
17. UTILCD Utilization class code. Identifies trees that have been cut andremoved from the site.
Code Utilization class0 Not utilized1 Utilized
18. SPCD Species code. A standard tree species code. Codes for trees in theFIADB are listed in Appendix F.
19. SPGRPCD Species group code. An FIA species group number. This number isused to produce many of the standard presentation tables. Theassignment of individual species (SPCD) to these groups is shownin Appendix G. Individual FIA programs may further break thesespecies groups down for published tables, but this is a commonlist that all published standard presentation tables must match.
20. DIA Current diameter. The current diameter (in inches) of the sampletree at the point of diameter measurement. Check the DIAHTCDvariable to determine the measurement point. DIA for live treescontains the measured value. DIA for cut and dead trees presentsproblems associated with uncertainty of when the tree was cut ordied as well as structural deterioration of dead trees. Consultindividual units for explanations of how DIA is collected for deadand cut trees.
21. DIAHTCD Code for height of diameter measurement. The height aboveground at which the diameter was obtained on the sample tree.
Code Height of diameter1 Breast height2 Root collar3 Stump
22. HT Height. The total height of a sample tree (in feet) from the groundto the top of the main stem. The total height of a tree is notalways its actual height. If the main stem is broken, the actualheight is measured or estimated and the missing piece is added tothe actual height. The amount added is determined by measuringthe broken piece if it can be located on the ground; otherwise it isestimated. A value of -1 means that total height was not recordedfor the tree.
23. HTCD Height type code. Indicates how height was determined.
Code Height type1 Field measured (total and actual height)2 Actual height measured, total height estimated in the field3 Estimated visually4 Estimated with a model
-1 Not measured or estimated37
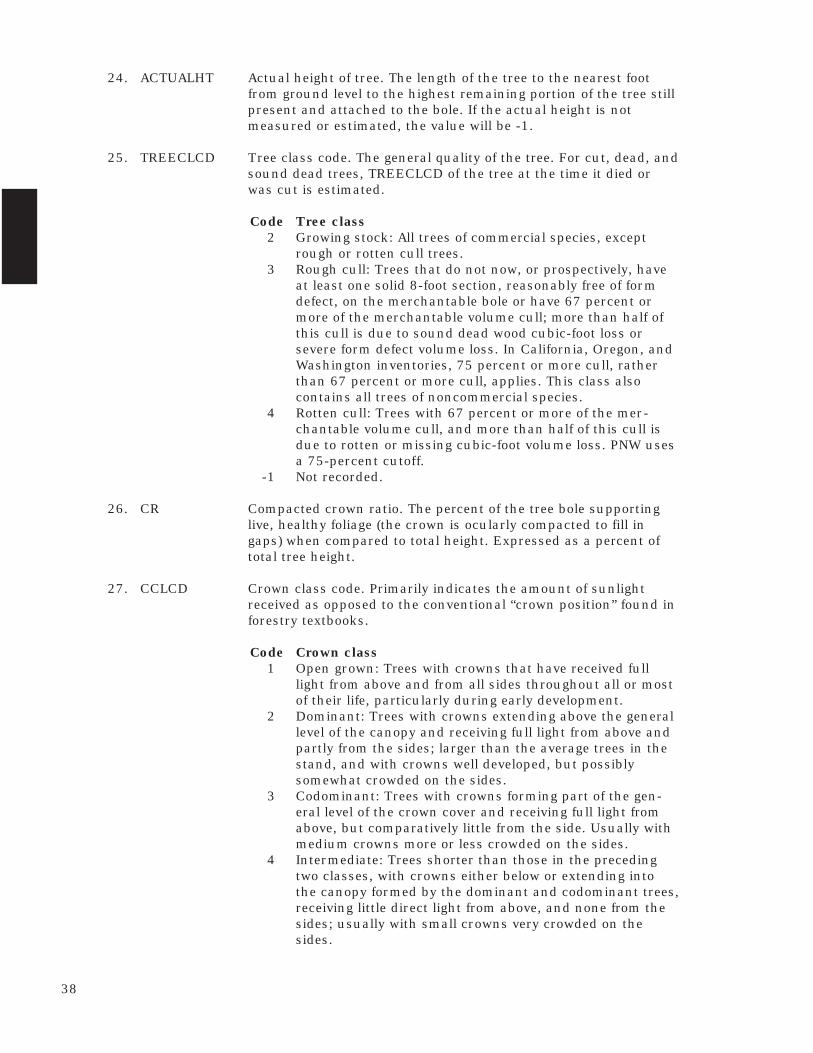
24. ACTUALHT Actual height of tree. The length of the tree to the nearest footfrom ground level to the highest remaining portion of the tree stillpresent and attached to the bole. If the actual height is notmeasured or estimated, the value will be -1.
25. TREECLCD Tree class code. The general quality of the tree. For cut, dead, andsound dead trees, TREECLCD of the tree at the time it died orwas cut is estimated.
Code Tree class2 Growing stock: All trees of commercial species, except
rough or rotten cull trees.3 Rough cull: Trees that do not now, or prospectively, have
at least one solid 8-foot section, reasonably free of formdefect, on the merchantable bole or have 67 percent ormore of the merchantable volume cull; more than half ofthis cull is due to sound dead wood cubic-foot loss orsevere form defect volume loss. In California, Oregon, andWashington inventories, 75 percent or more cull, ratherthan 67 percent or more cull, applies. This class alsocontains all trees of noncommercial species.
4 Rotten cull: Trees with 67 percent or more of the mer-chantable volume cull, and more than half of this cull isdue to rotten or missing cubic-foot volume loss. PNW usesa 75-percent cutoff.
-1 Not recorded.
26. CR Compacted crown ratio. The percent of the tree bole supportinglive, healthy foliage (the crown is ocularly compacted to fill ingaps) when compared to total height. Expressed as a percent oftotal tree height.
27. CCLCD Crown class code. Primarily indicates the amount of sunlightreceived as opposed to the conventional “crown position” found inforestry textbooks.
Code Crown class1 Open grown: Trees with crowns that have received full
light from above and from all sides throughout all or mostof their life, particularly during early development.
2 Dominant: Trees with crowns extending above the generallevel of the canopy and receiving full light from above andpartly from the sides; larger than the average trees in thestand, and with crowns well developed, but possiblysomewhat crowded on the sides.
3 Codominant: Trees with crowns forming part of the gen-eral level of the crown cover and receiving full light fromabove, but comparatively little from the side. Usually withmedium crowns more or less crowded on the sides.
4 Intermediate: Trees shorter than those in the precedingtwo classes, with crowns either below or extending intothe canopy formed by the dominant and codominant trees,receiving little direct light from above, and none from thesides; usually with small crowns very crowded on thesides.
38
5 Overtopped: Trees with crowns entirely below the generalcanopy level and receiving no direct light either from aboveor the sides.
-1 Not recorded.
28. TREEGRCD Tree grade code. Used by eastern FIA units but is not available inthe West. This item is nonzero for all sawtimber-size trees regard-less of status; however, it is not measured on all sawtimber-sizetrees on every plot. Sawtimber-size trees that are graded but donot contain a gradeable log are given a tree grade 5. Sawtimber-size trees that are not graded because of sampling design have atree grade of -1. Trees smaller than sawtimber receive a tree gradeof zero. Procedures to grade trees are different for each EasternFIA program. Western programs do not grade trees.
Code Tree grade0 Tree too small to grade1 Tree grade 12 Tree grade 23 Tree grade 34 Graded and contains a gradeable log but does not meet
grade 3 standards5 Graded but does not contain a gradeable log (local use
trees).-1 Not graded
29. AGENTCD Damaging agent code. Beginning in 2000, this variable will becollected on only dead and cut trees. Before 2000, this variablewas collected on all trees (live, dead, and cut). Cause of damagewas recorded for live trees if the presence of damage or pathogenactivity was serious enough to reduce the quality or vigor of thetree. When a tree was damaged by more than one agent, the mostsevere damage was coded. When no damage was observed on alive tree, 00 was recorded. Damage recorded for dead trees wasthe cause of death. When the cause of death could not be deter-mined for a tree, 99 was recorded. Each FIA program recordsspecific codes that may differ from one State to the next. Thesecodes fall within the ranges listed below. For the specific codesused in a particular State, contact the FIA program responsible forthat State.
Code Cause of damage00 No serious damage
10-19 Insect20-29 Disease30-39 Fire40-49 Animal50-59 Weather60-69 Vegetation (e.g., competition or vines)70-79 Unknown, not sure, other80-89 Logging/human90-99 Physical (e.g., hit by falling tree)
-1 Unavailable
30. CULL Rotten and missing cull. The percent of the cubic-foot volume in alive or dead tally tree that is rotten or missing.
39
31. DAMLOC1 Damage location 1 code. Indicates where on the tree damage(meeting or exceeding a severity threshold) is present. New in1999.
Code Damage location0 No damage1 Roots (exposed) and stump (up to 12 inches from ground
level)2 Roots, stump, and lower bole3 Lower bole (lower half of bole between stump and base of
live crown)4 Lower and upper bole5 Upper bole (upper half of bole between stump and base of
live crown)6 Crown stem (main stem within the live crown)7 Branches (>1 inch diameter at junction with main stem
and within the live crown)8 Buds and shoots of current year9 Foliage
-1 Not recorded
32. DAMTYP1 Damage type 1 code. Indicates the kind of damage (meeting orexceeding a severity threshold) present. New in 1999.
Code Damage type1 Canker or gall2 Conk, fruiting body, or sign of advanced decay3 Open wound4 Resinosis or gumosis5 Crack or seam
11 Broken bole or broken root within 3 feet of bole12 Broom on root or bole13 Broken or dead root further than 3 feet from bole20 Vines in the crown21 Loss of apical dominance, dead terminal22 Broken or dead branches23 Excessive branching or brooms within the live crown24 Damaged shoots, buds, or foliage25 Discoloration of foliage31 Other-1 Not recorded
33. DAMSEV1 Damage severity 1 code. Indicates how much of the tree is af-fected. Legal severity codes vary by damage type and damagelocation and must exceed a threshold value. New in 1999.
Code Damage severity(% of location affected)
0 1 to 91 10 to 192 20 to 293 30 to 394 40 to 495 50 to 596 60 to 697 70 to 79
40
8 80 to 899 90 to 99
-1 Not recorded
34. DAMLOC2 Damage location 2 code. Indicates where on the tree secondarydamage (meeting or exceeding a severity threshold) is present. Usesame codes as DAMLOC1. New in 1999.
35. DAMTYP2 Damage type 2 code. Indicates the kind of secondary damage(meeting or exceeding a severity threshold) present. Use samecodes as DAMTYP1. New in 1999.
36. DAMSEV2 Damage severity 2 code. Indicates how much of the tree is affectedby the secondary damage. Legal severity codes vary by damagetype and damage location and must exceed a threshold value. Usesame codes as DAMSEV1. New in 1999.
37. DECAYCD Dead tree decay code. Indicates the extent of decay in a standingdead tree. New in 1999.
Code Dead tree decay1 All limbs and branches are present; the top of the crown is
still present; all bark remains; sapwood is intact, withminimal decay; heartwood is sound and hard.
2 There are few limbs and no fine branches; the top may bebroken; a variable amount of bark remains; sapwood issloughing with advanced decay; heartwood is sound atbase but beginning to decay in the outer part of the upperbole.
3 Only limb stubs exist; the top is broken; a variable amountof bark remains; sapwood is sloughing; heartwood hasadvanced decay in upper bole and is beginning at the base.
4 Few or no limb stubs remain; the top is broken; a variableamount of bark remains; sapwood is sloughing; heartwoodhas advanced decay at the base and is sloughing in theupper bole.
5 No evidence of branches remains; the top is broken; littlebark remains; sapwood is gone; heartwood is sloughingthroughout.
-1 Not collected.
38. STOCKING Tree stocking. A relative term used to describe (in percent) theadequacy of a given stand density in meeting a specific manage-ment objective. Species or forest type stocking functions wereused to assess the stocking contribution of individual trees. Thesefunctions, which were developed using stocking guides, relate thearea occupied by an individual tree to the area occupied by a treeof the same size growing in a fully stocked stand of like trees. Thestocking of individual trees is used in the calculation of GSSTKCDand ALSTKCD on the COND table.
39. WDLDSTEM Woodland tree species stem count. Used for tree species wherediameter is measured at the root collar. For a stem to be counted,it must have a minimum stem size of 1 inch in diameter and 1foot in length.
41

40. TPACURR Trees per acre. Current number of trees per acre that the treerepresents for calculating number of trees on forest land.Total volumes are calculated by summing the product ofTPACURR, per tree values (i.e., VOLCFNET, VOLCFGRS,VOLCSNET, VOLCSGRS, VOLBFNET, VOLBFGRS,VOLCFSND, DRYBIOT, or DRYBIOM), and the appropriatearea expander from the plot table.
41. TPAMORT Mortality trees per acre per year. Number of trees per acre peryear that the tree represents for calculating mortality onforest land. Mortality volume per acre per year is calculatedby multiplying TPAMORT times MORTCFGS, MORTBFSL, orMORTCFAL for each tree. Total annual mortality volume iscalculated by summing the product of the annual per acremortality and the appropriate area expander from the plottable.
42. TPAREMV Removals trees per acre per year. Number of trees per acre peryear that the tree represents for calculating removals fromforest land. Removal volume per acre per year is calculated bymultiplying TPAREMV times REMVCFGS, REMVBFSL, orREMVCFAL for each tree. Total annual removal volume iscalculated by summing the product of the annual per acreremoval and the appropriate area expander from the plottable.
43. TPAGROW Growth trees per acre. Number of trees per acre that the treerepresents for calculating growth on forest land. Growthvolume per acre per year is calculated by multiplyingTPAGROW times GROWCFGS, GROWBFSL, or GROWCFALfor each tree. Total annual growth volume is calculated bysumming the product of the annual per acre growth and theappropriate area expander from the plot table.
44. VOLCFNET Net cubic-foot volume. The net volume of wood in the centralstem of a sample tree 5.0 inches diameter or larger, from a1-foot stump to a minimum 4-inch top diameter outside bark(DOB), or to where the central stem breaks into limbs all ofwhich are less than 4.0 inches DOB. This is a per tree valueand must be multiplied by TPACURR to obtain per acreinformation. Trees with DIA less than 5.0 inches have zero inthis field. All trees measured after 1998 with DIA 5.0 inchesor larger (including dead and cut trees) will have entries inthis field. Does not include rotten, missing, and form cull.
45. VOLCFGRS Gross cubic-foot volume. The total volume of wood in thecentral stem of a sample tree 5.0 inches diameter or larger,from a 1-foot stump to a minimum 4-inch top DOB, or towhere the central stem breaks into limbs all of which are lessthan 4.0 inches DOB. This is a per tree value and must bemultiplied by TPACURR to obtain per acre information. Treeswith DIA less than 5.0 inches have zero in this field. All treesmeasured after 1998 with DIA 5.0 inches or larger (includingdead and cut trees) have entries in this field. Includes rotten,missing and form cull.
42
46. VOLCSNET Net cubic-foot volume in the saw-log portion. The net volume ofwood in the central stem of a sample commercial species tree ofsawtimber size (9.0 inches DBH minimum for softwoods, 11.0inches DBH minimum for hardwoods), from a 1-foot stump to aminimum top DOB (7.0 inches for softwoods, 9.0 inches forhardwoods), or to where the central stem breaks into limbs, all ofwhich are less than the minimum top DOB. This is a per treevalue and must be multiplied by one of the above expansionfactors to obtain per acre information. Trees with DIA less than9.0 inches (11.0 inches for hardwoods) have zero in this field. Alllarger trees have entries in this field if they are growing-stocktrees (TREECLCD=2). All rough and rotten (TREECLCD=3 or 4)trees have zero in this field.
47. VOLCSGRS Gross cubic-foot volume in the saw-log portion. This is the netvolume of wood in the central stem of a sample commercialspecies tree of sawtimber size (9.0 inches DBH minimum forsoftwoods, 11.0 inches DBH minimum for hardwoods), from a1-foot stump to a minimum top DOB (7.0 inches for softwoods,9.0 inches for hardwoods), or to where the central stem breaksinto limbs, all of which are less than the minimum top DOB. Thisis a per tree value and must be multiplied by one of the aboveexpansion factors to obtain per acre information. Trees with DIAless than 9.0 inches (11.0 inches for hardwoods), have zero in thisfield. All larger trees have entries in this field if they are growing-stock trees (TREECLCD=2). All rough and rotten (TREECLCD=3 or4) trees have zero in this field.
48. VOLBFNET Net board-foot volume in the saw-log portion. This is the netvolume of wood in the central stem of a sample commercialspecies tree of sawtimber size (9.0 inches DBH minimum forsoftwoods, 11.0 inches DBH minimum for hardwoods), from a1-foot stump to a minimum top DOB (7.0 inches for softwoods,9.0 inches for hardwoods), or to where the central stem breaksinto limbs all of which are less than the minimum top DOB.Volume is based on International 1/4-inch rule. This is a per treevalue and must be multiplied by one of the above expansionfactors to obtain per unit area information. Trees with DIA lessthan 9.0 inches (11.0 inches for hardwoods) have zero in thisfield. All larger trees should have entries in this field if they aregrowing-stock trees (TREECLCD=2, including cut and dead trees).All rough and rotten (TREECLCD=3 or 4) trees have zero in thisfield.
49. VOLBFGRS Gross board-foot volume in the saw-log portion. This is the netvolume of wood in the central stem of a sample commercialspecies tree of sawtimber size (9.0 inches DBH minimum forsoftwoods, 11.0 inches DBH minimum for hardwoods), from a1-foot stump to a minimum top DOB (7.0 inches for softwoods,9.0 inches for hardwoods), or to where the central stem breaksinto limbs all of which are less than the minimum top DOB.Volume is based on International 1/4-inch rule. This is a per treevalue and must be multiplied by one of the above expansionfactors to obtain per unit area information. Trees with DIA lessthan 9.0 inches (11.0 inches for hardwoods) have zero in this
43

field. All larger trees should have entries in this field if they aregrowing-stock trees (TREECLCD=2, including cut and dead trees).All rough and rotten (TREECLCD=3 or 4) trees have zero in thisfield.
50. VOLCFSND Sound cubic-foot volume. The volume of sound wood in thecentral stem of a sample tree 5.0 inches diameter or larger from a1-foot stump to a minimum 4-inch top DOB or to where thecentral stem breaks into limbs all of which are less than 4.0inches DOB. Form cull but not rotten cull is included. This is aper tree value and must be multiplied by TPACURR to obtain peracre information. Trees with DIA less than 5.0 inches have zero inthis field. All trees with DIA 5.0 inches or larger (including deadand cut trees) have entries in this field.
51. GROWCFGS Net annual merchantable cubic-foot growth of growing-stock tree.This is the net change in cubic-foot volume per year of this tree(for remeasured plots, (V2-V1)/(t2-t1)); where 1 and 2 denote thepast and current measurement, respectively, V is volume, and tindicates year of measurement). Because this value is net growth,it may be a negative number. Negative growth values are usuallydue to mortality (V2=0) but can also occur on live trees that have anet loss in volume because of damage, rot, or other causes. Toexpand to a per acre value, multiply by TPAGROW.
52. GROWBFSL Net annual merchantable board-foot growth of sawtimber tree.This is the net change in board-foot volume per year of this tree(for remeasured plots (V2-V1)/(t2-t1)). Because this value is netgrowth, it may be a negative number. Negative growth values areusually due to mortality (V2=0) but can also occur on live treesthat have a net loss in volume because of damage, rot, or othercauses. To expand to a per acre value, multiply by TPAGROW.
53. GROWCFAL Net annual sound cubic-foot growth of live tree. The net change incubic-foot volume per year of this tree (for remeasured plots (V2-V1)/(t2-t1)). Because this value is net growth, it may be a negativenumber. Negative growth values are usually due to mortality(V2=0) but can also occur on live trees that have a net loss involume because of damage, rot, or other causes. To expand to aper acre value, multiply by TPAGROW. GROWCFAL differs fromGROWCFGS by the inclusion of form cull tree volume.
54. MORTCFGS Cubic-foot volume of a growing-stock tree for mortality purposes.Represents the cubic-foot volume of a growing-stock tree at timeof mortality. To obtain estimates of annual per acre mortality,multiply by TPAMORT.
55. MORTBFSL Board-foot volume of a sawtimber tree for mortality purposes.Represents the board-foot (International 1/4-inch rule) volume ofa sawtimber tree at time of mortality. To obtain estimates ofannual per acre mortality, multiply by TPAMORT.
56. MORTCFAL Sound cubic-foot volume of a tree for mortality purposes. Repre-sents the cubic-foot volume of the tree at time of mortality. Toobtain estimates of annual per acre mortality, multiply byTPAMORT. MORTCFAL differs from MORTCFGS by the inclusionof form cull tree volume.
44
57. REMVCFGS Cubic-foot volume of a growing-stock tree for removal purposes.Represents the cubic-foot volume of the tree at time of removal. Toobtain estimates of annual per acre removals, multiply byTPAREMV.
58. REMVBFSL Board-foot volume of a sawtimber tree for removal purposes.Represents the board-foot (International 1/4-inch rule) volume ofthe tree at time of removal. To obtain estimates of annual per acreremovals, multiply by TPAREMV.
59. REMVCFAL Sound cubic-foot volume of the tree for removal purposes. Repre-sents the cubic-foot volume of the tree at time of removal. Toobtain estimates of annual per acre removals, multiply byTPAREMV. REMVCFAL differs from REMVCFGS by the inclusionof cull tree volume.
60. DRYBIOT Total gross biomass ovendry weight for live trees. The totalaboveground biomass of a sample tree 1.0 inch diameter or larger,including all tops and limbs (but excluding foliage). This is a pertree value and must be multiplied by TPACURR to obtain per acreinformation. Calculated in ovendry pounds per tree. This fieldshould have an entry for live trees if DIA is 1.0 inch or larger,regardless of TREECLCD; zero otherwise.
61. DRYBIOM Merchantable stem biomass ovendry weight for live trees. Thetotal gross biomass (including bark) of a tree 5.0 inches DBH orlarger from a 1-foot stump to a minimum 4-inch top DOB of thecentral stem. This is a per tree value and must be multiplied byTPACURR to obtain per acre information. Calculated in ovendrypounds per tree. This field should have an entry for live trees ifDIA is 5.0 inches or larger, regardless of TREECLCD; zero other-wise.
62. DIACHECK Diameter check code. Indicates the reliability of the diametermeasurement. New in 1999.
Code Diameter check0 Diameter accurately measured at standard measurement
locations (e.g., measured at 4.5', or 3.5' above fork, or atroot collar).
1 Diameter estimated at standard measurement location(e.g., estimated at 4.5' (fused stems, large swell at DBH)).
2 Diameter accurately measured at non-standard location(e.g., measured just above swells, cankers, etc.).
3 Diameter estimated at non-standard location (e.g., esti-mated above butt swell).
4 Diameter measured at nonstandard location on tree, butnot same location as previous measurement (remeasure-ment trees only).
5 Diameter modeled in the office.-1 Unavailable
63. MORTYR Mortality year. The year in which a remeasured tree was estimatedto have died. New in 1999. A value of -1 means that data areunavailable or that mortality year is not applicable.
45
Seedling Table (Oracle table name is SEEDLING)
Value or KeyColumn Oracle unit of dataname data type measure item
1. TABLENM VARCHAR2 (8) SEEDLING2. STATECD NUMBER (4) Coded X3. CYCLE NUMBER (2) Number X4. SUBCYCLE NUMBER (2) Number X5. UNITCD NUMBER (2) Coded X6. COUNTYCD NUMBER (3) Coded X7. PLOT NUMBER (5) Number X8. SUBP NUMBER (3) Number X9. CONDID NUMBER (1) Number X
10. SPCD NUMBER (3) Coded X11. SPGRPCD NUMBER (2) Coded12. COUNTCD VARCHAR2 (2) Coded13. STOCKING NUMBER (5,2) Percent
1. TABLENM Table name. Identifies the table to which the record belongs.
2. STATECD State code. Bureau of the Census Federal Information ProcessingStandards (FIPS) two-digit code for each State except Alaska (table1). Alaska is divided into eight inventory sections (see table 1 forcodes).
3. CYCLE Inventory cycle number. Identifies the cycle number for the inven-tory data. For example, a 4 shows the data came from the fourthinventory of that State. A cycle number greater than 1 does notnecessarily mean that information for previous cycles resides inthe database.
4. SUBCYCLE Inventory subcycle number. For an annual inventory that takes nyears to measure all plots, subcycle indicates in which of the nyears of the cycle the data were measured. Subcycle is 0 for aperiodic inventory.
5. UNITCD Survey unit number. Forest Inventory and Analysis survey unitidentification number. Survey units are usually groups of countieswithin each State. In some States (especially those in the West),lands from particular owners (e.g., National Forests or Bureau ofLand Management) make up a distinct unit. See Appendix C forcodes.
6. COUNTYCD County code. Identification number for a county, parish, water-shed, borough, or similar governmental unit in a State. FIPS codesfrom the Bureau of the Census, 1990, are used if a single countyis represented. See Appendix C for specific codes.
7. PLOT Plot number. NOTE: Plot numbers are unique within a county forthe North Central, Northeastern, and Southern FIA units. Plotnumbers are unique within a county/survey unit combination forthe Rocky Mountain and Pacific Northwest FIA units.
46
8. SUBP Subplot number. Subplot number used to identify on whichsubplot (of the plot) the tree was measured.
9. CONDID Condition number. Each condition mapped on a plot is assigneda number. Condition is defined by owner class and land class.Differences in broad forest type, stand size, stand origin, andstand density further define condition for forest land. Mappednonforest conditions are also assigned numbers. Once a numberhas been assigned, the number is reused whenever that samecondition is encountered on the plot. Each sample seedling isassigned the number of the condition in which it is located.
10. SPCD Species code. A standard tree species code. Codes for trees in theFIADB are listed in Appendix F.
11. SPGRPCD Species group code. An FIA species group number. This numberis used to produce many of the standard presentation tables.Individual species and corresponding tree species group codesare shown in Appendix G. Individual FIA programs may furtherbreak these species groups down for published tables, but this isa common list that all published standard presentation tablesmust match.
12. COUNTCD Seedling count code. Indicates the number of seedlings (DIA <1.0inches) present on the microplot. Conifer seedlings are at least 6inches tall and hardwood seedlings are at least 12 inches tall.New in 1999.
Code Seedling count1 12 23 34 45 56+ 6 or more
13. STOCKING Tree stocking. Stocking (in percent) is a relative term used todescribe the adequacy of a given stand density in meeting aspecific management objective. Species or forest type stockingfunctions were used to assess the stocking contribution of indi-vidual trees. These functions, which were developed using stock-ing guides, relate the area occupied by an individual tree to thearea occupied by a tree of the same size growing in a fullystocked stand of like trees. The stocking of individual trees isused in the calculation of GSSTKCD and ALSTKCD on the CONDtable.
47
Site Tree Table (Oracle table name is SITETREE)
Value or KeyColumn Oracle unit of data name data type measure item
1. TABLENM VARCHAR2 (8) SITETREE2. STATECD NUMBER (4) Coded X3. CYCLE NUMBER (2) Number X4. SUBCYCLE NUMBER (2) Number X5. UNITCD NUMBER (2) Coded X6. COUNTYCD NUMBER (3) Coded X7. PLOT NUMBER (5) Number X8. CONDID NUMBER (1) Number X9. TREE NUMBER (4) Number X
10. SPCD NUMBER (3) Coded11. DIA NUMBER (5,2) Inches12. HT NUMBER (3) Feet13. AGEDIA NUMBER( 3) Years14. SPGRPCD NUMBER (2) Coded15. SITREE NUMBER (3) Feet16. SIBASE NUMBER (3) Years
1. TABLENM Table name. Identifies the table to which the record belongs.
2. STATECD State code. Bureau of the Census Federal Information Process-ing Standards (FIPS) two-digit code for each State except Alaska(table 1). Alaska is divided into eight inventory sections (seetable 1 for codes).
3. CYCLE Inventory cycle number. Identifies the cycle number for theinventory data. For example, a 4 shows the data came from thefourth inventory of that State. A cycle number greater than 1does not necessarily mean that information for previous cyclesresides in the database.
4. SUBCYCLE Inventory subcycle number. For an annual inventory that takesn years to measure all plots, subcycle indicates in which of the nyears of the cycle the data were measured. Subcycle is 0 for aperiodic inventory.
5. UNITCD Survey unit code. Forest Inventory and Analysis survey unitidentification number. Survey units are usually groups of coun-ties within each State. In some States (especially those in theWest), lands from particular owners (e.g., National Forests orBureau of Land Management) make up a distinct unit. SeeAppendix C for codes.
6. COUNTYCD County code. Identification number for a county, parish, water-shed, borough, or similar governmental unit in a State. FIPScodes from the Bureau of the Census, 1990, are used if a singlecounty is represented. See Appendix C for specific codes.
48
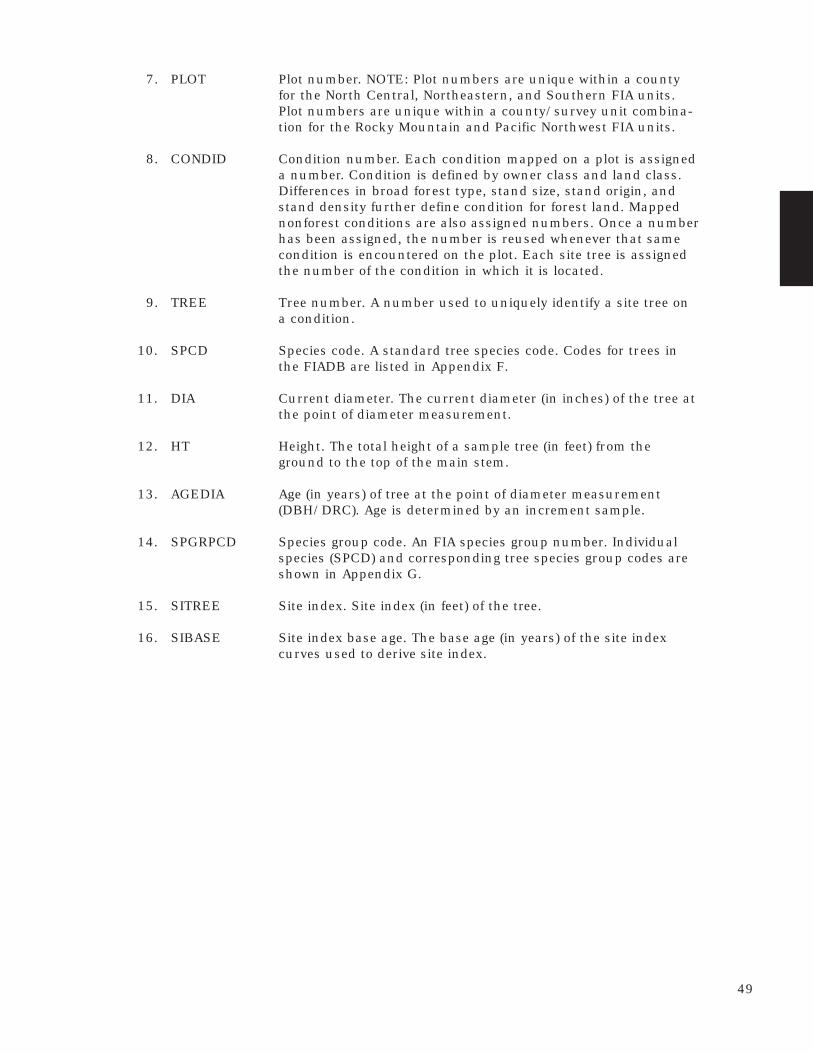
7. PLOT Plot number. NOTE: Plot numbers are unique within a countyfor the North Central, Northeastern, and Southern FIA units.Plot numbers are unique within a county/survey unit combina-tion for the Rocky Mountain and Pacific Northwest FIA units.
8. CONDID Condition number. Each condition mapped on a plot is assigneda number. Condition is defined by owner class and land class.Differences in broad forest type, stand size, stand origin, andstand density further define condition for forest land. Mappednonforest conditions are also assigned numbers. Once a numberhas been assigned, the number is reused whenever that samecondition is encountered on the plot. Each site tree is assignedthe number of the condition in which it is located.
9. TREE Tree number. A number used to uniquely identify a site tree ona condition.
10. SPCD Species code. A standard tree species code. Codes for trees inthe FIADB are listed in Appendix F.
11. DIA Current diameter. The current diameter (in inches) of the tree atthe point of diameter measurement.
12. HT Height. The total height of a sample tree (in feet) from theground to the top of the main stem.
13. AGEDIA Age (in years) of tree at the point of diameter measurement(DBH/DRC). Age is determined by an increment sample.
14. SPGRPCD Species group code. An FIA species group number. Individualspecies (SPCD) and corresponding tree species group codes areshown in Appendix G.
15. SITREE Site index. Site index (in feet) of the tree.
16. SIBASE Site index base age. The base age (in years) of the site indexcurves used to derive site index.
49
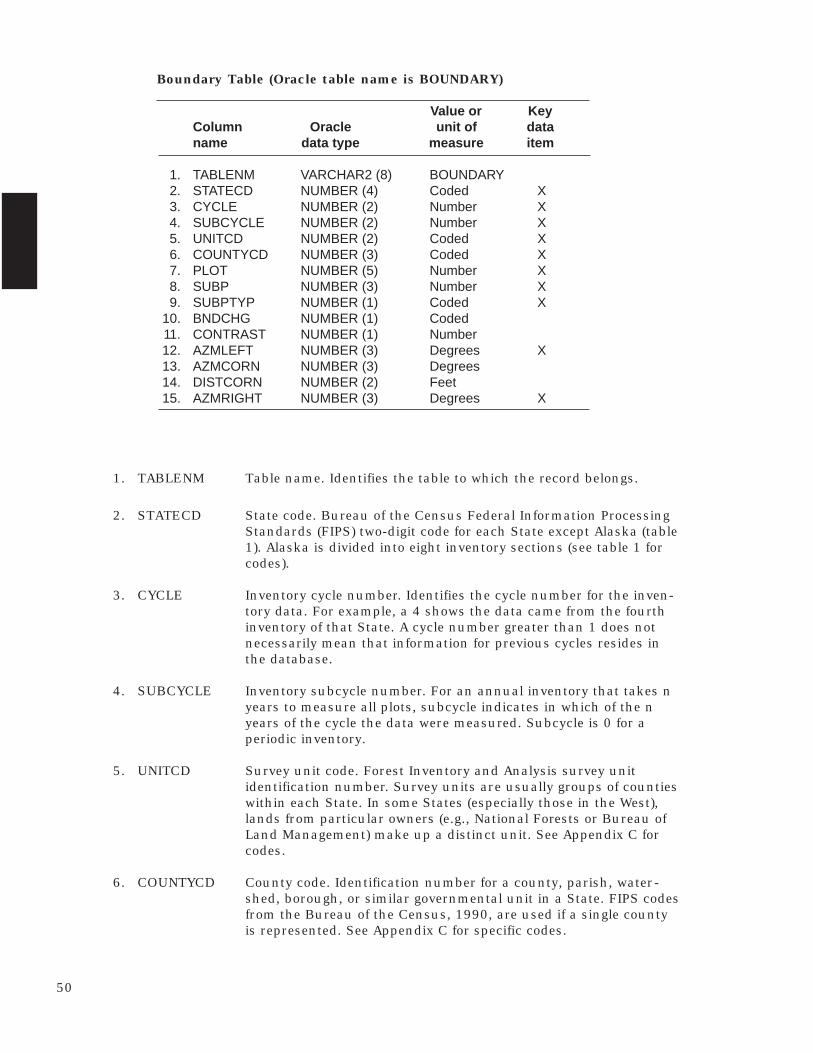
Boundary Table (Oracle table name is BOUNDARY)
Value or KeyColumn Oracle unit of dataname data type measure item
1. TABLENM VARCHAR2 (8) BOUNDARY2. STATECD NUMBER (4) Coded X3. CYCLE NUMBER (2) Number X4. SUBCYCLE NUMBER (2) Number X5. UNITCD NUMBER (2) Coded X6. COUNTYCD NUMBER (3) Coded X7. PLOT NUMBER (5) Number X8. SUBP NUMBER (3) Number X9. SUBPTYP NUMBER (1) Coded X
10. BNDCHG NUMBER (1) Coded11. CONTRAST NUMBER (1) Number12. AZMLEFT NUMBER (3) Degrees X13. AZMCORN NUMBER (3) Degrees14. DISTCORN NUMBER (2) Feet15. AZMRIGHT NUMBER (3) Degrees X
1. TABLENM Table name. Identifies the table to which the record belongs.
2. STATECD State code. Bureau of the Census Federal Information ProcessingStandards (FIPS) two-digit code for each State except Alaska (table1). Alaska is divided into eight inventory sections (see table 1 forcodes).
3. CYCLE Inventory cycle number. Identifies the cycle number for the inven-tory data. For example, a 4 shows the data came from the fourthinventory of that State. A cycle number greater than 1 does notnecessarily mean that information for previous cycles resides inthe database.
4. SUBCYCLE Inventory subcycle number. For an annual inventory that takes nyears to measure all plots, subcycle indicates in which of the nyears of the cycle the data were measured. Subcycle is 0 for aperiodic inventory.
5. UNITCD Survey unit code. Forest Inventory and Analysis survey unitidentification number. Survey units are usually groups of countieswithin each State. In some States (especially those in the West),lands from particular owners (e.g., National Forests or Bureau ofLand Management) make up a distinct unit. See Appendix C forcodes.
6. COUNTYCD County code. Identification number for a county, parish, water-shed, borough, or similar governmental unit in a State. FIPS codesfrom the Bureau of the Census, 1990, are used if a single countyis represented. See Appendix C for specific codes.
50
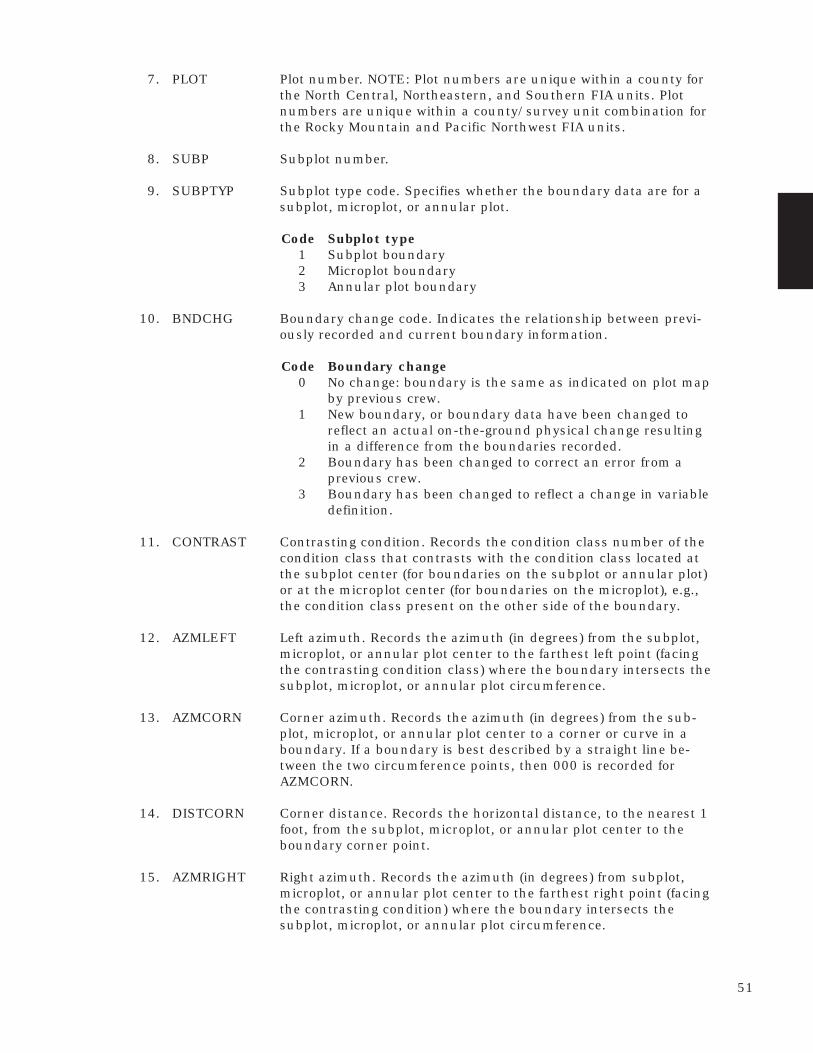
7. PLOT Plot number. NOTE: Plot numbers are unique within a county forthe North Central, Northeastern, and Southern FIA units. Plotnumbers are unique within a county/survey unit combination forthe Rocky Mountain and Pacific Northwest FIA units.
8. SUBP Subplot number.
9. SUBPTYP Subplot type code. Specifies whether the boundary data are for asubplot, microplot, or annular plot.
Code Subplot type1 Subplot boundary2 Microplot boundary3 Annular plot boundary
10. BNDCHG Boundary change code. Indicates the relationship between previ-ously recorded and current boundary information.
Code Boundary change0 No change: boundary is the same as indicated on plot map
by previous crew.1 New boundary, or boundary data have been changed to
reflect an actual on-the-ground physical change resultingin a difference from the boundaries recorded.
2 Boundary has been changed to correct an error from aprevious crew.
3 Boundary has been changed to reflect a change in variabledefinition.
11. CONTRAST Contrasting condition. Records the condition class number of thecondition class that contrasts with the condition class located atthe subplot center (for boundaries on the subplot or annular plot)or at the microplot center (for boundaries on the microplot), e.g.,the condition class present on the other side of the boundary.
12. AZMLEFT Left azimuth. Records the azimuth (in degrees) from the subplot,microplot, or annular plot center to the farthest left point (facingthe contrasting condition class) where the boundary intersects thesubplot, microplot, or annular plot circumference.
13. AZMCORN Corner azimuth. Records the azimuth (in degrees) from the sub-plot, microplot, or annular plot center to a corner or curve in aboundary. If a boundary is best described by a straight line be-tween the two circumference points, then 000 is recorded forAZMCORN.
14. DISTCORN Corner distance. Records the horizontal distance, to the nearest 1foot, from the subplot, microplot, or annular plot center to theboundary corner point.
15. AZMRIGHT Right azimuth. Records the azimuth (in degrees) from subplot,microplot, or annular plot center to the farthest right point (facingthe contrasting condition) where the boundary intersects thesubplot, microplot, or annular plot circumference.
51

52
CHAPTER 4
ALGORITHMS FOR SUMMARIZING DATA
Data in the FIA Database were designed foreasy use with most database managementsystems, statistical packages, and other datasummary software. Data are typically providedas comma-delimited ASCII files. Databasemanagement systems that support hierarchi-cal data structures, as well as those based onthe relational model, can easily process FIADBfiles. Chapter 3 should give the user of almostany software package the information neededto input an FIADB file into a processing sys-tem.
To assist users of FIADB files and to providethem with a benchmark or checkpoint forcomparison to their own data processingsystems, the FIA units provide a set of tableswith each FIADB State file. The tables are a setof the standard presentation tables produceddirectly from the FIADB file. These standardpresentation tables may not match publishedcore tables exactly. Differences will vary by FIAunit and relate to rounding error and theallocation of State-level estimates down to thecounty level. Users concerned about differ-ences can request an explanation from the FIAunit. Appendix B contains the format of thestandard presentation tables produced froman FIADB file.
Users may wish to duplicate the standardpresentation tables on their hardware. Indoing so, they may find minor differences dueto rounding and word length differencesbetween their machines and the machine usedto produce the original tables. Users may alsowant to screen the input data file so that itincludes plot and tree records for only alimited geographic area, such as a group ofcounties. Then they can produce standardpresentation tables for only that area.
The procedures or algorithms used to computevarious tree-level data and expand them topopulation-level estimates are provided intables 2 through 10. Inventories completedbefore the introduction of the Forest HealthMonitoring (FHM) plot design in 1997 were
designed to provide estimates of timberlandarea and growing-stock volume. As a result, anumber of forest land statistics will be un-available until the completion of a State’s firstinventory using the FHM plot design. In addi-tion, before 1995, tree-level data were notcollected on reserved and unproductive forestland. Estimates of growth, removals, andmortality from reserved and unproductiveforest land may not be available until thecompletion of a State’s second inventory usingthe FHM plot design.
Because of these limitations, the algorithmshave been divided into three groups:
1) Algorithms that will work on all inven-tories (tables 2 through 6)
2) Algorithms that will work on invento-ries completed after 1999 (e.g., volumeof all live trees on forest land) (tables 7through 9)
3) Algorithms that can be applied to thesecond inventory cycle completed after1999 (e.g., growth, removals, andmortality of all live trees on forest land)(table 10)
Those familiar with the relational data modeland the standard Structured Query Language(SQL) database language available in manydatabase management systems will find it easyto load FIADB files into one of these systemsand to retrieve information from a loadeddatabase.
Algorithms That Will Work onAll Inventories
All the variables used in these algorithms aredefined in Chapter 3. The variable prefixes“p.”, “c.”, “oc.”, and “t.” identify the databasetables in which the variables reside. Thevariable prefix for the PLOT table is “p.”. Thevariable prefix for the COND table is “c.” forthe current cycle and “oc.” for the previouscycle. The variable prefix for the TREE table is“t.”.
53
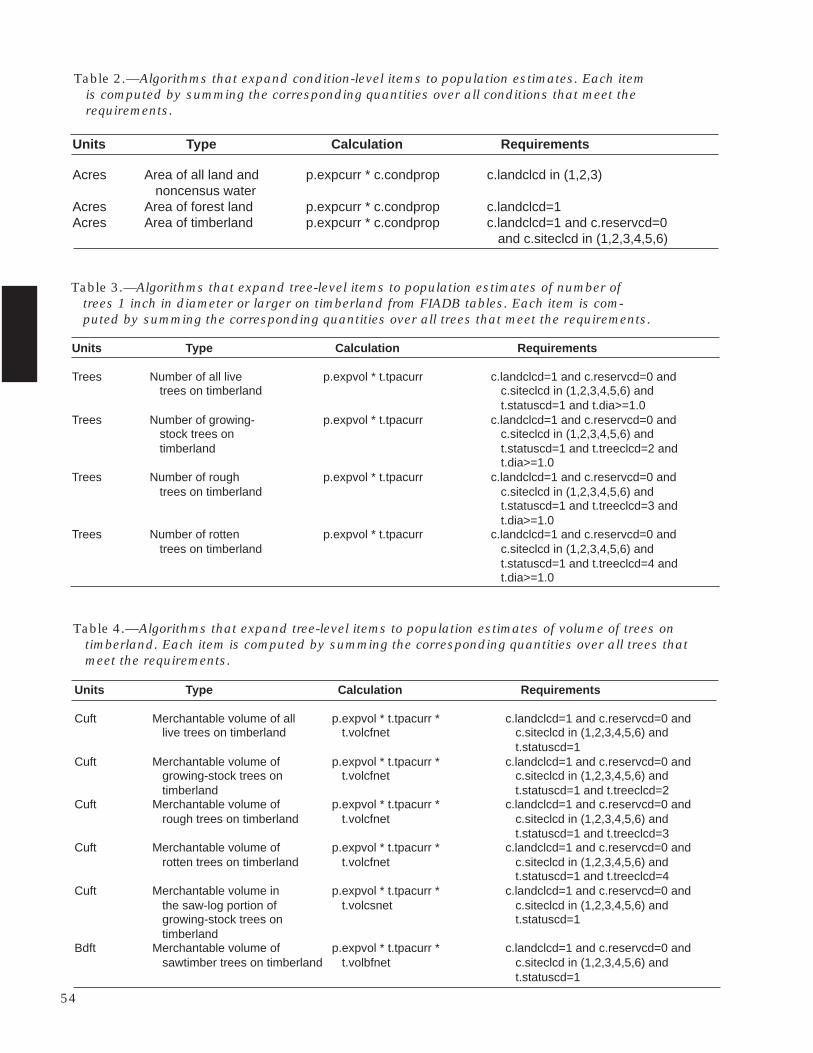
Units Type Calculation Requirements
Acres Area of all land and p.expcurr * c.condprop c.landclcd in (1,2,3) noncensus water
Acres Area of forest land p.expcurr * c.condprop c.landclcd=1Acres Area of timberland p.expcurr * c.condprop c.landclcd=1 and c.reservcd=0
and c.siteclcd in (1,2,3,4,5,6)
Table 2.—Algorithms that expand condition-level items to population estimates. Each itemis computed by summing the corresponding quantities over all conditions that meet therequirements.
Table 3.—Algorithms that expand tree-level items to population estimates of number oftrees 1 inch in diameter or larger on timberland from FIADB tables. Each item is com-puted by summing the corresponding quantities over all trees that meet the requirements.
Units Type Calculation Requirements
Trees Number of all live p.expvol * t.tpacurr c.landclcd=1 and c.reservcd=0 and trees on timberland c.siteclcd in (1,2,3,4,5,6) and
t.statuscd=1 and t.dia>=1.0Trees Number of growing- p.expvol * t.tpacurr c.landclcd=1 and c.reservcd=0 and
stock trees on c.siteclcd in (1,2,3,4,5,6) and timberland t.statuscd=1 and t.treeclcd=2 and
t.dia>=1.0Trees Number of rough p.expvol * t.tpacurr c.landclcd=1 and c.reservcd=0 and
trees on timberland c.siteclcd in (1,2,3,4,5,6) and t.statuscd=1 and t.treeclcd=3 and t.dia>=1.0
Trees Number of rotten p.expvol * t.tpacurr c.landclcd=1 and c.reservcd=0 and trees on timberland c.siteclcd in (1,2,3,4,5,6) and
t.statuscd=1 and t.treeclcd=4 and t.dia>=1.0
Table 4.—Algorithms that expand tree-level items to population estimates of volume of trees ontimberland. Each item is computed by summing the corresponding quantities over all trees thatmeet the requirements.
Units Type Calculation Requirements
Cuft Merchantable volume of all p.expvol * t.tpacurr * c.landclcd=1 and c.reservcd=0 and live trees on timberland t.volcfnet c.siteclcd in (1,2,3,4,5,6) and
t.statuscd=1Cuft Merchantable volume of p.expvol * t.tpacurr * c.landclcd=1 and c.reservcd=0 and
growing-stock trees on t.volcfnet c.siteclcd in (1,2,3,4,5,6) and timberland t.statuscd=1 and t.treeclcd=2
Cuft Merchantable volume of p.expvol * t.tpacurr * c.landclcd=1 and c.reservcd=0 and rough trees on timberland t.volcfnet c.siteclcd in (1,2,3,4,5,6) and
t.statuscd=1 and t.treeclcd=3Cuft Merchantable volume of p.expvol * t.tpacurr * c.landclcd=1 and c.reservcd=0 and
rotten trees on timberland t.volcfnet c.siteclcd in (1,2,3,4,5,6) and t.statuscd=1 and t.treeclcd=4
Cuft Merchantable volume in p.expvol * t.tpacurr * c.landclcd=1 and c.reservcd=0 and the saw-log portion of t.volcsnet c.siteclcd in (1,2,3,4,5,6) and growing-stock trees on t.statuscd=1 timberland
Bdft Merchantable volume of p.expvol * t.tpacurr * c.landclcd=1 and c.reservcd=0 and sawtimber trees on timberland t.volbfnet c.siteclcd in (1,2,3,4,5,6) and
t.statuscd=1
54
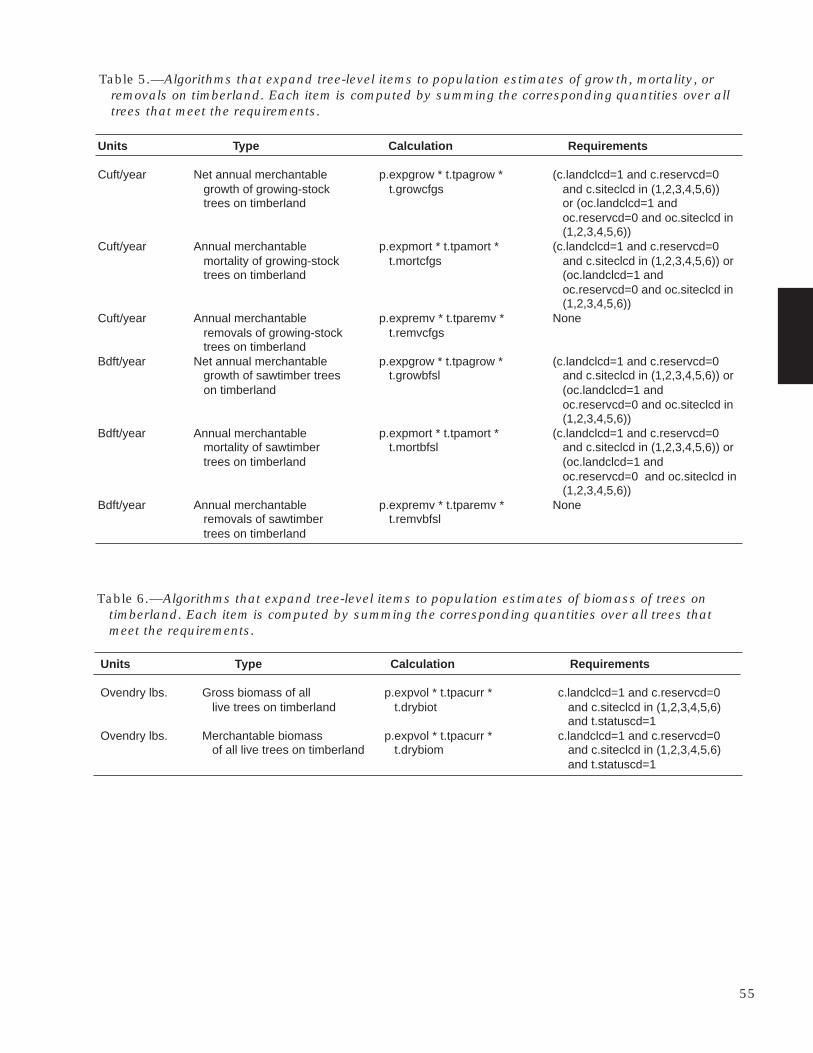
Table 5.—Algorithms that expand tree-level items to population estimates of growth, mortality, orremovals on timberland. Each item is computed by summing the corresponding quantities over alltrees that meet the requirements.
Units Type Calculation Requirements
Cuft/year Net annual merchantable p.expgrow * t.tpagrow * (c.landclcd=1 and c.reservcd=0 growth of growing-stock t.growcfgs and c.siteclcd in (1,2,3,4,5,6)) trees on timberland or (oc.landclcd=1 and
oc.reservcd=0 and oc.siteclcd in (1,2,3,4,5,6))
Cuft/year Annual merchantable p.expmort * t.tpamort * (c.landclcd=1 and c.reservcd=0 mortality of growing-stock t.mortcfgs and c.siteclcd in (1,2,3,4,5,6)) or trees on timberland (oc.landclcd=1 and
oc.reservcd=0 and oc.siteclcd in (1,2,3,4,5,6))
Cuft/year Annual merchantable p.expremv * t.tparemv * None removals of growing-stock t.remvcfgs trees on timberland
Bdft/year Net annual merchantable p.expgrow * t.tpagrow * (c.landclcd=1 and c.reservcd=0 growth of sawtimber trees t.growbfsl and c.siteclcd in (1,2,3,4,5,6)) or on timberland (oc.landclcd=1 and
oc.reservcd=0 and oc.siteclcd in (1,2,3,4,5,6))
Bdft/year Annual merchantable p.expmort * t.tpamort * (c.landclcd=1 and c.reservcd=0 mortality of sawtimber t.mortbfsl and c.siteclcd in (1,2,3,4,5,6)) or trees on timberland (oc.landclcd=1 and
oc.reservcd=0 and oc.siteclcd in (1,2,3,4,5,6))
Bdft/year Annual merchantable p.expremv * t.tparemv * None removals of sawtimber t.remvbfsl trees on timberland
Table 6.—Algorithms that expand tree-level items to population estimates of biomass of trees ontimberland. Each item is computed by summing the corresponding quantities over all trees thatmeet the requirements.
Units Type Calculation Requirements
Ovendry lbs. Gross biomass of all p.expvol * t.tpacurr * c.landclcd=1 and c.reservcd=0 live trees on timberland t.drybiot and c.siteclcd in (1,2,3,4,5,6)
and t.statuscd=1Ovendry lbs. Merchantable biomass p.expvol * t.tpacurr * c.landclcd=1 and c.reservcd=0
of all live trees on timberland t.drybiom and c.siteclcd in (1,2,3,4,5,6) and t.statuscd=1
55
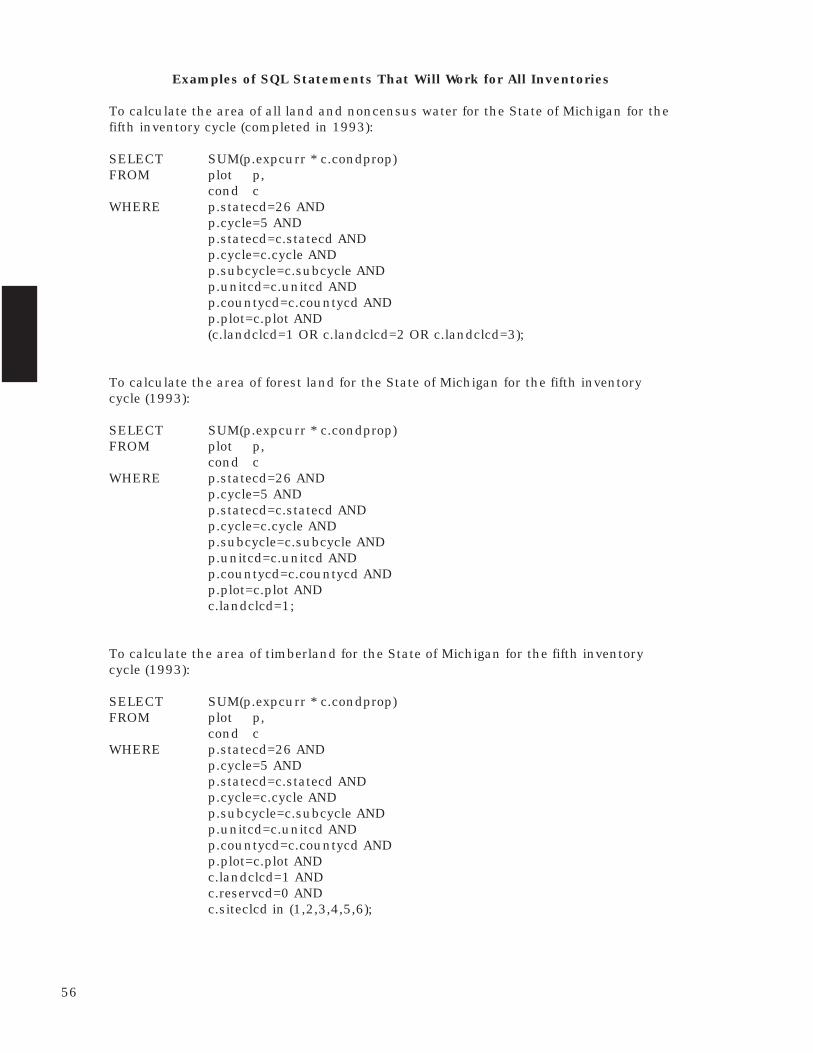
Examples of SQL Statements That Will Work for All Inventories
To calculate the area of all land and noncensus water for the State of Michigan for thefifth inventory cycle (completed in 1993):
SELECT SUM(p.expcurr * c.condprop)FROM plot p,
cond cWHERE p.statecd=26 AND
p.cycle=5 ANDp.statecd=c.statecd ANDp.cycle=c.cycle ANDp.subcycle=c.subcycle ANDp.unitcd=c.unitcd ANDp.countycd=c.countycd ANDp.plot=c.plot AND(c.landclcd=1 OR c.landclcd=2 OR c.landclcd=3);
To calculate the area of forest land for the State of Michigan for the fifth inventorycycle (1993):
SELECT SUM(p.expcurr * c.condprop)FROM plot p,
cond cWHERE p.statecd=26 AND
p.cycle=5 ANDp.statecd=c.statecd ANDp.cycle=c.cycle ANDp.subcycle=c.subcycle ANDp.unitcd=c.unitcd ANDp.countycd=c.countycd ANDp.plot=c.plot ANDc.landclcd=1;
To calculate the area of timberland for the State of Michigan for the fifth inventorycycle (1993):
SELECT SUM(p.expcurr * c.condprop)FROM plot p,
cond cWHERE p.statecd=26 AND
p.cycle=5 ANDp.statecd=c.statecd ANDp.cycle=c.cycle ANDp.subcycle=c.subcycle ANDp.unitcd=c.unitcd ANDp.countycd=c.countycd ANDp.plot=c.plot ANDc.landclcd=1 ANDc.reservcd=0 ANDc.siteclcd in (1,2,3,4,5,6);
56
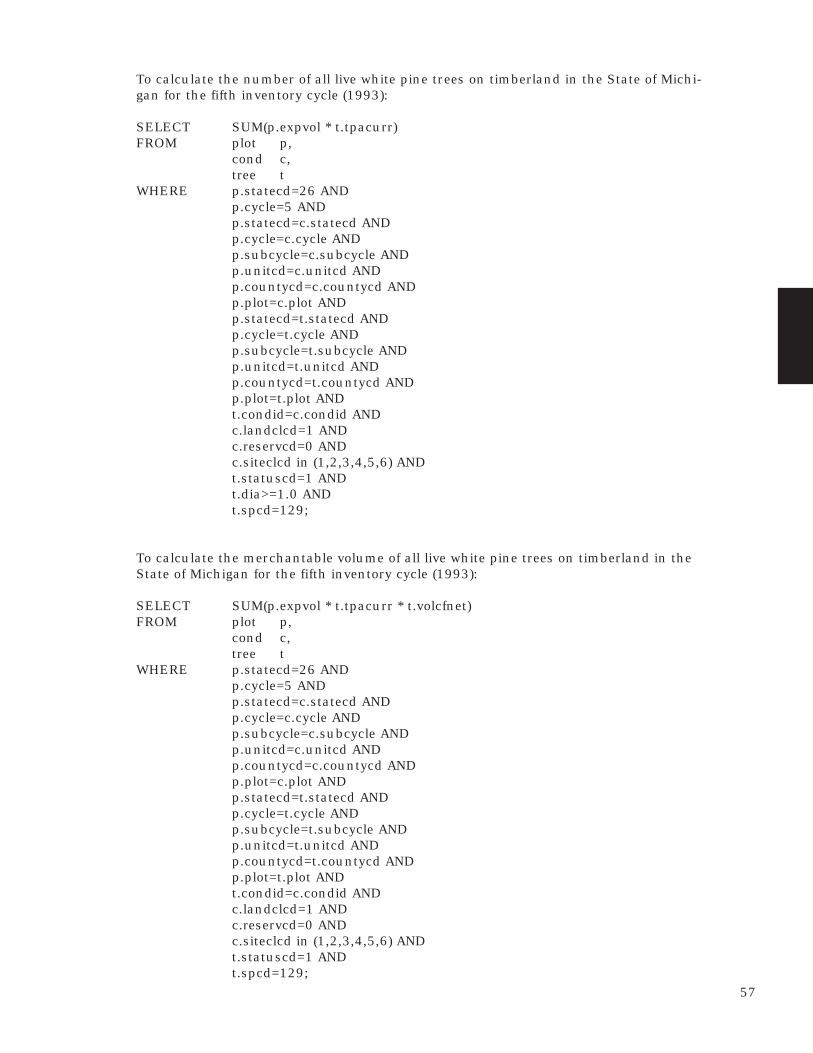
To calculate the number of all live white pine trees on timberland in the State of Michi-gan for the fifth inventory cycle (1993):
SELECT SUM(p.expvol * t.tpacurr)FROM plot p,
cond c,tree t
WHERE p.statecd=26 ANDp.cycle=5 ANDp.statecd=c.statecd ANDp.cycle=c.cycle ANDp.subcycle=c.subcycle ANDp.unitcd=c.unitcd ANDp.countycd=c.countycd ANDp.plot=c.plot ANDp.statecd=t.statecd ANDp.cycle=t.cycle ANDp.subcycle=t.subcycle ANDp.unitcd=t.unitcd ANDp.countycd=t.countycd ANDp.plot=t.plot ANDt.condid=c.condid ANDc.landclcd=1 ANDc.reservcd=0 ANDc.siteclcd in (1,2,3,4,5,6) ANDt.statuscd=1 ANDt.dia>=1.0 ANDt.spcd=129;
To calculate the merchantable volume of all live white pine trees on timberland in theState of Michigan for the fifth inventory cycle (1993):
SELECT SUM(p.expvol * t.tpacurr * t.volcfnet)FROM plot p,
cond c,tree t
WHERE p.statecd=26 ANDp.cycle=5 ANDp.statecd=c.statecd ANDp.cycle=c.cycle ANDp.subcycle=c.subcycle ANDp.unitcd=c.unitcd ANDp.countycd=c.countycd ANDp.plot=c.plot ANDp.statecd=t.statecd ANDp.cycle=t.cycle ANDp.subcycle=t.subcycle ANDp.unitcd=t.unitcd ANDp.countycd=t.countycd ANDp.plot=t.plot ANDt.condid=c.condid ANDc.landclcd=1 ANDc.reservcd=0 ANDc.siteclcd in (1,2,3,4,5,6) ANDt.statuscd=1 ANDt.spcd=129;
57

To calculate the net annual merchantable growth of white pine growing-stock treeson timberland in the State of Michigan for the fifth inventory cycle (1980-1992):
SELECT SUM(p.expgrow * t.tpagrow * t.growcfgs)FROM plot p,
cond c,tree t,cond oc
WHERE p.statecd=26 ANDp.cycle=5 ANDp.statecd=c.statecd ANDp.cycle=c.cycle ANDp.subcycle=c.subcycle ANDp.unitcd=c.unitcd ANDp.countycd=c.countycd ANDp.plot=c.plot ANDc.statecd=t.statecd ANDc.cycle=t.cycle ANDc.subcycle=t.subcycle ANDc.unitcd=t.unitcd ANDc.countycd=t.countycd ANDc.plot=t.plot ANDc.condid=t.condid ANDt.statecd=oc.statecd (+) AND(t.cycle-1)=oc.cycle (+) ANDt.prevsubc=oc.subcycle (+) ANDt.unitcd=oc.unitcd (+) ANDt.countycd=oc.countycd (+) ANDt.plot=oc.plot (+) ANDt.prevcond=oc.condid (+) AND((c.landclcd=1 and c.siteclcd in (1,2,3,4,5,6) and c.reservcd=0) OR(oc.landclcd=1 and oc.siteclcd in (1,2,3,4,5,6) and oc.reservcd=0)) ANDt.spcd=129;
NOTE: We need to do an outer join for the COND record because there will be norecord in the COND table for the previous cycle if the plot is a new plot (some FIAunits modeled growth for new plots). An outer join will cause the value of oc.landclcd(land class from the previous cycle COND record) to be null if a record meeting therequirements is not found.
To calculate the annual merchantable mortality of white pine growing-stock trees ontimberland in the State of Michigan for the fifth inventory cycle (1980-1992):
SELECT SUM(p.expmort * t.tpamort * t.mortcfgs)FROM plot p,
cond c,tree t,cond oc
WHERE p.statecd=26 ANDp.cycle=5 ANDp.statecd=c.statecd ANDp.cycle=c.cycle ANDp.subcycle=c.subcycle ANDp.unitcd=c.unitcd ANDp.countycd=c.countycd AND
58
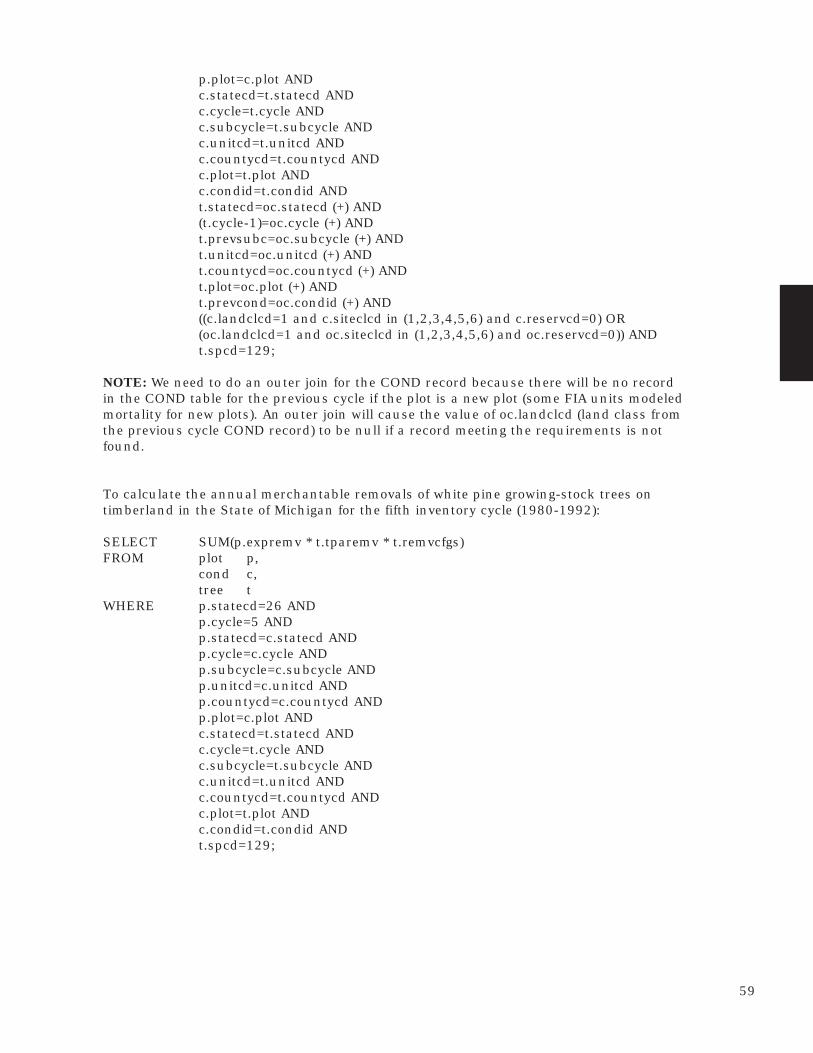
p.plot=c.plot ANDc.statecd=t.statecd ANDc.cycle=t.cycle ANDc.subcycle=t.subcycle ANDc.unitcd=t.unitcd ANDc.countycd=t.countycd ANDc.plot=t.plot ANDc.condid=t.condid ANDt.statecd=oc.statecd (+) AND(t.cycle-1)=oc.cycle (+) ANDt.prevsubc=oc.subcycle (+) ANDt.unitcd=oc.unitcd (+) ANDt.countycd=oc.countycd (+) ANDt.plot=oc.plot (+) ANDt.prevcond=oc.condid (+) AND((c.landclcd=1 and c.siteclcd in (1,2,3,4,5,6) and c.reservcd=0) OR(oc.landclcd=1 and oc.siteclcd in (1,2,3,4,5,6) and oc.reservcd=0)) ANDt.spcd=129;
NOTE: We need to do an outer join for the COND record because there will be no recordin the COND table for the previous cycle if the plot is a new plot (some FIA units modeledmortality for new plots). An outer join will cause the value of oc.landclcd (land class fromthe previous cycle COND record) to be null if a record meeting the requirements is notfound.
To calculate the annual merchantable removals of white pine growing-stock trees ontimberland in the State of Michigan for the fifth inventory cycle (1980-1992):
SELECT SUM(p.expremv * t.tparemv * t.remvcfgs)FROM plot p,
cond c,tree t
WHERE p.statecd=26 ANDp.cycle=5 ANDp.statecd=c.statecd ANDp.cycle=c.cycle ANDp.subcycle=c.subcycle ANDp.unitcd=c.unitcd ANDp.countycd=c.countycd ANDp.plot=c.plot ANDc.statecd=t.statecd ANDc.cycle=t.cycle ANDc.subcycle=t.subcycle ANDc.unitcd=t.unitcd ANDc.countycd=t.countycd ANDc.plot=t.plot ANDc.condid=t.condid ANDt.spcd=129;
59
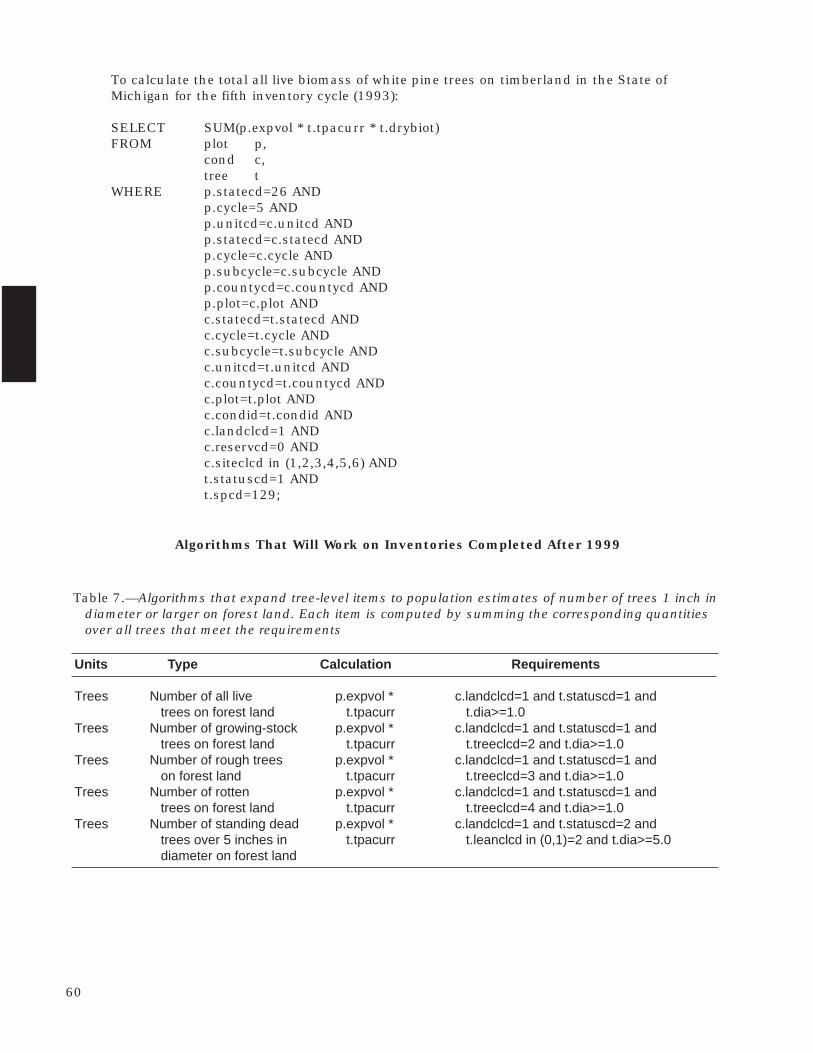
To calculate the total all live biomass of white pine trees on timberland in the State ofMichigan for the fifth inventory cycle (1993):
SELECT SUM(p.expvol * t.tpacurr * t.drybiot)FROM plot p,
cond c,tree t
WHERE p.statecd=26 ANDp.cycle=5 ANDp.unitcd=c.unitcd ANDp.statecd=c.statecd ANDp.cycle=c.cycle ANDp.subcycle=c.subcycle ANDp.countycd=c.countycd ANDp.plot=c.plot ANDc.statecd=t.statecd ANDc.cycle=t.cycle ANDc.subcycle=t.subcycle ANDc.unitcd=t.unitcd ANDc.countycd=t.countycd ANDc.plot=t.plot ANDc.condid=t.condid ANDc.landclcd=1 ANDc.reservcd=0 ANDc.siteclcd in (1,2,3,4,5,6) ANDt.statuscd=1 ANDt.spcd=129;
Algorithms That Will Work on Inventories Completed After 1999
Table 7.—Algorithms that expand tree-level items to population estimates of number of trees 1 inch indiameter or larger on forest land. Each item is computed by summing the corresponding quantitiesover all trees that meet the requirements
Units Type Calculation Requirements
Trees Number of all live p.expvol * c.landclcd=1 and t.statuscd=1 and trees on forest land t.tpacurr t.dia>=1.0
Trees Number of growing-stock p.expvol * c.landclcd=1 and t.statuscd=1 and trees on forest land t.tpacurr t.treeclcd=2 and t.dia>=1.0
Trees Number of rough trees p.expvol * c.landclcd=1 and t.statuscd=1 and on forest land t.tpacurr t.treeclcd=3 and t.dia>=1.0
Trees Number of rotten p.expvol * c.landclcd=1 and t.statuscd=1 and trees on forest land t.tpacurr t.treeclcd=4 and t.dia>=1.0
Trees Number of standing dead p.expvol * c.landclcd=1 and t.statuscd=2 and trees over 5 inches in t.tpacurr t.leanclcd in (0,1)=2 and t.dia>=5.0 diameter on forest land
60
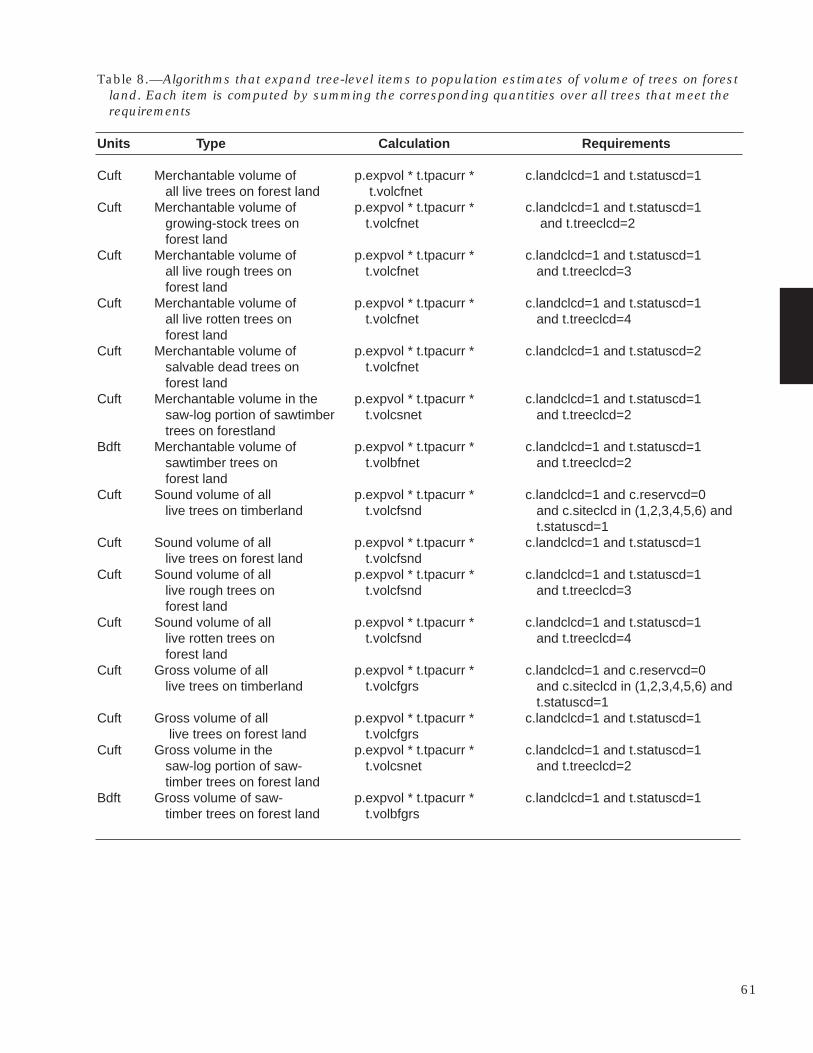
Table 8.—Algorithms that expand tree-level items to population estimates of volume of trees on forestland. Each item is computed by summing the corresponding quantities over all trees that meet therequirements
Units Type Calculation Requirements
Cuft Merchantable volume of p.expvol * t.tpacurr * c.landclcd=1 and t.statuscd=1 all live trees on forest land t.volcfnet
Cuft Merchantable volume of p.expvol * t.tpacurr * c.landclcd=1 and t.statuscd=1 growing-stock trees on t.volcfnet and t.treeclcd=2 forest land
Cuft Merchantable volume of p.expvol * t.tpacurr * c.landclcd=1 and t.statuscd=1 all live rough trees on t.volcfnet and t.treeclcd=3 forest land
Cuft Merchantable volume of p.expvol * t.tpacurr * c.landclcd=1 and t.statuscd=1 all live rotten trees on t.volcfnet and t.treeclcd=4 forest land
Cuft Merchantable volume of p.expvol * t.tpacurr * c.landclcd=1 and t.statuscd=2 salvable dead trees on t.volcfnet forest land
Cuft Merchantable volume in the p.expvol * t.tpacurr * c.landclcd=1 and t.statuscd=1 saw-log portion of sawtimber t.volcsnet and t.treeclcd=2 trees on forestland
Bdft Merchantable volume of p.expvol * t.tpacurr * c.landclcd=1 and t.statuscd=1 sawtimber trees on t.volbfnet and t.treeclcd=2 forest land
Cuft Sound volume of all p.expvol * t.tpacurr * c.landclcd=1 and c.reservcd=0 live trees on timberland t.volcfsnd and c.siteclcd in (1,2,3,4,5,6) and
t.statuscd=1Cuft Sound volume of all p.expvol * t.tpacurr * c.landclcd=1 and t.statuscd=1
live trees on forest land t.volcfsndCuft Sound volume of all p.expvol * t.tpacurr * c.landclcd=1 and t.statuscd=1
live rough trees on t.volcfsnd and t.treeclcd=3 forest land
Cuft Sound volume of all p.expvol * t.tpacurr * c.landclcd=1 and t.statuscd=1 live rotten trees on t.volcfsnd and t.treeclcd=4 forest land
Cuft Gross volume of all p.expvol * t.tpacurr * c.landclcd=1 and c.reservcd=0 live trees on timberland t.volcfgrs and c.siteclcd in (1,2,3,4,5,6) and
t.statuscd=1Cuft Gross volume of all p.expvol * t.tpacurr * c.landclcd=1 and t.statuscd=1
live trees on forest land t.volcfgrsCuft Gross volume in the p.expvol * t.tpacurr * c.landclcd=1 and t.statuscd=1
saw-log portion of saw- t.volcsnet and t.treeclcd=2 timber trees on forest land
Bdft Gross volume of saw- p.expvol * t.tpacurr * c.landclcd=1 and t.statuscd=1 timber trees on forest land t.volbfgrs
61

Table 9.—Algorithms that expand tree-level items to population estimates of biomass of trees onforest land. Each item is computed by summing the corresponding quantities over all trees thatmeet the requirements.
Units Type Calculation Requirements
Ovendry lbs. Gross biomass of all p.expvol * t.tpacurr * c.landclcd=1 and live trees on forest land t.drybiot t.statuscd=1
Ovendry lbs. Merchantable biomass p.expvol * t.tpacurr * c.landclcd=1 and of all live trees on t.drybiom t.statuscd=1 forest land
Examples of SQL Statements That Will Work on Inventories Completed After 1999
To calculate the total number of all live white pine trees on forest land in the State ofMichigan for the sixth inventory cycle (estimated year of completion 2004):
SELECT SUM(p.expvol * t.tpacurr)FROM plot p,
cond c,tree t
WHERE p.statecd=26 ANDp.cycle=6 ANDp.statecd=c.statecd ANDp.cycle=c.cycle ANDp.subcycle=c.subcycle ANDp.unitcd=c.unitcd ANDp.countycd=c.countycd ANDp.plot=c.plot ANDp.statecd=t.statecd ANDp.cycle=t.cycle ANDp.subcycle=t.subcycle ANDp.unitcd=t.unitcd ANDp.countycd=t.countycd ANDp.plot=t.plot ANDt.condid=c.condid ANDc.landclcd=1 ANDt.statuscd=1 ANDt.dia>=1.0 ANDt.spcd=129;
62
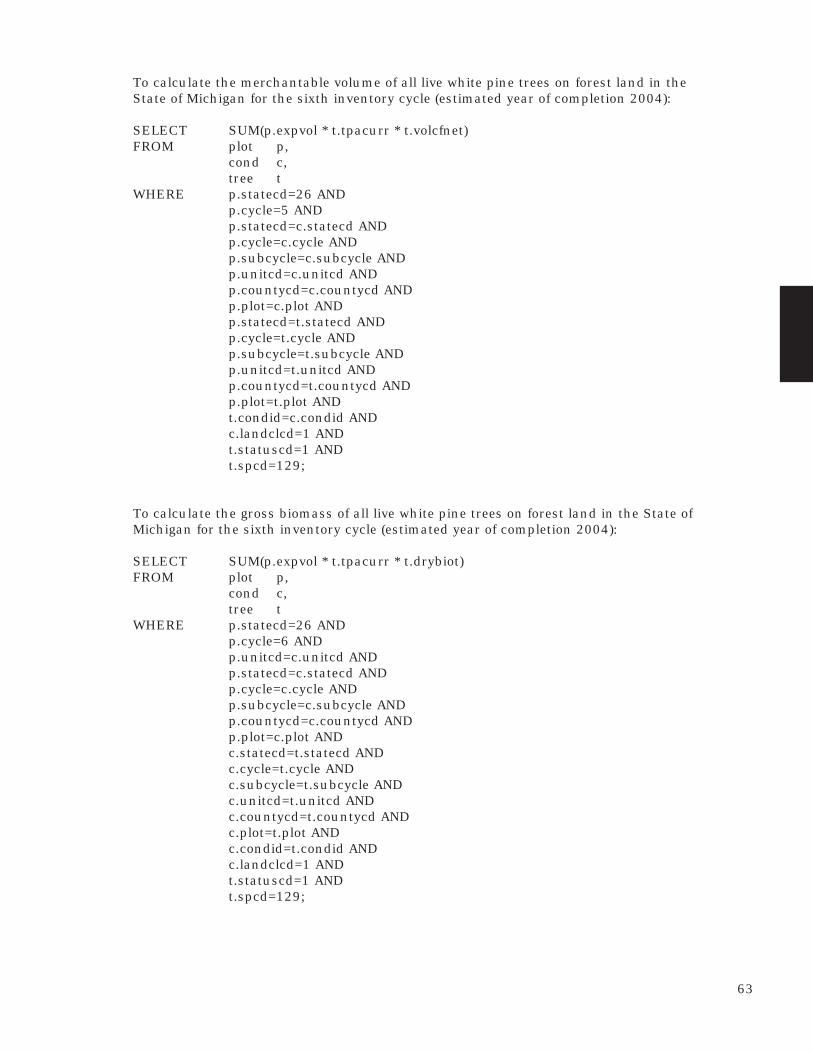
To calculate the merchantable volume of all live white pine trees on forest land in theState of Michigan for the sixth inventory cycle (estimated year of completion 2004):
SELECT SUM(p.expvol * t.tpacurr * t.volcfnet)FROM plot p,
cond c,tree t
WHERE p.statecd=26 ANDp.cycle=5 ANDp.statecd=c.statecd ANDp.cycle=c.cycle ANDp.subcycle=c.subcycle ANDp.unitcd=c.unitcd ANDp.countycd=c.countycd ANDp.plot=c.plot ANDp.statecd=t.statecd ANDp.cycle=t.cycle ANDp.subcycle=t.subcycle ANDp.unitcd=t.unitcd ANDp.countycd=t.countycd ANDp.plot=t.plot ANDt.condid=c.condid ANDc.landclcd=1 ANDt.statuscd=1 ANDt.spcd=129;
To calculate the gross biomass of all live white pine trees on forest land in the State ofMichigan for the sixth inventory cycle (estimated year of completion 2004):
SELECT SUM(p.expvol * t.tpacurr * t.drybiot)FROM plot p,
cond c,tree t
WHERE p.statecd=26 ANDp.cycle=6 ANDp.unitcd=c.unitcd ANDp.statecd=c.statecd ANDp.cycle=c.cycle ANDp.subcycle=c.subcycle ANDp.countycd=c.countycd ANDp.plot=c.plot ANDc.statecd=t.statecd ANDc.cycle=t.cycle ANDc.subcycle=t.subcycle ANDc.unitcd=t.unitcd ANDc.countycd=t.countycd ANDc.plot=t.plot ANDc.condid=t.condid ANDc.landclcd=1 ANDt.statuscd=1 ANDt.spcd=129;
63
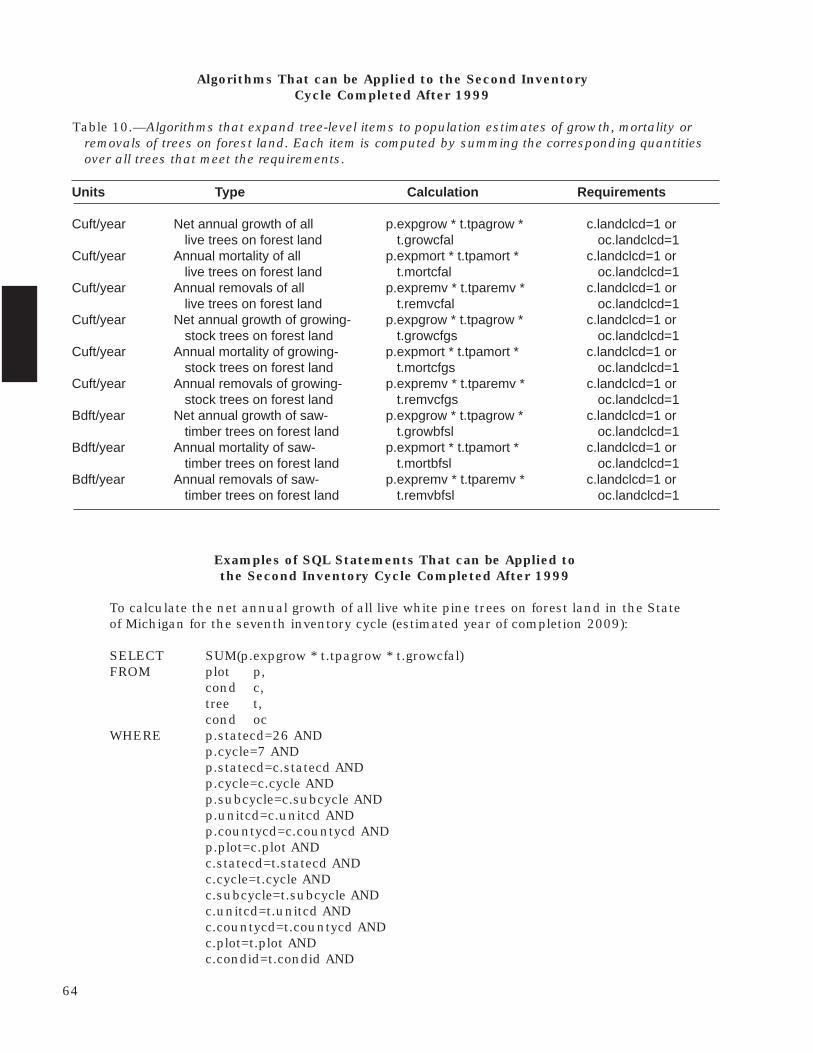
Algorithms That can be Applied to the Second InventoryCycle Completed After 1999
Table 10.—Algorithms that expand tree-level items to population estimates of growth, mortality orremovals of trees on forest land. Each item is computed by summing the corresponding quantitiesover all trees that meet the requirements.
Units Type Calculation Requirements
Cuft/year Net annual growth of all p.expgrow * t.tpagrow * c.landclcd=1 or live trees on forest land t.growcfal oc.landclcd=1
Cuft/year Annual mortality of all p.expmort * t.tpamort * c.landclcd=1 or live trees on forest land t.mortcfal oc.landclcd=1
Cuft/year Annual removals of all p.expremv * t.tparemv * c.landclcd=1 or live trees on forest land t.remvcfal oc.landclcd=1
Cuft/year Net annual growth of growing- p.expgrow * t.tpagrow * c.landclcd=1 or stock trees on forest land t.growcfgs oc.landclcd=1
Cuft/year Annual mortality of growing- p.expmort * t.tpamort * c.landclcd=1 or stock trees on forest land t.mortcfgs oc.landclcd=1
Cuft/year Annual removals of growing- p.expremv * t.tparemv * c.landclcd=1 or stock trees on forest land t.remvcfgs oc.landclcd=1
Bdft/year Net annual growth of saw- p.expgrow * t.tpagrow * c.landclcd=1 or timber trees on forest land t.growbfsl oc.landclcd=1
Bdft/year Annual mortality of saw- p.expmort * t.tpamort * c.landclcd=1 or timber trees on forest land t.mortbfsl oc.landclcd=1
Bdft/year Annual removals of saw- p.expremv * t.tparemv * c.landclcd=1 or timber trees on forest land t.remvbfsl oc.landclcd=1
Examples of SQL Statements That can be Applied tothe Second Inventory Cycle Completed After 1999
To calculate the net annual growth of all live white pine trees on forest land in the Stateof Michigan for the seventh inventory cycle (estimated year of completion 2009):
SELECT SUM(p.expgrow * t.tpagrow * t.growcfal)FROM plot p,
cond c,tree t,cond oc
WHERE p.statecd=26 ANDp.cycle=7 ANDp.statecd=c.statecd ANDp.cycle=c.cycle ANDp.subcycle=c.subcycle ANDp.unitcd=c.unitcd ANDp.countycd=c.countycd ANDp.plot=c.plot ANDc.statecd=t.statecd ANDc.cycle=t.cycle ANDc.subcycle=t.subcycle ANDc.unitcd=t.unitcd ANDc.countycd=t.countycd ANDc.plot=t.plot ANDc.condid=t.condid AND
64
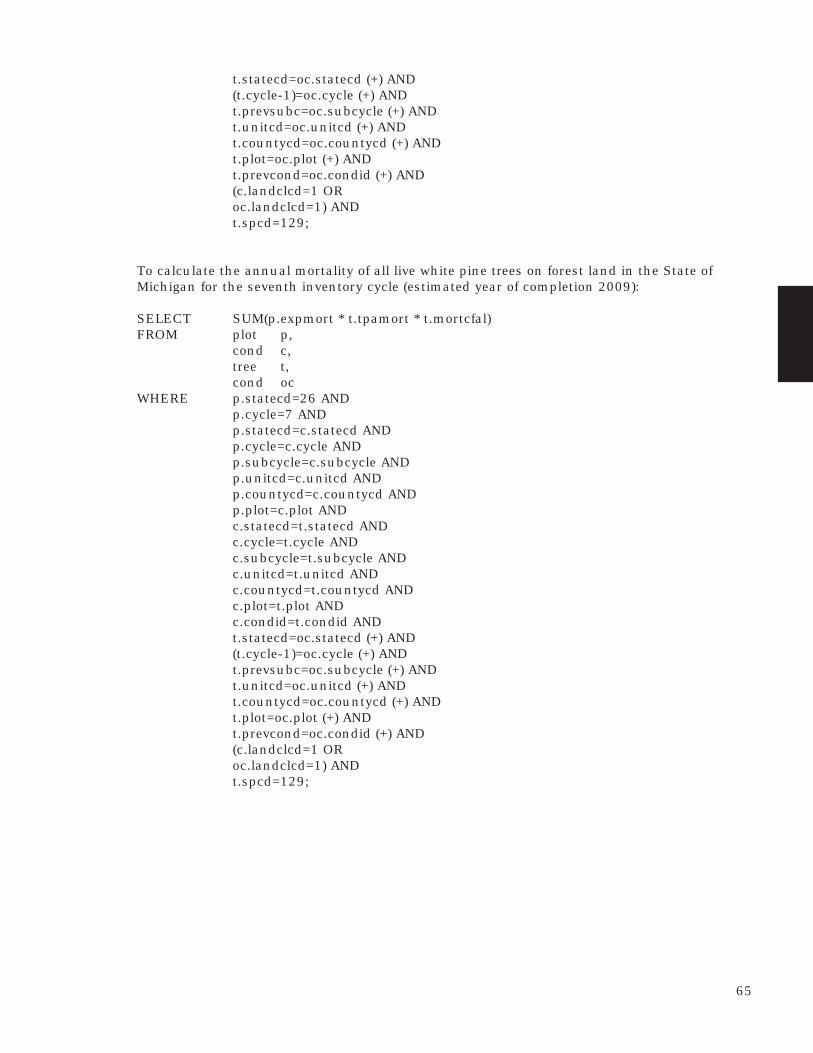
t.statecd=oc.statecd (+) AND(t.cycle-1)=oc.cycle (+) ANDt.prevsubc=oc.subcycle (+) ANDt.unitcd=oc.unitcd (+) ANDt.countycd=oc.countycd (+) ANDt.plot=oc.plot (+) ANDt.prevcond=oc.condid (+) AND(c.landclcd=1 ORoc.landclcd=1) ANDt.spcd=129;
To calculate the annual mortality of all live white pine trees on forest land in the State ofMichigan for the seventh inventory cycle (estimated year of completion 2009):
SELECT SUM(p.expmort * t.tpamort * t.mortcfal)FROM plot p,
cond c,tree t,cond oc
WHERE p.statecd=26 ANDp.cycle=7 ANDp.statecd=c.statecd ANDp.cycle=c.cycle ANDp.subcycle=c.subcycle ANDp.unitcd=c.unitcd ANDp.countycd=c.countycd ANDp.plot=c.plot ANDc.statecd=t.statecd ANDc.cycle=t.cycle ANDc.subcycle=t.subcycle ANDc.unitcd=t.unitcd ANDc.countycd=t.countycd ANDc.plot=t.plot ANDc.condid=t.condid ANDt.statecd=oc.statecd (+) AND(t.cycle-1)=oc.cycle (+) ANDt.prevsubc=oc.subcycle (+) ANDt.unitcd=oc.unitcd (+) ANDt.countycd=oc.countycd (+) ANDt.plot=oc.plot (+) ANDt.prevcond=oc.condid (+) AND(c.landclcd=1 ORoc.landclcd=1) ANDt.spcd=129;
65
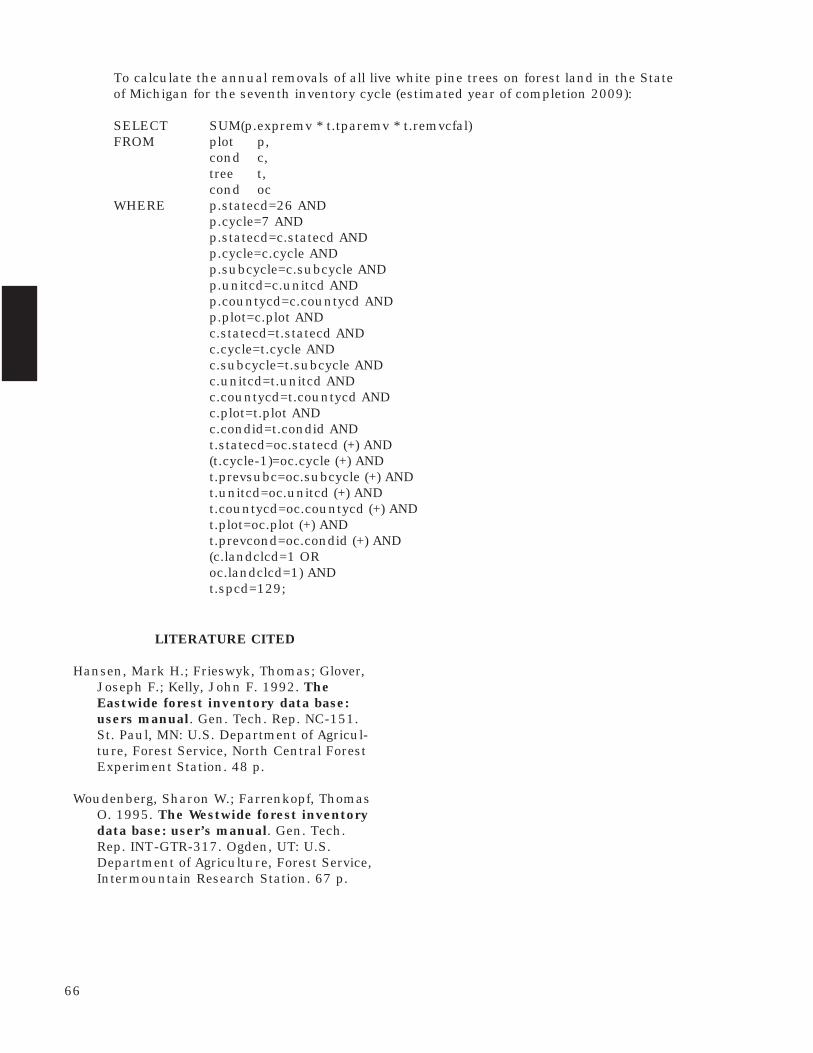
To calculate the annual removals of all live white pine trees on forest land in the Stateof Michigan for the seventh inventory cycle (estimated year of completion 2009):
SELECT SUM(p.expremv * t.tparemv * t.remvcfal)FROM plot p,
cond c,tree t,cond oc
WHERE p.statecd=26 ANDp.cycle=7 ANDp.statecd=c.statecd ANDp.cycle=c.cycle ANDp.subcycle=c.subcycle ANDp.unitcd=c.unitcd ANDp.countycd=c.countycd ANDp.plot=c.plot ANDc.statecd=t.statecd ANDc.cycle=t.cycle ANDc.subcycle=t.subcycle ANDc.unitcd=t.unitcd ANDc.countycd=t.countycd ANDc.plot=t.plot ANDc.condid=t.condid ANDt.statecd=oc.statecd (+) AND(t.cycle-1)=oc.cycle (+) ANDt.prevsubc=oc.subcycle (+) ANDt.unitcd=oc.unitcd (+) ANDt.countycd=oc.countycd (+) ANDt.plot=oc.plot (+) ANDt.prevcond=oc.condid (+) AND(c.landclcd=1 ORoc.landclcd=1) ANDt.spcd=129;
LITERATURE CITED
Hansen, Mark H.; Frieswyk, Thomas; Glover,Joseph F.; Kelly, John F. 1992. TheEastwide forest inventory data base:users manual. Gen. Tech. Rep. NC-151.St. Paul, MN: U.S. Department of Agricul-ture, Forest Service, North Central ForestExperiment Station. 48 p.
Woudenberg, Sharon W.; Farrenkopf, ThomasO. 1995. The Westwide forest inventorydata base: user’s manual. Gen. Tech.Rep. INT-GTR-317. Ogden, UT: U.S.Department of Agriculture, Forest Service,Intermountain Research Station. 67 p.
66
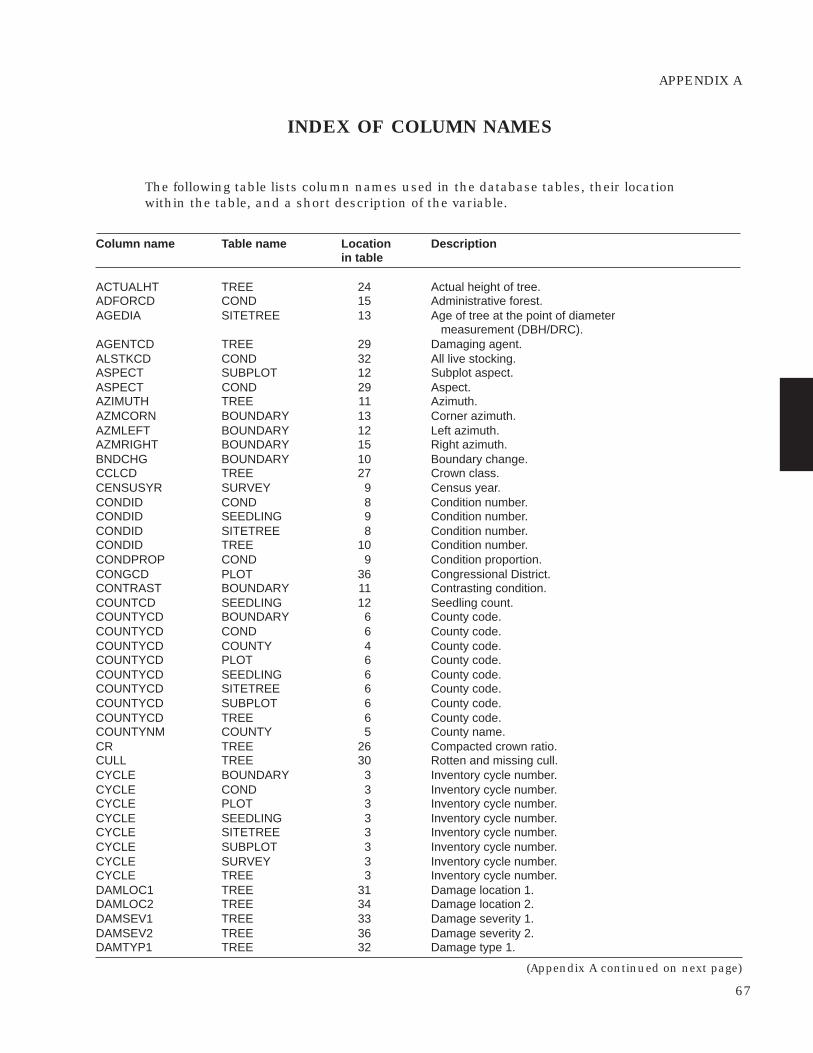
APPENDIX A
INDEX OF COLUMN NAMES
The following table lists column names used in the database tables, their locationwithin the table, and a short description of the variable.
Column name Table name Location Descriptionin table
ACTUALHT TREE 24 Actual height of tree.ADFORCD COND 15 Administrative forest.AGEDIA SITETREE 13 Age of tree at the point of diameter
measurement (DBH/DRC).AGENTCD TREE 29 Damaging agent.ALSTKCD COND 32 All live stocking.ASPECT SUBPLOT 12 Subplot aspect.ASPECT COND 29 Aspect.AZIMUTH TREE 11 Azimuth.AZMCORN BOUNDARY 13 Corner azimuth.AZMLEFT BOUNDARY 12 Left azimuth.AZMRIGHT BOUNDARY 15 Right azimuth.BNDCHG BOUNDARY 10 Boundary change.CCLCD TREE 27 Crown class.CENSUSYR SURVEY 9 Census year.CONDID COND 8 Condition number.CONDID SEEDLING 9 Condition number.CONDID SITETREE 8 Condition number.CONDID TREE 10 Condition number.CONDPROP COND 9 Condition proportion.CONGCD PLOT 36 Congressional District.CONTRAST BOUNDARY 11 Contrasting condition.COUNTCD SEEDLING 12 Seedling count.COUNTYCD BOUNDARY 6 County code.COUNTYCD COND 6 County code.COUNTYCD COUNTY 4 County code.COUNTYCD PLOT 6 County code.COUNTYCD SEEDLING 6 County code.COUNTYCD SITETREE 6 County code.COUNTYCD SUBPLOT 6 County code.COUNTYCD TREE 6 County code.COUNTYNM COUNTY 5 County name.CR TREE 26 Compacted crown ratio.CULL TREE 30 Rotten and missing cull.CYCLE BOUNDARY 3 Inventory cycle number.CYCLE COND 3 Inventory cycle number.CYCLE PLOT 3 Inventory cycle number.CYCLE SEEDLING 3 Inventory cycle number.CYCLE SITETREE 3 Inventory cycle number.CYCLE SUBPLOT 3 Inventory cycle number.CYCLE SURVEY 3 Inventory cycle number.CYCLE TREE 3 Inventory cycle number.DAMLOC1 TREE 31 Damage location 1.DAMLOC2 TREE 34 Damage location 2.DAMSEV1 TREE 33 Damage severity 1.DAMSEV2 TREE 36 Damage severity 2.DAMTYP1 TREE 32 Damage type 1.
67
(Appendix A continued on next page)
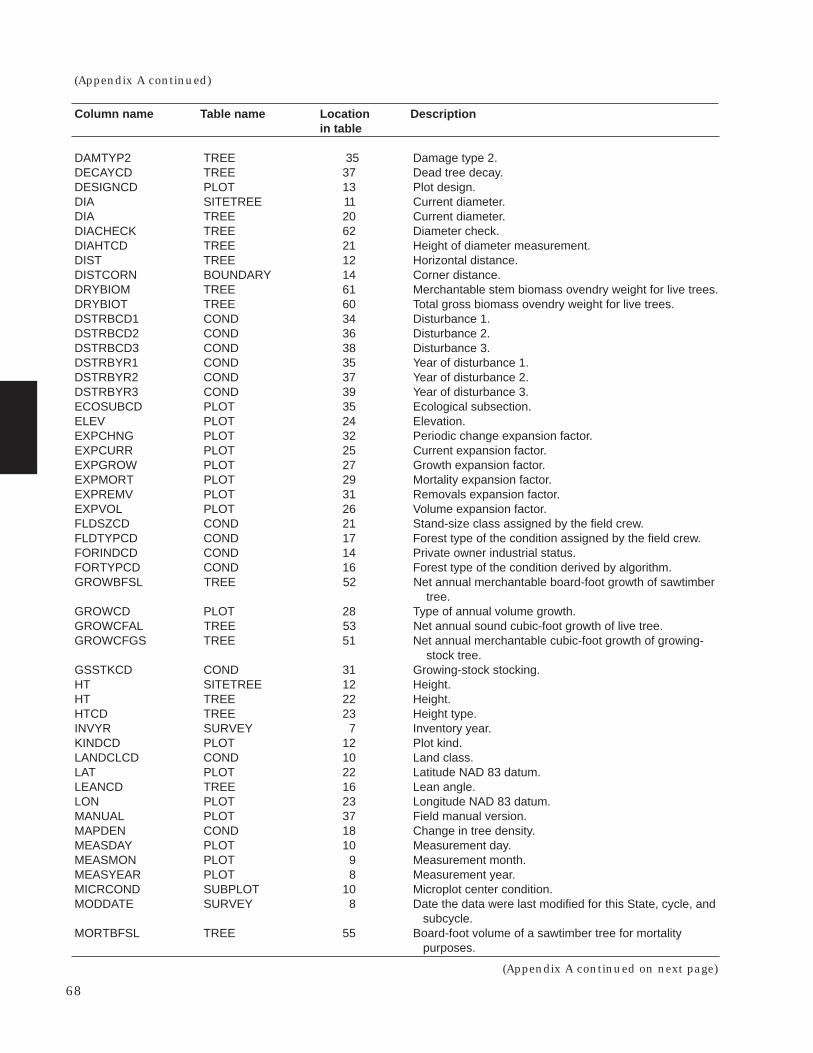
DAMTYP2 TREE 35 Damage type 2.DECAYCD TREE 37 Dead tree decay.DESIGNCD PLOT 13 Plot design.DIA SITETREE 11 Current diameter.DIA TREE 20 Current diameter.DIACHECK TREE 62 Diameter check.DIAHTCD TREE 21 Height of diameter measurement.DIST TREE 12 Horizontal distance.DISTCORN BOUNDARY 14 Corner distance.DRYBIOM TREE 61 Merchantable stem biomass ovendry weight for live trees.DRYBIOT TREE 60 Total gross biomass ovendry weight for live trees.DSTRBCD1 COND 34 Disturbance 1.DSTRBCD2 COND 36 Disturbance 2.DSTRBCD3 COND 38 Disturbance 3.DSTRBYR1 COND 35 Year of disturbance 1.DSTRBYR2 COND 37 Year of disturbance 2.DSTRBYR3 COND 39 Year of disturbance 3.ECOSUBCD PLOT 35 Ecological subsection.ELEV PLOT 24 Elevation.EXPCHNG PLOT 32 Periodic change expansion factor.EXPCURR PLOT 25 Current expansion factor.EXPGROW PLOT 27 Growth expansion factor.EXPMORT PLOT 29 Mortality expansion factor.EXPREMV PLOT 31 Removals expansion factor.EXPVOL PLOT 26 Volume expansion factor.FLDSZCD COND 21 Stand-size class assigned by the field crew.FLDTYPCD COND 17 Forest type of the condition assigned by the field crew.FORINDCD COND 14 Private owner industrial status.FORTYPCD COND 16 Forest type of the condition derived by algorithm.GROWBFSL TREE 52 Net annual merchantable board-foot growth of sawtimber
tree.GROWCD PLOT 28 Type of annual volume growth.GROWCFAL TREE 53 Net annual sound cubic-foot growth of live tree.GROWCFGS TREE 51 Net annual merchantable cubic-foot growth of growing-
stock tree.GSSTKCD COND 31 Growing-stock stocking.HT SITETREE 12 Height.HT TREE 22 Height.HTCD TREE 23 Height type.INVYR SURVEY 7 Inventory year.KINDCD PLOT 12 Plot kind.LANDCLCD COND 10 Land class.LAT PLOT 22 Latitude NAD 83 datum.LEANCD TREE 16 Lean angle.LON PLOT 23 Longitude NAD 83 datum.MANUAL PLOT 37 Field manual version.MAPDEN COND 18 Change in tree density.MEASDAY PLOT 10 Measurement day.MEASMON PLOT 9 Measurement month.MEASYEAR PLOT 8 Measurement year.MICRCOND SUBPLOT 10 Microplot center condition.MODDATE SURVEY 8 Date the data were last modified for this State, cycle, and
subcycle.MORTBFSL TREE 55 Board-foot volume of a sawtimber tree for mortality
purposes.
Column name Table name Location Descriptionin table
68
(Appendix A continued)
(Appendix A continued on next page)
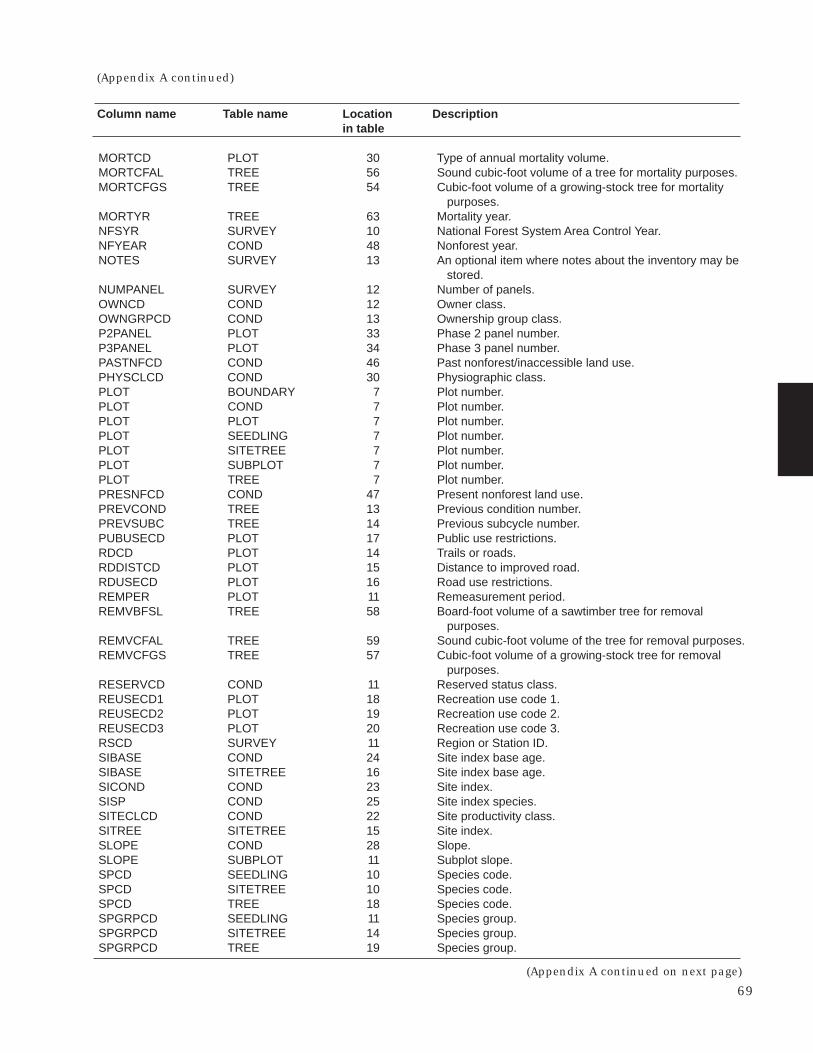
MORTCD PLOT 30 Type of annual mortality volume.MORTCFAL TREE 56 Sound cubic-foot volume of a tree for mortality purposes.MORTCFGS TREE 54 Cubic-foot volume of a growing-stock tree for mortality
purposes.MORTYR TREE 63 Mortality year.NFSYR SURVEY 10 National Forest System Area Control Year.NFYEAR COND 48 Nonforest year.NOTES SURVEY 13 An optional item where notes about the inventory may be
stored.NUMPANEL SURVEY 12 Number of panels.OWNCD COND 12 Owner class.OWNGRPCD COND 13 Ownership group class.P2PANEL PLOT 33 Phase 2 panel number.P3PANEL PLOT 34 Phase 3 panel number.PASTNFCD COND 46 Past nonforest/inaccessible land use.PHYSCLCD COND 30 Physiographic class.PLOT BOUNDARY 7 Plot number.PLOT COND 7 Plot number.PLOT PLOT 7 Plot number.PLOT SEEDLING 7 Plot number.PLOT SITETREE 7 Plot number.PLOT SUBPLOT 7 Plot number.PLOT TREE 7 Plot number.PRESNFCD COND 47 Present nonforest land use.PREVCOND TREE 13 Previous condition number.PREVSUBC TREE 14 Previous subcycle number.PUBUSECD PLOT 17 Public use restrictions.RDCD PLOT 14 Trails or roads.RDDISTCD PLOT 15 Distance to improved road.RDUSECD PLOT 16 Road use restrictions.REMPER PLOT 11 Remeasurement period.REMVBFSL TREE 58 Board-foot volume of a sawtimber tree for removal
purposes.REMVCFAL TREE 59 Sound cubic-foot volume of the tree for removal purposes.REMVCFGS TREE 57 Cubic-foot volume of a growing-stock tree for removal
purposes.RESERVCD COND 11 Reserved status class.REUSECD1 PLOT 18 Recreation use code 1.REUSECD2 PLOT 19 Recreation use code 2.REUSECD3 PLOT 20 Recreation use code 3.RSCD SURVEY 11 Region or Station ID.SIBASE COND 24 Site index base age.SIBASE SITETREE 16 Site index base age.SICOND COND 23 Site index.SISP COND 25 Site index species.SITECLCD COND 22 Site productivity class.SITREE SITETREE 15 Site index.SLOPE COND 28 Slope.SLOPE SUBPLOT 11 Subplot slope.SPCD SEEDLING 10 Species code.SPCD SITETREE 10 Species code.SPCD TREE 18 Species code.SPGRPCD SEEDLING 11 Species group.SPGRPCD SITETREE 14 Species group.SPGRPCD TREE 19 Species group.
Column name Table name Location Descriptionin table
69
(Appendix A continued)
(Appendix A continued on next page)
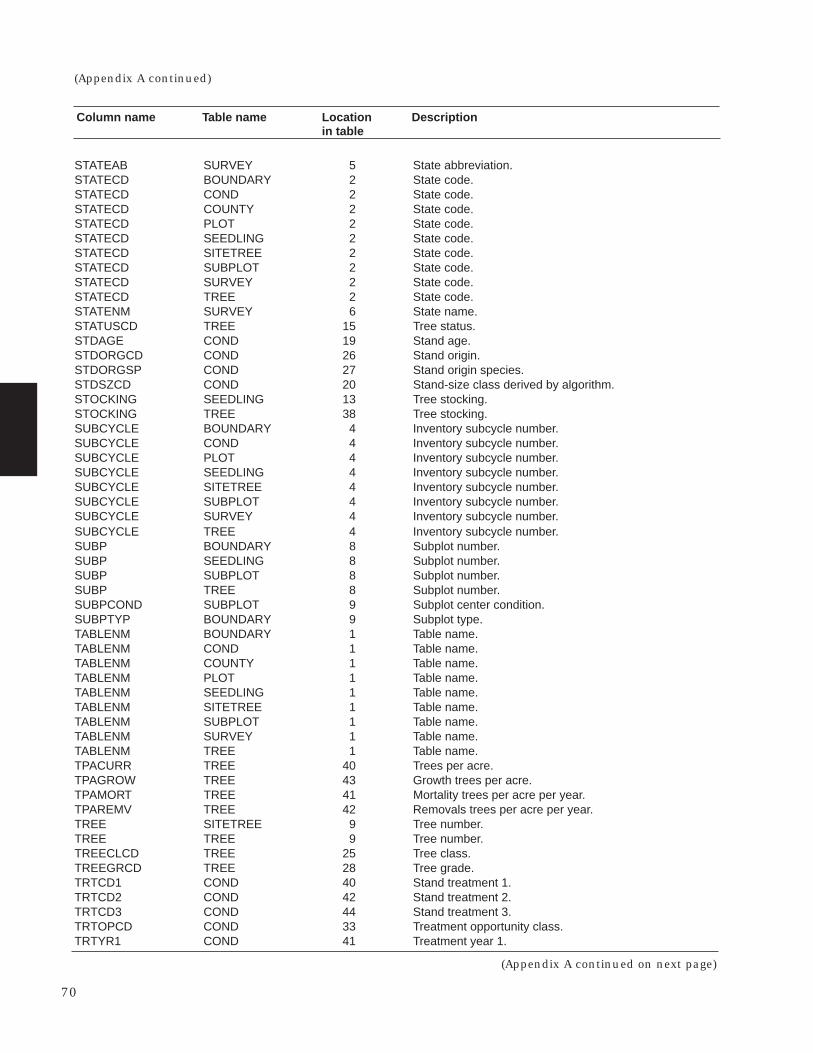
STATEAB SURVEY 5 State abbreviation.STATECD BOUNDARY 2 State code.STATECD COND 2 State code.STATECD COUNTY 2 State code.STATECD PLOT 2 State code.STATECD SEEDLING 2 State code.STATECD SITETREE 2 State code.STATECD SUBPLOT 2 State code.STATECD SURVEY 2 State code.STATECD TREE 2 State code.STATENM SURVEY 6 State name.STATUSCD TREE 15 Tree status.STDAGE COND 19 Stand age.STDORGCD COND 26 Stand origin.STDORGSP COND 27 Stand origin species.STDSZCD COND 20 Stand-size class derived by algorithm.STOCKING SEEDLING 13 Tree stocking.STOCKING TREE 38 Tree stocking.SUBCYCLE BOUNDARY 4 Inventory subcycle number.SUBCYCLE COND 4 Inventory subcycle number.SUBCYCLE PLOT 4 Inventory subcycle number.SUBCYCLE SEEDLING 4 Inventory subcycle number.SUBCYCLE SITETREE 4 Inventory subcycle number.SUBCYCLE SUBPLOT 4 Inventory subcycle number.SUBCYCLE SURVEY 4 Inventory subcycle number.SUBCYCLE TREE 4 Inventory subcycle number.SUBP BOUNDARY 8 Subplot number.SUBP SEEDLING 8 Subplot number.SUBP SUBPLOT 8 Subplot number.SUBP TREE 8 Subplot number.SUBPCOND SUBPLOT 9 Subplot center condition.SUBPTYP BOUNDARY 9 Subplot type.TABLENM BOUNDARY 1 Table name.TABLENM COND 1 Table name.TABLENM COUNTY 1 Table name.TABLENM PLOT 1 Table name.TABLENM SEEDLING 1 Table name.TABLENM SITETREE 1 Table name.TABLENM SUBPLOT 1 Table name.TABLENM SURVEY 1 Table name.TABLENM TREE 1 Table name.TPACURR TREE 40 Trees per acre.TPAGROW TREE 43 Growth trees per acre.TPAMORT TREE 41 Mortality trees per acre per year.TPAREMV TREE 42 Removals trees per acre per year.TREE SITETREE 9 Tree number.TREE TREE 9 Tree number.TREECLCD TREE 25 Tree class.TREEGRCD TREE 28 Tree grade.TRTCD1 COND 40 Stand treatment 1.TRTCD2 COND 42 Stand treatment 2.TRTCD3 COND 44 Stand treatment 3.TRTOPCD COND 33 Treatment opportunity class.TRTYR1 COND 41 Treatment year 1.
Column name Table name Location Descriptionin table
70
(Appendix A continued)
(Appendix A continued on next page)
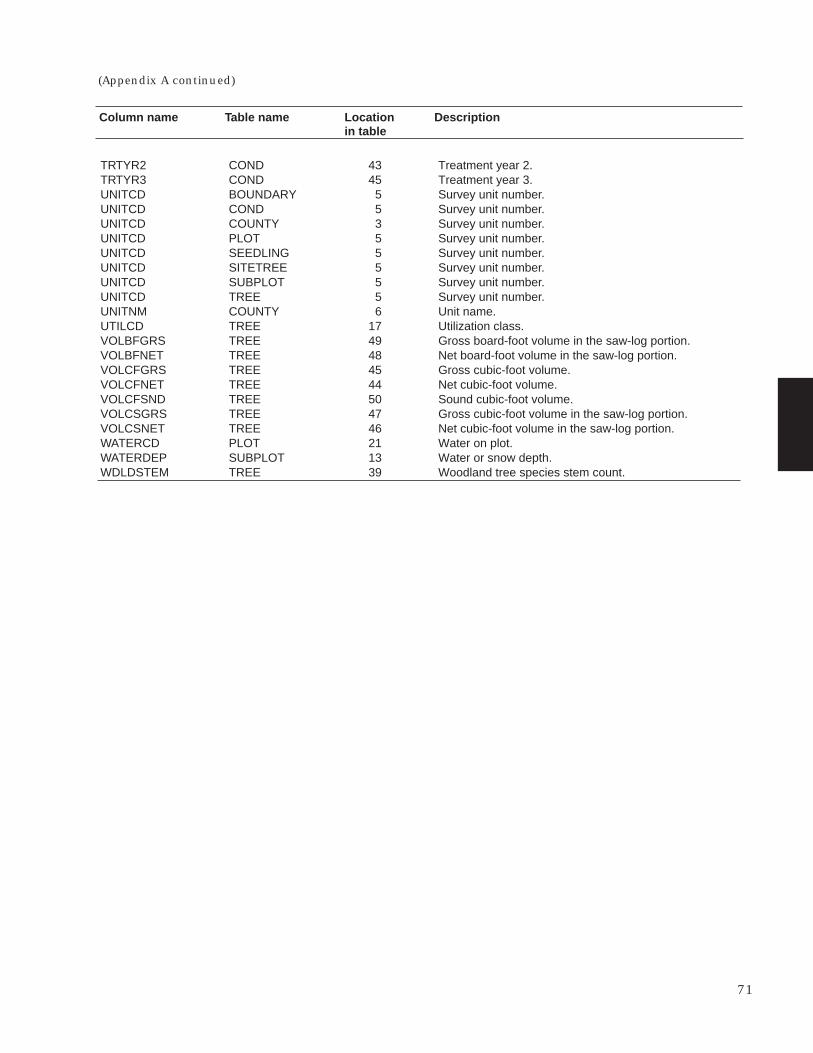
TRTYR2 COND 43 Treatment year 2.TRTYR3 COND 45 Treatment year 3.UNITCD BOUNDARY 5 Survey unit number.UNITCD COND 5 Survey unit number.UNITCD COUNTY 3 Survey unit number.UNITCD PLOT 5 Survey unit number.UNITCD SEEDLING 5 Survey unit number.UNITCD SITETREE 5 Survey unit number.UNITCD SUBPLOT 5 Survey unit number.UNITCD TREE 5 Survey unit number.UNITNM COUNTY 6 Unit name.UTILCD TREE 17 Utilization class.VOLBFGRS TREE 49 Gross board-foot volume in the saw-log portion.VOLBFNET TREE 48 Net board-foot volume in the saw-log portion.VOLCFGRS TREE 45 Gross cubic-foot volume.VOLCFNET TREE 44 Net cubic-foot volume.VOLCFSND TREE 50 Sound cubic-foot volume.VOLCSGRS TREE 47 Gross cubic-foot volume in the saw-log portion.VOLCSNET TREE 46 Net cubic-foot volume in the saw-log portion.WATERCD PLOT 21 Water on plot.WATERDEP SUBPLOT 13 Water or snow depth.WDLDSTEM TREE 39 Woodland tree species stem count.
Column name Table name Location Descriptionin table
71
(Appendix A continued)

72
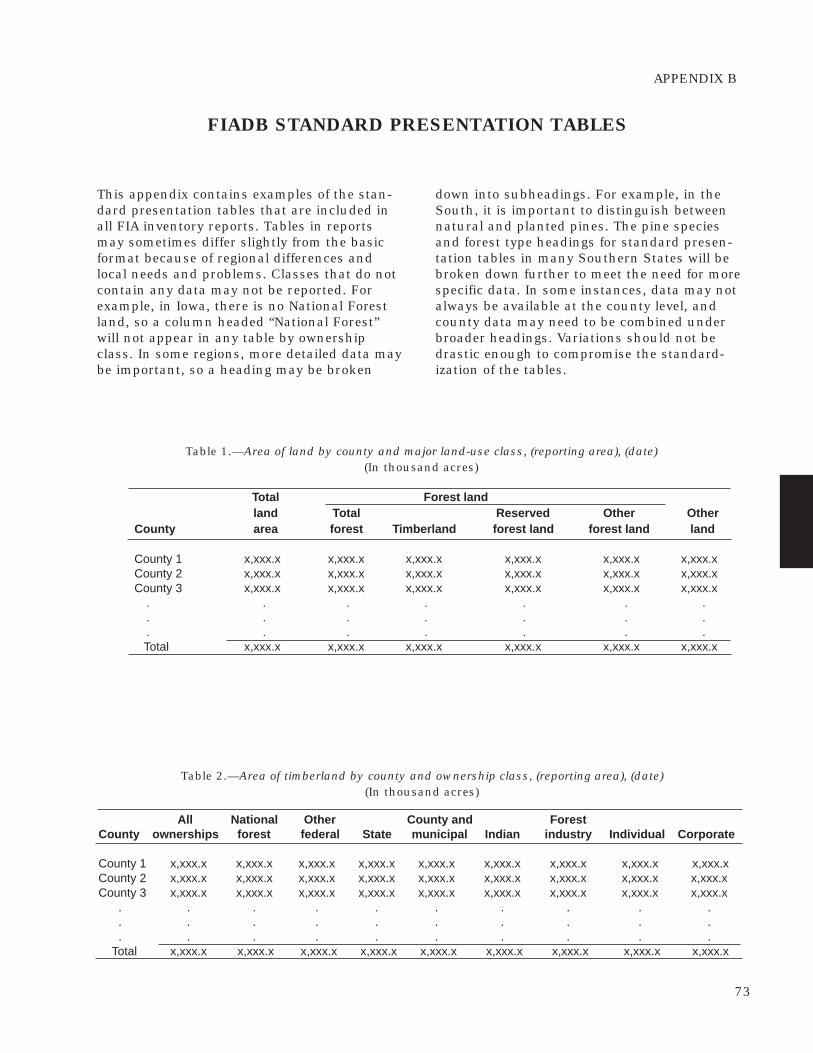
APPENDIX B
FIADB STANDARD PRESENTATION TABLES
This appendix contains examples of the stan-dard presentation tables that are included inall FIA inventory reports. Tables in reportsmay sometimes differ slightly from the basicformat because of regional differences andlocal needs and problems. Classes that do notcontain any data may not be reported. Forexample, in Iowa, there is no National Forestland, so a column headed “National Forest”will not appear in any table by ownershipclass. In some regions, more detailed data maybe important, so a heading may be broken
Table 1.—Area of land by county and major land-use class, (reporting area), (date)(In thousand acres)
Total Forest landland Total Reserved Other Other
County area forest Timberland forest land forest land land
County 1 x,xxx.x x,xxx.x x,xxx.x x,xxx.x x,xxx.x x,xxx.xCounty 2 x,xxx.x x,xxx.x x,xxx.x x,xxx.x x,xxx.x x,xxx.xCounty 3 x,xxx.x x,xxx.x x,xxx.x x,xxx.x x,xxx.x x,xxx.x
. . . . . . .
. . . . . . .
. . . . . . . Total x,xxx.x x,xxx.x x,xxx.x x,xxx.x x,xxx.x x,xxx.x
down into subheadings. For example, in theSouth, it is important to distinguish betweennatural and planted pines. The pine speciesand forest type headings for standard presen-tation tables in many Southern States will bebroken down further to meet the need for morespecific data. In some instances, data may notalways be available at the county level, andcounty data may need to be combined underbroader headings. Variations should not bedrastic enough to compromise the standard-ization of the tables.
Table 2.—Area of timberland by county and ownership class, (reporting area), (date)(In thousand acres)
All National Other County and ForestCounty ownerships forest federal State municipal Indian industry Individual Corporate
County 1 x,xxx.x x,xxx.x x,xxx.x x,xxx.x x,xxx.x x,xxx.x x,xxx.x x,xxx.x x,xxx.xCounty 2 x,xxx.x x,xxx.x x,xxx.x x,xxx.x x,xxx.x x,xxx.x x,xxx.x x,xxx.x x,xxx.xCounty 3 x,xxx.x x,xxx.x x,xxx.x x,xxx.x x,xxx.x x,xxx.x x,xxx.x x,xxx.x x,xxx.x . . . . . . . . . . . . . . . . . . . . . . . . . . . . . . Total x,xxx.x x,xxx.x x,xxx.x x,xxx.x x,xxx.x x,xxx.x x,xxx.x x,xxx.x x,xxx.x
73
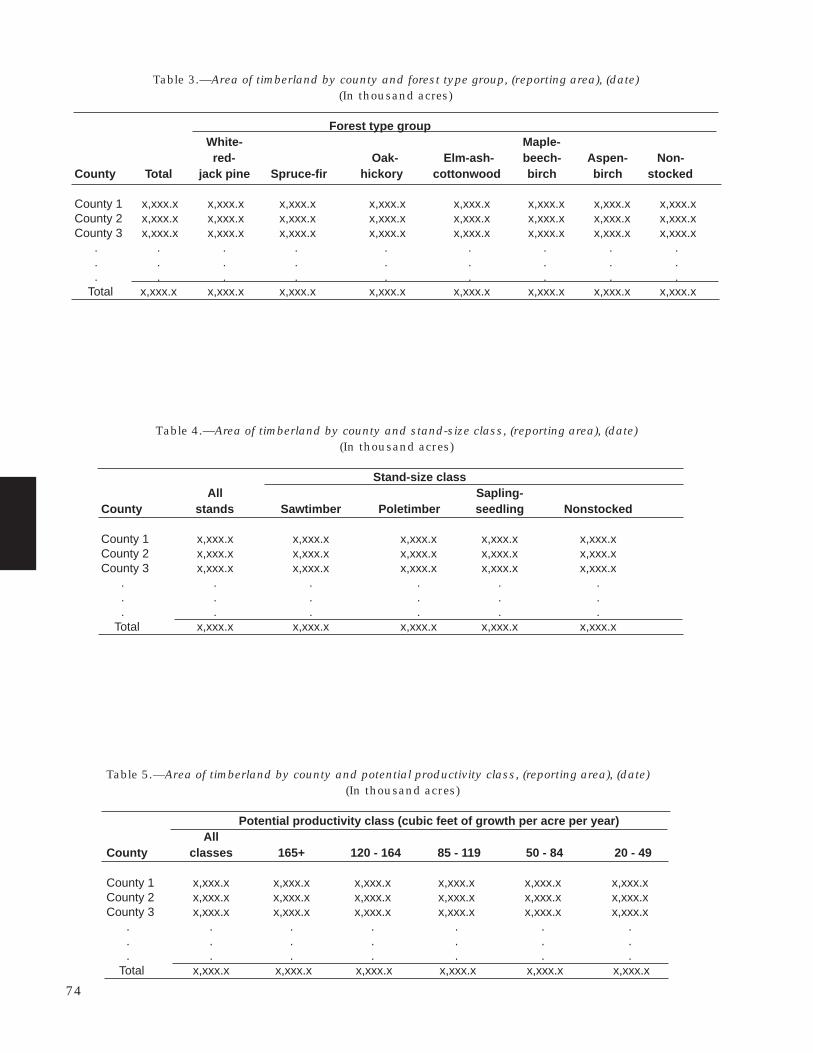
Table 3.—Area of timberland by county and forest type group, (reporting area), (date)(In thousand acres)
Forest type groupWhite- Maple-
red- Oak- Elm-ash- beech- Aspen- Non-County Total jack pine Spruce-fir hickory cottonwood birch birch stocked
County 1 x,xxx.x x,xxx.x x,xxx.x x,xxx.x x,xxx.x x,xxx.x x,xxx.x x,xxx.xCounty 2 x,xxx.x x,xxx.x x,xxx.x x,xxx.x x,xxx.x x,xxx.x x,xxx.x x,xxx.xCounty 3 x,xxx.x x,xxx.x x,xxx.x x,xxx.x x,xxx.x x,xxx.x x,xxx.x x,xxx.x . . . . . . . . . . . . . . . . . . . . . . . . . . . Total x,xxx.x x,xxx.x x,xxx.x x,xxx.x x,xxx.x x,xxx.x x,xxx.x x,xxx.x
Table 4.—Area of timberland by county and stand-size class, (reporting area), (date)(In thousand acres)
Stand-size classAll Sapling-
County stands Sawtimber Poletimber seedling Nonstocked
County 1 x,xxx.x x,xxx.x x,xxx.x x,xxx.x x,xxx.xCounty 2 x,xxx.x x,xxx.x x,xxx.x x,xxx.x x,xxx.xCounty 3 x,xxx.x x,xxx.x x,xxx.x x,xxx.x x,xxx.x . . . . . . . . . . . . . . . . . . Total x,xxx.x x,xxx.x x,xxx.x x,xxx.x x,xxx.x
Table 5.—Area of timberland by county and potential productivity class, (reporting area), (date)(In thousand acres)
Potential productivity class (cubic feet of growth per acre per year)All
County classes 165+ 120 - 164 85 - 119 50 - 84 20 - 49
County 1 x,xxx.x x,xxx.x x,xxx.x x,xxx.x x,xxx.x x,xxx.xCounty 2 x,xxx.x x,xxx.x x,xxx.x x,xxx.x x,xxx.x x,xxx.xCounty 3 x,xxx.x x,xxx.x x,xxx.x x,xxx.x x,xxx.x x,xxx.x . . . . . . . . . . . . . . . . . . . . . Total x,xxx.x x,xxx.x x,xxx.x x,xxx.x x,xxx.x x,xxx.x
74
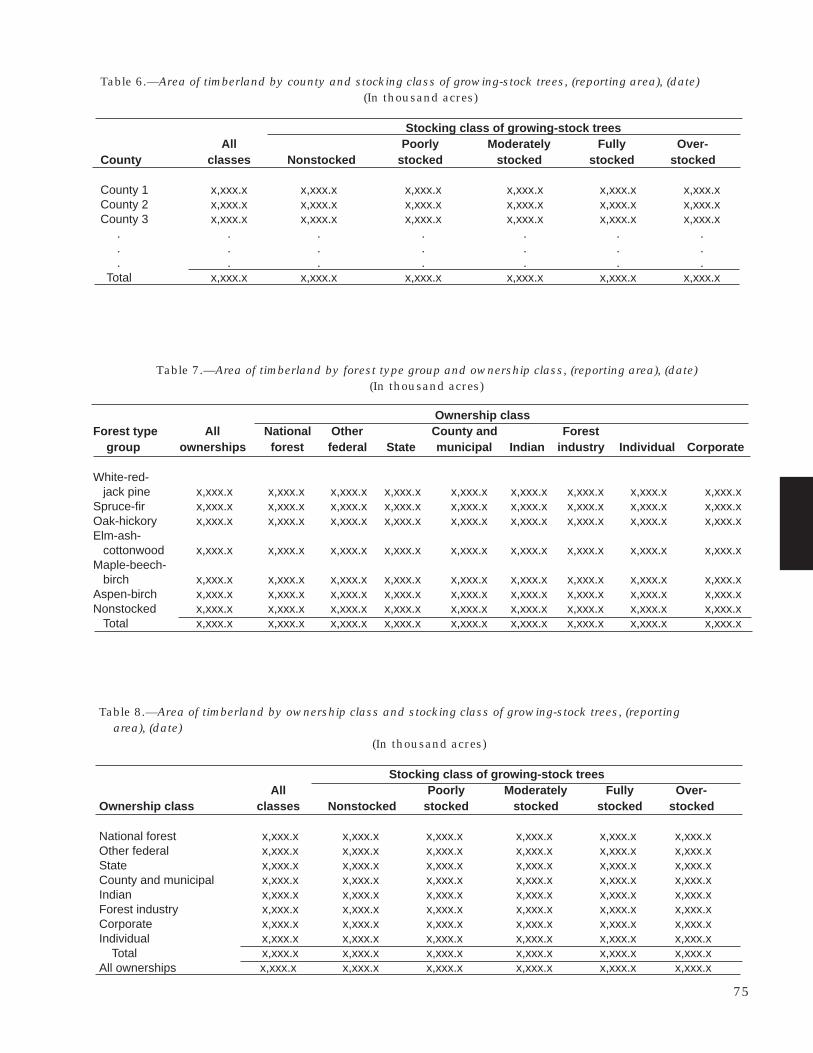
Table 6.—Area of timberland by county and stocking class of growing-stock trees, (reporting area), (date)(In thousand acres)
Stocking class of growing-stock treesAll Poorly Moderately Fully Over-
County classes Nonstocked stocked stocked stocked stocked
County 1 x,xxx.x x,xxx.x x,xxx.x x,xxx.x x,xxx.x x,xxx.xCounty 2 x,xxx.x x,xxx.x x,xxx.x x,xxx.x x,xxx.x x,xxx.xCounty 3 x,xxx.x x,xxx.x x,xxx.x x,xxx.x x,xxx.x x,xxx.x . . . . . . . . . . . . . . . . . . . . . Total x,xxx.x x,xxx.x x,xxx.x x,xxx.x x,xxx.x x,xxx.x
Table 7.—Area of timberland by forest type group and ownership class, (reporting area), (date)(In thousand acres)
Ownership classForest type All National Other County and Forest group ownerships forest federal State municipal Indian industry Individual Corporate
White-red- jack pine x,xxx.x x,xxx.x x,xxx.x x,xxx.x x,xxx.x x,xxx.x x,xxx.x x,xxx.x x,xxx.xSpruce-fir x,xxx.x x,xxx.x x,xxx.x x,xxx.x x,xxx.x x,xxx.x x,xxx.x x,xxx.x x,xxx.xOak-hickory x,xxx.x x,xxx.x x,xxx.x x,xxx.x x,xxx.x x,xxx.x x,xxx.x x,xxx.x x,xxx.xElm-ash- cottonwood x,xxx.x x,xxx.x x,xxx.x x,xxx.x x,xxx.x x,xxx.x x,xxx.x x,xxx.x x,xxx.xMaple-beech- birch x,xxx.x x,xxx.x x,xxx.x x,xxx.x x,xxx.x x,xxx.x x,xxx.x x,xxx.x x,xxx.xAspen-birch x,xxx.x x,xxx.x x,xxx.x x,xxx.x x,xxx.x x,xxx.x x,xxx.x x,xxx.x x,xxx.xNonstocked x,xxx.x x,xxx.x x,xxx.x x,xxx.x x,xxx.x x,xxx.x x,xxx.x x,xxx.x x,xxx.x Total x,xxx.x x,xxx.x x,xxx.x x,xxx.x x,xxx.x x,xxx.x x,xxx.x x,xxx.x x,xxx.x
Table 8.—Area of timberland by ownership class and stocking class of growing-stock trees, (reporting area), (date)
(In thousand acres)
Stocking class of growing-stock treesAll Poorly Moderately Fully Over-
Ownership class classes Nonstocked stocked stocked stocked stocked
National forest x,xxx.x x,xxx.x x,xxx.x x,xxx.x x,xxx.x x,xxx.xOther federal x,xxx.x x,xxx.x x,xxx.x x,xxx.x x,xxx.x x,xxx.xState x,xxx.x x,xxx.x x,xxx.x x,xxx.x x,xxx.x x,xxx.xCounty and municipal x,xxx.x x,xxx.x x,xxx.x x,xxx.x x,xxx.x x,xxx.xIndian x,xxx.x x,xxx.x x,xxx.x x,xxx.x x,xxx.x x,xxx.xForest industry x,xxx.x x,xxx.x x,xxx.x x,xxx.x x,xxx.x x,xxx.xCorporate x,xxx.x x,xxx.x x,xxx.x x,xxx.x x,xxx.x x,xxx.xIndividual x,xxx.x x,xxx.x x,xxx.x x,xxx.x x,xxx.x x,xxx.x Total x,xxx.x x,xxx.x x,xxx.x x,xxx.x x,xxx.x x,xxx.xAll ownerships x,xxx.x x,xxx.x x,xxx.x x,xxx.x x,xxx.x x,xxx.x
75
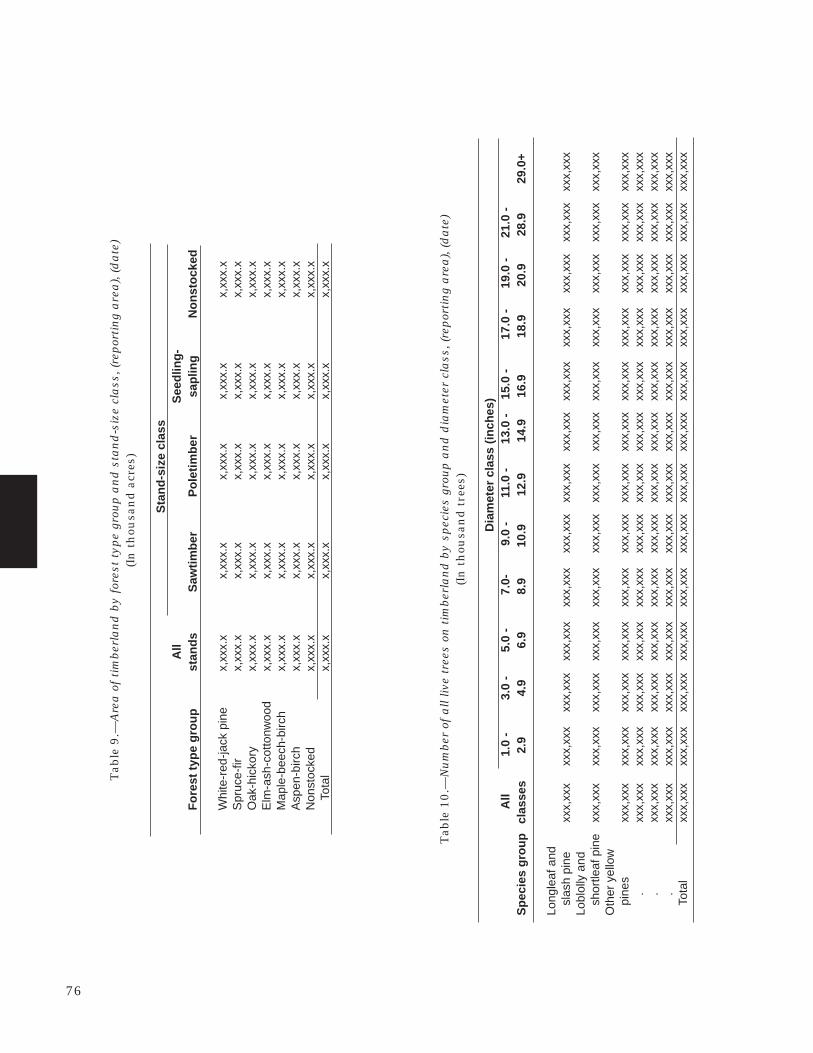
Table
9.—
Are
a o
f ti
mber
lan
d b
y f
ores
t ty
pe
grou
p a
nd
sta
nd
-siz
e cl
ass
, (r
epor
tin
g a
rea
), (d
ate
)(I
n t
hou
san
d a
cres
)
Sta
nd-s
ize
clas
sA
llS
eedl
ing-
For
est t
ype
grou
pst
ands
Saw
timbe
rP
olet
imbe
rsa
plin
gN
onst
ocke
d
Whi
te-r
ed-ja
ck p
ine
x,x
xx.x
x,x
xx.x
x,x
xx.x
x,x
xx.x
x,x
xx.x
Spr
uce-
fir x
,xxx
.x x
,xxx
.x x
,xxx
.x x
,xxx
.x x
,xxx
.xO
ak-h
icko
ry x
,xxx
.x x
,xxx
.x x
,xxx
.x x
,xxx
.x x
,xxx
.xE
lm-a
sh-c
otto
nwoo
d x
,xxx
.x x
,xxx
.x x
,xxx
.x x
,xxx
.x x
,xxx
.xM
aple
-bee
ch-b
irch
x,x
xx.x
x,x
xx.x
x,x
xx.x
x,x
xx.x
x,x
xx.x
Asp
en-b
irch
x,x
xx.x
x,x
xx.x
x,x
xx.x
x,x
xx.x
x,x
xx.x
Non
stoc
ked
x,x
xx.x
x,x
xx.x
x,x
xx.x
x,x
xx.x
x,x
xx.x
To
tal
x,x
xx.x
x,x
xx.x
x,x
xx.x
x,x
xx.x
x,x
xx.x
Table
10.—
Nu
mber
of
all
live
tree
s on
tim
ber
lan
d b
y s
pec
ies
grou
p a
nd
dia
met
er c
lass
, (r
epor
tin
g a
rea
), (d
ate
)(I
n t
hou
san
d t
rees
)
Dia
met
er c
lass
(in
ches
)A
ll1.
0 -
3.0
-5.
0 -
7.0
- 9
.0 -
11.
0 -
13.
0 -
15.
0 -
17.
0 -
19.
0 -
21.
0 -
Spe
cies
gro
upcl
asse
s2.
94.
96.
98.
910
.912
.914
.916
.918
.920
.928
.9
29.0
+
Long
leaf
and
sl
ash
pine
xxx
,xxx
xxx
,xxx
xxx
,xxx
xxx
,xxx
xxx
,xxx
xxx
,xxx
xxx
,xxx
xxx
,xxx
xxx
,xxx
xxx
,xxx
xxx
,xxx
xxx
,xxx
xxx
,xxx
Lobl
olly
and
sh
ortle
af p
ine
xxx
,xxx
xxx
,xxx
xxx
,xxx
xxx
,xxx
xxx
,xxx
xxx
,xxx
xxx
,xxx
xxx
,xxx
xxx
,xxx
xxx
,xxx
xxx
,xxx
xxx
,xxx
xxx
,xxx
Oth
er y
ello
w
pine
s x
xx,x
xx x
xx,x
xx x
xx,x
xx x
xx,x
xx x
xx,x
xx x
xx,x
xx x
xx,x
xx x
xx,x
xx x
xx,x
xx x
xx,x
xx x
xx,x
xx x
xx,x
xx x
xx,x
xx
.
xxx
,xxx
xxx
,xxx
xxx
,xxx
xxx
,xxx
xxx
,xxx
xxx
,xxx
xxx
,xxx
xxx
,xxx
xxx
,xxx
xxx
,xxx
xxx
,xxx
xxx
,xxx
xxx
,xxx
. x
xx,x
xx x
xx,x
xx x
xx,x
xx x
xx,x
xx x
xx,x
xx x
xx,x
xx x
xx,x
xx x
xx,x
xx x
xx,x
xx x
xx,x
xx x
xx,x
xx x
xx,x
xx x
xx,x
xx
.
xxx
,xxx
xxx
,xxx
xxx
,xxx
xxx
,xxx
xxx
,xxx
xxx
,xxx
xxx
,xxx
xxx
,xxx
xxx
,xxx
xxx
,xxx
xxx
,xxx
xxx
,xxx
xxx
,xxx
To
tal
xxx
,xxx
xxx
,xxx
xxx
,xxx
xxx
,xxx
xxx
,xxx
xxx
,xxx
xxx
,xxx
xxx
,xxx
xxx
,xxx
xxx
,xxx
xxx
,xxx
xxx
,xxx
xxx
,xxx
76
Table
11.—
Nu
mber
of
grow
ing-
stoc
k t
rees
on
tim
ber
lan
d b
y s
pec
ies
grou
p a
nd
dia
met
er c
lass
, (r
epor
tin
g a
rea
), (d
ate
)(I
n t
hou
san
d t
rees
)
Dia
met
er c
lass
(in
ches
)S
peci
esA
ll1.
0 -
3.0
-5.
0 -
7.0
- 9
.0 -
11.
0 -
13.
0 -
15.
0 -
17.
0 -
19.
0 -
21.
0 -
gro
upcl
asse
s2.
94.
96.
98.
910
.912
.914
.916
.918
.920
.928
.9
29.0
+
Long
leaf
and
sl
ash
pine
xxx
,xxx
xxx
,xxx
xxx
,xxx
xxx
,xxx
xxx
,xxx
xxx
,xxx
xxx
,xxx
xxx
,xxx
xxx
,xxx
xxx
,xxx
xxx
,xxx
xxx
,xxx
xxx
,xxx
Lobl
olly
and
sh
ortle
af p
ine
xxx
,xxx
xxx
,xxx
xxx
,xxx
xxx
,xxx
xxx
,xxx
xxx
,xxx
xxx
,xxx
xxx
,xxx
xxx
,xxx
xxx
,xxx
xxx
,xxx
xxx
,xxx
xxx
,xxx
Oth
er y
ello
w
pine
s x
xx,x
xx x
xx,x
xx x
xx,x
xx x
xx,x
xx x
xx,x
xx x
xx,x
xx x
xx,x
xx x
xx,x
xx x
xx,x
xx x
xx,x
xx x
xx,x
xx x
xx,x
xx x
xx,x
xx
.
xxx
,xxx
xxx
,xxx
xxx
,xxx
xxx
,xxx
xxx
,xxx
xxx
,xxx
xxx
,xxx
xxx
,xxx
xxx
,xxx
xxx
,xxx
xxx
,xxx
xxx
,xxx
xxx
,xxx
. x
xx,x
xx x
xx,x
xx x
xx,x
xx x
xx,x
xx x
xx,x
xx x
xx,x
xx x
xx,x
xx x
xx,x
xx x
xx,x
xx x
xx,x
xx x
xx,x
xx x
xx,x
xx x
xx,x
xx
.
xxx
,xxx
xxx
,xxx
xxx
,xxx
xxx
,xxx
xxx
,xxx
xxx
,xxx
xxx
,xxx
xxx
,xxx
xxx
,xxx
xxx
,xxx
xxx
,xxx
xxx
,xxx
xxx
,xxx
T
otal
xxx
,xxx
xxx
,xxx
xxx
,xxx
xxx
,xxx
xxx
,xxx
xxx
,xxx
xxx
,xxx
xxx
,xxx
xxx
,xxx
xxx
,xxx
xxx
,xxx
xxx
,xxx
xxx
,xxx
Table
12.—
Mer
cha
nta
ble
vol
um
e of
gro
win
g-st
ock t
rees
on
tim
ber
lan
d b
y s
pec
ies
grou
p a
nd
dia
met
er c
lass
, (r
epor
tin
g a
rea
), (d
ate
)(I
n t
hou
san
d c
ubic
fee
t)
Dia
met
er c
lass
(in
ches
)S
peci
esA
ll5.
0 -
7.0
- 9
.0 -
11.
0 -
13.
0 -
15.
0 -
17.
0 -
19.
0 -
21.
0 -
gro
upcl
asse
s6.
98.
910
.912
.914
.916
.918
.920
.928
.9
29.0
+
Long
leaf
and
sl
ash
pine
xxx
,xxx
xxx
,xxx
xxx
,xxx
xxx
,xxx
xxx
,xxx
xxx
,xxx
xxx
,xxx
xxx
,xxx
xxx
,xxx
xxx
,xxx
xxx
,xxx
Lobl
olly
and
sh
ortle
af p
ine
xxx
,xxx
xxx
,xxx
xxx
,xxx
xxx
,xxx
xxx
,xxx
xxx
,xxx
xxx
,xxx
xxx
,xxx
xxx
,xxx
xxx
,xxx
xxx
,xxx
Oth
er y
ello
w
pine
s x
xx,x
xx x
xx,x
xx x
xx,x
xx x
xx,x
xx x
xx,x
xx x
xx,x
xx x
xx,x
xx x
xx,x
xx x
xx,x
xx x
xx,x
xx x
xx,x
xx
.
xxx
,xxx
xxx
,xxx
xxx
,xxx
xxx
,xxx
xxx
,xxx
xxx
,xxx
xxx
,xxx
xxx
,xxx
xxx
,xxx
xxx
,xxx
xxx
,xxx
. x
xx,x
xx x
xx,x
xx x
xx,x
xx x
xx,x
xx x
xx,x
xx x
xx,x
xx x
xx,x
xx x
xx,x
xx x
xx,x
xx x
xx,x
xx x
xx,x
xx
.
xxx
,xxx
xxx
,xxx
xxx
,xxx
xxx
,xxx
xxx
,xxx
xxx
,xxx
xxx
,xxx
xxx
,xxx
xxx
,xxx
xxx
,xxx
xxx
,xxx
To
tal
xxx
,xxx
xxx
,xxx
xxx
,xxx
xxx
,xxx
xxx
,xxx
xxx
,xxx
xxx
,xxx
xxx
,xxx
xxx
,xxx
xxx
,xxx
xxx
,xxx
77
Table 13.—Merchantable volume in the saw-log portion of growing-stock trees on timberland by species group and diameter class, (reporting area), (date)
(In thousand cubic feet)
Diameter class (inches)All 9.0 - 11.0 - 13.0 - 15.0 - 17.0 - 19.0 - 21.0 -
Species group classes 10.9 12.9 14.9 16.9 18.9 20.9 28.9 29.0+
Longleaf and slash pine xxx,xxx xxx,xxx xxx,xxx xxx,xxx xxx,xxx xxx,xxx xxx,xxx xxx,xxx xxx,xxxLoblolly and shortleaf pine xxx,xxx xxx,xxx xxx,xxx xxx,xxx xxx,xxx xxx,xxx xxx,xxx xxx,xxx xxx,xxxOther yellow pines xxx,xxx xxx,xxx xxx,xxx xxx,xxx xxx,xxx xxx,xxx xxx,xxx xxx,xxx xxx,xxx - xxx,xxx xxx,xxx xxx,xxx xxx,xxx xxx,xxx xxx,xxx xxx,xxx xxx,xxx xxx,xxx - xxx,xxx xxx,xxx xxx,xxx xxx,xxx xxx,xxx xxx,xxx xxx,xxx xxx,xxx xxx,xxx - xxx,xxx xxx,xxx xxx,xxx xxx,xxx xxx,xxx xxx,xxx xxx,xxx xxx,xxx xxx,xxx Total xxx,xxx xxx,xxx xxx,xxx xxx,xxx xxx,xxx xxx,xxx xxx,xxx xxx,xxx xxx,xxx
Table 14.—Merchantable volume of sawtimber trees on timberland by species group and diameter class, (reporting area), (date)
(In thousand board feet)
Diameter class (inches)All 9.0 - 11.0 - 13.0 - 15.0 - 17.0 - 19.0 - 21.0 -
Species group classes 10.9 12.9 14.9 16.9 18.9 20.9 28.9 29.0+
Longleaf and slash pine xxx,xxx xxx,xxx xxx,xxx xxx,xxx xxx,xxx xxx,xxx xxx,xxx xxx,xxx xxx,xxxLoblolly and shortleaf pine xxx,xxx xxx,xxx xxx,xxx xxx,xxx xxx,xxx xxx,xxx xxx,xxx xxx,xxx xxx,xxxOther yellow pines xxx,xxx xxx,xxx xxx,xxx xxx,xxx xxx,xxx xxx,xxx xxx,xxx xxx,xxx xxx,xxx - xxx,xxx xxx,xxx xxx,xxx xxx,xxx xxx,xxx xxx,xxx xxx,xxx xxx,xxx xxx,xxx - xxx,xxx xxx,xxx xxx,xxx xxx,xxx xxx,xxx xxx,xxx xxx,xxx xxx,xxx xxx,xxx - xxx,xxx xxx,xxx xxx,xxx xxx,xxx xxx,xxx xxx,xxx xxx,xxx xxx,xxx xxx,xxx Total xxx,xxx xxx,xxx xxx,xxx xxx,xxx xxx,xxx xxx,xxx xxx,xxx xxx,xxx xxx,xxx
Table 15.—Merchantable volume of growing-stock trees and sawtimber trees on timberland by
county and major species group, (reporting area), (date)
Growing stock (thousand cubic feet) Sawtimber (thousand board fe et) Major species group Major species group
All Other Soft Hard All Other Soft HardCounty species Pine softwoods hardwoods hardwoods species Pine softwoods hardwoods hardwoods
County 1 xxx,xxx xxx,xxx xxx,xxx xxx,xxx xxx,xxx xxx,xxx xxx,xxx xxx,xxx xxx,xxx xxx,xxxCounty 2 xxx,xxx xxx,xxx xxx,xxx xxx,xxx xxx,xxx xxx,xxx xxx,xxx xxx,xxx xxx,xxx xxx,xxxCounty 3 xxx,xxx xxx,xxx xxx,xxx xxx,xxx xxx,xxx xxx,xxx xxx,xxx xxx,xxx xxx,xxx xxx,xxx . . . . . . . . . . . . . . . . . . . . . . . . . . . . . . . . . Total xxx,xxx xxx,xxx xxx,xxx xxx,xxx xxx,xxx xxx,xxx xxx,xxx xxx,xxx xxx,xxx xxx,xxx
78
Table 16.—Merchantable volume of all live and dead trees on timberland by class of timber and major speciesgroup, (reporting area), (date)
(In thousand cubic feet)
Major species groupAll Other Soft Hard
Class of timber species Pine softwoods hardwoods hardwoods
Live trees Growing-stock trees Sawtimber Saw-log portion xxx,xxx xxx,xxx xxx,xxx xxx,xxx xxx,xxx Upper stem portion xxx,xxx xxx,xxx xxx,xxx xxx,xxx xxx,xxx Total xxx,xxx xxx,xxx xxx,xxx xxx,xxx xxx,xxx Poletimber xxx,xxx xxx,xxx xxx,xxx xxx,xxx xxx,xxx All growing-stock trees xxx,xxx xxx,xxx xxx,xxx xxx,xxx xxx,xxxCull trees Rough trees Sawtimber size xxx,xxx xxx,xxx xxx,xxx xxx,xxx xxx,xxx Poletimber size xxx,xxx xxx,xxx xxx,xxx xxx,xxx xxx,xxx Total xxx,xxx xxx,xxx xxx,xxx xxx,xxx xxx,xxx Rotten trees Sawtimber size xxx,xxx xxx,xxx xxx,xxx xxx,xxx xxx,xxx Poletimber size xxx,xxx xxx,xxx xxx,xxx xxx,xxx xxx,xxx Total xxx,xxx xxx,xxx xxx,xxx xxx,xxx xxx,xxx All cull trees xxx,xxx xxx,xxx xxx,xxx xxx,xxx xxx,xxxAll live trees xxx,xxx xxx,xxx xxx,xxx xxx,xxx xxx,xxxSalvable dead trees Sawtimber size xxx,xxx xxx,xxx xxx,xxx xxx,xxx xxx,xxx Poletimber size xxx,xxx xxx,xxx xxx,xxx xxx,xxx xxx,xxx All salvable dead trees xxx,xxx xxx,xxx xxx,xxx xxx,xxx xxx,xxxAll classes of timber xxx,xxx xxx,xxx xxx,xxx xxx,xxx xxx,xxx
79
Table
17.—
Mer
cha
nta
ble
vol
um
e of
all
live
tree
s a
nd
gro
win
g-st
ock t
rees
on
tim
ber
lan
d b
y o
wn
ersh
ip c
lass
a
nd
ma
jor
spec
ies
grou
p, (r
epor
tin
g a
rea
), (d
ate
)(I
n t
hou
san
d c
ubic
fee
t)
A
ll liv
e tr
ees
G
row
ing-
stoc
k tr
ees
M
ajor
spe
cies
gro
up
Maj
or s
peci
es g
roup
Ow
ners
hip
All
O
ther
Sof
tH
ard
All
Oth
erS
oft
Har
d
cla
sssp
ecie
sP
ine
softw
oods
hard
woo
dsha
rdw
oods
spec
ies
Pin
eso
ftwoo
dsha
rdw
oods
hard
woo
ds
Nat
iona
l for
est
xxx
,xxx
xxx
,xxx
xxx
,xxx
xxx
,xxx
xxx
,xxx
xx
x,xx
x x
xx,x
xx x
xx,x
xx x
xx,x
xx x
xx,x
xxO
ther
fede
ral
xxx
,xxx
xxx
,xxx
xxx
,xxx
xxx
,xxx
xxx
,xxx
xx
x,xx
x x
xx,x
xx x
xx,x
xx x
xx,x
xx x
xx,x
xxS
tate
xxx
,xxx
xxx
,xxx
xxx
,xxx
xxx
,xxx
xxx
,xxx
xx
x,xx
x x
xx,x
xx x
xx,x
xx x
xx,x
xx x
xx,x
xxC
ount
y an
d
mun
icip
al x
xx,x
xx x
xx,x
xx x
xx,x
xx x
xx,x
xx x
xx,x
xx
xxx,
xxx
xxx
,xxx
xxx
,xxx
xxx
,xxx
xxx
,xxx
Indi
an x
xx,x
xx x
xx,x
xx x
xx,x
xx x
xx,x
xx x
xx,x
xx
xxx,
xxx
xxx
,xxx
xxx
,xxx
xxx
,xxx
xxx
,xxx
For
est i
ndus
try
xxx
,xxx
xxx
,xxx
xxx
,xxx
xxx
,xxx
xxx
,xxx
xx
x,xx
x x
xx,x
xx x
xx,x
xx x
xx,x
xx x
xx,x
xxC
orpo
rate
xxx
,xxx
xxx
,xxx
xxx
,xxx
xxx
,xxx
xxx
,xxx
xx
x,xx
x x
xx,x
xx x
xx,x
xx x
xx,x
xx x
xx,x
xxIn
divi
dual
xxx
,xxx
xxx
,xxx
xxx
,xxx
xxx
,xxx
xxx
,xxx
xx
x,xx
x x
xx,x
xx x
xx,x
xx x
xx,x
xx x
xx,x
xx
Tota
l x
xx,x
xx x
xx,x
xx x
xx,x
xx x
xx,x
xx x
xx,x
xx
xxx,
xxx
xxx
,xxx
xxx
,xxx
xxx
,xxx
xxx
,xxx
Table
18.—
Mer
cha
nta
ble
vol
um
e of
gro
win
g-st
ock t
rees
on
tim
ber
lan
d b
y fo
rest
type
grou
p a
nd
ma
jor
spec
ies
grou
p,
(rep
orti
ng
are
a), (d
ate
)(I
n t
hou
san
d c
ubic
fee
t)
Maj
or s
peci
es g
roup
All
Oth
er S
oft
Har
dF
ores
t typ
e gr
oup
spec
ies
Pin
e s
oftw
oods
har
dwoo
ds h
ardw
oods
Whi
te-r
ed-ja
ck p
ine
xxx,
xxx
xxx,
xxx
xxx,
xxx
xxx,
xxx
xxx,
xxx
Spr
uce-
firxx
x,xx
xxx
x,xx
xxx
x,xx
xxx
x,xx
xxx
x,xx
xO
ak-h
icko
ryxx
x,xx
xxx
x,xx
xxx
x,xx
xxx
x,xx
xxx
x,xx
xE
lm-a
sh-c
otto
nwoo
dxx
x,xx
xxx
x,xx
xxx
x,xx
xxx
x,xx
xxx
x,xx
xM
aple
-bee
ch-b
irch
xxx,
xxx
xxx,
xxx
xxx,
xxx
xxx,
xxx
xxx,
xxx
Asp
en-b
irch
xxx,
xxx
xxx,
xxx
xxx,
xxx
xxx,
xxx
xxx,
xxx
Non
stoc
ked
xxx,
xxx
xxx,
xxx
xxx,
xxx
xxx,
xxx
xxx,
xxx
To
tal
xxx,
xxx
xxx,
xxx
xxx,
xxx
xxx,
xxx
xxx,
xxx
80
Table
19.—
Net
an
nu
al m
erch
an
table
gro
wth
of
grow
ing-
stoc
k t
rees
an
d s
aw
tim
ber
tre
es o
n t
imb
erla
nd
by
co
un
ty a
nd
ma
jor
spec
ies
grou
p,
(rep
orti
ng
are
a), (d
ate
)
G
row
ing
stoc
k (in
thou
sand
cub
ic fe
et)
S
awtim
ber
(in th
ousa
nd b
oard
feet
)
Spe
cies
gro
up
S
peci
es g
roup
All
Oth
er S
oft
H
ard
All
Oth
erS
oft
Har
dC
ount
ysp
ecie
sP
ine
sof
twoo
ds h
ardw
oods
har
dwoo
dssp
ecie
sP
ine
sof
twoo
ds h
ardw
oods
har
dwoo
ds
Cou
nty
1 x
xx,x
xx x
xx,x
xx x
xx,x
xx x
xx,x
xx x
xx,x
xx x
xx,x
xx x
xx,x
xx x
xx,x
xx x
xx,x
xx x
xx,x
xxC
ount
y 2
xxx
,xxx
xxx
,xxx
xxx
,xxx
xxx
,xxx
xxx
,xxx
xxx
,xxx
xxx
,xxx
xxx
,xxx
xxx
,xxx
xxx
,xxx
Cou
nty
3 x
xx,x
xx x
xx,x
xx x
xx,x
xx x
xx,x
xx x
xx,x
xx x
xx,x
xx x
xx,x
xx x
xx,x
xx x
xx,x
xx x
xx,x
xx
. x
xx,x
xx x
xx,x
xx x
xx,x
xx x
xx,x
xx x
xx,x
xx x
xx,x
xx x
xx,x
xx x
xx,x
xx x
xx,x
xx x
xx,x
xx
. x
xx,x
xx x
xx,x
xx x
xx,x
xx x
xx,x
xx x
xx,x
xx x
xx,x
xx x
xx,x
xx x
xx,x
xx x
xx,x
xx x
xx,x
xx
. x
xx,x
xx x
xx,x
xx x
xx,x
xx x
xx,x
xx x
xx,x
xx x
xx,x
xx x
xx,x
xx x
xx,x
xx x
xx,x
xx x
xx,x
xx
Tota
l x
xx,x
xx x
xx,x
xx x
xx,x
xx x
xx,x
xx x
xx,x
xx x
xx,x
xx x
xx,x
xx x
xx,x
xx x
xx,x
xx x
xx,x
xx
Table
20.—
An
nu
al m
erch
an
table
rem
ova
ls o
f gr
owin
g-st
ock t
rees
an
d s
aw
tim
ber
tre
es o
n t
imb
erla
nd
by
cou
nty
a
nd
ma
jor
spec
ies
grou
p, (r
epor
tin
g a
rea
), (d
ate
)
G
row
ing
stoc
k (t
hous
and
cubi
c fe
et)
S
awtim
ber
(tho
usan
d bo
ard
feet
)
Maj
or s
peci
es g
roup
M
ajor
spe
cies
gro
up A
ll
Oth
er
Sof
t
Har
dA
llO
ther
S
oft
H
ard
Cou
nty
spec
ies
Pin
e s
oftw
oods
har
dwoo
ds h
ardw
oods
spec
ies
Pin
e s
oftw
oods
har
dwoo
ds h
ardw
oods
Cou
nty
1 x
xx,x
xx x
xx,x
xx x
xx,x
xx x
xx,x
xx x
xx,x
xxxx
x,xx
x x
xx,x
xx x
xx,x
xx x
xx,x
xx x
xx,x
xxC
ount
y 2
xxx
,xxx
xxx
,xxx
xxx
,xxx
xxx
,xxx
xxx
,xxx
xxx
,xxx
xxx
,xxx
xxx
,xxx
xxx
,xxx
xxx
,xxx
Cou
nty
3 x
xx,x
xx x
xx,x
xx x
xx,x
xx x
xx,x
xx x
xx,x
xx x
xx,x
xx x
xx,x
xx x
xx,x
xx x
xx,x
xx x
xx,x
xx
. x
xx,x
xx x
xx,x
xx x
xx,x
xx x
xx,x
xx x
xx,x
xx x
xx,x
xx x
xx,x
xx x
xx,x
xx x
xx,x
xx x
xx,x
xx
. x
xx,x
xx x
xx,x
xx x
xx,x
xx x
xx,x
xx x
xx,x
xx x
xx,x
xx x
xx,x
xx x
xx,x
xx x
xx,x
xx x
xx,x
xx
. x
xx,x
xx x
xx,x
xx x
xx,x
xx x
xx,x
xx x
xx,x
xx x
xx,x
xx x
xx,x
xx x
xx,x
xx x
xx,x
xx x
xx,x
xx
Tota
l x
xx,x
xx x
xx,x
xx x
xx,x
xx x
xx,x
xx x
xx,x
xx x
xx,x
xx x
xx,x
xx x
xx,x
xx x
xx,x
xx x
xx,x
xx
81
Table 21.—Net annual merchantable growth and annual merchantable removals of growing-stock trees
and sawtimber trees on timberland by species group, (reporting area), (date)
Growing stock Sawtimber(thousand cubic feet) (thousand board feet)
Average net Average annual Average net Average annualSpecies group annual growth removals annual growth removals
Longleaf and slash pine xxx,xxx xxx,xxx xxx,xxx xxx,xxxLoblolly and shortleaf pine xxx,xxx xxx,xxx xxx,xxx xxx,xxxOther yellow pines xxx,xxx xxx,xxx xxx,xxx xxx,xxx . xxx,xxx xxx,xxx xxx,xxx xxx,xxx . xxx,xxx xxx,xxx xxx,xxx xxx,xxx . xxx,xxx xxx,xxx xxx,xxx xxx,xxx Total xxx,xxx xxx,xxx xxx,xxx xxx,xxx
Table 22.—Annual merchantable mortality of growing-stock trees and
sawtimber trees on timberland by species group, (reporting area), (date)
Growing stock SawtimberSpecies group (Thousand cubic feet) (Thousand board feet)
Longleaf and slash pine xxx,xxx xxx,xxxLoblolly and shortleaf pine xxx,xxx xxx,xxxOther yellow pines xxx,xxx xxx,xxx . xxx,xxx xxx,xxx . xxx,xxx xxx,xxx . xxx,xxx xxx,xxx Total xxx,xxx xxx,xxx
82
Table
23.—
Net
an
nu
al m
erch
an
table
gro
wth
an
d a
nn
ua
l m
erch
an
table
rem
ova
ls o
f gr
owin
g-st
ock
tre
es o
n ti
mber
lan
d b
y o
wn
ersh
ip c
lass
an
d m
ajo
r sp
ecie
s gr
oup,
(rep
orti
ng
are
a), (d
ate
)
G
row
th
Rem
oval
s
Maj
or s
peci
es g
roup
M
ajor
spe
cies
gro
upO
wne
rshi
pA
ll O
ther
Sof
t H
ard
All
Oth
er S
oft
Har
d
cla
sssp
ecie
sP
ine
softw
oods
hard
woo
dsha
rdw
oods
spec
ies
Pin
eso
ftwoo
dsha
rdw
oods
hard
woo
ds
Nat
iona
l for
est
xxx
,xxx
xxx
,xxx
xxx
,xxx
xxx
,xxx
xxx
,xxx
xxx,
xxx
xxx
,xxx
xxx
,xxx
xxx
,xxx
xxx
,xxx
Oth
er fe
dera
l x
xx,x
xx x
xx,x
xx x
xx,x
xx x
xx,x
xx x
xx,x
xxxx
x,xx
x x
xx,x
xx x
xx,x
xx x
xx,x
xx x
xx,x
xxS
tate
xxx
,xxx
xxx
,xxx
xxx
,xxx
xxx
,xxx
xxx
,xxx
xxx,
xxx
xxx
,xxx
xxx
,xxx
xxx
,xxx
xxx
,xxx
Cou
nty
and
m
unic
ipal
xxx
,xxx
xxx
,xxx
xxx
,xxx
xxx
,xxx
xxx
,xxx
xxx,
xxx
xxx
,xxx
xxx
,xxx
xxx
,xxx
xxx
,xxx
Indi
an x
xx,x
xx x
xx,x
xx x
xx,x
xx x
xx,x
xx x
xx,x
xxxx
x,xx
x x
xx,x
xx x
xx,x
xx x
xx,x
xx x
xx,x
xxF
ores
t ind
ustr
y x
xx,x
xx x
xx,x
xx x
xx,x
xx x
xx,x
xx x
xx,x
xxxx
x,xx
x x
xx,x
xx x
xx,x
xx x
xx,x
xx x
xx,x
xxIn
divi
dual
xxx
,xxx
xxx
,xxx
xxx
,xxx
xxx
,xxx
xxx
,xxx
xxx,
xxx
xxx
,xxx
xxx
,xxx
xxx
,xxx
xxx
,xxx
Cor
pora
te x
xx,x
xx x
xx,x
xx x
xx,x
xx x
xx,x
xx x
xx,x
xxxx
x,xx
x x
xx,x
xx x
xx,x
xx x
xx,x
xx x
xx,x
xx A
ll ow
ners
hips
xxx
,xxx
xxx
,xxx
xxx
,xxx
xxx
,xxx
xxx
,xxx
xxx,
xxx
xxx
,xxx
xxx
,xxx
xxx
,xxx
xxx
,xxx
Table
24.—
Net
an
nu
al m
erch
an
table
gro
wth
an
d a
nn
ua
l m
erch
an
table
rem
ova
ls o
f sa
wti
mb
er t
rees
on
ti
mber
lan
d b
y o
wn
ersh
ip c
lass
an
d m
ajo
r sp
ecie
s gr
oup,
(rep
orti
ng
are
a), (d
ate
)
G
row
th
Rem
oval
s
Maj
or s
peci
es g
roup
Maj
or s
peci
es g
roup
Ow
ners
hip
All
Oth
er S
oft
Har
dA
ll O
ther
Sof
t H
ard
c
lass
spec
ies
Pin
eso
ftwoo
dsha
rdw
oods
hard
woo
dssp
ecie
sP
ine
softw
oods
hard
woo
dsha
rdw
oods
Nat
iona
l for
est
xxx
,xxx
xxx
,xxx
xxx
,xxx
xxx
,xxx
xxx
,xxx
xxx,
xxx
xxx
,xxx
xxx
,xxx
xxx
,xxx
xxx
,xxx
Oth
er fe
dera
l x
xx,x
xx x
xx,x
xx x
xx,x
xx x
xx,x
xx x
xx,x
xx x
xx,x
xx x
xx,x
xx x
xx,x
xx x
xx,x
xx x
xx,x
xxS
tate
xxx
,xxx
xxx
,xxx
xxx
,xxx
xxx
,xxx
xxx
,xxx
xxx,
xxx
xxx
,xxx
xxx
,xxx
xxx
,xxx
xxx
,xxx
Cou
nty
and
m
unic
ipal
xxx
,xxx
xxx
,xxx
xxx
,xxx
xxx
,xxx
xxx
,xxx
xxx,
xxx
xxx
,xxx
xxx
,xxx
xxx
,xxx
xxx
,xxx
Indi
an x
xx,x
xx x
xx,x
xx x
xx,x
xx x
xx,x
xx x
xx,x
xxxx
x,xx
x x
xx,x
xx x
xx,x
xx x
xx,x
xx x
xx,x
xxF
ores
t ind
ustr
y x
xx,x
xx x
xx,x
xx x
xx,x
xx x
xx,x
xx x
xx,x
xxxx
x,xx
x x
xx,x
xx x
xx,x
xx x
xx,x
xx x
xx,x
xxIn
divi
dual
xxx
,xxx
xxx
,xxx
xxx
,xxx
xxx
,xxx
xxx
,xxx
xxx,
xxx
xxx
,xxx
xxx
,xxx
xxx
,xxx
xxx
,xxx
Cor
pora
te x
xx,x
xx x
xx,x
xx x
xx,x
xx x
xx,x
xx x
xx,x
xxxx
x,xx
x x
xx,x
xx x
xx,x
xx x
xx,x
xx x
xx,x
xx A
ll ow
ners
hips
xxx
,xxx
xxx
,xxx
xxx
,xxx
xxx
,xxx
xxx
,xxx
xxx,
xxx
xxx
,xxx
xxx
,xxx
xxx
,xxx
xxx
,xxx
83
Table
25.—
Tot
al gr
oss
bio
ma
ss o
ven
dry
wei
ght
for
live
tree
s on
tim
ber
lan
d b
y s
pec
ies
grou
p a
nd
dia
met
er c
lass
, (r
epor
tin
g a
rea
), (d
ate
)(In
th
ousa
nd p
oun
ds)
␣
All
1.0
-3.
0 -
5.0
- 7
.0 -
9.0
- 1
1.0
- 1
3.0
- 1
5.0
- 1
7.0
- 1
9.0
- 2
1.0
-S
peci
es g
roup
clas
ses
2.9
4.9
6.9
8.9
10.9
12.9
14.9
16.9
18.9
20.9
28.9
29
.0+
Long
leaf
and
sl
ash
pine
xxx
,xxx
xxx
,xxx
xxx
,xxx
xxx
,xxx
xxx
,xxx
xxx
,xxx
xxx
,xxx
xxx
,xxx
xxx
,xxx
xxx
,xxx
xxx
,xxx
xxx
,xxx
xxx
,xxx
Lobl
olly
and
sh
ortle
af p
ine
xxx
,xxx
xxx
,xxx
xxx
,xxx
xxx
,xxx
xxx
,xxx
xxx
,xxx
xxx
,xxx
xxx
,xxx
xxx
,xxx
xxx
,xxx
xxx
,xxx
xxx
,xxx
xxx
,xxx
Oth
er y
ello
w p
ines
xxx
,xxx
xxx
,xxx
xxx
,xxx
xxx
,xxx
xxx
,xxx
xxx
,xxx
xxx
,xxx
xxx
,xxx
xxx
,xxx
xxx
,xxx
xxx
,xxx
xxx
,xxx
xxx
,xxx
.
xxx
,xxx
xxx
,xxx
xxx
,xxx
xxx
,xxx
xxx
,xxx
xxx
,xxx
xxx
,xxx
xxx
,xxx
xxx
,xxx
xxx
,xxx
xxx
,xxx
xxx
,xxx
xxx
,xxx
.
xxx
,xxx
xxx
,xxx
xxx
,xxx
xxx
,xxx
xxx
,xxx
xxx
,xxx
xxx
,xxx
xxx
,xxx
xxx
,xxx
xxx
,xxx
xxx
,xxx
xxx
,xxx
xxx
,xxx
.
xxx
,xxx
xxx
,xxx
xxx
,xxx
xxx
,xxx
xxx
,xxx
xxx
,xxx
xxx
,xxx
xxx
,xxx
xxx
,xxx
xxx
,xxx
xxx
,xxx
xxx
,xxx
xxx
,xxx
To
tal
xxx
,xxx
xxx
,xxx
xxx
,xxx
xxx
,xxx
xxx
,xxx
xxx
,xxx
xxx
,xxx
xxx
,xxx
xxx
,xxx
xxx
,xxx
xxx
,xxx
xxx
,xxx
xxx
,xxx
84
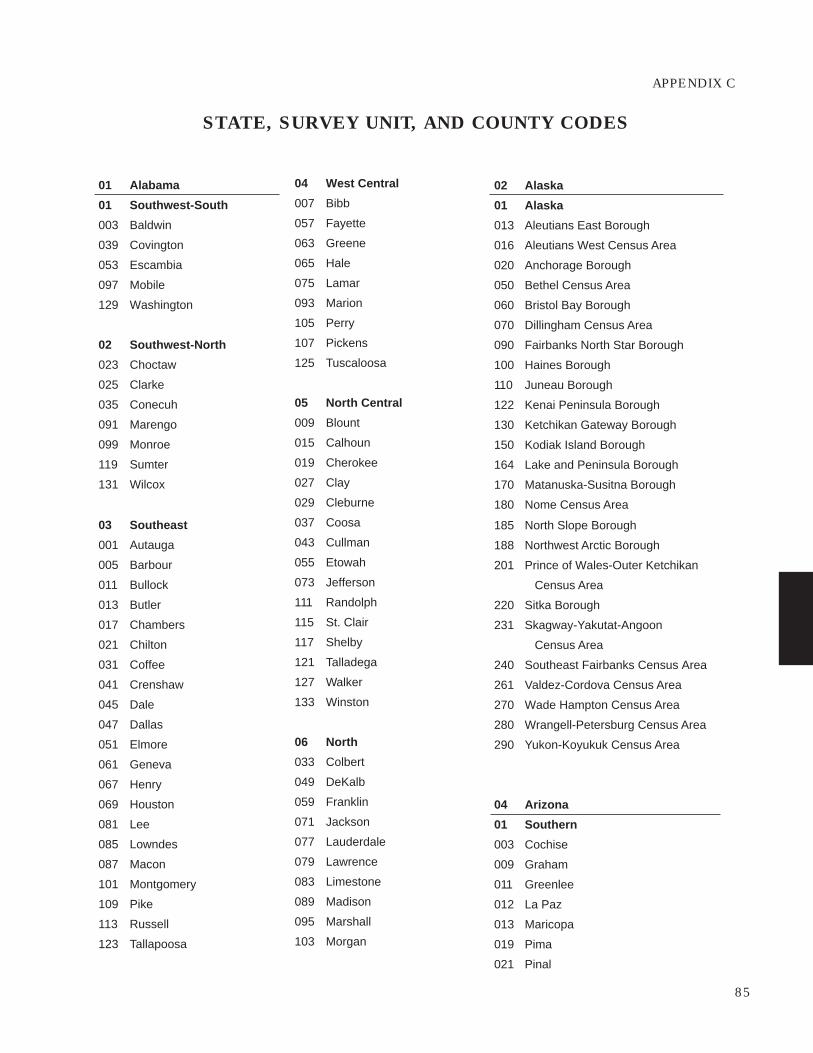
APPENDIX C
STATE, SURVEY UNIT, AND COUNTY CODES
01 Alabama
01 Southwest-South
003 Baldwin
039 Covington
053 Escambia
097 Mobile
129 Washington
02 Southwest-North
023 Choctaw
025 Clarke
035 Conecuh
091 Marengo
099 Monroe
119 Sumter
131 Wilcox
03 Southeast
001 Autauga
005 Barbour
011 Bullock
013 Butler
017 Chambers
021 Chilton
031 Coffee
041 Crenshaw
045 Dale
047 Dallas
051 Elmore
061 Geneva
067 Henry
069 Houston
081 Lee
085 Lowndes
087 Macon
101 Montgomery
109 Pike
113 Russell
123 Tallapoosa
04 West Central
007 Bibb
057 Fayette
063 Greene
065 Hale
075 Lamar
093 Marion
105 Perry
107 Pickens
125 Tuscaloosa
05 North Central
009 Blount
015 Calhoun
019 Cherokee
027 Clay
029 Cleburne
037 Coosa
043 Cullman
055 Etowah
073 Jefferson
111 Randolph
115 St. Clair
117 Shelby
121 Talladega
127 Walker
133 Winston
06 North
033 Colbert
049 DeKalb
059 Franklin
071 Jackson
077 Lauderdale
079 Lawrence
083 Limestone
089 Madison
095 Marshall
103 Morgan
02 Alaska
01 Alaska
013 Aleutians East Borough
016 Aleutians West Census Area
020 Anchorage Borough
050 Bethel Census Area
060 Bristol Bay Borough
070 Dillingham Census Area
090 Fairbanks North Star Borough
100 Haines Borough
110 Juneau Borough
122 Kenai Peninsula Borough
130 Ketchikan Gateway Borough
150 Kodiak Island Borough
164 Lake and Peninsula Borough
170 Matanuska-Susitna Borough
180 Nome Census Area
185 North Slope Borough
188 Northwest Arctic Borough
201 Prince of Wales-Outer Ketchikan
Census Area
220 Sitka Borough
231 Skagway-Yakutat-Angoon
Census Area
240 Southeast Fairbanks Census Area
261 Valdez-Cordova Census Area
270 Wade Hampton Census Area
280 Wrangell-Petersburg Census Area
290 Yukon-Koyukuk Census Area
04 Arizona
01 Southern
003 Cochise
009 Graham
011 Greenlee
012 La Paz
013 Maricopa
019 Pima
021 Pinal
85
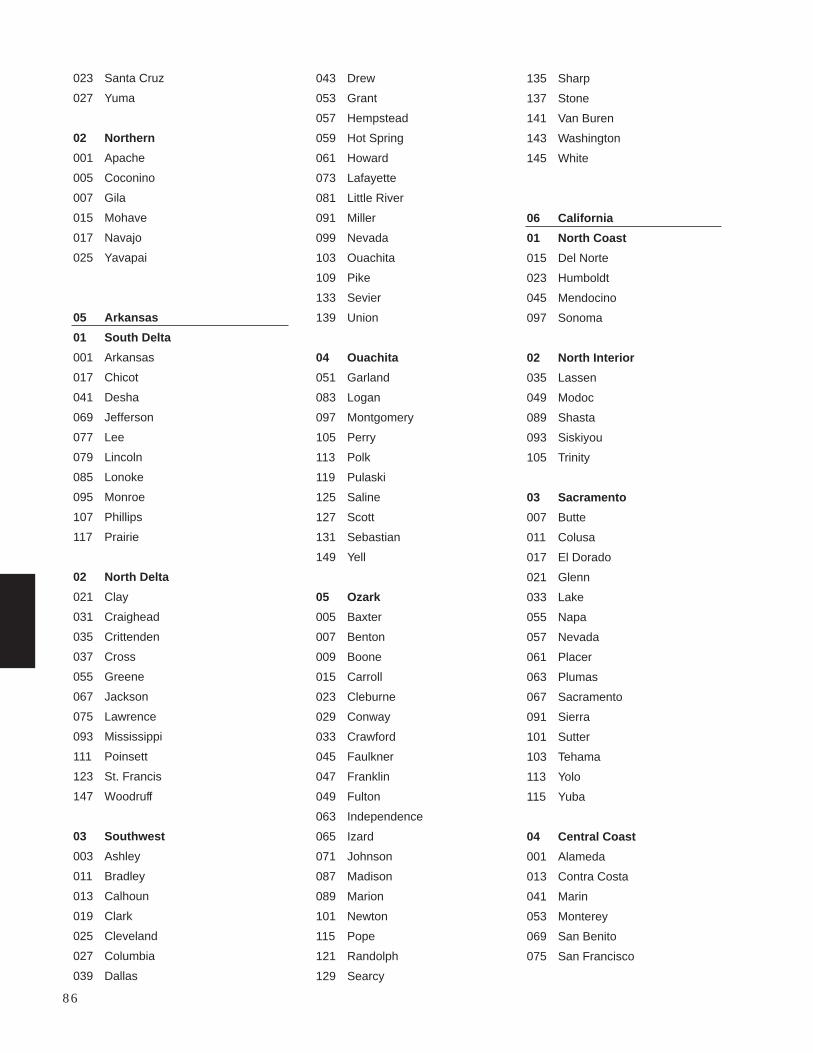
023 Santa Cruz
027 Yuma
02 Northern
001 Apache
005 Coconino
007 Gila
015 Mohave
017 Navajo
025 Yavapai
05 Arkansas
01 South Delta
001 Arkansas
017 Chicot
041 Desha
069 Jefferson
077 Lee
079 Lincoln
085 Lonoke
095 Monroe
107 Phillips
117 Prairie
02 North Delta
021 Clay
031 Craighead
035 Crittenden
037 Cross
055 Greene
067 Jackson
075 Lawrence
093 Mississippi
111 Poinsett
123 St. Francis
147 Woodruff
03 Southwest
003 Ashley
011 Bradley
013 Calhoun
019 Clark
025 Cleveland
027 Columbia
039 Dallas
043 Drew
053 Grant
057 Hempstead
059 Hot Spring
061 Howard
073 Lafayette
081 Little River
091 Miller
099 Nevada
103 Ouachita
109 Pike
133 Sevier
139 Union
04 Ouachita
051 Garland
083 Logan
097 Montgomery
105 Perry
113 Polk
119 Pulaski
125 Saline
127 Scott
131 Sebastian
149 Yell
05 Ozark
005 Baxter
007 Benton
009 Boone
015 Carroll
023 Cleburne
029 Conway
033 Crawford
045 Faulkner
047 Franklin
049 Fulton
063 Independence
065 Izard
071 Johnson
087 Madison
089 Marion
101 Newton
115 Pope
121 Randolph
129 Searcy
135 Sharp
137 Stone
141 Van Buren
143 Washington
145 White
06 California
01 North Coast
015 Del Norte
023 Humboldt
045 Mendocino
097 Sonoma
02 North Interior
035 Lassen
049 Modoc
089 Shasta
093 Siskiyou
105 Trinity
03 Sacramento
007 Butte
011 Colusa
017 El Dorado
021 Glenn
033 Lake
055 Napa
057 Nevada
061 Placer
063 Plumas
067 Sacramento
091 Sierra
101 Sutter
103 Tehama
113 Yolo
115 Yuba
04 Central Coast
001 Alameda
013 Contra Costa
041 Marin
053 Monterey
069 San Benito
075 San Francisco
86
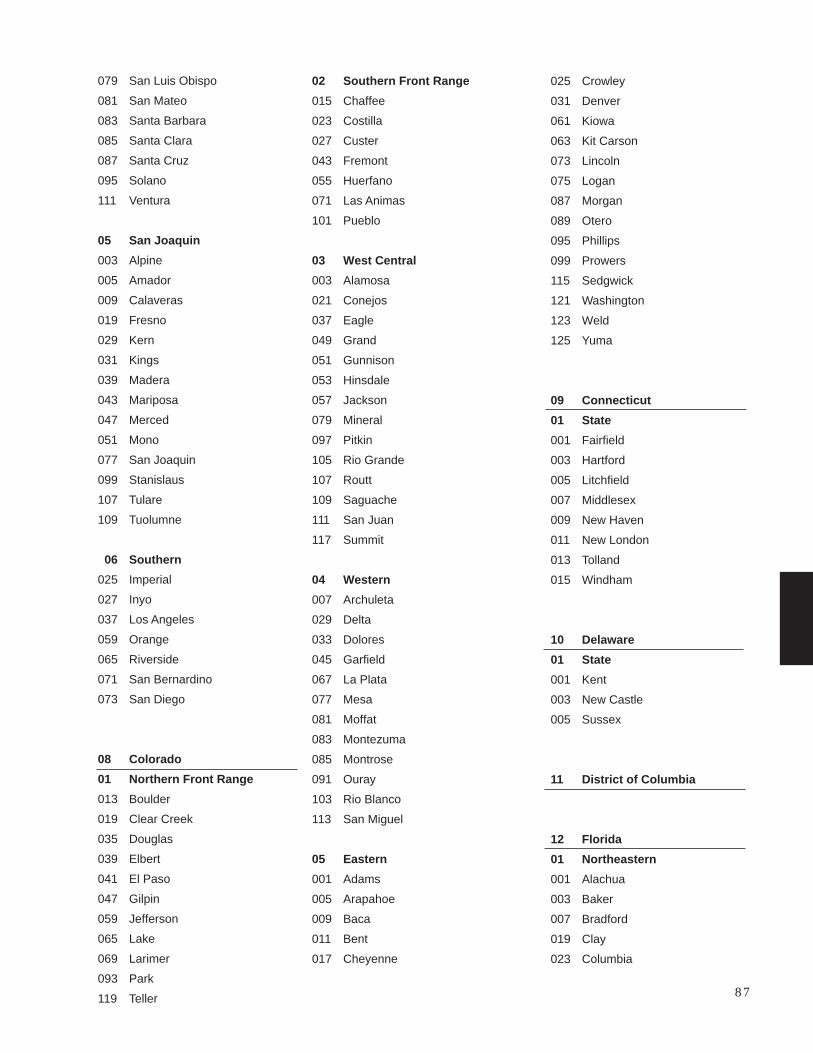
079 San Luis Obispo
081 San Mateo
083 Santa Barbara
085 Santa Clara
087 Santa Cruz
095 Solano
111 Ventura
05 San Joaquin
003 Alpine
005 Amador
009 Calaveras
019 Fresno
029 Kern
031 Kings
039 Madera
043 Mariposa
047 Merced
051 Mono
077 San Joaquin
099 Stanislaus
107 Tulare
109 Tuolumne
06 Southern
025 Imperial
027 Inyo
037 Los Angeles
059 Orange
065 Riverside
071 San Bernardino
073 San Diego
08 Colorado
01 Northern Front Range
013 Boulder
019 Clear Creek
035 Douglas
039 Elbert
041 El Paso
047 Gilpin
059 Jefferson
065 Lake
069 Larimer
093 Park
119 Teller
02 Southern Front Range
015 Chaffee
023 Costilla
027 Custer
043 Fremont
055 Huerfano
071 Las Animas
101 Pueblo
03 West Central
003 Alamosa
021 Conejos
037 Eagle
049 Grand
051 Gunnison
053 Hinsdale
057 Jackson
079 Mineral
097 Pitkin
105 Rio Grande
107 Routt
109 Saguache
111 San Juan
117 Summit
04 Western
007 Archuleta
029 Delta
033 Dolores
045 Garfield
067 La Plata
077 Mesa
081 Moffat
083 Montezuma
085 Montrose
091 Ouray
103 Rio Blanco
113 San Miguel
05 Eastern
001 Adams
005 Arapahoe
009 Baca
011 Bent
017 Cheyenne
025 Crowley
031 Denver
061 Kiowa
063 Kit Carson
073 Lincoln
075 Logan
087 Morgan
089 Otero
095 Phillips
099 Prowers
115 Sedgwick
121 Washington
123 Weld
125 Yuma
09 Connecticut
01 State
001 Fairfield
003 Hartford
005 Litchfield
007 Middlesex
009 New Haven
011 New London
013 Tolland
015 Windham
10 Delaware
01 State
001 Kent
003 New Castle
005 Sussex
11 District of Columbia
12 Florida
01 Northeastern
001 Alachua
003 Baker
007 Bradford
019 Clay
023 Columbia
87

029 Dixie
031 Duval
035 Flagler
041 Gilchrist
047 Hamilton
067 Lafayette
075 Levy
079 Madison
083 Marion
089 Nassau
107 Putnam
109 St. Johns
121 Suwannee
123 Taylor
125 Union
127 Volusia
02 Northwestern
005 Bay
013 Calhoun
033 Escambia
037 Franklin
039 Gadsden
045 Gulf
059 Holmes
063 Jackson
065 Jefferson
073 Leon
077 Liberty
091 Okaloosa
113 Santa Rosa
129 Wakulla
131 Walton
133 Washington
03 Central
009 Brevard
017 Citrus
027 DeSoto
049 Hardee
053 Hernando
055 Highlands
057 Hillsborough
061 Indian River
069 Lake
081 Manatee
093 Okeechobee
095 Orange
097 Osceola
101 Pasco
103 Pinellas
105 Polk
111 St. Lucie
115 Sarasota
117 Seminole
119 Sumter
04 Southern
011 Broward
015 Charlotte
021 Collier
025 Dade
043 Glades
051 Hendry
071 Lee
085 Martin
087 Monroe
099 Palm Beach
13 Georgia
01 Southeastern
001 Appling
003 Atkinson
005 Bacon
025 Brantley
029 Bryan
031 Bulloch
039 Camden
043 Candler
049 Charlton
051 Chatham
065 Clinch
069 Coffee
091 Dodge
101 Echols
103 Effingham
107 Emanuel
109 Evans
127 Glynn
161 Jeff Davis
165 Jenkins
167 Johnson
175 Laurens
179 Liberty
183 Long
191 McIntosh
209 Montgomery
229 Pierce
251 Screven
267 Tattnall
271 Telfair
279 Toombs
283 Treutlen
299 Ware
305 Wayne
309 Wheeler
02 Southwestern
007 Baker
017 Ben Hill
019 Berrien
027 Brooks
071 Colquitt
075 Cook
081 Crisp
087 Decatur
093 Dooly
099 Early
131 Grady
155 Irwin
173 Lanier
185 Lowndes
201 Miller
205 Mitchell
253 Seminole
275 Thomas
277 Tift
287 Turner
315 Wilcox
321 Worth
88
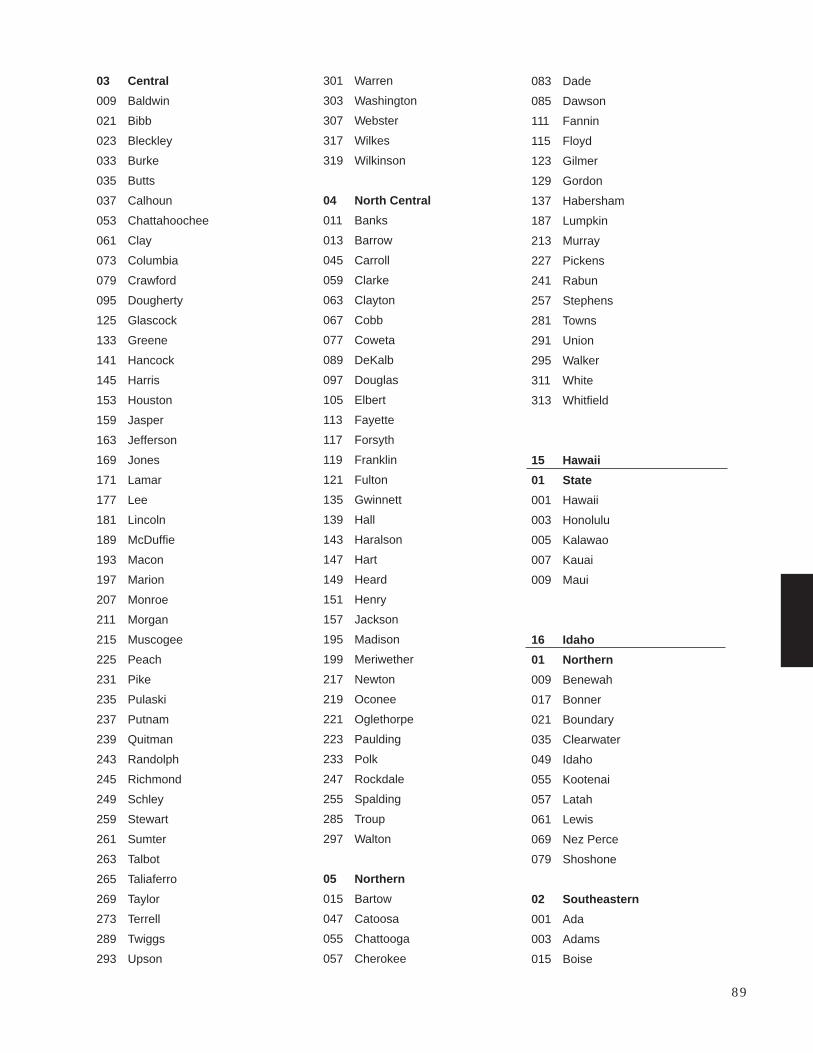
301 Warren
303 Washington
307 Webster
317 Wilkes
319 Wilkinson
04 North Central
011 Banks
013 Barrow
045 Carroll
059 Clarke
063 Clayton
067 Cobb
077 Coweta
089 DeKalb
097 Douglas
105 Elbert
113 Fayette
117 Forsyth
119 Franklin
121 Fulton
135 Gwinnett
139 Hall
143 Haralson
147 Hart
149 Heard
151 Henry
157 Jackson
195 Madison
199 Meriwether
217 Newton
219 Oconee
221 Oglethorpe
223 Paulding
233 Polk
247 Rockdale
255 Spalding
285 Troup
297 Walton
05 Northern
015 Bartow
047 Catoosa
055 Chattooga
057 Cherokee
03 Central
009 Baldwin
021 Bibb
023 Bleckley
033 Burke
035 Butts
037 Calhoun
053 Chattahoochee
061 Clay
073 Columbia
079 Crawford
095 Dougherty
125 Glascock
133 Greene
141 Hancock
145 Harris
153 Houston
159 Jasper
163 Jefferson
169 Jones
171 Lamar
177 Lee
181 Lincoln
189 McDuffie
193 Macon
197 Marion
207 Monroe
211 Morgan
215 Muscogee
225 Peach
231 Pike
235 Pulaski
237 Putnam
239 Quitman
243 Randolph
245 Richmond
249 Schley
259 Stewart
261 Sumter
263 Talbot
265 Taliaferro
269 Taylor
273 Terrell
289 Twiggs
293 Upson
083 Dade
085 Dawson
111 Fannin
115 Floyd
123 Gilmer
129 Gordon
137 Habersham
187 Lumpkin
213 Murray
227 Pickens
241 Rabun
257 Stephens
281 Towns
291 Union
295 Walker
311 White
313 Whitfield
15 Hawaii
01 State
001 Hawaii
003 Honolulu
005 Kalawao
007 Kauai
009 Maui
16 Idaho
01 Northern
009 Benewah
017 Bonner
021 Boundary
035 Clearwater
049 Idaho
055 Kootenai
057 Latah
061 Lewis
069 Nez Perce
079 Shoshone
02 Southeastern
001 Ada
003 Adams
015 Boise
89

029 Coles
031 Cook
037 DeKalb
039 De Witt
041 Douglas
043 DuPage
045 Edgar
053 Ford
057 Fulton
063 Grundy
067 Hancock
071 Henderson
073 Henry
075 Iroquois
085 Jo Daviess
089 Kane
091 Kankakee
093 Kendall
095 Knox
097 Lake
099 La Salle
103 Lee
105 Livingston
107 Logan
109 McDonough
111 McHenry
113 McLean
115 Macon
123 Marshall
125 Mason
129 Menard
131 Mercer
137 Morgan
139 Moultrie
141 Ogle
143 Peoria
147 Piatt
149 Pike
155 Putnam
161 Rock Island
167 Sangamon
169 Schuyler
171 Scott
175 Stark
177 Stephenson
027 Canyon
039 Elmore
045 Gem
073 Owyhee
075 Payette
085 Valley
087 Washington
03 Southwestern
005 Bannock
007 Bear Lake
011 Bingham
013 Blaine
019 Bonneville
023 Butte
025 Camas
029 Caribou
031 Cassia
033 Clark
037 Custer
041 Franklin
043 Fremont
047 Gooding
051 Jefferson
053 Jerome
059 Lemhi
063 Lincoln
065 Madison
067 Minidoka
071 Oneida
077 Power
081 Teton
083 Twin Falls
17 Illinois
01 Southern
003 Alexander
055 Franklin
059 Gallatin
065 Hamilton
069 Hardin
077 Jackson
087 Johnson
127 Massac
145 Perry
151 Pope
153 Pulaski
157 Randolph
165 Saline
181 Union
193 White
199 Williamson
02 Claypan
005 Bond
013 Calhoun
023 Clark
025 Clay
027 Clinton
033 Crawford
035 Cumberland
047 Edwards
049 Effingham
051 Fayette
061 Greene
079 Jasper
081 Jefferson
083 Jersey
101 Lawrence
117 Macoupin
119 Madison
121 Marion
133 Monroe
135 Montgomery
159 Richland
163 St. Clair
173 Shelby
185 Wabash
189 Washington
191 Wayne
03 Prairie
001 Adams
007 Boone
009 Brown
011 Bureau
015 Carroll
017 Cass
019 Champaign
021 Christian90
179 Tazewell
183 Vermilion
187 Warren
195 Whiteside
197 Will
201 Winnebago
203 Woodford
18 Indiana
01 Lower Wabash
021 Clay
027 Daviess
051 Gibson
055 Greene
083 Knox
101 Martin
121 Parke
125 Pike
129 Posey
133 Putnam
153 Sullivan
163 Vanderburgh
165 Vermillion
167 Vigo
02 Knobs
013 Brown
019 Clark
025 Crawford
037 Dubois
043 Floyd
061 Harrison
071 Jackson
093 Lawrence
105 Monroe
109 Morgan
117 Orange
119 Owen
123 Perry
143 Scott
147 Spencer
173 Warrick
175 Washington
03 Upland Flats
029 Dearborn
041 Fayette
047 Franklin
077 Jefferson
079 Jennings
115 Ohio
137 Ripley
155 Switzerland
161 Union
04 Northern
001 Adams
003 Allen
005 Bartholomew
007 Benton
009 Blackford
011 Boone
015 Carroll
017 Cass
023 Clinton
031 Decatur
033 De Kalb
035 Delaware
039 Elkhart
045 Fountain
049 Fulton
053 Grant
057 Hamilton
059 Hancock
063 Hendricks
065 Henry
067 Howard
069 Huntington
073 Jasper
075 Jay
081 Johnson
085 Kosciusko
087 Lagrange
089 Lake
091 La Porte
095 Madison
097 Marion
099 Marshall
103 Miami
107 Montgomery
111 Newton
113 Noble
127 Porter
131 Pulaski
135 Randolph
139 Rush
141 St. Joseph
145 Shelby
149 Starke
151 Steuben
157 Tippecanoe
159 Tipton
169 Wabash
171 Warren
177 Wayne
179 Wells
181 White
183 Whitley
19 Iowa
01 Northeastern
005 Allamakee
011 Benton
013 Black Hawk
017 Bremer
019 Buchanan
023 Butler
031 Cedar
037 Chickasaw
043 Clayton
045 Clinton
055 Delaware
061 Dubuque
065 Fayette
067 Floyd
075 Grundy
089 Howard
097 Jackson
103 Johnson
105 Jones
113 Linn
131 Mitchell
163 Scott
171 Tama
191 Winneshiek91

02 Southeastern
007 Appanoose
015 Boone
039 Clarke
049 Dallas
051 Davis
053 Decatur
057 Des Moines
077 Guthrie
079 Hamilton
083 Hardin
087 Henry
095 Iowa
099 Jasper
101 Jefferson
107 Keokuk
111 Lee
115 Louisa
117 Lucas
121 Madison
123 Mahaska
125 Marion
127 Marshall
135 Monroe
139 Muscatine
153 Polk
157 Poweshiek
169 Story
177 Van Buren
179 Wapello
181 Warren
183 Washington
185 Wayne
187 Webster
03 Southwestern
001 Adair
003 Adams
009 Audubon
027 Carroll
029 Cass
047 Crawford
071 Fremont
073 Greene
085 Harrison
129 Mills
133 Monona
137 Montgomery
145 Page
155 Pottawattamie
159 Ringgold
165 Shelby
173 Taylor
175 Union
193 Woodbury
04 Northwestern
021 Buena Vista
025 Calhoun
033 Cerro Gordo
035 Cherokee
041 Clay
059 Dickinson
063 Emmet
069 Franklin
081 Hancock
091 Humboldt
093 Ida
109 Kossuth
119 Lyon
141 O’Brien
143 Osceola
147 Palo Alto
149 Plymouth
151 Pocahontas
161 Sac
167 Sioux
189 Winnebago
195 Worth
197 Wright
20 Kansas
01 Northeastern
005 Atchison
013 Brown
027 Clay
041 Dickinson
043 Doniphan
045 Douglas
059 Franklin
061 Geary
085 Jackson
087 Jefferson
091 Johnson
103 Leavenworth
117 Marshall
121 Miami
131 Nemaha
139 Osage
149 Pottawatomie
161 Riley
177 Shawnee
197 Wabaunsee
201 Washington
209 Wyandotte
02 Southeastern
001 Allen
003 Anderson
011 Bourbon
015 Butler
017 Chase
019 Chautauqua
021 Cherokee
031 Coffey
035 Cowley
037 Crawford
049 Elk
073 Greenwood
099 Labette
107 Linn
111 Lyon
115 Marion
125 Montgomery
127 Morris
133 Neosho
205 Wilson
207 Woodson
03 Western
007 Barber
009 Barton
023 Cheyenne
025 Clark
029 Cloud
033 Comanche92
039 Decatur
047 Edwards
051 Ellis
053 Ellsworth
055 Finney
057 Ford
063 Gove
065 Graham
067 Grant
069 Gray
071 Greeley
075 Hamilton
077 Harper
079 Harvey
081 Haskell
083 Hodgeman
089 Jewell
093 Kearny
095 Kingman
097 Kiowa
101 Lane
105 Lincoln
109 Logan
113 McPherson
119 Meade
123 Mitchell
129 Morton
135 Ness
137 Norton
141 Osborne
143 Ottawa
145 Pawnee
147 Phillips
151 Pratt
153 Rawlins
155 Reno
157 Republic
159 Rice
163 Rooks
165 Rush
167 Russell
169 Saline
171 Scott
173 Sedgwick
175 Seward
179 Sheridan
181 Sherman
183 Smith
185 Stafford
187 Stanton
189 Stevens
191 Sumner
193 Thomas
195 Trego
199 Wallace
203 Wichita
21 Kentucky
01 Eastern
071 Floyd
095 Harlan
119 Knott
131 Leslie
133 Letcher
159 Martin
193 Perry
195 Pike
02 Northern Cumberland
019 Boyd
043 Carter
063 Elliott
089 Greenup
115 Johnson
127 Lawrence
135 Lewis
153 Magoffin
165 Menifee
175 Morgan
197 Powell
205 Rowan
237 Wolfe
03 Southern Cumberland
013 Bell
025 Breathitt
051 Clay
065 Estill
109 Jackson
121 Knox
125 Laurel
129 Lee
147 McCreary
189 Owsley
203 Rockcastle
235 Whitley
04 Bluegrass
005 Anderson
011 Bath
015 Boone
017 Bourbon
021 Boyle
023 Bracken
037 Campbell
041 Carroll
049 Clark
067 Fayette
069 Fleming
073 Franklin
077 Gallatin
079 Garrard
081 Grant
097 Harrison
103 Henry
111 Jefferson
113 Jessamine
117 Kenton
137 Lincoln
151 Madison
161 Mason
167 Mercer
173 Montgomery
181 Nicholas
185 Oldham
187 Owen
191 Pendleton
201 Robertson
209 Scott
211 Shelby
215 Spencer
223 Trimble
229 Washington
239 Woodford
93

05 Pennyroyal
001 Adair
027 Breckinridge
029 Bullitt
045 Casey
053 Clinton
057 Cumberland
085 Grayson
087 Green
091 Hancock
093 Hardin
099 Hart
123 Larue
155 Marion
163 Meade
169 Metcalfe
179 Nelson
199 Pulaski
207 Russell
217 Taylor
231 Wayne
06 Western Coalfield
003 Allen
009 Barren
031 Butler
033 Caldwell
047 Christian
055 Crittenden
059 Daviess
061 Edmonson
101 Henderson
107 Hopkins
141 Logan
149 McLean
171 Monroe
177 Muhlenberg
183 Ohio
213 Simpson
219 Todd
225 Union
227 Warren
233 Webster
07 Western
007 Ballard
035 Calloway
039 Carlisle
075 Fulton
083 Graves
105 Hickman
139 Livingston
143 Lyon
145 McCracken
157 Marshall
221 Trigg
22 Louisiana
01 North Delta
025 Catahoula
029 Concordia
035 East Carroll
041 Franklin
065 Madison
067 Morehouse
083 Richland
107 Tensas
123 West Carroll
02 South Delta
001 Acadia
005 Ascension
007 Assumption
009 Avoyelles
045 Iberia
047 Iberville
055 Lafayette
057 Lafourche
077 Pointe Coupee
089 St. Charles
093 St. James
095 St. John the Baptist
097 St. Landry
099 St. Martin
101 St. Mary
109 Terrebonne
113 Vermilion
121 West Baton Rouge
125 West Feliciana
03 Southwest
003 Allen
011 Beauregard
019 Calcasieu
039 Evangeline
043 Grant
053 Jefferson Davis
059 La Salle
069 Natchitoches
079 Rapides
085 Sabine
115 Vernon
04 Southeast
033 East Baton Rouge
037 East Feliciana
063 Livingston
091 St. Helena
103 St. Tammany
105 Tangipahoa
117 Washington
05 Northwest
013 Bienville
015 Bossier
017 Caddo
021 Caldwell
027 Claiborne
031 De Soto
049 Jackson
061 Lincoln
073 Ouachita
081 Red River
111 Union
119 Webster
127 Winn
Unsampled parishes
023 Cameron
051 Jefferson
071 Orleans
075 Plaquemines
087 St. Bernard
94
23 Maine
01 Washington
029 Washington
02 Aroostook
003 Aroostook
03 Penobscot
019 Penobscot
04 Hancock
009 Hancock
05 Piscataquis
021 Piscataquis
06 Capitol Region
011 Kennebec
013 Knox
015 Lincoln
027 Waldo
07 Somerset
025 Somerset
08 Casco Bay
001 Androscoggin
005 Cumberland
023 Sagadahoc
031 York
09 Western Maine
007 Franklin
017 Oxford
24 Maryland
02 North Central
003 Anne Arundel
005 Baltimore
011 Caroline
013 Carroll
015 Cecil
021 Frederick
025 Harford
027 Howard
029 Kent
031 Montgomery
033 Prince George’s
035 Queen Anne’s
041 Talbot
043 Washington
510 Baltimore city
03 Southern
009 Calvert
017 Charles
037 St. Mary’s
04 Lower Eastern Shore
019 Dorchester
039 Somerset
045 Wicomico
047 Worcester
05 Western
001 Allegany
023 Garrett
25 Massachusetts
01 State
001 Barnstable
003 Berkshire
005 Bristol
007 Dukes
009 Essex
011 Franklin
013 Hampden
015 Hampshire
017 Middlesex
019 Nantucket
021 Norfolk
023 Plymouth
025 Suffolk
027 Worcester
26 Michigan
01 Eastern Upper Peninsula
003 Alger
033 Chippewa
041 Delta
095 Luce
097 Mackinac
109 Menominee
153 Schoolcraft
02 Western Upper Peninsula
013 Baraga
043 Dickinson
053 Gogebic
061 Houghton
071 Iron
083 Keweenaw
103 Marquette
131 Ontonagon
03 Northern Lower Peninsula
001 Alcona
007 Alpena
009 Antrim
011 Arenac
017 Bay
019 Benzie
029 Charlevoix
031 Cheboygan
035 Clare
039 Crawford
047 Emmet
051 Gladwin
055 Grand Traverse
069 Iosco
073 Isabella
079 Kalkaska
085 Lake
089 Leelanau
101 Manistee
105 Mason
107 Mecosta
111 Midland
113 Missaukee
119 Montmorency
123 Newaygo
127 Oceana
129 Ogemaw
133 Osceola
135 Oscoda95
137 Otsego
141 Presque Isle
143 Roscommon
165 Wexford
04 Southern Lower Peninsula
005 Allegan
015 Barry
021 Berrien
023 Branch
025 Calhoun
027 Cass
037 Clinton
045 Eaton
049 Genesee
057 Gratiot
059 Hillsdale
063 Huron
065 Ingham
067 Ionia
075 Jackson
077 Kalamazoo
081 Kent
087 Lapeer
091 Lenawee
093 Livingston
099 Macomb
115 Monroe
117 Montcalm
121 Muskegon
125 Oakland
139 Ottawa
145 Saginaw
147 St. Clair
149 St. Joseph
151 Sanilac
155 Shiawassee
157 Tuscola
159 Van Buren
161 Washtenaw
163 Wayne
27 Minnesota
01 Aspen-Birch
017 Carlton
031 Cook
071 Koochiching
075 Lake
137 St. Louis
02 Northern Pine
001 Aitkin
005 Becker
007 Beltrami
021 Cass
029 Clearwater
035 Crow Wing
057 Hubbard
061 Itasca
077 Lake of the Woods
087 Mahnomen
135 Roseau
159 Wadena
03 Central Hardwood
003 Anoka
009 Benton
019 Carver
025 Chisago
037 Dakota
041 Douglas
045 Fillmore
049 Goodhue
053 Hennepin
055 Houston
059 Isanti
065 Kanabec
079 Le Sueur
095 Mille Lacs
097 Morrison
109 Olmsted
111 Otter Tail
115 Pine
123 Ramsey
131 Rice
139 Scott
141 Sherburne
145 Stearns
153 Todd
157 Wabasha
163 Washington
169 Winona
171 Wright
04 Prairie
011 Big Stone
013 Blue Earth
015 Brown
023 Chippewa
027 Clay
033 Cottonwood
039 Dodge
043 Faribault
047 Freeborn
051 Grant
063 Jackson
067 Kandiyohi
069 Kittson
073 Lac qui Parle
081 Lincoln
083 Lyon
085 McLeod
089 Marshall
091 Martin
093 Meeker
099 Mower
101 Murray
103 Nicollet
105 Nobles
107 Norman
113 Pennington
117 Pipestone
119 Polk
121 Pope
125 Red Lake
127 Redwood
129 Renville
133 Rock
143 Sibley
147 Steele
149 Stevens
96
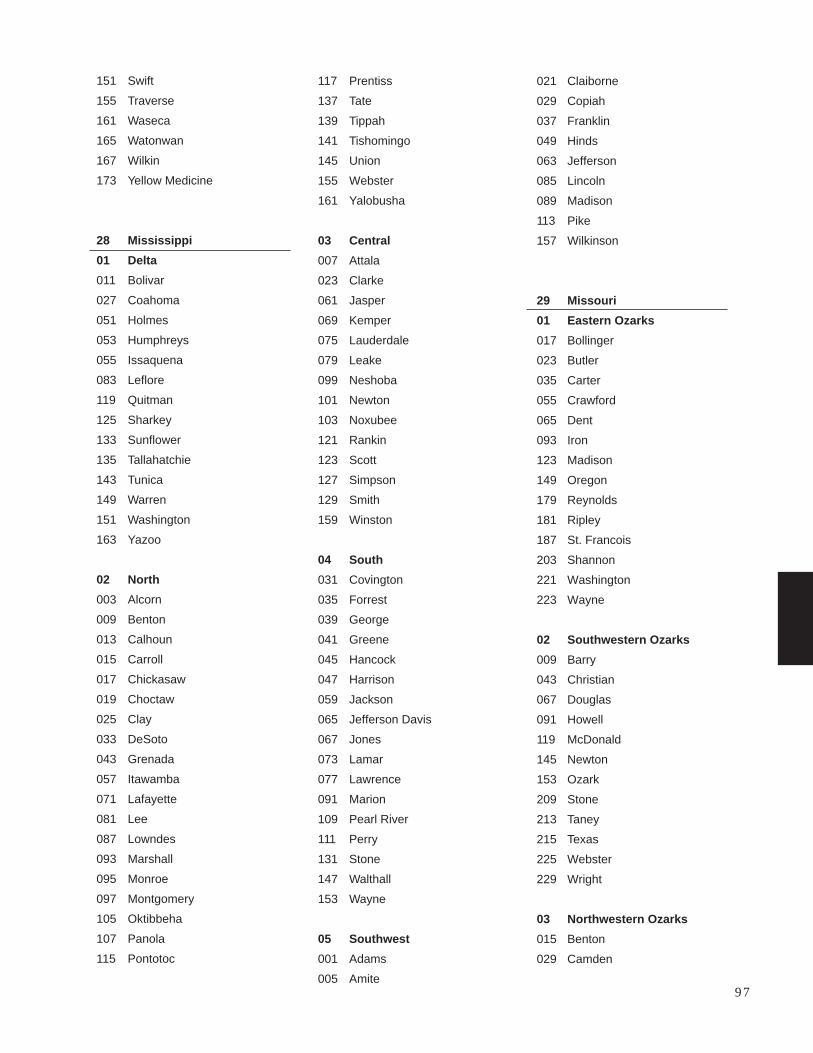
151 Swift
155 Traverse
161 Waseca
165 Watonwan
167 Wilkin
173 Yellow Medicine
28 Mississippi
01 Delta
011 Bolivar
027 Coahoma
051 Holmes
053 Humphreys
055 Issaquena
083 Leflore
119 Quitman
125 Sharkey
133 Sunflower
135 Tallahatchie
143 Tunica
149 Warren
151 Washington
163 Yazoo
02 North
003 Alcorn
009 Benton
013 Calhoun
015 Carroll
017 Chickasaw
019 Choctaw
025 Clay
033 DeSoto
043 Grenada
057 Itawamba
071 Lafayette
081 Lee
087 Lowndes
093 Marshall
095 Monroe
097 Montgomery
105 Oktibbeha
107 Panola
115 Pontotoc
117 Prentiss
137 Tate
139 Tippah
141 Tishomingo
145 Union
155 Webster
161 Yalobusha
03 Central
007 Attala
023 Clarke
061 Jasper
069 Kemper
075 Lauderdale
079 Leake
099 Neshoba
101 Newton
103 Noxubee
121 Rankin
123 Scott
127 Simpson
129 Smith
159 Winston
04 South
031 Covington
035 Forrest
039 George
041 Greene
045 Hancock
047 Harrison
059 Jackson
065 Jefferson Davis
067 Jones
073 Lamar
077 Lawrence
091 Marion
109 Pearl River
111 Perry
131 Stone
147 Walthall
153 Wayne
05 Southwest
001 Adams
005 Amite
021 Claiborne
029 Copiah
037 Franklin
049 Hinds
063 Jefferson
085 Lincoln
089 Madison
113 Pike
157 Wilkinson
29 Missouri
01 Eastern Ozarks
017 Bollinger
023 Butler
035 Carter
055 Crawford
065 Dent
093 Iron
123 Madison
149 Oregon
179 Reynolds
181 Ripley
187 St. Francois
203 Shannon
221 Washington
223 Wayne
02 Southwestern Ozarks
009 Barry
043 Christian
067 Douglas
091 Howell
119 McDonald
145 Newton
153 Ozark
209 Stone
213 Taney
215 Texas
225 Webster
229 Wright
03 Northwestern Ozarks
015 Benton
029 Camden
97
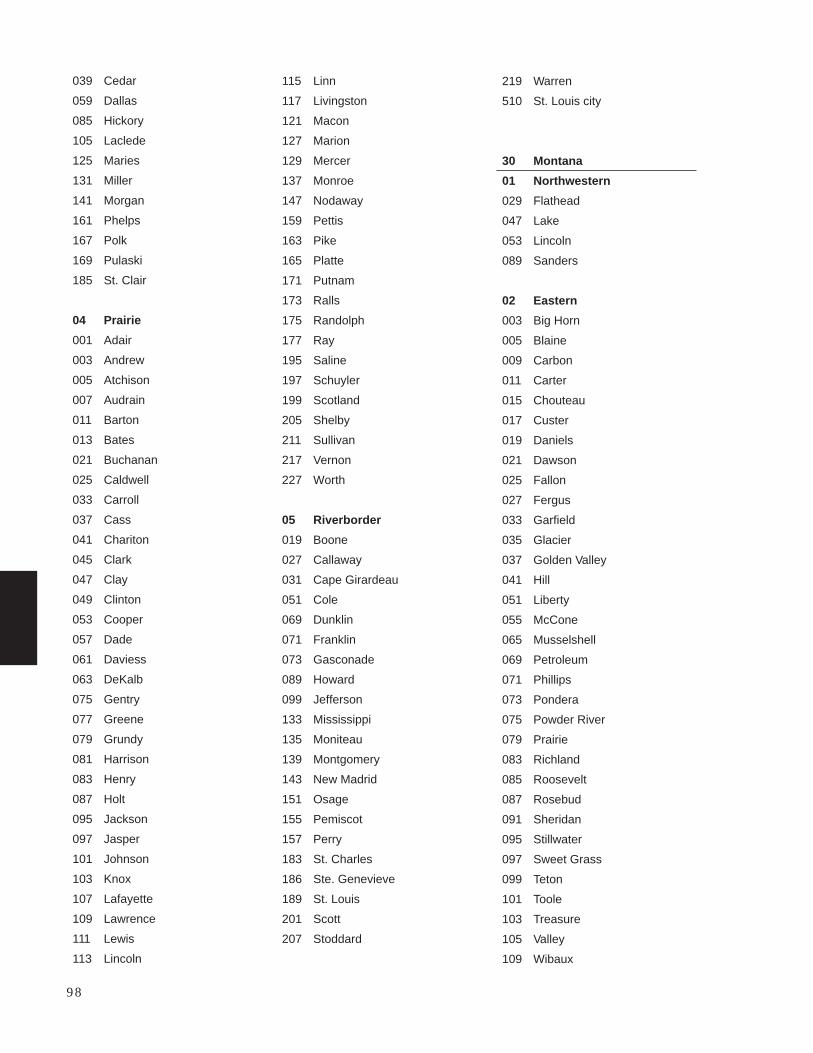
039 Cedar
059 Dallas
085 Hickory
105 Laclede
125 Maries
131 Miller
141 Morgan
161 Phelps
167 Polk
169 Pulaski
185 St. Clair
04 Prairie
001 Adair
003 Andrew
005 Atchison
007 Audrain
011 Barton
013 Bates
021 Buchanan
025 Caldwell
033 Carroll
037 Cass
041 Chariton
045 Clark
047 Clay
049 Clinton
053 Cooper
057 Dade
061 Daviess
063 DeKalb
075 Gentry
077 Greene
079 Grundy
081 Harrison
083 Henry
087 Holt
095 Jackson
097 Jasper
101 Johnson
103 Knox
107 Lafayette
109 Lawrence
111 Lewis
113 Lincoln
115 Linn
117 Livingston
121 Macon
127 Marion
129 Mercer
137 Monroe
147 Nodaway
159 Pettis
163 Pike
165 Platte
171 Putnam
173 Ralls
175 Randolph
177 Ray
195 Saline
197 Schuyler
199 Scotland
205 Shelby
211 Sullivan
217 Vernon
227 Worth
05 Riverborder
019 Boone
027 Callaway
031 Cape Girardeau
051 Cole
069 Dunklin
071 Franklin
073 Gasconade
089 Howard
099 Jefferson
133 Mississippi
135 Moniteau
139 Montgomery
143 New Madrid
151 Osage
155 Pemiscot
157 Perry
183 St. Charles
186 Ste. Genevieve
189 St. Louis
201 Scott
207 Stoddard
219 Warren
510 St. Louis city
30 Montana
01 Northwestern
029 Flathead
047 Lake
053 Lincoln
089 Sanders
02 Eastern
003 Big Horn
005 Blaine
009 Carbon
011 Carter
015 Chouteau
017 Custer
019 Daniels
021 Dawson
025 Fallon
027 Fergus
033 Garfield
035 Glacier
037 Golden Valley
041 Hill
051 Liberty
055 McCone
065 Musselshell
069 Petroleum
071 Phillips
073 Pondera
075 Powder River
079 Prairie
083 Richland
085 Roosevelt
087 Rosebud
091 Sheridan
095 Stillwater
097 Sweet Grass
099 Teton
101 Toole
103 Treasure
105 Valley
109 Wibaux
98
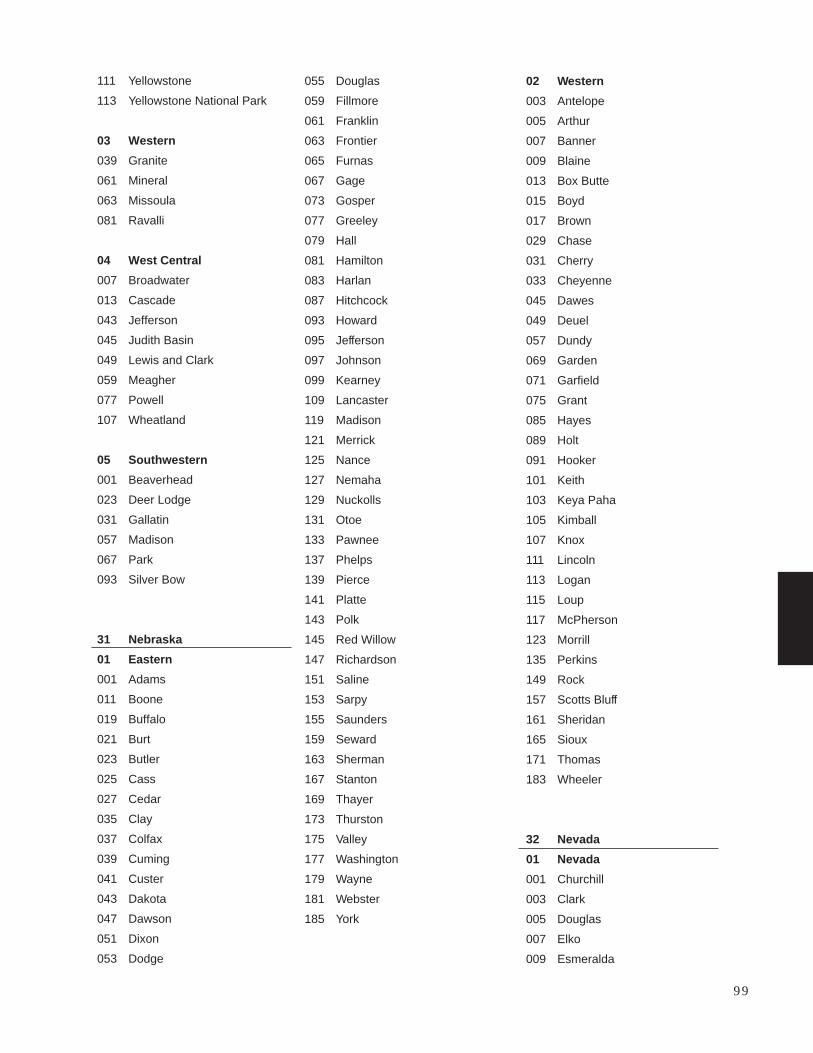
111 Yellowstone
113 Yellowstone National Park
03 Western
039 Granite
061 Mineral
063 Missoula
081 Ravalli
04 West Central
007 Broadwater
013 Cascade
043 Jefferson
045 Judith Basin
049 Lewis and Clark
059 Meagher
077 Powell
107 Wheatland
05 Southwestern
001 Beaverhead
023 Deer Lodge
031 Gallatin
057 Madison
067 Park
093 Silver Bow
31 Nebraska
01 Eastern
001 Adams
011 Boone
019 Buffalo
021 Burt
023 Butler
025 Cass
027 Cedar
035 Clay
037 Colfax
039 Cuming
041 Custer
043 Dakota
047 Dawson
051 Dixon
053 Dodge
055 Douglas
059 Fillmore
061 Franklin
063 Frontier
065 Furnas
067 Gage
073 Gosper
077 Greeley
079 Hall
081 Hamilton
083 Harlan
087 Hitchcock
093 Howard
095 Jefferson
097 Johnson
099 Kearney
109 Lancaster
119 Madison
121 Merrick
125 Nance
127 Nemaha
129 Nuckolls
131 Otoe
133 Pawnee
137 Phelps
139 Pierce
141 Platte
143 Polk
145 Red Willow
147 Richardson
151 Saline
153 Sarpy
155 Saunders
159 Seward
163 Sherman
167 Stanton
169 Thayer
173 Thurston
175 Valley
177 Washington
179 Wayne
181 Webster
185 York
02 Western
003 Antelope
005 Arthur
007 Banner
009 Blaine
013 Box Butte
015 Boyd
017 Brown
029 Chase
031 Cherry
033 Cheyenne
045 Dawes
049 Deuel
057 Dundy
069 Garden
071 Garfield
075 Grant
085 Hayes
089 Holt
091 Hooker
101 Keith
103 Keya Paha
105 Kimball
107 Knox
111 Lincoln
113 Logan
115 Loup
117 McPherson
123 Morrill
135 Perkins
149 Rock
157 Scotts Bluff
161 Sheridan
165 Sioux
171 Thomas
183 Wheeler
32 Nevada
01 Nevada
001 Churchill
003 Clark
005 Douglas
007 Elko
009 Esmeralda
99

011 Eureka
013 Humboldt
015 Lander
017 Lincoln
019 Lyon
021 Mineral
023 Nye
027 Pershing
029 Storey
031 Washoe
033 White Pine
510 Carson City
33 New Hampshire
02 Northern
003 Carroll
007 Coos
009 Grafton
03 Southern
001 Belknap
005 Cheshire
011 Hillsborough
013 Merrimack
015 Rockingham
017 Strafford
019 Sullivan
34 New Jersey
01 State
001 Atlantic
003 Bergen
005 Burlington
007 Camden
009 Cape May
011 Cumberland
013 Essex
015 Gloucester
017 Hudson
019 Hunterdon
021 Mercer
023 Middlesex
025 Monmouth
027 Morris
029 Ocean
031 Passaic
033 Salem
035 Somerset
037 Sussex
039 Union
041 Warren
35 New Mexico
01 Northwestern
001 Bernalillo
006 Cibola
028 Los Alamos
031 McKinley
039 Rio Arriba
043 Sandoval
045 San Juan
049 Santa Fe
055 Taos
061 Valencia
02 Northeastern
007 Colfax
019 Guadalupe
021 Harding
033 Mora
037 Quay
047 San Miguel
057 Torrance
059 Union
03 Southwestern
003 Catron
013 Dona Ana
017 Grant
023 Hidalgo
029 Luna
051 Sierra
053 Socorro
04 Southeastern
005 Chaves
009 Curry
011 DeBaca
015 Eddy
025 Lea
027 Lincoln
035 Otero
041 Roosevelt
36 New York
01 Adirondack
019 Clinton
033 Franklin
045 Jefferson
087 Rockland
089 St. Lawrence
02 Lake Plain
011 Cayuga
029 Erie
037 Genesee
051 Livingston
053 Madison
055 Monroe
063 Niagara
067 Onondaga
069 Ontario
073 Orleans
075 Oswego
099 Seneca
117 Wayne
121 Wyoming
123 Yates
03 Western Adirondack
035 Fulton
043 Herkimer
049 Lewis
065 Oneida
04 Eastern Adirondack
031 Essex
041 Hamilton
113 Warren
100
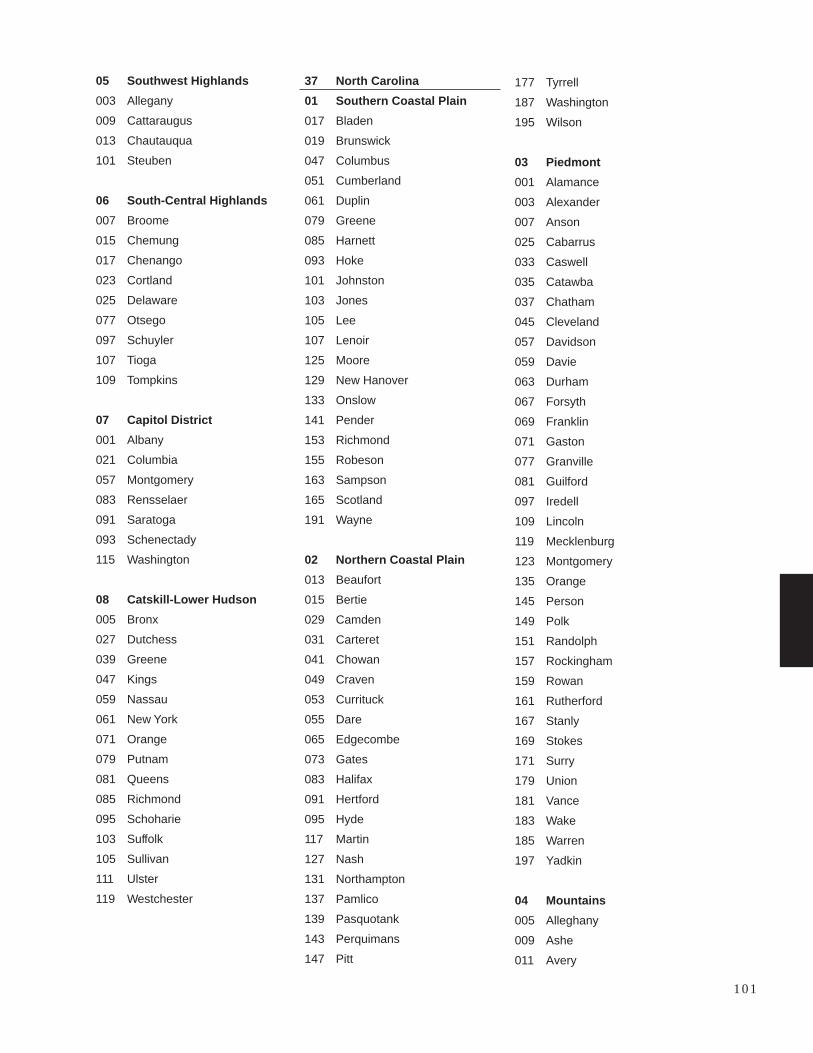
05 Southwest Highlands
003 Allegany
009 Cattaraugus
013 Chautauqua
101 Steuben
06 South-Central Highlands
007 Broome
015 Chemung
017 Chenango
023 Cortland
025 Delaware
077 Otsego
097 Schuyler
107 Tioga
109 Tompkins
07 Capitol District
001 Albany
021 Columbia
057 Montgomery
083 Rensselaer
091 Saratoga
093 Schenectady
115 Washington
08 Catskill-Lower Hudson
005 Bronx
027 Dutchess
039 Greene
047 Kings
059 Nassau
061 New York
071 Orange
079 Putnam
081 Queens
085 Richmond
095 Schoharie
103 Suffolk
105 Sullivan
111 Ulster
119 Westchester
37 North Carolina
01 Southern Coastal Plain
017 Bladen
019 Brunswick
047 Columbus
051 Cumberland
061 Duplin
079 Greene
085 Harnett
093 Hoke
101 Johnston
103 Jones
105 Lee
107 Lenoir
125 Moore
129 New Hanover
133 Onslow
141 Pender
153 Richmond
155 Robeson
163 Sampson
165 Scotland
191 Wayne
02 Northern Coastal Plain
013 Beaufort
015 Bertie
029 Camden
031 Carteret
041 Chowan
049 Craven
053 Currituck
055 Dare
065 Edgecombe
073 Gates
083 Halifax
091 Hertford
095 Hyde
117 Martin
127 Nash
131 Northampton
137 Pamlico
139 Pasquotank
143 Perquimans
147 Pitt
177 Tyrrell
187 Washington
195 Wilson
03 Piedmont
001 Alamance
003 Alexander
007 Anson
025 Cabarrus
033 Caswell
035 Catawba
037 Chatham
045 Cleveland
057 Davidson
059 Davie
063 Durham
067 Forsyth
069 Franklin
071 Gaston
077 Granville
081 Guilford
097 Iredell
109 Lincoln
119 Mecklenburg
123 Montgomery
135 Orange
145 Person
149 Polk
151 Randolph
157 Rockingham
159 Rowan
161 Rutherford
167 Stanly
169 Stokes
171 Surry
179 Union
181 Vance
183 Wake
185 Warren
197 Yadkin
04 Mountains
005 Alleghany
009 Ashe
011 Avery
101
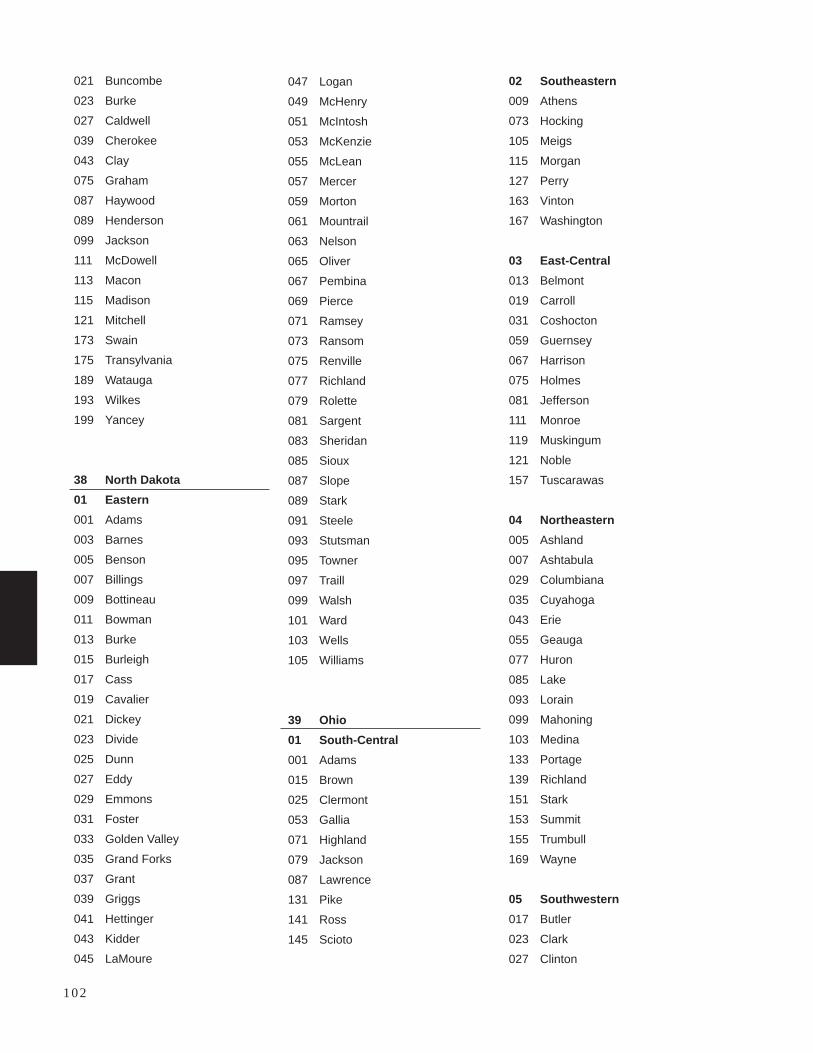
021 Buncombe
023 Burke
027 Caldwell
039 Cherokee
043 Clay
075 Graham
087 Haywood
089 Henderson
099 Jackson
111 McDowell
113 Macon
115 Madison
121 Mitchell
173 Swain
175 Transylvania
189 Watauga
193 Wilkes
199 Yancey
38 North Dakota
01 Eastern
001 Adams
003 Barnes
005 Benson
007 Billings
009 Bottineau
011 Bowman
013 Burke
015 Burleigh
017 Cass
019 Cavalier
021 Dickey
023 Divide
025 Dunn
027 Eddy
029 Emmons
031 Foster
033 Golden Valley
035 Grand Forks
037 Grant
039 Griggs
041 Hettinger
043 Kidder
045 LaMoure
047 Logan
049 McHenry
051 McIntosh
053 McKenzie
055 McLean
057 Mercer
059 Morton
061 Mountrail
063 Nelson
065 Oliver
067 Pembina
069 Pierce
071 Ramsey
073 Ransom
075 Renville
077 Richland
079 Rolette
081 Sargent
083 Sheridan
085 Sioux
087 Slope
089 Stark
091 Steele
093 Stutsman
095 Towner
097 Traill
099 Walsh
101 Ward
103 Wells
105 Williams
39 Ohio
01 South-Central
001 Adams
015 Brown
025 Clermont
053 Gallia
071 Highland
079 Jackson
087 Lawrence
131 Pike
141 Ross
145 Scioto
02 Southeastern
009 Athens
073 Hocking
105 Meigs
115 Morgan
127 Perry
163 Vinton
167 Washington
03 East-Central
013 Belmont
019 Carroll
031 Coshocton
059 Guernsey
067 Harrison
075 Holmes
081 Jefferson
111 Monroe
119 Muskingum
121 Noble
157 Tuscarawas
04 Northeastern
005 Ashland
007 Ashtabula
029 Columbiana
035 Cuyahoga
043 Erie
055 Geauga
077 Huron
085 Lake
093 Lorain
099 Mahoning
103 Medina
133 Portage
139 Richland
151 Stark
153 Summit
155 Trumbull
169 Wayne
05 Southwestern
017 Butler
023 Clark
027 Clinton
102
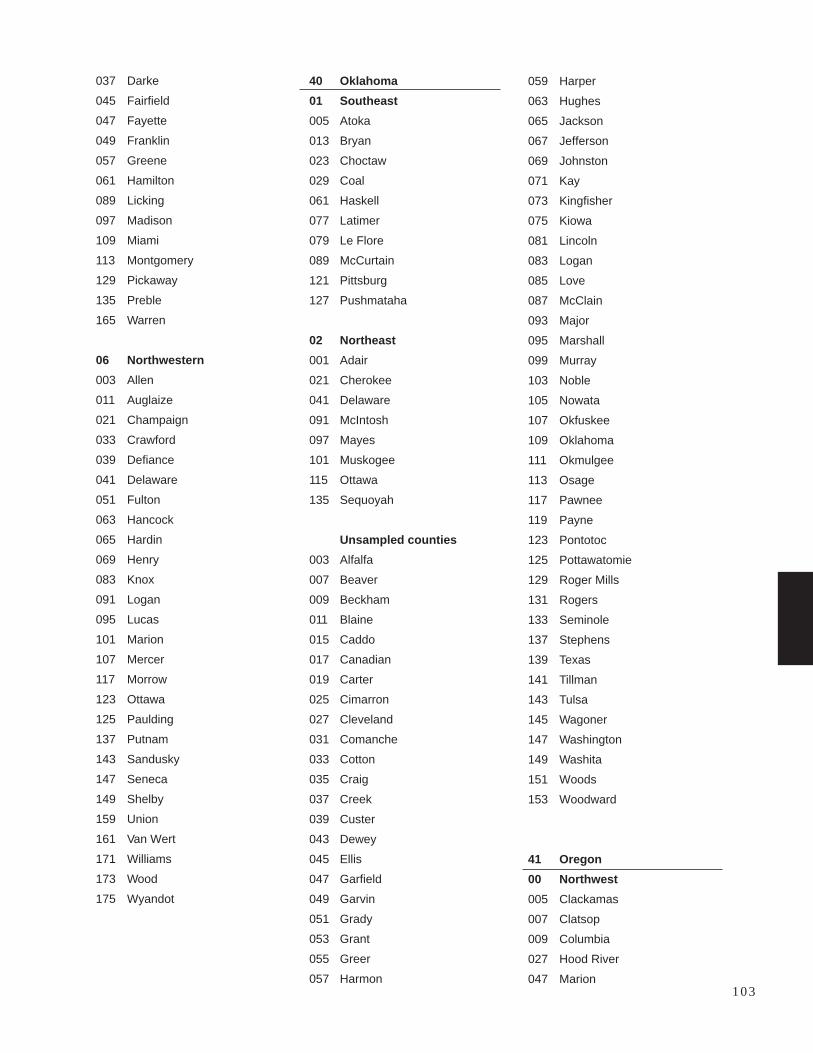
037 Darke
045 Fairfield
047 Fayette
049 Franklin
057 Greene
061 Hamilton
089 Licking
097 Madison
109 Miami
113 Montgomery
129 Pickaway
135 Preble
165 Warren
06 Northwestern
003 Allen
011 Auglaize
021 Champaign
033 Crawford
039 Defiance
041 Delaware
051 Fulton
063 Hancock
065 Hardin
069 Henry
083 Knox
091 Logan
095 Lucas
101 Marion
107 Mercer
117 Morrow
123 Ottawa
125 Paulding
137 Putnam
143 Sandusky
147 Seneca
149 Shelby
159 Union
161 Van Wert
171 Williams
173 Wood
175 Wyandot
40 Oklahoma
01 Southeast
005 Atoka
013 Bryan
023 Choctaw
029 Coal
061 Haskell
077 Latimer
079 Le Flore
089 McCurtain
121 Pittsburg
127 Pushmataha
02 Northeast
001 Adair
021 Cherokee
041 Delaware
091 McIntosh
097 Mayes
101 Muskogee
115 Ottawa
135 Sequoyah
Unsampled counties
003 Alfalfa
007 Beaver
009 Beckham
011 Blaine
015 Caddo
017 Canadian
019 Carter
025 Cimarron
027 Cleveland
031 Comanche
033 Cotton
035 Craig
037 Creek
039 Custer
043 Dewey
045 Ellis
047 Garfield
049 Garvin
051 Grady
053 Grant
055 Greer
057 Harmon
059 Harper
063 Hughes
065 Jackson
067 Jefferson
069 Johnston
071 Kay
073 Kingfisher
075 Kiowa
081 Lincoln
083 Logan
085 Love
087 McClain
093 Major
095 Marshall
099 Murray
103 Noble
105 Nowata
107 Okfuskee
109 Oklahoma
111 Okmulgee
113 Osage
117 Pawnee
119 Payne
123 Pontotoc
125 Pottawatomie
129 Roger Mills
131 Rogers
133 Seminole
137 Stephens
139 Texas
141 Tillman
143 Tulsa
145 Wagoner
147 Washington
149 Washita
151 Woods
153 Woodward
41 Oregon
00 Northwest
005 Clackamas
007 Clatsop
009 Columbia
027 Hood River
047 Marion103
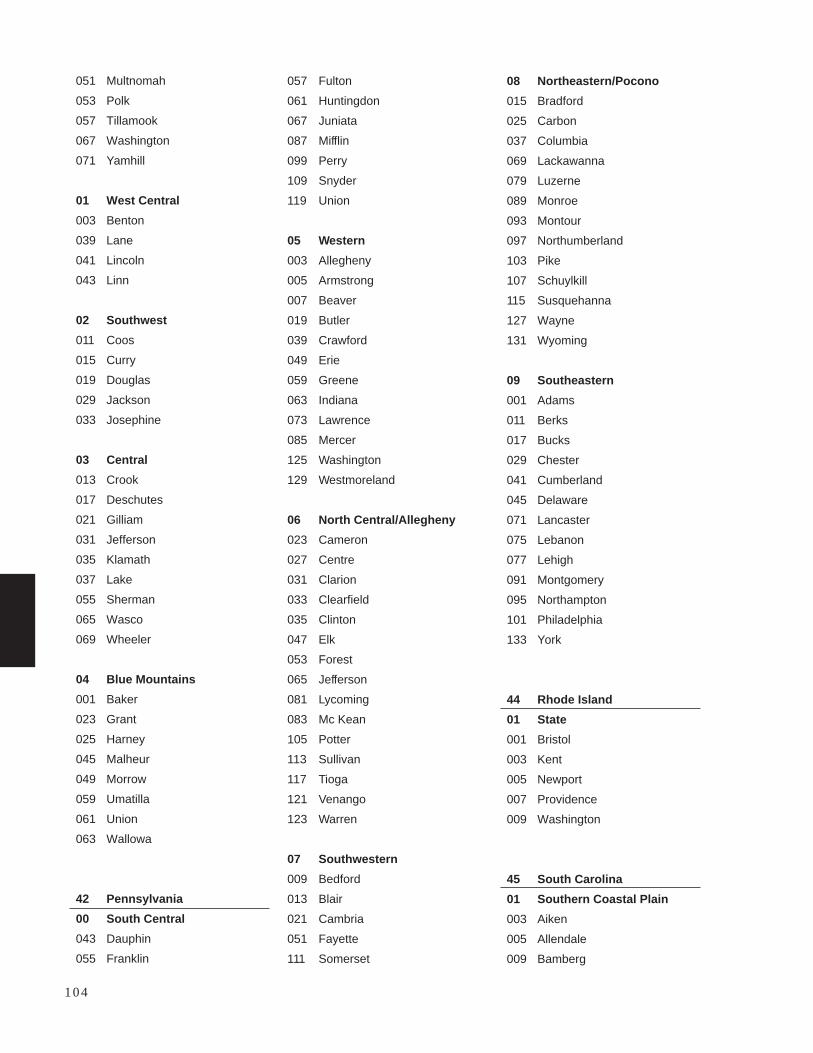
051 Multnomah
053 Polk
057 Tillamook
067 Washington
071 Yamhill
01 West Central
003 Benton
039 Lane
041 Lincoln
043 Linn
02 Southwest
011 Coos
015 Curry
019 Douglas
029 Jackson
033 Josephine
03 Central
013 Crook
017 Deschutes
021 Gilliam
031 Jefferson
035 Klamath
037 Lake
055 Sherman
065 Wasco
069 Wheeler
04 Blue Mountains
001 Baker
023 Grant
025 Harney
045 Malheur
049 Morrow
059 Umatilla
061 Union
063 Wallowa
42 Pennsylvania
00 South Central
043 Dauphin
055 Franklin
057 Fulton
061 Huntingdon
067 Juniata
087 Mifflin
099 Perry
109 Snyder
119 Union
05 Western
003 Allegheny
005 Armstrong
007 Beaver
019 Butler
039 Crawford
049 Erie
059 Greene
063 Indiana
073 Lawrence
085 Mercer
125 Washington
129 Westmoreland
06 North Central/Allegheny
023 Cameron
027 Centre
031 Clarion
033 Clearfield
035 Clinton
047 Elk
053 Forest
065 Jefferson
081 Lycoming
083 Mc Kean
105 Potter
113 Sullivan
117 Tioga
121 Venango
123 Warren
07 Southwestern
009 Bedford
013 Blair
021 Cambria
051 Fayette
111 Somerset
08 Northeastern/Pocono
015 Bradford
025 Carbon
037 Columbia
069 Lackawanna
079 Luzerne
089 Monroe
093 Montour
097 Northumberland
103 Pike
107 Schuylkill
115 Susquehanna
127 Wayne
131 Wyoming
09 Southeastern
001 Adams
011 Berks
017 Bucks
029 Chester
041 Cumberland
045 Delaware
071 Lancaster
075 Lebanon
077 Lehigh
091 Montgomery
095 Northampton
101 Philadelphia
133 York
44 Rhode Island
01 State
001 Bristol
003 Kent
005 Newport
007 Providence
009 Washington
45 South Carolina
01 Southern Coastal Plain
003 Aiken
005 Allendale
009 Bamberg
104
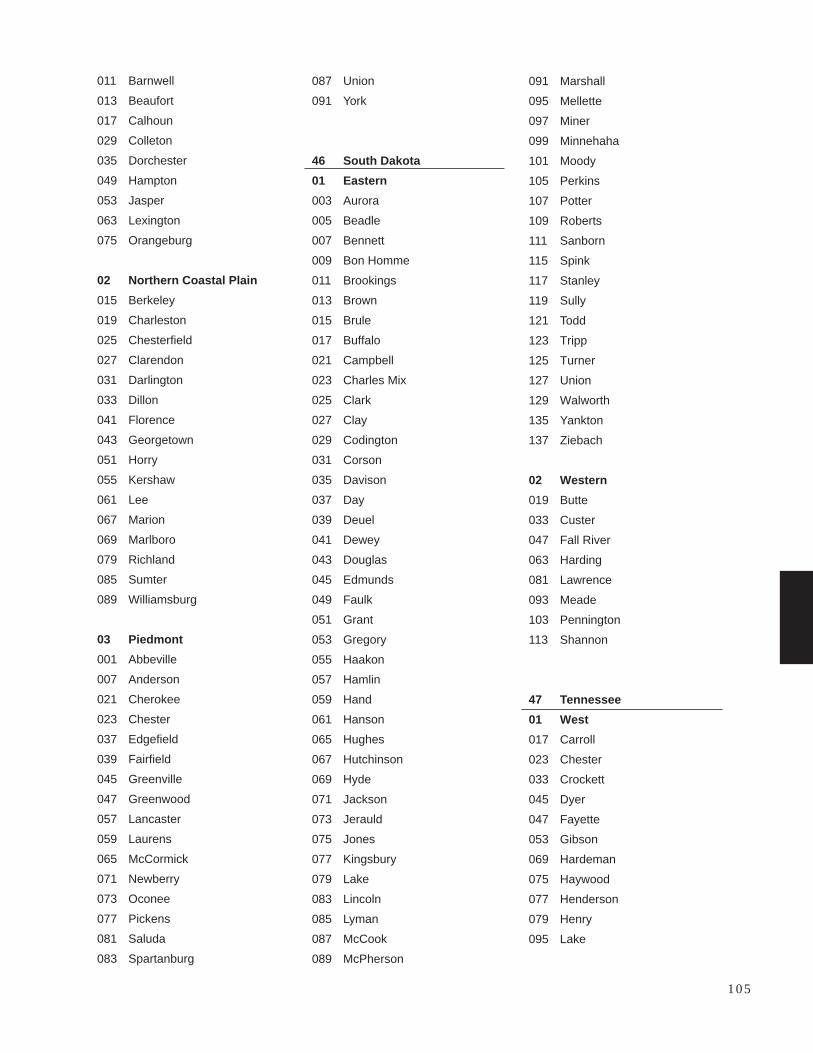
011 Barnwell
013 Beaufort
017 Calhoun
029 Colleton
035 Dorchester
049 Hampton
053 Jasper
063 Lexington
075 Orangeburg
02 Northern Coastal Plain
015 Berkeley
019 Charleston
025 Chesterfield
027 Clarendon
031 Darlington
033 Dillon
041 Florence
043 Georgetown
051 Horry
055 Kershaw
061 Lee
067 Marion
069 Marlboro
079 Richland
085 Sumter
089 Williamsburg
03 Piedmont
001 Abbeville
007 Anderson
021 Cherokee
023 Chester
037 Edgefield
039 Fairfield
045 Greenville
047 Greenwood
057 Lancaster
059 Laurens
065 McCormick
071 Newberry
073 Oconee
077 Pickens
081 Saluda
083 Spartanburg
087 Union
091 York
46 South Dakota
01 Eastern
003 Aurora
005 Beadle
007 Bennett
009 Bon Homme
011 Brookings
013 Brown
015 Brule
017 Buffalo
021 Campbell
023 Charles Mix
025 Clark
027 Clay
029 Codington
031 Corson
035 Davison
037 Day
039 Deuel
041 Dewey
043 Douglas
045 Edmunds
049 Faulk
051 Grant
053 Gregory
055 Haakon
057 Hamlin
059 Hand
061 Hanson
065 Hughes
067 Hutchinson
069 Hyde
071 Jackson
073 Jerauld
075 Jones
077 Kingsbury
079 Lake
083 Lincoln
085 Lyman
087 McCook
089 McPherson
091 Marshall
095 Mellette
097 Miner
099 Minnehaha
101 Moody
105 Perkins
107 Potter
109 Roberts
111 Sanborn
115 Spink
117 Stanley
119 Sully
121 Todd
123 Tripp
125 Turner
127 Union
129 Walworth
135 Yankton
137 Ziebach
02 Western
019 Butte
033 Custer
047 Fall River
063 Harding
081 Lawrence
093 Meade
103 Pennington
113 Shannon
47 Tennessee
01 West
017 Carroll
023 Chester
033 Crockett
045 Dyer
047 Fayette
053 Gibson
069 Hardeman
075 Haywood
077 Henderson
079 Henry
095 Lake
105

097 Lauderdale
109 McNairy
113 Madison
131 Obion
157 Shelby
167 Tipton
183 Weakley
02 West Central
005 Benton
039 Decatur
071 Hardin
081 Hickman
083 Houston
085 Humphreys
099 Lawrence
101 Lewis
135 Perry
161 Stewart
181 Wayne
03 Central
003 Bedford
015 Cannon
021 Cheatham
027 Clay
031 Coffee
037 Davidson
041 DeKalb
043 Dickson
055 Giles
087 Jackson
103 Lincoln
111 Macon
117 Marshall
119 Maury
125 Montgomery
127 Moore
147 Robertson
149 Rutherford
159 Smith
165 Sumner
169 Trousdale
187 Williamson
189 Wilson
04 Plateau
007 Bledsoe
013 Campbell
035 Cumberland
049 Fentress
051 Franklin
061 Grundy
115 Marion
129 Morgan
133 Overton
137 Pickett
141 Putnam
151 Scott
153 Sequatchie
175 Van Buren
177 Warren
185 White
05 East
001 Anderson
009 Blount
011 Bradley
019 Carter
025 Claiborne
029 Cocke
057 Grainger
059 Greene
063 Hamblen
065 Hamilton
067 Hancock
073 Hawkins
089 Jefferson
091 Johnson
093 Knox
105 Loudon
107 McMinn
121 Meigs
123 Monroe
139 Polk
143 Rhea
145 Roane
155 Sevier
163 Sullivan
171 Unicoi
173 Union
179 Washington
48 Texas
01 Southeast
005 Angelina
071 Chambers
185 Grimes
199 Hardin
201 Harris
225 Houston
241 Jasper
245 Jefferson
289 Leon
291 Liberty
313 Madison
339 Montgomery
351 Newton
361 Orange
373 Polk
403 Sabine
405 San Augustine
407 San Jacinto
455 Trinity
457 Tyler
471 Walker
473 Waller
02 Northeast
001 Anderson
037 Bowie
063 Camp
067 Cass
073 Cherokee
159 Franklin
183 Gregg
203 Harrison
213 Henderson
315 Marion
343 Morris
347 Nacogdoches
365 Panola
387 Red River
401 Rusk
419 Shelby
423 Smith
449 Titus
459 Upshur
467 Van Zandt
499 Wood106
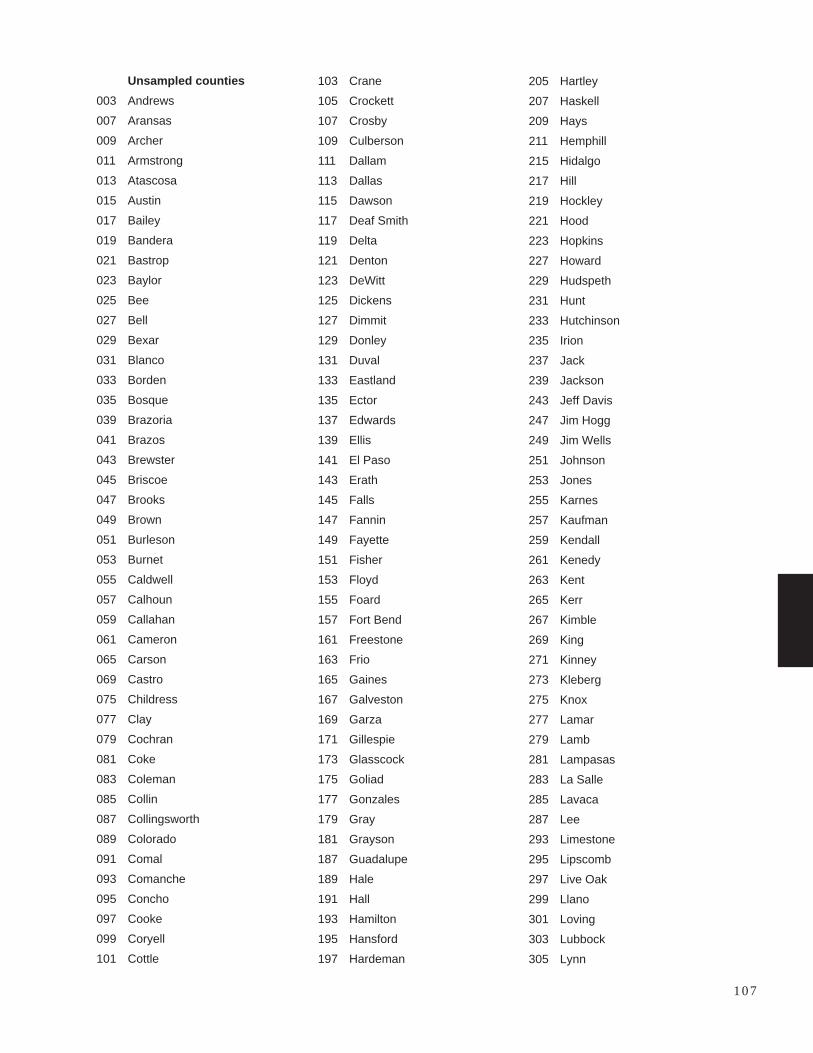
Unsampled counties
003 Andrews
007 Aransas
009 Archer
011 Armstrong
013 Atascosa
015 Austin
017 Bailey
019 Bandera
021 Bastrop
023 Baylor
025 Bee
027 Bell
029 Bexar
031 Blanco
033 Borden
035 Bosque
039 Brazoria
041 Brazos
043 Brewster
045 Briscoe
047 Brooks
049 Brown
051 Burleson
053 Burnet
055 Caldwell
057 Calhoun
059 Callahan
061 Cameron
065 Carson
069 Castro
075 Childress
077 Clay
079 Cochran
081 Coke
083 Coleman
085 Collin
087 Collingsworth
089 Colorado
091 Comal
093 Comanche
095 Concho
097 Cooke
099 Coryell
101 Cottle
103 Crane
105 Crockett
107 Crosby
109 Culberson
111 Dallam
113 Dallas
115 Dawson
117 Deaf Smith
119 Delta
121 Denton
123 DeWitt
125 Dickens
127 Dimmit
129 Donley
131 Duval
133 Eastland
135 Ector
137 Edwards
139 Ellis
141 El Paso
143 Erath
145 Falls
147 Fannin
149 Fayette
151 Fisher
153 Floyd
155 Foard
157 Fort Bend
161 Freestone
163 Frio
165 Gaines
167 Galveston
169 Garza
171 Gillespie
173 Glasscock
175 Goliad
177 Gonzales
179 Gray
181 Grayson
187 Guadalupe
189 Hale
191 Hall
193 Hamilton
195 Hansford
197 Hardeman
205 Hartley
207 Haskell
209 Hays
211 Hemphill
215 Hidalgo
217 Hill
219 Hockley
221 Hood
223 Hopkins
227 Howard
229 Hudspeth
231 Hunt
233 Hutchinson
235 Irion
237 Jack
239 Jackson
243 Jeff Davis
247 Jim Hogg
249 Jim Wells
251 Johnson
253 Jones
255 Karnes
257 Kaufman
259 Kendall
261 Kenedy
263 Kent
265 Kerr
267 Kimble
269 King
271 Kinney
273 Kleberg
275 Knox
277 Lamar
279 Lamb
281 Lampasas
283 La Salle
285 Lavaca
287 Lee
293 Limestone
295 Lipscomb
297 Live Oak
299 Llano
301 Loving
303 Lubbock
305 Lynn
107
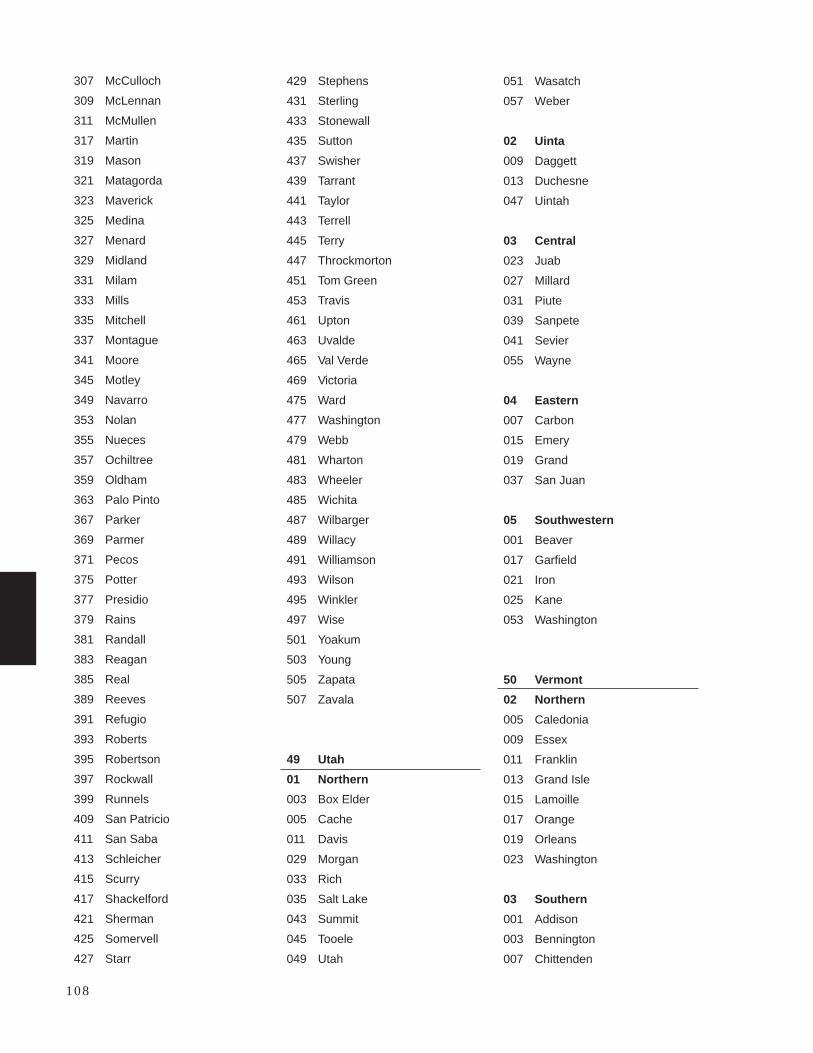
307 McCulloch
309 McLennan
311 McMullen
317 Martin
319 Mason
321 Matagorda
323 Maverick
325 Medina
327 Menard
329 Midland
331 Milam
333 Mills
335 Mitchell
337 Montague
341 Moore
345 Motley
349 Navarro
353 Nolan
355 Nueces
357 Ochiltree
359 Oldham
363 Palo Pinto
367 Parker
369 Parmer
371 Pecos
375 Potter
377 Presidio
379 Rains
381 Randall
383 Reagan
385 Real
389 Reeves
391 Refugio
393 Roberts
395 Robertson
397 Rockwall
399 Runnels
409 San Patricio
411 San Saba
413 Schleicher
415 Scurry
417 Shackelford
421 Sherman
425 Somervell
427 Starr
429 Stephens
431 Sterling
433 Stonewall
435 Sutton
437 Swisher
439 Tarrant
441 Taylor
443 Terrell
445 Terry
447 Throckmorton
451 Tom Green
453 Travis
461 Upton
463 Uvalde
465 Val Verde
469 Victoria
475 Ward
477 Washington
479 Webb
481 Wharton
483 Wheeler
485 Wichita
487 Wilbarger
489 Willacy
491 Williamson
493 Wilson
495 Winkler
497 Wise
501 Yoakum
503 Young
505 Zapata
507 Zavala
49 Utah
01 Northern
003 Box Elder
005 Cache
011 Davis
029 Morgan
033 Rich
035 Salt Lake
043 Summit
045 Tooele
049 Utah
051 Wasatch
057 Weber
02 Uinta
009 Daggett
013 Duchesne
047 Uintah
03 Central
023 Juab
027 Millard
031 Piute
039 Sanpete
041 Sevier
055 Wayne
04 Eastern
007 Carbon
015 Emery
019 Grand
037 San Juan
05 Southwestern
001 Beaver
017 Garfield
021 Iron
025 Kane
053 Washington
50 Vermont
02 Northern
005 Caledonia
009 Essex
011 Franklin
013 Grand Isle
015 Lamoille
017 Orange
019 Orleans
023 Washington
03 Southern
001 Addison
003 Bennington
007 Chittenden
108
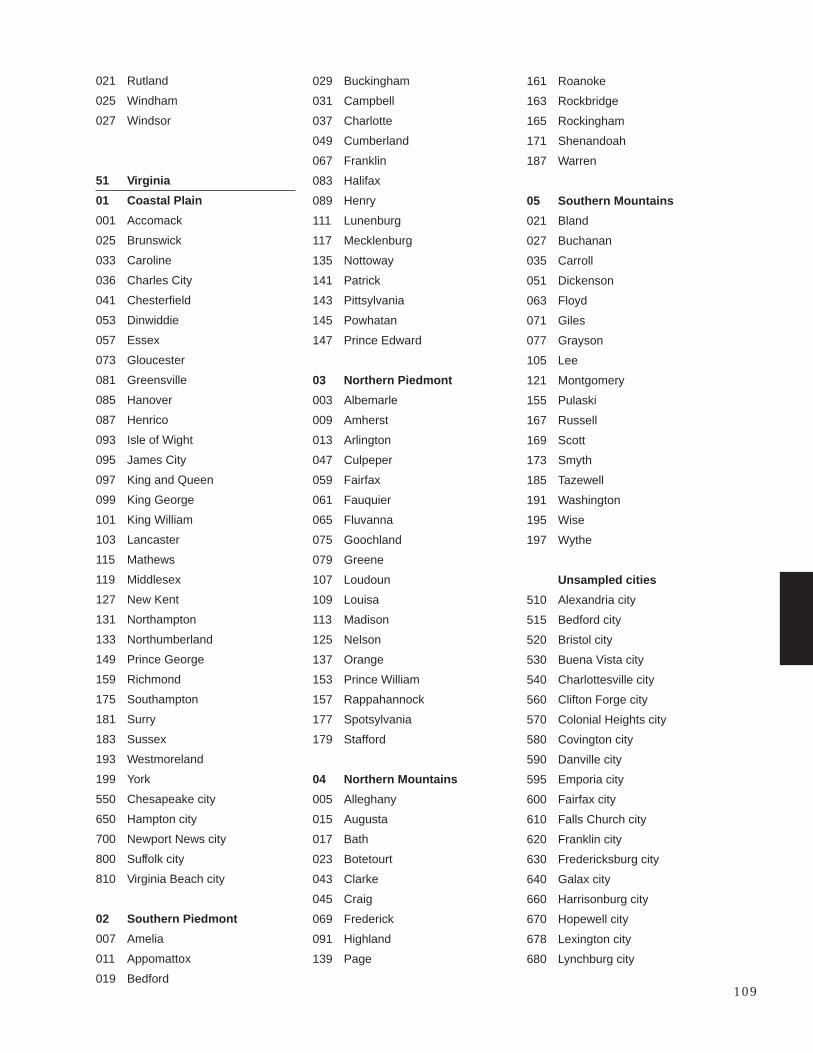
021 Rutland
025 Windham
027 Windsor
51 Virginia
01 Coastal Plain
001 Accomack
025 Brunswick
033 Caroline
036 Charles City
041 Chesterfield
053 Dinwiddie
057 Essex
073 Gloucester
081 Greensville
085 Hanover
087 Henrico
093 Isle of Wight
095 James City
097 King and Queen
099 King George
101 King William
103 Lancaster
115 Mathews
119 Middlesex
127 New Kent
131 Northampton
133 Northumberland
149 Prince George
159 Richmond
175 Southampton
181 Surry
183 Sussex
193 Westmoreland
199 York
550 Chesapeake city
650 Hampton city
700 Newport News city
800 Suffolk city
810 Virginia Beach city
02 Southern Piedmont
007 Amelia
011 Appomattox
019 Bedford
029 Buckingham
031 Campbell
037 Charlotte
049 Cumberland
067 Franklin
083 Halifax
089 Henry
111 Lunenburg
117 Mecklenburg
135 Nottoway
141 Patrick
143 Pittsylvania
145 Powhatan
147 Prince Edward
03 Northern Piedmont
003 Albemarle
009 Amherst
013 Arlington
047 Culpeper
059 Fairfax
061 Fauquier
065 Fluvanna
075 Goochland
079 Greene
107 Loudoun
109 Louisa
113 Madison
125 Nelson
137 Orange
153 Prince William
157 Rappahannock
177 Spotsylvania
179 Stafford
04 Northern Mountains
005 Alleghany
015 Augusta
017 Bath
023 Botetourt
043 Clarke
045 Craig
069 Frederick
091 Highland
139 Page
161 Roanoke
163 Rockbridge
165 Rockingham
171 Shenandoah
187 Warren
05 Southern Mountains
021 Bland
027 Buchanan
035 Carroll
051 Dickenson
063 Floyd
071 Giles
077 Grayson
105 Lee
121 Montgomery
155 Pulaski
167 Russell
169 Scott
173 Smyth
185 Tazewell
191 Washington
195 Wise
197 Wythe
Unsampled cities
510 Alexandria city
515 Bedford city
520 Bristol city
530 Buena Vista city
540 Charlottesville city
560 Clifton Forge city
570 Colonial Heights city
580 Covington city
590 Danville city
595 Emporia city
600 Fairfax city
610 Falls Church city
620 Franklin city
630 Fredericksburg city
640 Galax city
660 Harrisonburg city
670 Hopewell city
678 Lexington city
680 Lynchburg city
109
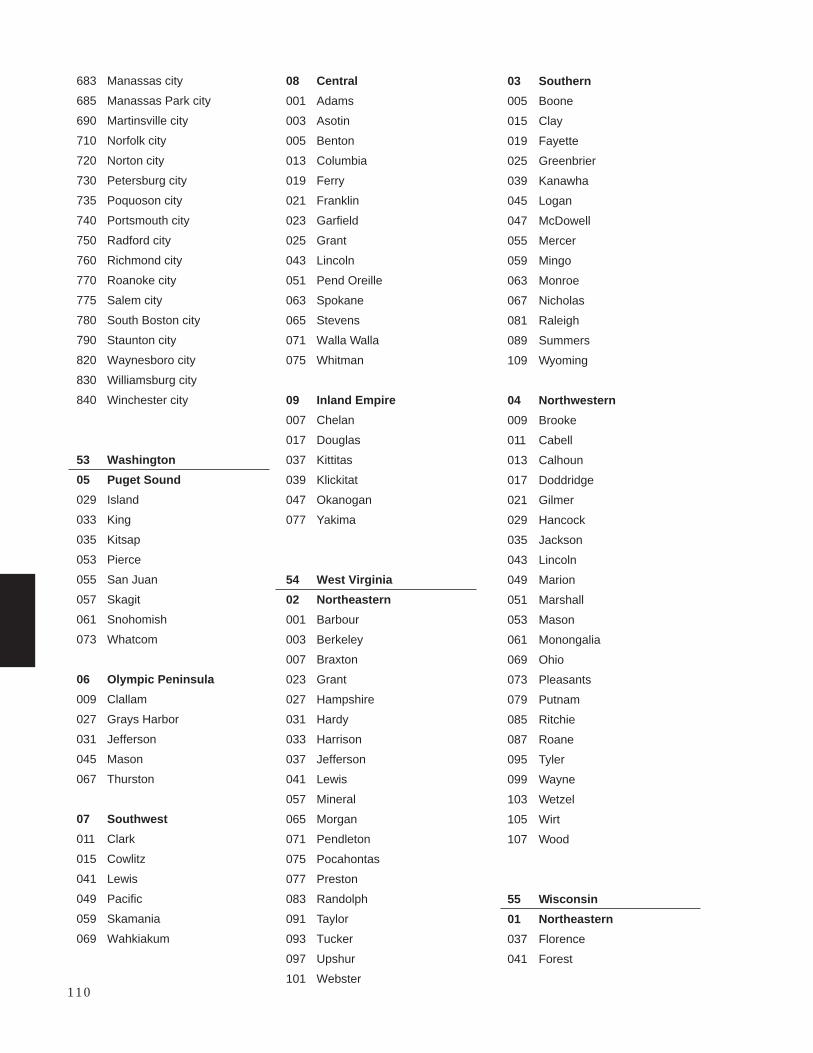
683 Manassas city
685 Manassas Park city
690 Martinsville city
710 Norfolk city
720 Norton city
730 Petersburg city
735 Poquoson city
740 Portsmouth city
750 Radford city
760 Richmond city
770 Roanoke city
775 Salem city
780 South Boston city
790 Staunton city
820 Waynesboro city
830 Williamsburg city
840 Winchester city
53 Washington
05 Puget Sound
029 Island
033 King
035 Kitsap
053 Pierce
055 San Juan
057 Skagit
061 Snohomish
073 Whatcom
06 Olympic Peninsula
009 Clallam
027 Grays Harbor
031 Jefferson
045 Mason
067 Thurston
07 Southwest
011 Clark
015 Cowlitz
041 Lewis
049 Pacific
059 Skamania
069 Wahkiakum
08 Central
001 Adams
003 Asotin
005 Benton
013 Columbia
019 Ferry
021 Franklin
023 Garfield
025 Grant
043 Lincoln
051 Pend Oreille
063 Spokane
065 Stevens
071 Walla Walla
075 Whitman
09 Inland Empire
007 Chelan
017 Douglas
037 Kittitas
039 Klickitat
047 Okanogan
077 Yakima
54 West Virginia
02 Northeastern
001 Barbour
003 Berkeley
007 Braxton
023 Grant
027 Hampshire
031 Hardy
033 Harrison
037 Jefferson
041 Lewis
057 Mineral
065 Morgan
071 Pendleton
075 Pocahontas
077 Preston
083 Randolph
091 Taylor
093 Tucker
097 Upshur
101 Webster
03 Southern
005 Boone
015 Clay
019 Fayette
025 Greenbrier
039 Kanawha
045 Logan
047 McDowell
055 Mercer
059 Mingo
063 Monroe
067 Nicholas
081 Raleigh
089 Summers
109 Wyoming
04 Northwestern
009 Brooke
011 Cabell
013 Calhoun
017 Doddridge
021 Gilmer
029 Hancock
035 Jackson
043 Lincoln
049 Marion
051 Marshall
053 Mason
061 Monongalia
069 Ohio
073 Pleasants
079 Putnam
085 Ritchie
087 Roane
095 Tyler
099 Wayne
103 Wetzel
105 Wirt
107 Wood
55 Wisconsin
01 Northeastern
037 Florence
041 Forest
110
067 Langlade
069 Lincoln
075 Marinette
078 Menominee
083 Oconto
085 Oneida
115 Shawano
125 Vilas
02 Northwestern
003 Ashland
005 Barron
007 Bayfield
013 Burnett
031 Douglas
051 Iron
095 Polk
099 Price
107 Rusk
113 Sawyer
119 Taylor
129 Washburn
03 Central
001 Adams
017 Chippewa
019 Clark
035 Eau Claire
053 Jackson
057 Juneau
073 Marathon
077 Marquette
081 Monroe
097 Portage
135 Waupaca
137 Waushara
141 Wood
04 Southwestern
011 Buffalo
023 Crawford
033 Dunn
043 Grant
049 Iowa
063 La Crosse
065 Lafayette
091 Pepin
093 Pierce
103 Richland
109 St. Croix
111 Sauk
121 Trempealeau
123 Vernon
05 Southeastern
009 Brown
015 Calumet
021 Columbia
025 Dane
027 Dodge
029 Door
039 Fond du Lac
045 Green
047 Green Lake
055 Jefferson
059 Kenosha
061 Kewaunee
071 Manitowoc
079 Milwaukee
087 Outagamie
089 Ozaukee
101 Racine
105 Rock
117 Sheboygan
127 Walworth
131 Washington
133 Waukesha
139 Winnebago
56 Wyoming
01 Western
013 Fremont
017 Hot Springs
023 Lincoln
029 Park
035 Sublette
037 Sweetwater
039 Teton
041 Uinta
02 Central and Southeastern
001 Albany
003 Big Horn
007 Carbon
009 Converse
015 Goshen
019 Johnson
021 Laramie
025 Natrona
027 Niobrara
031 Platte
033 Sheridan
043 Washakie
03 Northeastern
005 Campbell
011 Crook
045 Weston
72 Puerto Rico
01 Puerto Rico
001 Adjuntas
003 Aguada
005 Aguadilla
007 Aguas Buenas
009 Aibonito
011 Anasco
013 Arecibo
015 Arroyo
017 Barceloneta
019 Barranquitas
021 Bayamon
023 Cabo Rojo
025 Caguas
027 Camuy
029 Canovanas
031 Carolina
033 Catano
035 Cayey
037 Ceiba
039 Ciales
041 Cidra
043 Coamo
045 Comerio
111
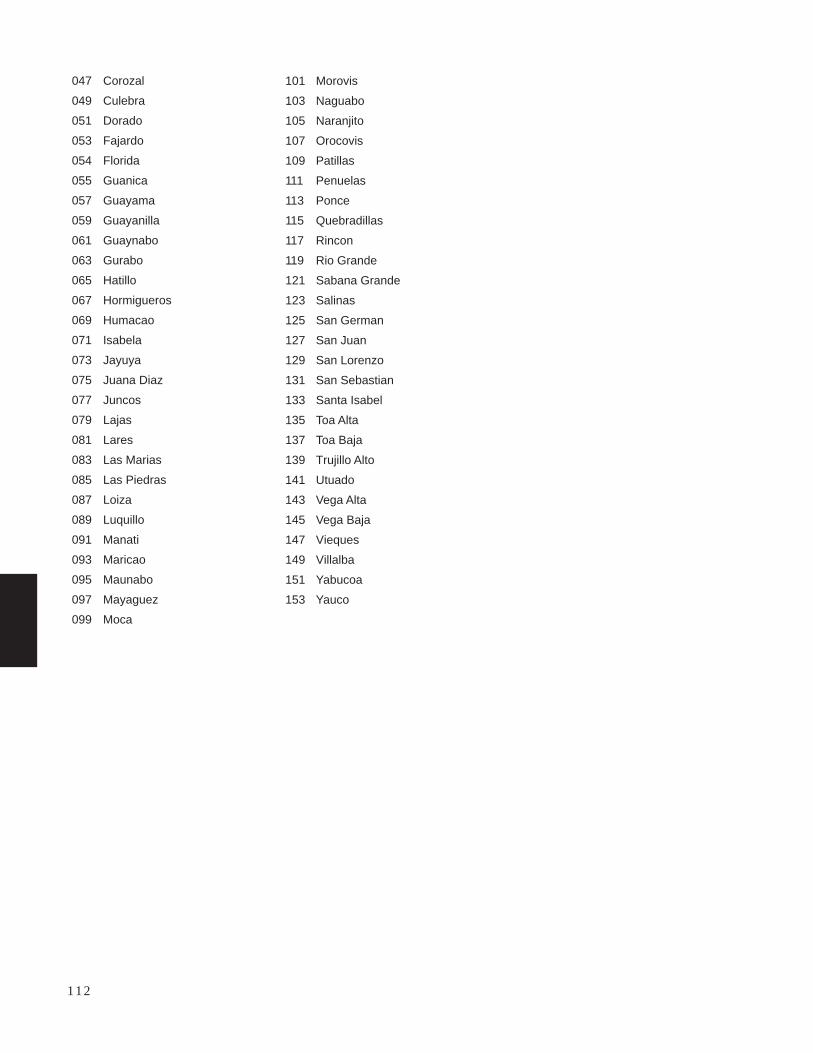
047 Corozal
049 Culebra
051 Dorado
053 Fajardo
054 Florida
055 Guanica
057 Guayama
059 Guayanilla
061 Guaynabo
063 Gurabo
065 Hatillo
067 Hormigueros
069 Humacao
071 Isabela
073 Jayuya
075 Juana Diaz
077 Juncos
079 Lajas
081 Lares
083 Las Marias
085 Las Piedras
087 Loiza
089 Luquillo
091 Manati
093 Maricao
095 Maunabo
097 Mayaguez
099 Moca
101 Morovis
103 Naguabo
105 Naranjito
107 Orocovis
109 Patillas
111 Penuelas
113 Ponce
115 Quebradillas
117 Rincon
119 Rio Grande
121 Sabana Grande
123 Salinas
125 San German
127 San Juan
129 San Lorenzo
131 San Sebastian
133 Santa Isabel
135 Toa Alta
137 Toa Baja
139 Trujillo Alto
141 Utuado
143 Vega Alta
145 Vega Baja
147 Vieques
149 Villalba
151 Yabucoa
153 Yauco
112
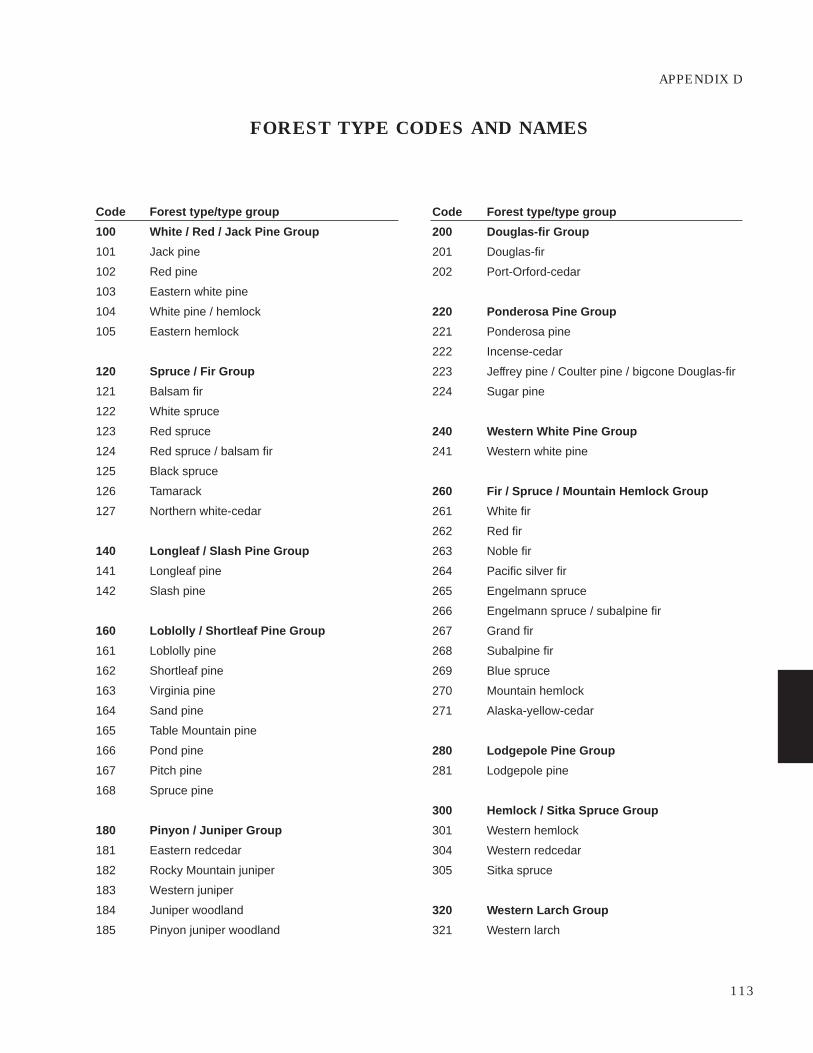
APPENDIX D
FOREST TYPE CODES AND NAMES
Code Forest type/type group
100 White / Red / Jack Pine Group
101 Jack pine
102 Red pine
103 Eastern white pine
104 White pine / hemlock
105 Eastern hemlock
120 Spruce / Fir Group
121 Balsam fir
122 White spruce
123 Red spruce
124 Red spruce / balsam fir
125 Black spruce
126 Tamarack
127 Northern white-cedar
140 Longleaf / Slash Pine Group
141 Longleaf pine
142 Slash pine
160 Loblolly / Shortleaf Pine Group
161 Loblolly pine
162 Shortleaf pine
163 Virginia pine
164 Sand pine
165 Table Mountain pine
166 Pond pine
167 Pitch pine
168 Spruce pine
180 Pinyon / Juniper Group
181 Eastern redcedar
182 Rocky Mountain juniper
183 Western juniper
184 Juniper woodland
185 Pinyon juniper woodland
Code Forest type/type group
200 Douglas-fir Group
201 Douglas-fir
202 Port-Orford-cedar
220 Ponderosa Pine Group
221 Ponderosa pine
222 Incense-cedar
223 Jeffrey pine / Coulter pine / bigcone Douglas-fir
224 Sugar pine
240 Western White Pine Group
241 Western white pine
260 Fir / Spruce / Mountain Hemlock Group
261 White fir
262 Red fir
263 Noble fir
264 Pacific silver fir
265 Engelmann spruce
266 Engelmann spruce / subalpine fir
267 Grand fir
268 Subalpine fir
269 Blue spruce
270 Mountain hemlock
271 Alaska-yellow-cedar
280 Lodgepole Pine Group
281 Lodgepole pine
300 Hemlock / Sitka Spruce Group
301 Western hemlock
304 Western redcedar
305 Sitka spruce
320 Western Larch Group
321 Western larch
113
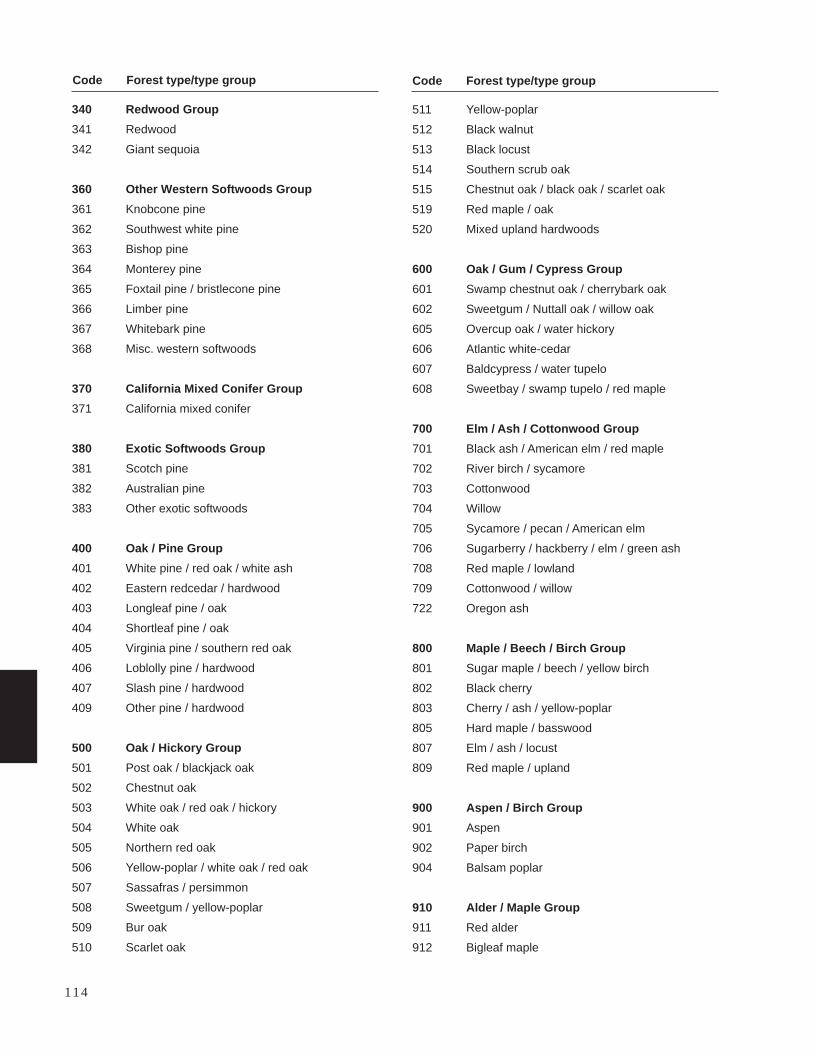
340 Redwood Group
341 Redwood
342 Giant sequoia
360 Other Western Softwoods Group
361 Knobcone pine
362 Southwest white pine
363 Bishop pine
364 Monterey pine
365 Foxtail pine / bristlecone pine
366 Limber pine
367 Whitebark pine
368 Misc. western softwoods
370 California Mixed Conifer Group
371 California mixed conifer
380 Exotic Softwoods Group
381 Scotch pine
382 Australian pine
383 Other exotic softwoods
400 Oak / Pine Group
401 White pine / red oak / white ash
402 Eastern redcedar / hardwood
403 Longleaf pine / oak
404 Shortleaf pine / oak
405 Virginia pine / southern red oak
406 Loblolly pine / hardwood
407 Slash pine / hardwood
409 Other pine / hardwood
500 Oak / Hickory Group
501 Post oak / blackjack oak
502 Chestnut oak
503 White oak / red oak / hickory
504 White oak
505 Northern red oak
506 Yellow-poplar / white oak / red oak
507 Sassafras / persimmon
508 Sweetgum / yellow-poplar
509 Bur oak
510 Scarlet oak
511 Yellow-poplar
512 Black walnut
513 Black locust
514 Southern scrub oak
515 Chestnut oak / black oak / scarlet oak
519 Red maple / oak
520 Mixed upland hardwoods
600 Oak / Gum / Cypress Group
601 Swamp chestnut oak / cherrybark oak
602 Sweetgum / Nuttall oak / willow oak
605 Overcup oak / water hickory
606 Atlantic white-cedar
607 Baldcypress / water tupelo
608 Sweetbay / swamp tupelo / red maple
700 Elm / Ash / Cottonwood Group
701 Black ash / American elm / red maple
702 River birch / sycamore
703 Cottonwood
704 Willow
705 Sycamore / pecan / American elm
706 Sugarberry / hackberry / elm / green ash
708 Red maple / lowland
709 Cottonwood / willow
722 Oregon ash
800 Maple / Beech / Birch Group
801 Sugar maple / beech / yellow birch
802 Black cherry
803 Cherry / ash / yellow-poplar
805 Hard maple / basswood
807 Elm / ash / locust
809 Red maple / upland
900 Aspen / Birch Group
901 Aspen
902 Paper birch
904 Balsam poplar
910 Alder / Maple Group
911 Red alder
912 Bigleaf maple
114
Code Forest type/type group Code Forest type/type group
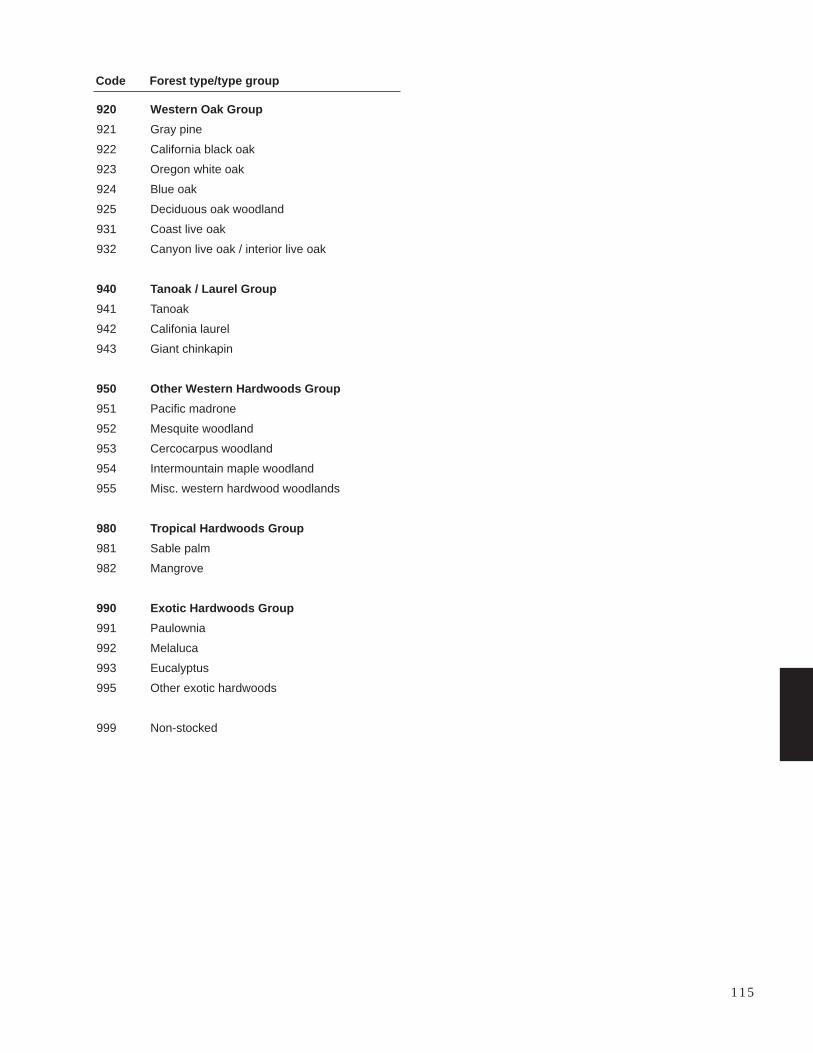
920 Western Oak Group
921 Gray pine
922 California black oak
923 Oregon white oak
924 Blue oak
925 Deciduous oak woodland
931 Coast live oak
932 Canyon live oak / interior live oak
940 Tanoak / Laurel Group
941 Tanoak
942 Califonia laurel
943 Giant chinkapin
950 Other Western Hardwoods Group
951 Pacific madrone
952 Mesquite woodland
953 Cercocarpus woodland
954 Intermountain maple woodland
955 Misc. western hardwood woodlands
980 Tropical Hardwoods Group
981 Sable palm
982 Mangrove
990 Exotic Hardwoods Group
991 Paulownia
992 Melaluca
993 Eucalyptus
995 Other exotic hardwoods
999 Non-stocked
115
Code Forest type/type group

116
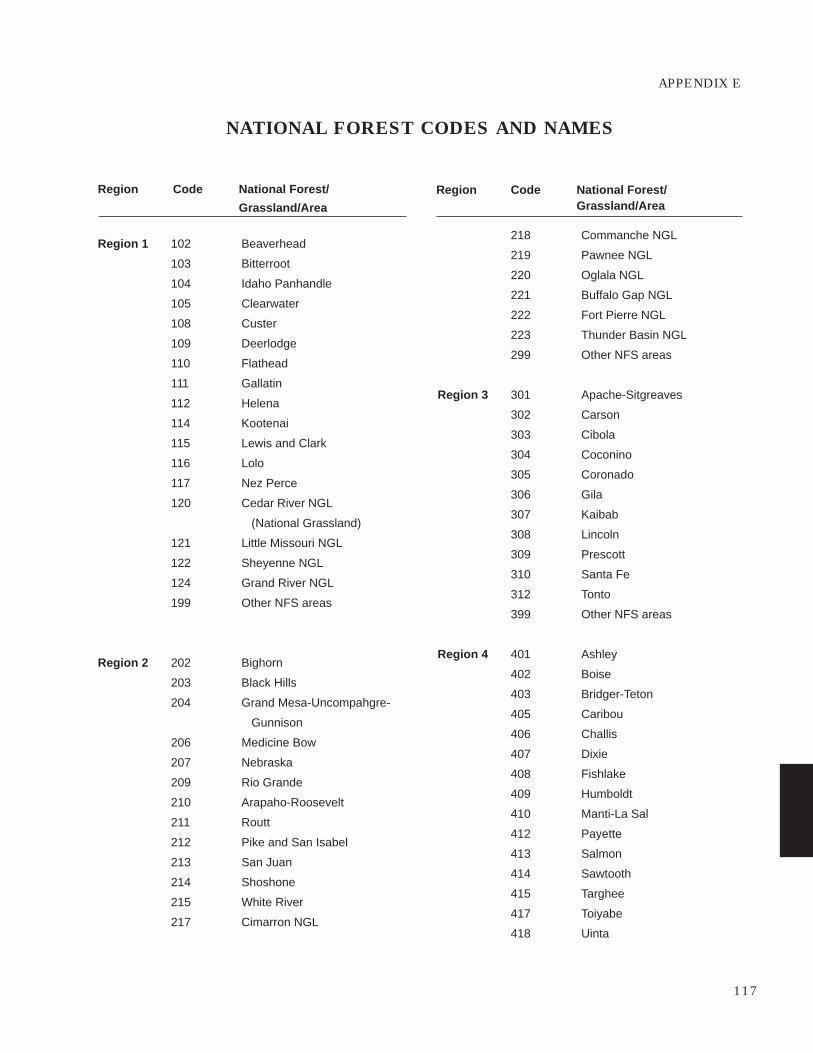
APPENDIX E
NATIONAL FOREST CODES AND NAMES
Region Code National Forest/
Grassland/Area
Region 1 102 Beaverhead
103 Bitterroot
104 Idaho Panhandle
105 Clearwater
108 Custer
109 Deerlodge
110 Flathead
111 Gallatin
112 Helena
114 Kootenai
115 Lewis and Clark
116 Lolo
117 Nez Perce
120 Cedar River NGL
(National Grassland)
121 Little Missouri NGL
122 Sheyenne NGL
124 Grand River NGL
199 Other NFS areas
Region 2 202 Bighorn
203 Black Hills
204 Grand Mesa-Uncompahgre-
Gunnison
206 Medicine Bow
207 Nebraska
209 Rio Grande
210 Arapaho-Roosevelt
211 Routt
212 Pike and San Isabel
213 San Juan
214 Shoshone
215 White River
217 Cimarron NGL
218 Commanche NGL
219 Pawnee NGL
220 Oglala NGL
221 Buffalo Gap NGL
222 Fort Pierre NGL
223 Thunder Basin NGL
299 Other NFS areas
Region 3 301 Apache-Sitgreaves
302 Carson
303 Cibola
304 Coconino
305 Coronado
306 Gila
307 Kaibab
308 Lincoln
309 Prescott
310 Santa Fe
312 Tonto
399 Other NFS areas
Region 4 401 Ashley
402 Boise
403 Bridger-Teton
405 Caribou
406 Challis
407 Dixie
408 Fishlake
409 Humboldt
410 Manti-La Sal
412 Payette
413 Salmon
414 Sawtooth
415 Targhee
417 Toiyabe
418 Uinta
117
Region Code National Forest/Grassland/Area
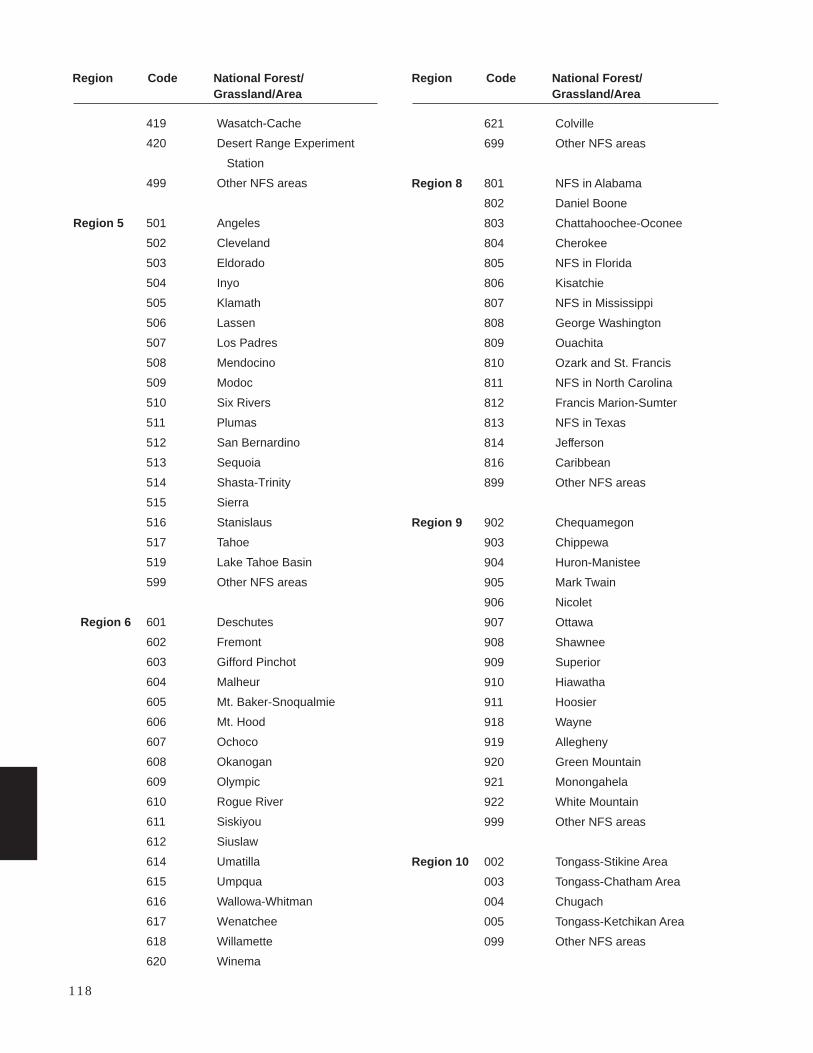
419 Wasatch-Cache
420 Desert Range Experiment
Station
499 Other NFS areas
Region 5 501 Angeles
502 Cleveland
503 Eldorado
504 Inyo
505 Klamath
506 Lassen
507 Los Padres
508 Mendocino
509 Modoc
510 Six Rivers
511 Plumas
512 San Bernardino
513 Sequoia
514 Shasta-Trinity
515 Sierra
516 Stanislaus
517 Tahoe
519 Lake Tahoe Basin
599 Other NFS areas
Region 6 601 Deschutes
602 Fremont
603 Gifford Pinchot
604 Malheur
605 Mt. Baker-Snoqualmie
606 Mt. Hood
607 Ochoco
608 Okanogan
609 Olympic
610 Rogue River
611 Siskiyou
612 Siuslaw
614 Umatilla
615 Umpqua
616 Wallowa-Whitman
617 Wenatchee
618 Willamette
620 Winema
621 Colville
699 Other NFS areas
Region 8 801 NFS in Alabama
802 Daniel Boone
803 Chattahoochee-Oconee
804 Cherokee
805 NFS in Florida
806 Kisatchie
807 NFS in Mississippi
808 George Washington
809 Ouachita
810 Ozark and St. Francis
811 NFS in North Carolina
812 Francis Marion-Sumter
813 NFS in Texas
814 Jefferson
816 Caribbean
899 Other NFS areas
Region 9 902 Chequamegon
903 Chippewa
904 Huron-Manistee
905 Mark Twain
906 Nicolet
907 Ottawa
908 Shawnee
909 Superior
910 Hiawatha
911 Hoosier
918 Wayne
919 Allegheny
920 Green Mountain
921 Monongahela
922 White Mountain
999 Other NFS areas
Region 10 002 Tongass-Stikine Area
003 Tongass-Chatham Area
004 Chugach
005 Tongass-Ketchikan Area
099 Other NFS areas
118
Region Code National Forest/Grassland/Area
Region Code National Forest/Grassland/Area
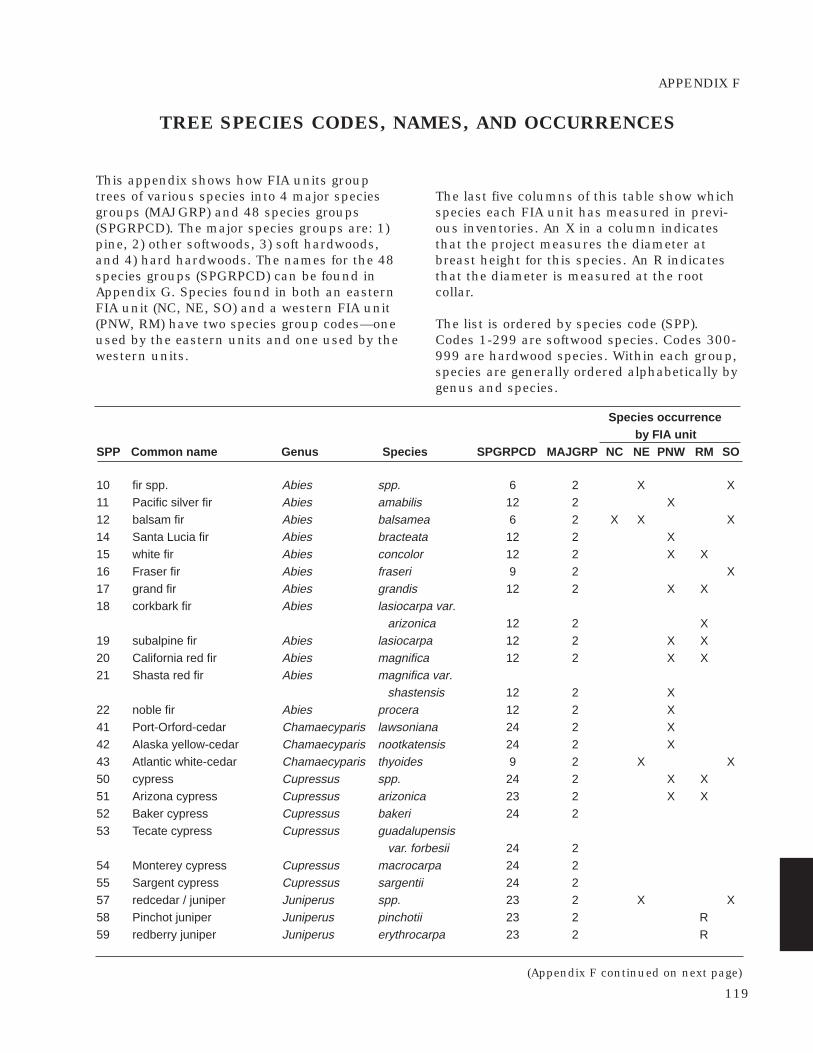
APPENDIX F
TREE SPECIES CODES, NAMES, AND OCCURRENCES
This appendix shows how FIA units grouptrees of various species into 4 major speciesgroups (MAJGRP) and 48 species groups(SPGRPCD). The major species groups are: 1)pine, 2) other softwoods, 3) soft hardwoods,and 4) hard hardwoods. The names for the 48species groups (SPGRPCD) can be found inAppendix G. Species found in both an easternFIA unit (NC, NE, SO) and a western FIA unit(PNW, RM) have two species group codes—oneused by the eastern units and one used by thewestern units.
The last five columns of this table show whichspecies each FIA unit has measured in previ-ous inventories. An X in a column indicatesthat the project measures the diameter atbreast height for this species. An R indicatesthat the diameter is measured at the rootcollar.
The list is ordered by species code (SPP).Codes 1-299 are softwood species. Codes 300-999 are hardwood species. Within each group,species are generally ordered alphabetically bygenus and species.
Species occurrenceby FIA unit
SPP Common name Genus Species SPGRPCD MAJGRP NC NE PNW RM SO
10 fir spp. Abies spp. 6 2 X X11 Pacific silver fir Abies amabilis 12 2 X12 balsam fir Abies balsamea 6 2 X X X14 Santa Lucia fir Abies bracteata 12 2 X15 white fir Abies concolor 12 2 X X16 Fraser fir Abies fraseri 9 2 X17 grand fir Abies grandis 12 2 X X18 corkbark fir Abies lasiocarpa var.
arizonica 12 2 X19 subalpine fir Abies lasiocarpa 12 2 X X20 California red fir Abies magnifica 12 2 X X21 Shasta red fir Abies magnifica var.
shastensis 12 2 X22 noble fir Abies procera 12 2 X41 Port-Orford-cedar Chamaecyparis lawsoniana 24 2 X42 Alaska yellow-cedar Chamaecyparis nootkatensis 24 2 X43 Atlantic white-cedar Chamaecyparis thyoides 9 2 X X50 cypress Cupressus spp. 24 2 X X51 Arizona cypress Cupressus arizonica 23 2 X X52 Baker cypress Cupressus bakeri 24 253 Tecate cypress Cupressus guadalupensis
var. forbesii 24 254 Monterey cypress Cupressus macrocarpa 24 255 Sargent cypress Cupressus sargentii 24 257 redcedar / juniper Juniperus spp. 23 2 X X58 Pinchot juniper Juniperus pinchotii 23 2 R59 redberry juniper Juniperus erythrocarpa 23 2 R
(Appendix F continued on next page)
119
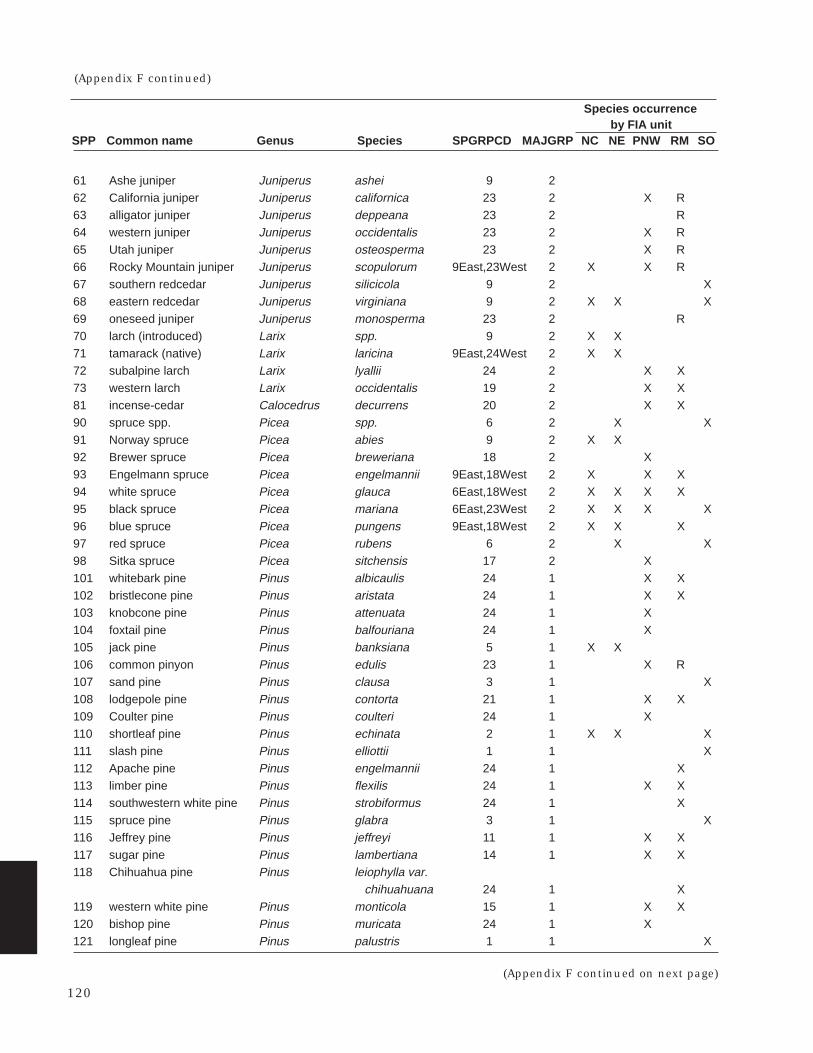
61 Ashe juniper Juniperus ashei 9 262 California juniper Juniperus californica 23 2 X R63 alligator juniper Juniperus deppeana 23 2 R64 western juniper Juniperus occidentalis 23 2 X R65 Utah juniper Juniperus osteosperma 23 2 X R66 Rocky Mountain juniper Juniperus scopulorum 9East,23West 2 X X R67 southern redcedar Juniperus silicicola 9 2 X68 eastern redcedar Juniperus virginiana 9 2 X X X69 oneseed juniper Juniperus monosperma 23 2 R70 larch (introduced) Larix spp. 9 2 X X71 tamarack (native) Larix laricina 9East,24West 2 X X72 subalpine larch Larix lyallii 24 2 X X73 western larch Larix occidentalis 19 2 X X81 incense-cedar Calocedrus decurrens 20 2 X X90 spruce spp. Picea spp. 6 2 X X91 Norway spruce Picea abies 9 2 X X92 Brewer spruce Picea breweriana 18 2 X93 Engelmann spruce Picea engelmannii 9East,18West 2 X X X94 white spruce Picea glauca 6East,18West 2 X X X X95 black spruce Picea mariana 6East,23West 2 X X X X96 blue spruce Picea pungens 9East,18West 2 X X X97 red spruce Picea rubens 6 2 X X98 Sitka spruce Picea sitchensis 17 2 X101 whitebark pine Pinus albicaulis 24 1 X X102 bristlecone pine Pinus aristata 24 1 X X103 knobcone pine Pinus attenuata 24 1 X10⁴ foxtail pine Pinus balfouriana 24 1 X10⁵ jack pine Pinus banksiana 5 1 X X106 common pinyon Pinus edulis 23 1 X R107 sand pine Pinus clausa 3 1 X10⁸ lodgepole pine Pinus contorta 21 1 X X109 Coulter pine Pinus coulteri 24 1 X110 shortleaf pine Pinus echinata 2 1 X X X111 slash pine Pinus elliottii 1 1 X112 Apache pine Pinus engelmannii 24 1 X113 limber pine Pinus flexilis 24 1 X X114 southwestern white pine Pinus strobiformus 24 1 X115 spruce pine Pinus glabra 3 1 X116 Jeffrey pine Pinus jeffreyi 11 1 X X117 sugar pine Pinus lambertiana 14 1 X X118 Chihuahua pine Pinus leiophylla var.
chihuahuana 24 1 X119 western white pine Pinus monticola 15 1 X X120 bishop pine Pinus muricata 24 1 X121 longleaf pine Pinus palustris 1 1 X
Species occurrenceby FIA unit
SPP Common name Genus Species SPGRPCD MAJGRP NC NE PNW RM SO
(Appendix F continued on next page)
(Appendix F continued)
120
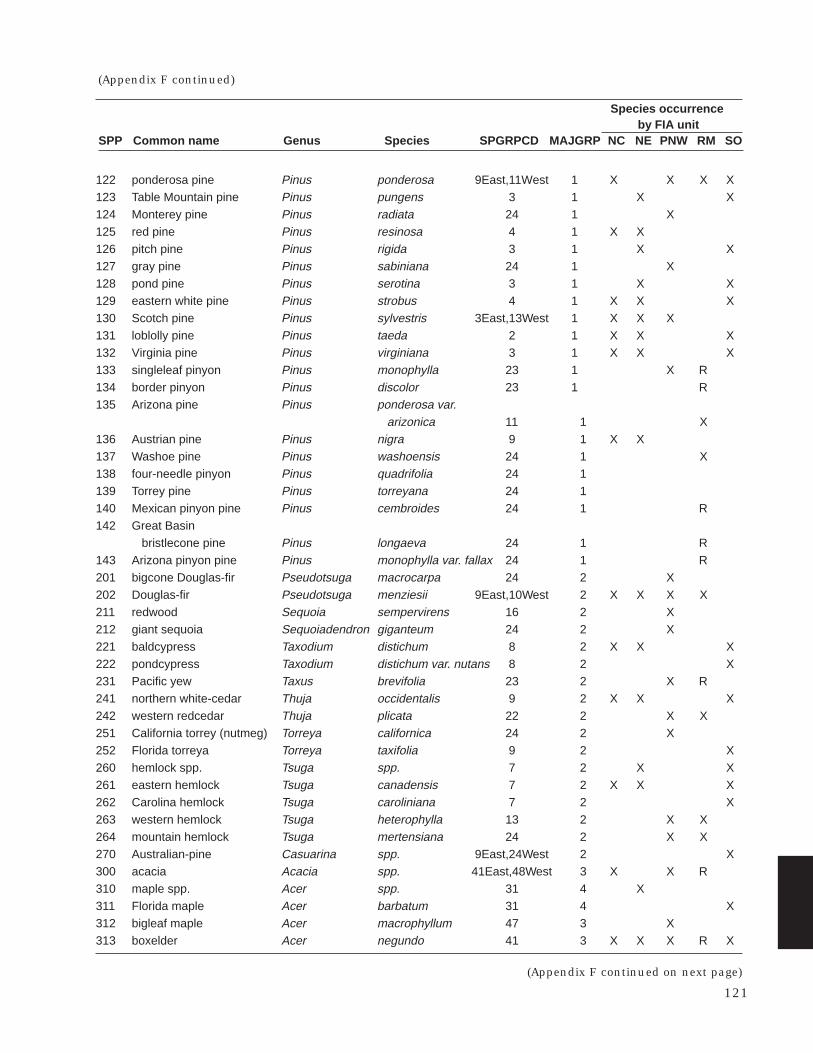
Species occurrenceby FIA unit
SPP Common name Genus Species SPGRPCD MAJGRP NC NE PNW RM SO
122 ponderosa pine Pinus ponderosa 9East,11West 1 X X X X123 Table Mountain pine Pinus pungens 3 1 X X124 Monterey pine Pinus radiata 24 1 X125 red pine Pinus resinosa 4 1 X X126 pitch pine Pinus rigida 3 1 X X127 gray pine Pinus sabiniana 24 1 X128 pond pine Pinus serotina 3 1 X X129 eastern white pine Pinus strobus 4 1 X X X130 Scotch pine Pinus sylvestris 3East,13West 1 X X X131 loblolly pine Pinus taeda 2 1 X X X132 Virginia pine Pinus virginiana 3 1 X X X133 singleleaf pinyon Pinus monophylla 23 1 X R134 border pinyon Pinus discolor 23 1 R135 Arizona pine Pinus ponderosa var.
arizonica 11 1 X136 Austrian pine Pinus nigra 9 1 X X137 Washoe pine Pinus washoensis 24 1 X138 four-needle pinyon Pinus quadrifolia 24 1139 Torrey pine Pinus torreyana 24 1140 Mexican pinyon pine Pinus cembroides 24 1 R142 Great Basin
bristlecone pine Pinus longaeva 24 1 R143 Arizona pinyon pine Pinus monophylla var. fallax 24 1 R201 bigcone Douglas-fir Pseudotsuga macrocarpa 24 2 X202 Douglas-fir Pseudotsuga menziesii 9East,10West 2 X X X X211 redwood Sequoia sempervirens 16 2 X212 giant sequoia Sequoiadendron giganteum 24 2 X221 baldcypress Taxodium distichum 8 2 X X X222 pondcypress Taxodium distichum var. nutans 8 2 X231 Pacific yew Taxus brevifolia 23 2 X R241 northern white-cedar Thuja occidentalis 9 2 X X X242 western redcedar Thuja plicata 22 2 X X251 California torrey (nutmeg) Torreya californica 24 2 X252 Florida torreya Torreya taxifolia 9 2 X260 hemlock spp. Tsuga spp. 7 2 X X261 eastern hemlock Tsuga canadensis 7 2 X X X262 Carolina hemlock Tsuga caroliniana 7 2 X263 western hemlock Tsuga heterophylla 13 2 X X264 mountain hemlock Tsuga mertensiana 24 2 X X270 Australian-pine Casuarina spp. 9East,24West 2 X300 acacia Acacia spp. 41East,48West 3 X X R310 maple spp. Acer spp. 31 4 X311 Florida maple Acer barbatum 31 4 X312 bigleaf maple Acer macrophyllum 47 3 X313 boxelder Acer negundo 41 3 X X X R X
(Appendix F continued on next page)
(Appendix F continued)
121
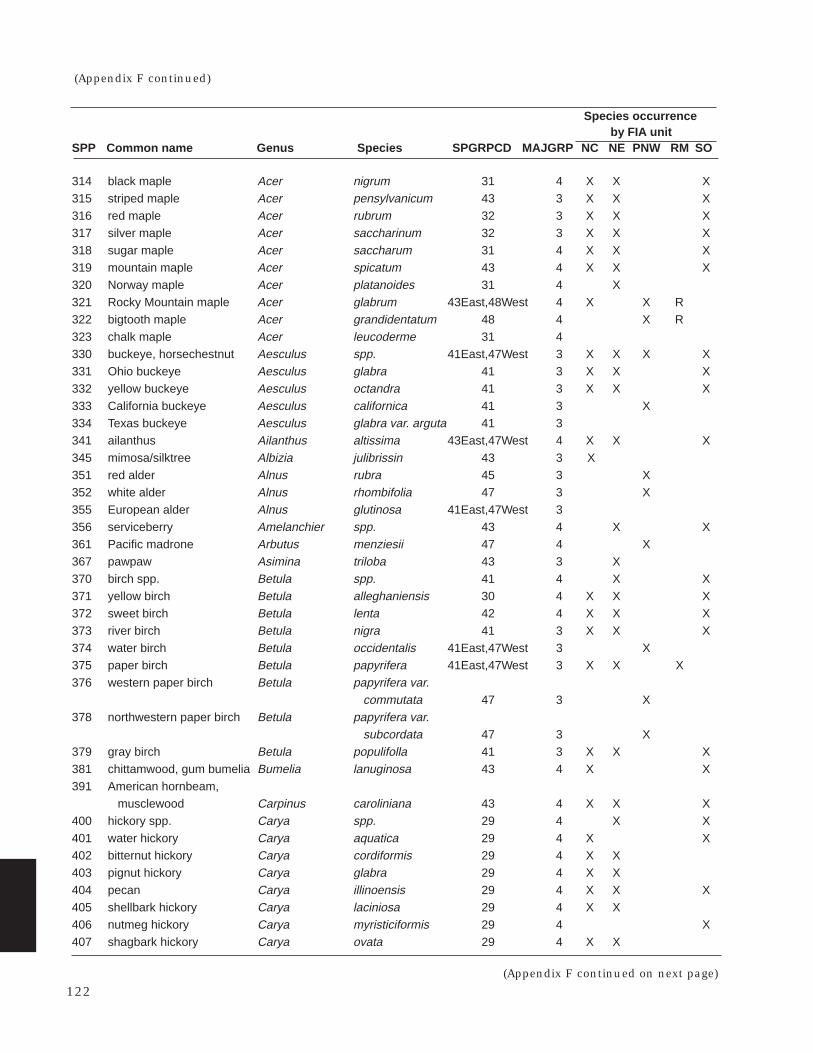
Species occurrenceby FIA unit
SPP Common name Genus Species SPGRPCD MAJGRP NC NE PNW RM SO
314 black maple Acer nigrum 31 4 X X X315 striped maple Acer pensylvanicum 43 3 X X X316 red maple Acer rubrum 32 3 X X X317 silver maple Acer saccharinum 32 3 X X X318 sugar maple Acer saccharum 31 4 X X X319 mountain maple Acer spicatum 43 4 X X X320 Norway maple Acer platanoides 31 4 X321 Rocky Mountain maple Acer glabrum 43East,48West 4 X X R322 bigtooth maple Acer grandidentatum 48 4 X R323 chalk maple Acer leucoderme 31 4330 buckeye, horsechestnut Aesculus spp. 41East,47West 3 X X X X331 Ohio buckeye Aesculus glabra 41 3 X X X332 yellow buckeye Aesculus octandra 41 3 X X X333 California buckeye Aesculus californica 41 3 X334 Texas buckeye Aesculus glabra var. arguta 41 3341 ailanthus Ailanthus altissima 43East,47West 4 X X X345 mimosa/silktree Albizia julibrissin 43 3 X351 red alder Alnus rubra 45 3 X352 white alder Alnus rhombifolia 47 3 X355 European alder Alnus glutinosa 41East,47West 3356 serviceberry Amelanchier spp. 43 4 X X361 Pacific madrone Arbutus menziesii 47 4 X367 pawpaw Asimina triloba 43 3 X370 birch spp. Betula spp. 41 4 X X371 yellow birch Betula alleghaniensis 30 4 X X X372 sweet birch Betula lenta 42 4 X X X373 river birch Betula nigra 41 3 X X X374 water birch Betula occidentalis 41East,47West 3 X375 paper birch Betula papyrifera 41East,47West 3 X X X376 western paper birch Betula papyrifera var.
commutata 47 3 X378 northwestern paper birch Betula papyrifera var.
subcordata 47 3 X379 gray birch Betula populifolla 41 3 X X X381 chittamwood, gum bumelia Bumelia lanuginosa 43 4 X X391 American hornbeam,
musclewood Carpinus caroliniana 43 4 X X X400 hickory spp. Carya spp. 29 4 X X401 water hickory Carya aquatica 29 4 X X402 bitternut hickory Carya cordiformis 29 4 X X403 pignut hickory Carya glabra 29 4 X X404 pecan Carya illinoensis 29 4 X X X405 shellbark hickory Carya laciniosa 29 4 X X406 nutmeg hickory Carya myristiciformis 29 4 X407 shagbark hickory Carya ovata 29 4 X X
(Appendix F continued on next page)
(Appendix F continued)
122
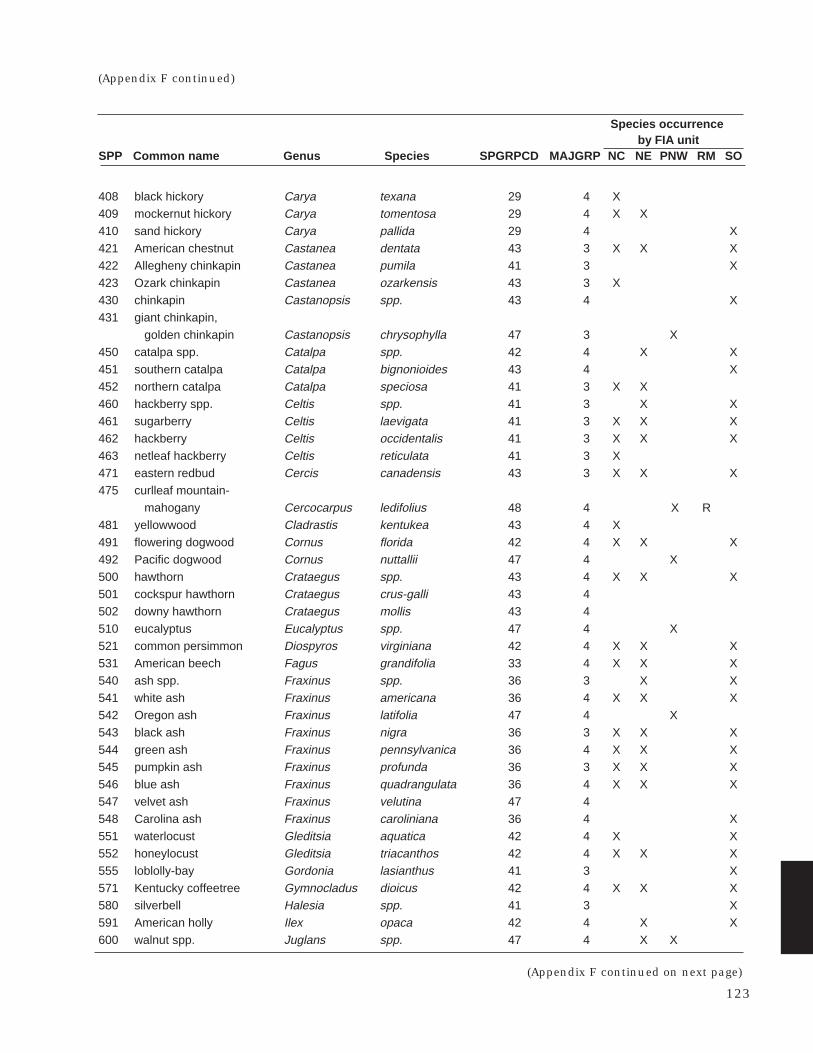
Species occurrenceby FIA unit
SPP Common name Genus Species SPGRPCD MAJGRP NC NE PNW RM SO
408 black hickory Carya texana 29 4 X409 mockernut hickory Carya tomentosa 29 4 X X410 sand hickory Carya pallida 29 4 X421 American chestnut Castanea dentata 43 3 X X X422 Allegheny chinkapin Castanea pumila 41 3 X423 Ozark chinkapin Castanea ozarkensis 43 3 X430 chinkapin Castanopsis spp. 43 4 X431 giant chinkapin,
golden chinkapin Castanopsis chrysophylla 47 3 X450 catalpa spp. Catalpa spp. 42 4 X X451 southern catalpa Catalpa bignonioides 43 4 X452 northern catalpa Catalpa speciosa 41 3 X X460 hackberry spp. Celtis spp. 41 3 X X461 sugarberry Celtis laevigata 41 3 X X X462 hackberry Celtis occidentalis 41 3 X X X463 netleaf hackberry Celtis reticulata 41 3 X471 eastern redbud Cercis canadensis 43 3 X X X475 curlleaf mountain-
mahogany Cercocarpus ledifolius 48 4 X R481 yellowwood Cladrastis kentukea 43 4 X491 flowering dogwood Cornus florida 42 4 X X X492 Pacific dogwood Cornus nuttallii 47 4 X500 hawthorn Crataegus spp. 43 4 X X X501 cockspur hawthorn Crataegus crus-galli 43 4502 downy hawthorn Crataegus mollis 43 4510 eucalyptus Eucalyptus spp. 47 4 X521 common persimmon Diospyros virginiana 42 4 X X X531 American beech Fagus grandifolia 33 4 X X X540 ash spp. Fraxinus spp. 36 3 X X541 white ash Fraxinus americana 36 4 X X X542 Oregon ash Fraxinus latifolia 47 4 X543 black ash Fraxinus nigra 36 3 X X X544 green ash Fraxinus pennsylvanica 36 4 X X X545 pumpkin ash Fraxinus profunda 36 3 X X X546 blue ash Fraxinus quadrangulata 36 4 X X X547 velvet ash Fraxinus velutina 47 4548 Carolina ash Fraxinus caroliniana 36 4 X551 waterlocust Gleditsia aquatica 42 4 X X552 honeylocust Gleditsia triacanthos 42 4 X X X555 loblolly-bay Gordonia lasianthus 41 3 X571 Kentucky coffeetree Gymnocladus dioicus 42 4 X X X580 silverbell Halesia spp. 41 3 X591 American holly Ilex opaca 42 4 X X600 walnut spp. Juglans spp. 47 4 X X
(Appendix F continued on next page)
(Appendix F continued)
123

Species occurrenceby FIA unit
SPP Common name Genus Species SPGRPCD MAJGRP NC NE PNW RM SO
601 butternut Juglans cinerea 41 3 X X X602 black walnut Juglans nigra 40 4 X X X603 California black walnut Juglans hindsii 47 4604 southern California
black walnut Juglans californica 47 4605 Texas walnut Juglans microcarpa 41East,47West 4611 sweetgum Liquidambar styraciflua 34 3 X X X621 yellow-poplar Liriodendron tulipifera 39 3 X X X631 tanoak Lithocarpus densiflorus 47 4 X641 Osage-orange Maclura pomifera 43 4 X X X650 magnolia spp. Magnolia spp. 41 3 X651 cucumbertree Magnolia acuminata 41 3 X X X652 southern magnolia Magnolia grandiflora 41 3 X653 sweetbay Magnolia virginiana 41 3 X X654 bigleaf magnolia Magnolia macrophylla 43 4 X655 mountain magnolia Magnolia fraseri 41 3 X660 apple spp. Malus spp. 43 4 X X X X661 Oregon crab apple Malus fusca 47 4680 mulberry spp. Morus spp. 42 4 X X681 white mulberry Morus alba 42 4 X X X682 red mulberry Morus rubra 42 4 X X X691 water tupelo Nyssa aquatica 35 3 X X692 Ogeechee tupelo Nyssa ogeche 43 4 X693 blackgum Nyssa sylvatica 35 3 X X X694 swamp tupelo Nyssa sylvatica var. biflora 35 3 X X X701 eastern hophornbeam Ostrya virginiana 43 4 X X X711 sourwood Oxydendrum arboreum 43 4 X X712 paulownia, empress-tree Paulownia tomentosa 41 3 X X721 redbay Persea borbonia 41 3 X722 water-elm, planertree Planera aquatica 43 3 X730 California sycamore Platanus racemosa 47 3 X731 sycamore Platanus occidentallis 41 3 X X X740 cottonwood and poplar spp. Populus spp. 37East,44West 3 X X X741 balsam poplar Populus balsamifera 37East,44West 3 X X X742 eastern cottonwood Populus deltoides 37 3 X X X743 bigtooth aspen Populus grandidentata 37 3 X X744 swamp cottonwood Populus heterophylla 37 3 X X745 plains cottonwood Populus deltoides spp.
monilifera 37East,44West 3 X X746 quaking aspen Populus tremuloides 37East,44West 3 X X X X747 black cottonwood Populus trichocarpa 37East,44West 4 X X748 Fremont cottonwood, Populus fremontii, deltoides
Rio Grande cottonwood spp. wislizeni 37East,44West 4 X X749 narrowleaf cottonwood Populus angustifolia 37East,44West 3 X X752 silver poplar Populus alba 37 3 X
(Appendix F continued on next page)
(Appendix F continued)
124
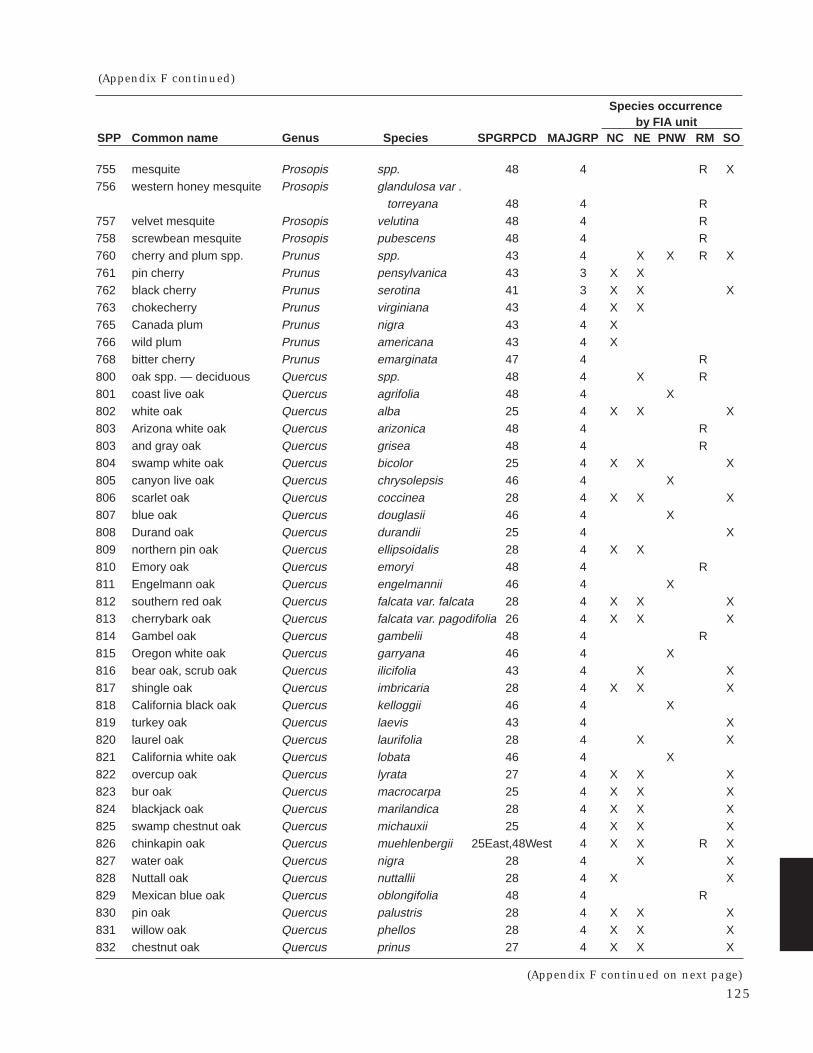
Species occurrenceby FIA unit
SPP Common name Genus Species SPGRPCD MAJGRP NC NE PNW RM SO
755 mesquite Prosopis spp. 48 4 R X756 western honey mesquite Prosopis glandulosa var .
torreyana 48 4 R757 velvet mesquite Prosopis velutina 48 4 R758 screwbean mesquite Prosopis pubescens 48 4 R760 cherry and plum spp. Prunus spp. 43 4 X X R X761 pin cherry Prunus pensylvanica 43 3 X X762 black cherry Prunus serotina 41 3 X X X763 chokecherry Prunus virginiana 43 4 X X765 Canada plum Prunus nigra 43 4 X766 wild plum Prunus americana 43 4 X768 bitter cherry Prunus emarginata 47 4 R800 oak spp. — deciduous Quercus spp. 48 4 X R801 coast live oak Quercus agrifolia 48 4 X802 white oak Quercus alba 25 4 X X X803 Arizona white oak Quercus arizonica 48 4 R803 and gray oak Quercus grisea 48 4 R804 swamp white oak Quercus bicolor 25 4 X X X805 canyon live oak Quercus chrysolepsis 46 4 X806 scarlet oak Quercus coccinea 28 4 X X X807 blue oak Quercus douglasii 46 4 X808 Durand oak Quercus durandii 25 4 X809 northern pin oak Quercus ellipsoidalis 28 4 X X810 Emory oak Quercus emoryi 48 4 R811 Engelmann oak Quercus engelmannii 46 4 X812 southern red oak Quercus falcata var. falcata 28 4 X X X813 cherrybark oak Quercus falcata var. pagodifolia 26 4 X X X814 Gambel oak Quercus gambelii 48 4 R815 Oregon white oak Quercus garryana 46 4 X816 bear oak, scrub oak Quercus ilicifolia 43 4 X X817 shingle oak Quercus imbricaria 28 4 X X X818 California black oak Quercus kelloggii 46 4 X819 turkey oak Quercus laevis 43 4 X820 laurel oak Quercus laurifolia 28 4 X X821 California white oak Quercus lobata 46 4 X822 overcup oak Quercus lyrata 27 4 X X X823 bur oak Quercus macrocarpa 25 4 X X X824 blackjack oak Quercus marilandica 28 4 X X X825 swamp chestnut oak Quercus michauxii 25 4 X X X826 chinkapin oak Quercus muehlenbergii 25East,48West 4 X X R X827 water oak Quercus nigra 28 4 X X828 Nuttall oak Quercus nuttallii 28 4 X X829 Mexican blue oak Quercus oblongifolia 48 4 R830 pin oak Quercus palustris 28 4 X X X831 willow oak Quercus phellos 28 4 X X X832 chestnut oak Quercus prinus 27 4 X X X
(Appendix F continued on next page)
(Appendix F continued)
125
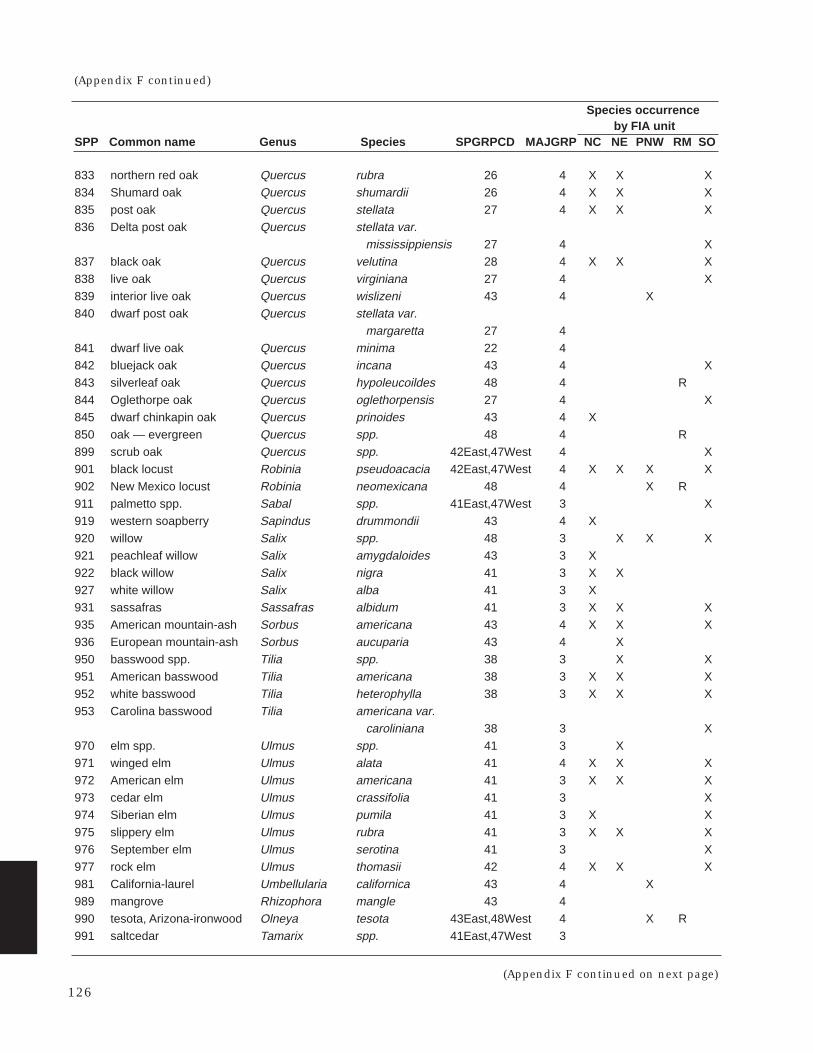
Species occurrenceby FIA unit
SPP Common name Genus Species SPGRPCD MAJGRP NC NE PNW RM SO
833 northern red oak Quercus rubra 26 4 X X X834 Shumard oak Quercus shumardii 26 4 X X X835 post oak Quercus stellata 27 4 X X X836 Delta post oak Quercus stellata var.
mississippiensis 27 4 X837 black oak Quercus velutina 28 4 X X X838 live oak Quercus virginiana 27 4 X839 interior live oak Quercus wislizeni 43 4 X840 dwarf post oak Quercus stellata var.
margaretta 27 4841 dwarf live oak Quercus minima 22 4842 bluejack oak Quercus incana 43 4 X843 silverleaf oak Quercus hypoleucoildes 48 4 R844 Oglethorpe oak Quercus oglethorpensis 27 4 X845 dwarf chinkapin oak Quercus prinoides 43 4 X850 oak — evergreen Quercus spp. 48 4 R899 scrub oak Quercus spp. 42East,47West 4 X901 black locust Robinia pseudoacacia 42East,47West 4 X X X X902 New Mexico locust Robinia neomexicana 48 4 X R911 palmetto spp. Sabal spp. 41East,47West 3 X919 western soapberry Sapindus drummondii 43 4 X920 willow Salix spp. 48 3 X X X921 peachleaf willow Salix amygdaloides 43 3 X922 black willow Salix nigra 41 3 X X927 white willow Salix alba 41 3 X931 sassafras Sassafras albidum 41 3 X X X935 American mountain-ash Sorbus americana 43 4 X X X936 European mountain-ash Sorbus aucuparia 43 4 X950 basswood spp. Tilia spp. 38 3 X X951 American basswood Tilia americana 38 3 X X X952 white basswood Tilia heterophylla 38 3 X X X953 Carolina basswood Tilia americana var.
caroliniana 38 3 X970 elm spp. Ulmus spp. 41 3 X971 winged elm Ulmus alata 41 4 X X X972 American elm Ulmus americana 41 3 X X X973 cedar elm Ulmus crassifolia 41 3 X974 Siberian elm Ulmus pumila 41 3 X X975 slippery elm Ulmus rubra 41 3 X X X976 September elm Ulmus serotina 41 3 X977 rock elm Ulmus thomasii 42 4 X X X981 California-laurel Umbellularia californica 43 4 X989 mangrove Rhizophora mangle 43 4990 tesota, Arizona-ironwood Olneya tesota 43East,48West 4 X R991 saltcedar Tamarix spp. 41East,47West 3
(Appendix F continued on next page)
(Appendix F continued)
126
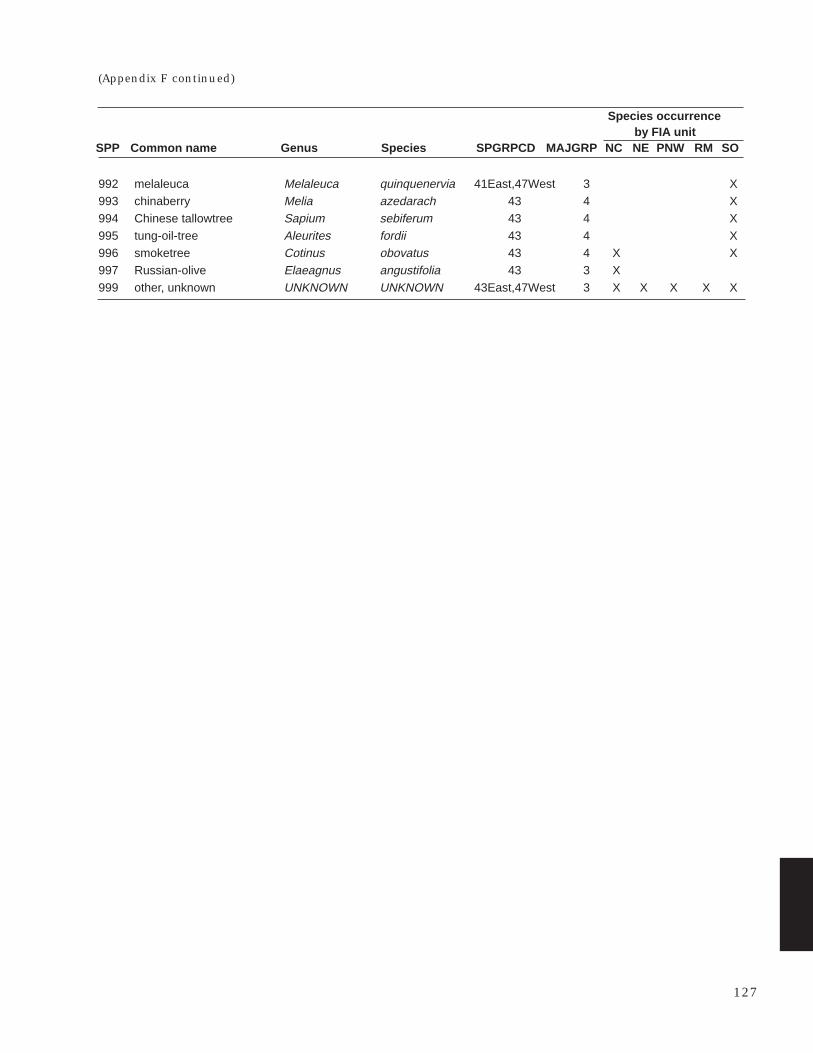
Species occurrenceby FIA unit
SPP Common name Genus Species SPGRPCD MAJGRP NC NE PNW RM SO
992 melaleuca Melaleuca quinquenervia 41East,47West 3 X993 chinaberry Melia azedarach 43 4 X994 Chinese tallowtree Sapium sebiferum 43 4 X995 tung-oil-tree Aleurites fordii 43 4 X996 smoketree Cotinus obovatus 43 4 X X997 Russian-olive Elaeagnus angustifolia 43 3 X999 other, unknown UNKNOWN UNKNOWN 43East,47West 3 X X X X X
(Appendix F continued)
127

128
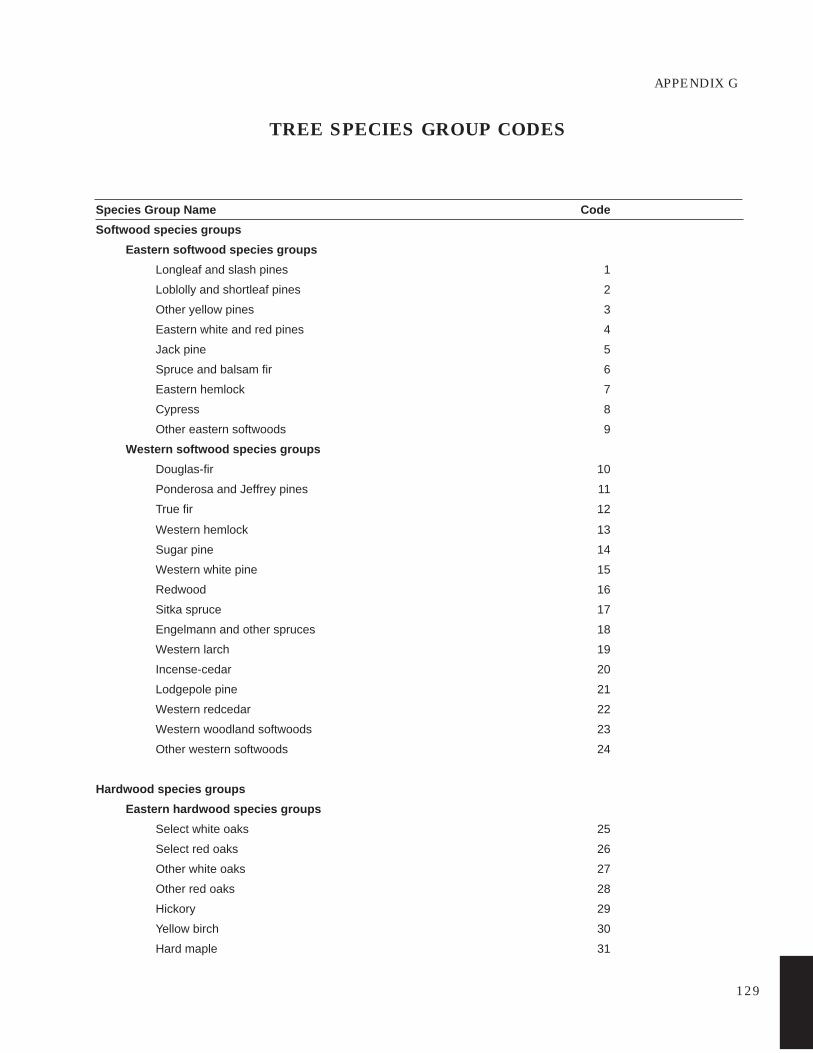
APPENDIX G
TREE SPECIES GROUP CODES
Species Group Name Code
Softwood species groups
Eastern softwood species groups
Longleaf and slash pines 1
Loblolly and shortleaf pines 2
Other yellow pines 3
Eastern white and red pines 4
Jack pine 5
Spruce and balsam fir 6
Eastern hemlock 7
Cypress 8
Other eastern softwoods 9
Western softwood species groups
Douglas-fir 10
Ponderosa and Jeffrey pines 11
True fir 12
Western hemlock 13
Sugar pine 14
Western white pine 15
Redwood 16
Sitka spruce 17
Engelmann and other spruces 18
Western larch 19
Incense-cedar 20
Lodgepole pine 21
Western redcedar 22
Western woodland softwoods 23
Other western softwoods 24
Hardwood species groups
Eastern hardwood species groups
Select white oaks 25
Select red oaks 26
Other white oaks 27
Other red oaks 28
Hickory 29
Yellow birch 30
Hard maple 31
129
130
Soft maple 32
Beech 33
Sweetgum 34
Tupelo and blackgum 35
Ash 36
Cottonwood and aspen 37
Basswood 38
Yellow-poplar 39
Black walnut 40
Other eastern soft hardwoods 41
Other eastern hard hardwoods 42
Eastern noncommercial hardwoods 43
Western hardwood species groups
Cottonwood and aspen 44
Red alder 45
Oak 46
Other western hardwoods 47
Western woodland hardwoods 48
Miles, Patrick D.; Brand, Gary J.; Alerich, Carol L.; Bednar, Larry F.;Woudenberg, Sharon W.; Glover, Joseph F.; Ezzell, Edward N. 2001. The forest inventory and analysis database: database description and users manual version 1.0. Gen. Tech. Rep. NC-218. St. Paul, MN: U.S. Department of Agriculture, Forest Service, North Central Research Station. 130 p.
Describes the structure of the Forest Inventory and Analysis Data-base (FIADB) and provides information on generating estimates of foreststatistics from these data. The FIADB structure provides a consistentframework for storing forest inventory data across all ownerships acrossthe entire United States. These data are available to the public.
KEY WORDS: Plot measurements, inventory methods, data processing,data management, information management systems.